accident prone: malfunctions and "abnorma“ emission events
15
Emission Event at Texas Petrochemical’s Houston Plant Photo Credit: Blas Espinosa ACCIDENT PRONE: Malfunctions and “Abnormal” Emission Events at Refineries, Chemical Plants, and Natural Gas Facilities in Texas, 2009-2011 July 18, 2012
Transcript of accident prone: malfunctions and "abnorma“ emission events

Emission Event at Texas Petrochemical’s Houston Plant Photo Credit: Blas Espinosa
ACCIDENT PRONE:
Malfunctions and “Abnormal” Emission Events at Refineries, Chemical Plants, and Natural Gas Facilities in Texas, 2009-2011
July 18, 2012

1
Introduction: Every year, refineries, chemical plants, and natural gas facilities release thousands of tons of air pollution when production units break down, or are shut off, restarted or repaired. Most of these “emission events” release pollution through flares, leaking pipelines, tanks, or other production equipment. Information obtained from the Texas Commission on Environmental Quality (TCEQ) for the last three years shows just how significant that pollution can be. Between 2009 and 2011, emission events at chemical plants, refineries, and natural gas operations released a combined total of more than 42,000 tons of sulfur dioxide and just over 50,000 tons of smog- forming Volatile Organic Compounds (VOCs), according to industry reports filed with TCEQ. See Table 1. These releases are in addition to the amounts released year-round during so-called “normal operations,” and are usually not included in the data the government uses to establish and enforce regulations, or to estimate their health impacts. Natural gas operations — which include, well heads, pipelines, compressors, boosters, and storage systems — accounted for more than 85% of total sulfur dioxide and nearly 80% of the VOCs released during these episodes. Both pollutants are linked to asthma attacks and other respiratory ailments, and can form fine particles that contribute to premature death from heart disease.
Table 1: SO2 and VOC Emissions Reported to the TCEQ Emissions Event Database between 2009 and 2011.
Sector SO2 (Tons) VOCs (Tons) Natural Gas 36,894.0 38,688.2 Refinery 5,721.1 7,148.0 Chemical 92.8 4,203.4
The emission events reported in 2010 accounted for about 15% of the VOCs and sulfur dioxide released in that year by all three sectors combined (the total emission inventory for 2011 is not yet available). But their actual share, especially for VOCs, is much higher. Because pollution released during upsets is almost never monitored, reports are based on estimates that can understate actual releases by an order of magnitude or more. The short-term impact of these events can also be substantial. Upsets or sudden shutdowns can release large plumes of sulfur dioxide or toxic chemicals in just a few hours, exposing downwind communities to peak levels of pollution that are much more likely to trigger asthma attacks and other respiratory systems. The working class and minority populations typical of neighborhoods near refineries and chemical plants bear the brunt of this pollution.
ACCIDENT PRONE: Malfunctions and “Abnormal” Emission Events at Refineries, Chemical Plants, and Natural Gas Facilities in Texas, 2009-2011

2
Numbers at a Glance:
Sulfur Dioxide: Top Five Releases from Emission Events
Emission events at the Keystone gas plant between 2009 and 2011 released nearly 11,000 tons of sulfur dioxide, more than any other plant, due largely to breakdowns in its sulfur recovery unit. The Valero Port Arthur refinery reported releasing almost 2,500 tons of sulfur dioxide from flares in 2011, after discovering higher than expected sulfur in gas routed to flares from a hydrocracking unit. Five plants accounted for about 40 percent of the sulfur dioxide released during emission events over the three- year period. See Table 2. The 20 largest emitters can be found in Attachment A, and the full list of facilities releasing sulfur dioxide during emission events is located the Appendix. Table 2: Facilities Releasing the Most Sulfur Dioxide During Emission Events (2009-2011)
Facility Name SO2 Emitted (Tons) 2009 2010 2011 Total
KEYSTONE GAS PLANT 379.3 670.4 10,026.5 11,076.3 VALERO PORT ARTHUR REFINERY 56.7 34.2 2,477.6 2,568.6 GOLDSMITH GAS PLANT 1,001.9 290.8 878.7 2,171.4 MALLET CO2 RECOVERY PLANT 359.4 750.9 620.0 1,730.3 SLAUGHTER GASOLINE PLANT 38.5 1,321.5 177.5 1,537.6
VOC Emissions: Top Five Releases from Emission Events
Magellan reported releasing more than 16,000 tons of VOCs in 2011 due to a “split longitudinal seam” in a Galveston County pipeline. The emissions came from vacuum trucks, “frac tanks,” and pipeline purging between February 24 and March 9, 2011, according to Magellan, and included 30,000 pounds of benzene, a known carcinogen. ExxonMobil’s Beaumont refinery released nearly 3,400 tons of VOCs when heat exchangers at its alkylation unit leaked over a two week period in 2010. The five plants below released nearly half the total from the three sectors included in this study. See Table 3. The 20 largest sources of VOCs can be found in Attachment B and the full list of facilities by sector is located in the Appendix. Table 3: Facilities Releasing the Most VOCs During Emission Events (Tons)
Facility Name VOCs Emitted (Tons) 2009 2010 2011 Total
MAGELLAN PIPELINE COMPANY LP PIPELINE GALVESTON COUNTY
- - 15,974.7 15,974.7
EXXONMOBIL BEAUMONT REFINERY 144.1 3,357.7 62.8 3,564.6 EL MAR 12 1,717.4 30.4 77.49 1,825.31 BOYD COMPRESSOR STATION 441.2 379.2 385.6 1,176.1 FALCON REFINERY - 1,051.0 - 1,051.0
Frequency of Emission Events

3
Petrochemical manufacturing and natural gas production is technically challenging and will never be risk free; even the best managed plants may experience an occasional upset despite taking reasonable precautions. But malfunctions are too frequent at some facilities, and can indicate poor maintenance practices, understaffed plants, and the failure to invest in modern pollution control equipment, such as flare gas recovery systems that can capture and reuse gases that would otherwise be released to the air as pollution. A major malfunction can release pollution for weeks and even months, and some large plants report dozens of these incidents every year. The five facilities in the chemical, gas, and refining sectors reporting the most emission events had one or more per week, on average. See Table 4 below.
Table 4: Facilities with the Most Emission Events
Plant Name Sector Average Number of Events Per Year (2009-2011)
Waha Gas Plant Natural Gas 94 Formosa Point Comfort Plant Chemical 80 Tilden Gas Plant Natural Gas 76 Goldsmith Gas Plant Natural Gas 72 Alcoa Lavaca Bay Chemical 71
Leaks, power outages, and trips are a frequent cause of upsets at refineries and chemical plants. At natural gas operations, the shut-in of a major facility for repairs will cut off upstream storage tanks and other satellite operations, backing up gas that is vented or flared from those upstream stations until the connection is restored. EPA enforcement actions have helped to reduce sulfur dioxide emissions from most (but not all) Texas refineries over the past decade, by requiring companies to evaluate and fix the “root causes” of repeated malfunctions. More recent EPA settlements with Marathon Oil and the BP Whiting refinery require additional measures to reduce the frequency and severity of upsets, while improving the efficiency and safe operation of flaring devices that remain in use for emergencies.1 But these actions will have a limited impact on the industry at large, because EPA and state agencies have made it too easy for plant operators to disclaim responsibility for emission events. The Clean Air Act makes polluters strictly liable for their mistakes, but loopholes in regulations either excuse violations that result from malfunctions altogether, or allow polluters to escape penalties by claiming that such mishaps are beyond the control of plant operators. As a result, federal or state agencies rarely even investigate these events, much less take enforcement action. EPA’s current standards are so relaxed that even the most serious violations are excused, inviting plant operators to defer improvements that could make plants safer — and sometimes even turn a profit.
What Should Be Done?
4
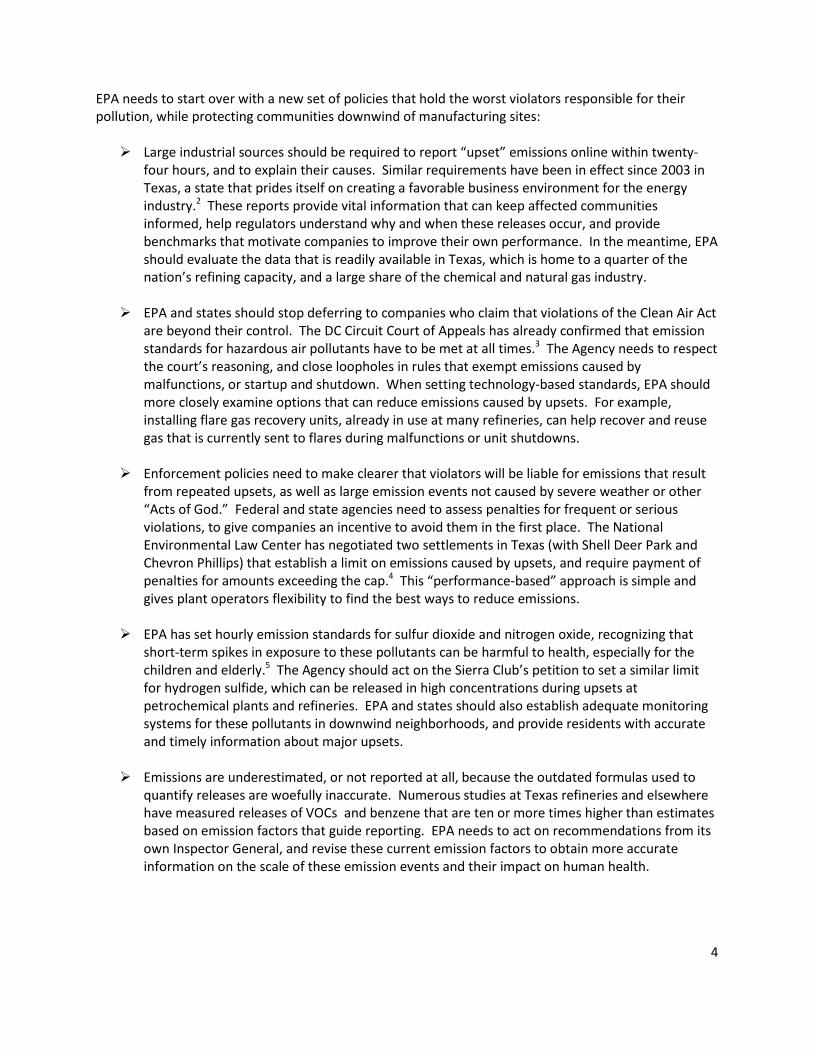
EPA needs to start over with a new set of policies that hold the worst violators responsible for their pollution, while protecting communities downwind of manufacturing sites: Large industrial sources should be required to report “upset” emissions online within twenty-
four hours, and to explain their causes. Similar requirements have been in effect since 2003 in Texas, a state that prides itself on creating a favorable business environment for the energy industry.2 These reports provide vital information that can keep affected communities informed, help regulators understand why and when these releases occur, and provide benchmarks that motivate companies to improve their own performance. In the meantime, EPA should evaluate the data that is readily available in Texas, which is home to a quarter of the nation’s refining capacity, and a large share of the chemical and natural gas industry.
EPA and states should stop deferring to companies who claim that violations of the Clean Air Act
are beyond their control. The DC Circuit Court of Appeals has already confirmed that emission standards for hazardous air pollutants have to be met at all times.3 The Agency needs to respect the court’s reasoning, and close loopholes in rules that exempt emissions caused by malfunctions, or startup and shutdown. When setting technology-based standards, EPA should more closely examine options that can reduce emissions caused by upsets. For example, installing flare gas recovery units, already in use at many refineries, can help recover and reuse gas that is currently sent to flares during malfunctions or unit shutdowns.
Enforcement policies need to make clearer that violators will be liable for emissions that result
from repeated upsets, as well as large emission events not caused by severe weather or other “Acts of God.” Federal and state agencies need to assess penalties for frequent or serious violations, to give companies an incentive to avoid them in the first place. The National Environmental Law Center has negotiated two settlements in Texas (with Shell Deer Park and Chevron Phillips) that establish a limit on emissions caused by upsets, and require payment of penalties for amounts exceeding the cap.4 This “performance-based” approach is simple and gives plant operators flexibility to find the best ways to reduce emissions.
EPA has set hourly emission standards for sulfur dioxide and nitrogen oxide, recognizing that
short-term spikes in exposure to these pollutants can be harmful to health, especially for the children and elderly.5 The Agency should act on the Sierra Club’s petition to set a similar limit for hydrogen sulfide, which can be released in high concentrations during upsets at petrochemical plants and refineries. EPA and states should also establish adequate monitoring systems for these pollutants in downwind neighborhoods, and provide residents with accurate and timely information about major upsets.
Emissions are underestimated, or not reported at all, because the outdated formulas used to
quantify releases are woefully inaccurate. Numerous studies at Texas refineries and elsewhere have measured releases of VOCs and benzene that are ten or more times higher than estimates based on emission factors that guide reporting. EPA needs to act on recommendations from its own Inspector General, and revise these current emission factors to obtain more accurate information on the scale of these emission events and their impact on human health.

5
About the Data: Texas facilities have been required to submit online reports estimating emissions caused by upsets, maintenance, startup and shutdown activities since 2003, along with an explanation of what caused the events. The data in the tables above and in the attachments was obtained from TCEQ’s Emissions Event database.6 The industry classifications were determined using the facility’s SIC or NAICS code, as reported to the TCEQ central registry and EPA’s Facility Registration System.7 When industry classification information was unavailable, the data was supplemented using other information on TCEQ’s central registry. A handful of plants reported only “natural gas” emissions, which may include non-reactive gases like methane or ethane that are not classified as VOCs. In such cases, EIP adjusted the emissions data to include only the estimated VOC component of those releases, based on a study used by EPA to evaluate the recently proposed oil and natural gas New Source Performance Standards.8 The appendix also identifies reported releases of hazardous air pollutants (chemicals known to cause cancer or other serious health effects). But this data is incomplete because many facilities report only aggregate releases of VOCs, and do not provide a breakdown of hazardous components like benzene or hexanes that are commonly released from flares or vents. The emissions analyzed in our report include releases from natural gas boosters, compressors, and processors, and from “tank batteries” (a collection of tanks) and other storage systems. It is not clear how much of this pollution is related to the hydrofracturing of shale containing gas deposits. The state of Texas has estimated that fracking operations in the 23-county Bartlett shale region released more than 21,000 tons VOCs in 2009, but does not distinguish between releases from normal operations and the kind of emission events analyzed in this report.
Analysis: Leaks, Faulty Compressors, Power Outages and Pipeline Failures
Leaks, tripped compressors, and power outages are cited most frequently as the cause of emission events reported by refiners and chemical plants. Natural gas operations cite similar reasons, along with pipeline leaks or repairs that can release significant volumes of VOCs. A breakdown or repair at a large gas plant can also have a ripple effect that requires flaring or venting from the upstream units that gather, store and feed gas to that plant. Texas law requires online reporting of the root cause for any emission events, but there are no clear standards to assure the accuracy or quality of these reports. As a result, the description of some events is so cryptic that it is impossible to determine what really happened. Refinery Sector: Leaks: Between 2009 and 2011, leaky equipment at refineries caused or contributed to over 5,000 tons of sulfur dioxide and VOC emissions. Leaks are often not discovered until weeks after they begin, and may continue for extended periods until repairs are completed. In many cases, emissions from leaky equipment could be eliminated, or at least significantly reduced, with more frequent monitoring and repair, as well as investment in improved technology such as leakless valves and flanges.

6
Compressors:
Compressors are common components at a refinery, and are used to move product through the refinery or to recover gas from process units for recycling or reuse as energy. Texas refineries reported that these units broke down almost 150 times between 2009 and 2011, releasing more than 800 tons of sulfur dioxide because gas had to be routed to flares until the compressors could be restored to service. Compressors malfunction frequently enough at several refineries to warrant more serious EPA or state investigation to determine whether faulty units need to be replaced with more effective technology. Power Loss:
Power outages at refineries released another 1300 tons of sulfur dioxide and VOCs between 2009 and 2011. Sometimes, these outages were caused by inclement weather or problems with a third party power provider, and other times by problems with the refinery’s own power source. Refineries in California are required to develop flare minimization plans and set protocols for the staged shutdown and startup of a refinery following a malfunction or blackout.9 This requirement can significantly reduce emissions caused by blackouts, in part by better defining procedures to minimize releases during startup, shutdown, and maintenance. More widespread adoption of these requirements would likely improve air quality in and around refinery communities. Natural Gas Sector:
The natural gas sector includes interconnected operations that collect natural gas from wellheads, then route it to processing, storage or transportation facilities. A significant breakdown at a large processing facility can create bottlenecks that require the venting or flaring of gas at collection or storage units upstream. For example, the Goldsmith Gas Plant, owned and operated by DCP Midstream, is part of the company’s WestTex natural gas gathering system. This gathering system is connected to at least 45 other facilities that may experience upset events whenever there is a problem at the Goldsmith Plant. An April, 2011 shut down for maintenance triggered the release of 43 tons from the Goldsmith plant – but more than 500 more tons of VOCs were emitted from at least 40 other units, including tank batteries, deep storage systems or boosters that feed the Goldsmith plant. Gas continues to accumulate throughout the gathering system even when a large processor like Goldsmith is shut down, and is flared or vented to keep from overwhelming storage capacity until the connection can be restored. Currently, state and federal regulations do not consider the system-wide impacts of malfunctions or maintenance activities at individual facilities, and EPA does not review the data that is available. As a result, it is impossible for EPA to accurately assess the cost and benefits of reducing these types of emissions events. For example, EPA’s final oil and gas production rule, signed on April 17, 2012, imposed no new limits on sulfur dioxide emissions from tank batteries or storage facilities, after concluding these were not significant sources.10 But based on Texas reports, tank batteries and other storage units released about over 4000 tons of sulfur dioxide and nearly 3000 tons of VOCs a year between 2009 and 2011, because these units had to vent or flare gas when the downstream processing units they serve were “shut in” for repairs. Such data can be used to determine whether additional steps need to be taken either to limit the impact that a shutdown has on other components of the natural gas gathering system, or to require additional controls at units that are affected.

7
How Much is too Much?
It is important to keep this data in perspective. The large facilities addressed in this report are only a subset of the many sources that contribute to smog, and fine particle or toxic pollution. Motor vehicles and smaller, more dispersed sources make a substantial contribution to smog, accounting for a little under half of total emissions of VOCs. Some plants may have less impact on local air quality because they are in lightly populated areas where traffic is lighter and few other sources contributing to air pollution are present. And while gas plants reported more than 42,000 tons of sulfur dioxide emissions between 2009-2011, a single coal plant — the Big Brown generating station in Freestone County — released more than one and a half times that amount in 2010. On the other hand, emission events clearly add up, accounting for nearly 10% of the total VOC emissions released from all industrial sources in 2010, a share that is likely to have increased in 2011.11 These estimates understate emissions for the reasons explained below. But regardless of their contribution to annual emissions, emission events are significant because they can release intense bursts of pollution from flares or leaking vents that can shorten breath, attack the respiratory system in more serious ways, and violate short-term air quality standards that are supposed to protect children and the elderly from pollution spikes. Unfortunately for many communities, only a limited number of monitoring stations are available to measure pollution loads during these events, and they are not always located downwind of the most likely sources. This is a critical absence. For example, a 2008 TCEQ investigations in Texas City relying upon Agilent 6890 gas chromatographs measured benzene concentrations offsite and downwind of leaking storage tanks at levels up to 270 parts per billion.12 That is significantly higher than the 100 parts per billion exposure limit recommended by the National Institute of Occupational Safety and Health (Total Weighted Average) to safeguard plant workers from benzene, a known carcinogen.13 And occupational standards are typically not designed to protect children or the elderly, who are generally more sensitive to air pollution due to their more limited lung capacity. TCEQ data analyzed in this report likely under-represent the actual emissions released during emission events. First, emissions released through a flare are often underestimated because industry assumes that flares are significantly more effective than the evidence supports. And second, the formulas facilities use to calculate how much pollution is released from leaking equipment have been shown to underestimate emissions by an order of magnitude or more. The combustion process is assumed to destroy about 98 to 99% of the VOCs sent to flares, based on a formula that EPA last reviewed more than 20 years ago.14 But studies that examine how flares operate in the real world of petrochemical manufacturing show that combustion efficiency can be as low as 70%. The difference can have a dramatic effect on emissions, because a flare that destroys only 70% of VOC’s will release the remaining 30% to the air, or about 15 to 30 times the amount the industry reports based on emission factors of 98 to 99%. A 2007 survey at BP Texas City using differential absorption light detection and ranging (DIAL)15 to quantify emissions from various process units determined that VOC releases from one flare averaged 263 pounds an hour, far higher than amounts based on current emission factors.16 The overly optimistic assumptions regarding flare combustion efficiency are the product of several factors. First, recent studies at Marathon’s Detroit and Texas City refineries show that waste gases are

8
often not nearly as “energy rich” (i.e., have low heat values) as assumed, decreasing the flammability of the gas. Second, plant operators often apply too much steam to flares to prevent them from smoking, which further reduces the flammability by diluting the waste stream and lowering temperature. A 2010 TCEQ study of propylene flares confirmed that low heat values and too much steam can increase emission by interfering with combustion.17 Finally, windy weather combined with low flow rates (the “momentum flux ratio”) can also make flare gases harder to burn.18 In addition to over-estimating flare efficiency, the industry reports emissions based on formulas that have been shown to understate leak rates from product storage tanks, wastewater treatment, and other units by an order or magnitude or more. A 2011 study at the Shell Deer Park refinery and chemical plant used DIAL to quantify emissions of benzene and other VOCs from the facility’s tanks, and wastewater treatment unit, and measured actual releases from these sources at 31 to 132 times the amounts predicted based on the formulas that industry currently uses to estimate and report emissions.
Table 5: DIAL Measured Emissions at Shell Deer Park
Facility Area at Shell Dee Park
Pollutant Emission Factor Based Calculation (lbs/hr)
Estimate of Emissions using DIAL (lbs/hr)
Potential Underestimation Multiplier
Tanks South of ACU BEU Benzene 0.44 41.13 93 Aromatics Concentration Unit and Benzene Extraction Unit (March 26)
VOC 2.49 77.48 31
North Wastewater Benzene 0.11 7.3 67 Southwest Tanks (January 15)
VOC 0.39 51.53 132
The Shell Deer Park study is generally consistent with earlier studies at refineries in Texas City (BP) and in Alberta, Canada, which also measured releases at levels much higher than current emission factors would predict.19 TCEQ infrared photographs of tanks and flares, taken in 2007, reveal plumes of emissions rising above units at the Valero, Marathon, and BP refineries and at the Oiltanking storage terminal in Texas City, indicating that contaminants are being released in very large volumes.20 (See Figures 1-3). EPA and state regulators have known about the emissions reporting problems for at least a decade. The Agency’s own Inspector General determined in a 1997 report that EPA emission factors “do not produce reliable emission estimates and are, in some cases, outdated.”21 In 2006, nine years later, the Inspector General issued a follow up report stating that VOC emissions from fugitives and flares at “petroleum refineries were significantly underreported. Citing the Inspector General’s reports and other evidence, the City of Houston filed a Data Quality Act petition in 2008 asking EPA to review the widespread use of outdated and inaccurate emission factors.22 While EPA has taken some steps to caution against the misuse of emission factors, and to improve the

9
collection of data for rulemaking, e.g., by requiring new stack testing for some units, it has not reviewed or revised methodologies it has approved that consistently underestimate emissions.
Figure 1: BP Products North America, Inc. Texas City Operations Uncombusted/Partially Combusted Emissions from Two Flares May 31, 200823
Figure 2: Valero Refining Co.; Digital Photograph and Infrared Image of Storage Tank #478 June 1, 200824

10
Conclusion: The integrity of the Clean Air Act is compromised when so much of the emissions data used to write and enforce rules are wildly inaccurate. The law is supposed to protect public health from air pollution, including the health of those citizens who live, work, and go to school near petrochemical and gas plants that produce the energy and chemical products the rest of us enjoy. The rules should be fair, and administered as efficiently as possible, based on accurate data that inspire public confidence and help industry to identify the most cost-effective ways to minimize their pollution. These goals have been undermined in two important ways:
• EPA and state regulators have turned a blind eye to emissions caused by malfunctions, startup, shutdown, and repair activities that are common in the petrochemical and natural gas industry. The Clean Air Act holds operators strictly liable for their mistakes, but a tangled web of “affirmative defenses” obscure that responsibility, making enforcement of the law all but impossible by effectively excusing emissions that result from poorly designed or maintained equipment. The working class and minority communities in neighborhoods next to manufacturing sites have had to face the consequences, notwithstanding EPA’s frequently stated commitment to “environmental justice.”
• Most people would be surprised to hear that much of the emissions that industry reports,
whether the result of routine operations or the kind of emission events described above, are not actually measured or monitored. Instead, the reported data is based on static formulas that have not changed in decades, and which have been proven to underestimate emissions by an order of magnitude or more in some cases. EPA’s enforcement program has taken important steps to tighten monitoring of flares in recent enforcement actions, but these cover only a handful of facilities. But the Office of Air and Radiation, which is responsible for determining industry-wide emission monitoring standards, has ignored multiple studies, repeated criticism from the Agency’s own Inspector General, and a Data Quality Act petition filed four years ago by the City of Houston. In fact, the Agency has ignored the law, which requires that emission factors for VOCs be reviewed at least once every three years, and revised as needed.
Bad emissions data is not just a “paperwork” problem – bad data leaves millions of Americans exposed to hidden sources of pollution that EPA has refused to acknowledge. In the long run, it does our nation’s industry no favor either, as emission standards for some units are continually tightened because emissions from other sources that could be reduced much more cheaply escape the notice of regulators or permit writers. The recommendations outlined in the Executive Summary are straightforward, and within the Agency’s authority. EPA needs to require the online reporting of emissions released during malfunctions, startup, shutdown, and repairs, as Texas already does, so the public and regulators can get a better understanding of the magnitude of this problem. The Agency needs to revamp policies that excuse polluters from liability for these emission events, and take serious enforcement action when mishaps are frequent or release significant amounts of pollution. EPA needs to throw out emission factors that

11
are transparently false, and replace them with more direct monitoring of sources, or methods that take into account the variables that can cause emissions to multiply in a few short hours. These issues have been laid at EPA’s doorstep for many years, and will not go away. It is long past time for the Agency to act. *Image on cover was taken on June 19, 2012 of the Texas Petrochemical Houston Refinery. This event released over 140 tons of VOCs because lightning struck a power pole at the facility. See TCEQ, EMISSIONS EVENT REPORT DATABASE, http://www11.tceq.texas.gov/oce/eer/index.cfm?fuseaction=main.getDetails&target=170014. 1 See e.g., EPA, BP WHITING SETTLEMENT (2012),available at http://www.epa.gov/compliance/resources/cases/civil/caa/bp-whiting.html; EPA, MARATHON PETROLEUM COMPANY, LP AND CATLETTSBURG REFINING LLC SETTLEMENT (2012), available at http://www.epa.gov/compliance/resources/cases/civil/caa/marathonrefining.html. 2 See 30 TEX. ADMIN. CODE § 101.201 (2012). 3 Sierra Club v. EPA, 551 F.3d 1019 (2008). 4 Press Release, National Environmental Law Center, Environmental Groups and Chevron Phillips Chemical Co. Agree to Settlement of Clean Air Act Lawsuit (Nov. 18, 2010), available at http://www.nelconline.org/active-cases/active-cases11/environment-texas-and-sierra-club-vs.-chevron-phillips-cedar-bayou#id0Dri_Fg176s0ZkdqwcC_Mg; Press Release, National Environmental Law Center, Environmental Groups and Shell Oil Company Propose Landmark Settlement of Clean Air Act Lawsuit (Apr. 23, 2009) available at http://www.nelconline.org/news/news/landmark-settlement-in-clean-air-act-lawsuit-against-shell-oil-company2#idh9W-GLKSiJiSZcOdwnmPww. 5 OFFICE OF AIR QUALITY PLANNING AND STANDARDS, USEPA, RISK AND EXPOSURE ASSESSMENT TO SUPPORT THE REVIEW OF THE SO2 PRIMARY NATIONAL AMBIENT AIR QUALITY STANDARDS, EPA-452/R-09-007, 25 (2009). 6 TCEQ, EMISSION EVENT DATABASE, available at http://www11.tceq.texas.gov/oce/eer/index.cfm (last visited July 17, 2012). 7 TCEQ, CENTRAL REGISTRY QUERY, available at http://www12.tceq.state.tx.us/crpub/index.cfm?fuseaction=regent.RNSearch (last visited July 17, 2012); EPA, FACILITY REGISTRY SYSTEM, available at http://www.epa.gov/enviro/html/fii/fii_query_java.html (last visited Apr. 5, 2012). 8 Memorandum from Heather P. Brown, P.E., Ec/R Incorporated. to Bruce Moore, OAQPS/SPPD/FIG/USEPA, COMPOSITION OF NATURAL GAS FOR USE IN THE OIL AND NATURAL GAS SECTOR RULEMAKING, EPA-HQ-OAR-2010-0505-0031 (2011), available at http://www.regulations.gov/#!documentDetail;D=EPA-HQ-OAR-2010-0505-0031. 9 BAY AREA AIR QUALITY MANAGEMENT DISTRICT, REGULATION 12, RULE 12 (2006), available at http://www.baaqmd.gov/~/media/Files/Planning%20and%20Research/Rules%20and%20Regs/reg%2012/rg1212.ashx?la=en; 10 Oil and Natural Gas Sector: New Source Performance Standards and National Emission Standards for Hazardous Air Pollutants Reviews (2012) (available at http://www.epa.gov/airquality/oilandgas/pdfs/20120417finalrule.pdf). 11 TCEQ, 2010 EMISSIONS DETAILED INVENTORY DATA, (on file with EIP) (site level summary data available at http://www.tceq.texas.gov/airquality/point-source-ei/psei.html). 12 Memorandum from Teri Whitely, Air Laboratories & Quality Assurance Section, Monitoring Operations Division, TCEQ to Michael Honeycutt, Ph.D., Manager, Toxicology Division, Chief Engineer’s Office, TCEQ, TEXAS CITY MONITORING PROJECT, MAY 30 – JUNE 6, 2008, SAMPLING FOR VOLATILE ORGANIC COMPOUNDS (VOCS), SEMI-VOLATILE ORGANIC COMPOUNDS (SVOCS), SULFUR DIOXIDE (SO2), HYDROGEN SULFIDE (H2S), CARBONYLS, AND INFRARED (IR) CAMERA IMAGING, DOCUMENT NUMBER TXC0805-FR (2009) (on file with EIP)[hereinafter TCEQ INFRARED MONITORING REPORT]. 13 NATIONAL INSTITUTE FOR OCCUPATIONAL SAFETY AND HEALTH, NIOSH POCKET GUIDE TO CHEMICAL HAZARDS 26 (2007). 14 OFFICE OF AIR QUALITY PLANNING AND STANDARDS, EPA, COMPILATION OF AIR POLLUTANT EMISSION FACTORS, Ch. 13.5 INDUSTRIAL FLARES (1995), available at http://www.epa.gov/ttn/chief/ap42/ch13/final/c13s05.pdf. 15 DIAL is a laser-based remote monitoring technique that takes advantage of the unique absorption characteristics of different compounds. Different compounds, such as water, oxygen, benzene, and toluene absorb and reflect
12
light in different amounts at different wavelengths. DIAL uses this phenomenon by emitting a pulsed laser beam into the atmosphere and measuring the light that is reflected back. 16 ROD ROBINSON, TOM GARDINER, BOB LIPSCOMBE, NATIONAL PHYSICAL LABORATORY, MEASUREMENTS OF VOC EMISSIONS FROM PETROCHEMICAL INDUSTRY SITES IN THE HOUSTON AREA USING DIFFERENTIAL ABSORPTION LIDAR (DIAL) DURING SUMMER 2007 (DRAFT FOR COMMENT) 27-28 (2008). 17 RUTH CADE, BILL EWING, SCOTT EVANS & DANIEL ROESLER, STEAM CONTRIBUTION TO COMBUSTION ZONE GAS IN VARIABLE WIND CONDITIONS (2010); DAVID T. ALLEN & VINCENT M. TORRES, THE UNIVERSITY OF TEXAS AT AUSTIN, TCEQ 2010 FLARE STUDY FINAL REPORT (2011) [hereinafter TCEQ 2010 FLARE STUDY]. 18 TCEQ 2010 FLARE STUDY, supra note 18. 19 ALAN CHAMBERS, MEL STROSHER, REFINERY DEMONSTRATION OF OPTICAL TECHNOLOGIES FOR MEASUREMENT OF FUGITIVE EMISSIONS AND FOR LEAK DETECTION (2006) (on file with EIP). 20 OFFICE OF INSPECTOR GENERAL, EPA, 2006-P-00017, EPA CAN IMPROVE EMISSIONS FACTORS DEVELOPMENT AND MANAGEMENT 11 (2006), available at http://www.epa.gov/oig/reports/2006/20060322-2006-P-00017.pdf. 21 OFFICE OF INSPECTOR GENERAL, EPA, EMISSION FACTOR DEVELOPMENT (1996), available at http://epa.gov/oig/reports/1996/emistabl.pdf. 22 Letter from Bill White, Office of the Mayor, City of Houston, to Information Quality Guidelines Staff of EPA, REQUEST FOR CORRECTION OF INFORMATION UNDER THE DATA QUALITY ACT AND EPA’S INFORMATION QUALITY GUIDELINES (JULY 9, 2008), available at http://www.greenhoustontx.gov/reports/epaletter20080709.pdf. 23 TCEQ INFRARED MONITORING REPORT, supra note 12 at 34 24 Id. at 17
1
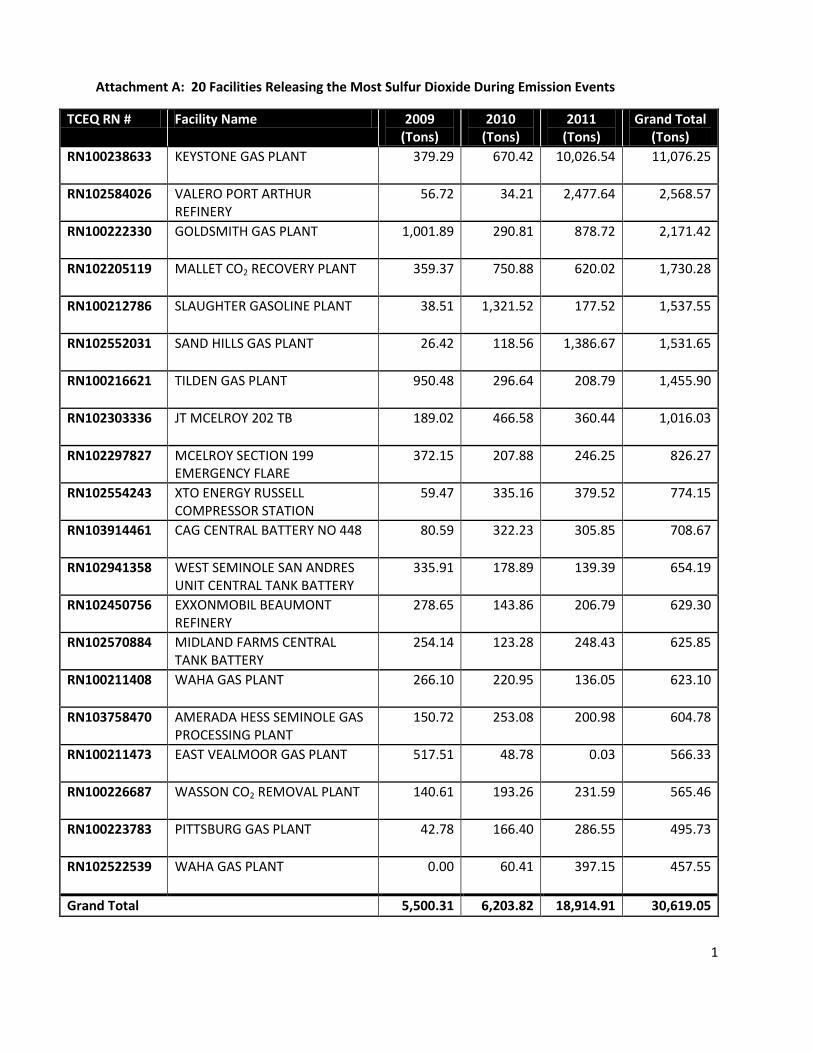
Attachment A: 20 Facilities Releasing the Most Sulfur Dioxide During Emission Events
TCEQ RN # Facility Name 2009 (Tons)
2010 (Tons)
2011 (Tons)
Grand Total (Tons)
RN100238633 KEYSTONE GAS PLANT 379.29 670.42 10,026.54 11,076.25
RN102584026 VALERO PORT ARTHUR REFINERY
56.72 34.21 2,477.64 2,568.57
RN100222330 GOLDSMITH GAS PLANT 1,001.89 290.81 878.72 2,171.42
RN102205119 MALLET CO2 RECOVERY PLANT 359.37 750.88 620.02 1,730.28
RN100212786 SLAUGHTER GASOLINE PLANT 38.51 1,321.52 177.52 1,537.55
RN102552031 SAND HILLS GAS PLANT 26.42 118.56 1,386.67 1,531.65
RN100216621 TILDEN GAS PLANT 950.48 296.64 208.79 1,455.90
RN102303336 JT MCELROY 202 TB 189.02 466.58 360.44 1,016.03
RN102297827 MCELROY SECTION 199 EMERGENCY FLARE
372.15 207.88 246.25 826.27
RN102554243 XTO ENERGY RUSSELL COMPRESSOR STATION
59.47 335.16 379.52 774.15
RN103914461 CAG CENTRAL BATTERY NO 448 80.59 322.23 305.85 708.67
RN102941358 WEST SEMINOLE SAN ANDRES UNIT CENTRAL TANK BATTERY
335.91 178.89 139.39 654.19
RN102450756 EXXONMOBIL BEAUMONT REFINERY
278.65 143.86 206.79 629.30
RN102570884 MIDLAND FARMS CENTRAL TANK BATTERY
254.14 123.28 248.43 625.85
RN100211408 WAHA GAS PLANT 266.10 220.95 136.05 623.10
RN103758470 AMERADA HESS SEMINOLE GAS PROCESSING PLANT
150.72 253.08 200.98 604.78
RN100211473 EAST VEALMOOR GAS PLANT 517.51 48.78 0.03 566.33
RN100226687 WASSON CO2 REMOVAL PLANT 140.61 193.26 231.59 565.46
RN100223783 PITTSBURG GAS PLANT 42.78 166.40 286.55 495.73
RN102522539 WAHA GAS PLANT 0.00 60.41 397.15 457.55
Grand Total 5,500.31 6,203.82 18,914.91 30,619.05

2
Attachment B: 20 Facilities Releasing the Most VOCs During Emission Events
Rn Name 2009 (Tons)
2010 (Tons)
2011 (Tons)
Grand Total (Tons)
RN106096696 MAGELLAN PIPELINE COMPANY LP PIPELINE GALVESTON COUNTY
0.00 0.00 15,974.68 15,974.68
RN102450756 EXXONMOBIL BEAUMONT REFINERY
144.13 3,357.70 62.76 3,564.59
RN105682223 GWO 19 1,126.41 19.85 1,846.55 2,992.82
RN105716005 GW O BRIEN SECTION F 18 SATELLITE
142.97 0.00 1,999.55 2,142.52
RN102555117 EL MAR 12 1,717.37 30.44 77.49 1,825.31
RN100213701 BOYD COMPRESSOR STATION 411.20 379.28 385.58 1,176.06
RN102510088 FALCON REFINERY 0.00 1,051.00 0.00 1,051.00
RN104686753 CENTERPOINT ENERGY GAS TRANSMISSION PIPELINE PANOLA COUNTY
0.00 0.00 1,040.00 1,040.00
RN105730485 MIDMAR GAS PLANT 0.00 0.00 889.86 889.86
RN105715502 SECTION F 1 SATELLITE 7.02 3.38 805.13 815.53
RN100543107 ENTERPRISE PRODUCTS MONT BELVIEU WEST FACILITY
0.00 0.00 738.87 738.87
RN101618759 FLINT HILLS RESOURCES LONGVIEW FACILITY
0.00 0.00 716.99 716.99
RN105911531 SWORD BATTERY 0.00 22.89 646.26 669.16
RN100839463 8000 SERIES TERMINAL 0.00 0.00 640.28 640.28
RN104199617 ENTERPRISE PRODUCTS OPERATING PIPELINE LOVING COUNTY
0.00 0.00 575.71 575.71
RN102535077 BP PRODUCTS NORTH AMERICA 91.46 182.76 284.24 558.46
RN103024170 GOLDSMITH LANDRETH DEEP UNIT STATION 1
17.15 25.61 507.34 550.10
RN100218973 FORMOSA POINT COMFORT PLANT
192.22 289.35 57.83 539.40
RN102217015 A 1O HUTT COMPRESSOR STATION
38.42 450.51 14.77 503.70
RN104858808 TEXSTAR FIELD SERVICES PIPELINE ATASCOSA COUNTY
0.00 12.99 379.94 392.93
Grand Total 3,888.36 5,825.77 27,643.85 37,357.97