Responsive Content, Responsive Documents, Responsive PDF - Innovation durch Barrierefreiheit

RESEARCH ARTICLE
RNA-Seq analysis of salinity stress–responsive
transcriptome in the liver of spotted sea bass
(Lateolabrax maculatus)
Xiaoyan Zhang, Haishen Wen, Hailiang Wang, Yuanyuan Ren, Ji Zhao, Yun Li*
The Key Laboratory of Mariculture (Ocean University of China), Ministry of Education, Ocean University of
China, Qingdao, P. R. China
Abstract
Salinity is one of the most prominent abiotic factors, which greatly influence reproduction,
development, growth, physiological and metabolic activities of fishes. Spotted sea bass
(Lateolabrax maculatus), as a euryhaline marine teleost, has extraordinary ability to deal
with a wide range of salinity changes. However, this species is devoid of genomic resources,
and no study has been conducted at the transcriptomic level to determine genes responsible
for salinity regulation, which impedes the understanding of the fundamental mechanism
conferring tolerance to salinity fluctuations. Liver, as the major metabolic organ, is the key
source supplying energy for iono- and osmoregulation in fish, however, little attention has
been paid to its salinity-related functions but which should not be ignored. In this study, we
perform RNA-Seq analysis to identify genes involved in salinity adaptation and osmoregula-
tion in liver of spotted sea bass, generating from the fishes exposed to low and high salinity
water (5 vs 30ppt). After de novo assembly, annotation and differential gene expression
analysis, a total of 455 genes were differentially expressed, including 184 up-regulated and
271 down-regulated transcripts in low salinity-acclimated fish group compared with that in
high salinity-acclimated group. A number of genes with a potential role in salinity adaptation
for spotted sea bass were classified into five functional categories based on the gene ontol-
ogy (GO) and enrichment analysis, which include genes involved in metabolites and ion
transporters, energy metabolism, signal transduction, immune response and structure reor-
ganization. The candidate genes identified in L. maculates liver provide valuable information
to explore new pathways related to fish salinity and osmotic regulation. Besides, the tran-
scriptomic sequencing data supplies significant resources for identification of novel genes
and further studying biological questions in spotted sea bass.
Introduction
Salinity is one of the most important environmental factors that greatly affect the survival,
reproduction, growth, development and physiological functions of teleosts. The tolerance to
salinity variation depends on their ability of osmotic regulation [1]. Euryhaline teleosts, which
PLOS ONE | DOI:10.1371/journal.pone.0173238 March 2, 2017 1 / 18
a1111111111
a1111111111
a1111111111
a1111111111
a1111111111
OPENACCESS
Citation: Zhang X, Wen H, Wang H, Ren Y, Zhao J,
Li Y (2017) RNA-Seq analysis of salinity stress–
responsive transcriptome in the liver of spotted sea
bass (Lateolabrax maculatus). PLoS ONE 12(3):
e0173238. doi:10.1371/journal.pone.0173238
Editor: Peng Xu, Xiamen University, CHINA
Received: October 27, 2016
Accepted: February 18, 2017
Published: March 2, 2017
Copyright: © 2017 Zhang et al. This is an open
access article distributed under the terms of the
Creative Commons Attribution License, which
permits unrestricted use, distribution, and
reproduction in any medium, provided the original
author and source are credited.
Data Availability Statement: All raw sequences
generated from next generation sequencing were
deposited in the Short Read Archive of the National
Center for Biotechnology Information (NCBI) with
accession numbers of SRR4409341 (LS) and
SRR4409397 (HS). The Transcriptome Shotgun
Assembly project has been deposited at DDBJ/
EMBL/GenBank under the accession
GFDU00000000. The version described in this
paper is the first version, GFDU01000000.
Funding: This project is supported by National
Natural Science Foundation of China (NSFC), http://
www.nsfc.gov.cn/, grant number 31602147. YL,

are usually exposed to constant and rapid changes in the salinity of external environment, have
the superior ability for osmoregulation and can tolerate a wide range of external salt concen-
trations [2]. The spotted sea bass, Lateolabrax maculatus, belonging to Lateolabrax, Serranidae,
is a newly re-described euryhaline teleost specie which usually inhabits in estuary brackish-
water, and can also live in fresh water [3,4]. Previous studies have revealed that L. maculatusgrows in optimal salinity ranged from 16–17 ppt, whereas they can survive at salinities below
38 ppt and above 0 ppt [5]. To cope with water osmotic pressures caused by the change of tide,
terrigenous drainage and climate, L. maculates, like other euryhaline fishes, has evolved unique
and complex osmotic regulation mechanism [6]. Euryhaline species also enable comparative
studies in which one environment can be used as a standard to contrast the specific genes or
pathways for freshwater or saltwater osmoregulation [7]. Therefore, together with its economi-
cal importance, spotted sea bass is a valuable template for investigating the mechanisms of
acclimation to osmotic stress and the responses to salinity changes. Moreover, as the coastal
cage culture of L. maculates suffers from germplasm degeneration, many inland areas began to
explore freshwater domestication of L. maculates [8]. Thus understanding the mechanism
underlying the adaptation to fluctuated environmental salinity can support the regional cul-
ture industry and further expansion of the culture of L. maculatus.Various enzymes and transporters participate in the processes of salinity adaption and
osmoregulation to maintain an internal osmotic and ionic homeostasis when live in a salinity
fluctuating environment [9,10]. Identification of candidate genes involved in salinity change is
the first step to elucidate the molecular basis and understand factors underlying this core phys-
iological process. As the transcriptome is a dynamic set of expressed genes that is sensitive to
the external environment and will change depending on the physiological conditions, tran-
scriptomic analysis is a powerful tool for interpreting the functional genomics elements and
for revealing molecular mechanisms in cells and tissues [11]. Next generation high-throughput
RNA sequencing technology (RNA-Seq) now provides a cost-and time-effective way to gener-
ate transcriptomic resources to find and determine the putative genes and gene families
responsible for stress response in species [12–14]. RNA-Seq can also provide reliable measure-
ments of transcripts in one or more conditions, which make it particularly attractive for the
quantitative analysis of gene expression in transcriptomic level [15]. Over the last several years,
significant progress has been made in understanding the transcript expression profile during
salinity adaptation of various euryhaline teleost species by RNA-Seq, such as nile tilapia (Oreo-chromis niloticus), Mozambique tilapia (Oreochromis mossambicus) [7], medaka (Oryziasmela-stigma) [16], striped catfish (Pangasianodon hypophthalmus) [11,17] and Asian seabass
(Latescal carifer) [18]. Those studies highlighted several differentially expressed genes (DEGs)
and pathways involved in salinity change. However, such investigations in L. maculatus have
not been reported. Previous studies just examined the growth, development, reproductive
activities and physiology behaviors exposed to different salinities [5,8], the research on the
molecular mechanism of acclimation to salinity and osmotic stress in L. maculatus, actually,
legs far behind.
A timely and adequate energy supply is a prerequisite for iono- and osmoregulation in fish,
while carbohydrate metabolism plays a major role in the energy supply [19]. Liver, as the most
fundamental metabolic organ, has proved to be the major source supplying carbohydrate
metabolites to osmoregulatory organs [20]. Studies further suggested that the liver could pro-
mote the decomposition of glycogen into glucose in order to maintain normal blood sugar lev-
els of fish, as well as provide the energy required by gill and other osmoregulatory organs
under the salinity stress [21, 22]. However, despite its importance, the role of liver in fish
osmoregulation is hardly known compared with osmoregulatory organs (such as gill, kidney
and intestine) which have received considerable attention over the years [7, 23]. Thus, for
RNA-Seq of salinity regulated liver transcriptome in spotted sea bass
PLOS ONE | DOI:10.1371/journal.pone.0173238 March 2, 2017 2 / 18
HW, XZ has been funded by this grant. The funders
had no role in study design, data collection and
analysis, decision to publish, or preparation of the
manuscript.
Competing interests: The authors have declared
that no competing interests exist.

osmoregulation study in fish, a new window should be opened for examining the activities
occurring in liver and explore its role in salinity adaption.
As salinity stress in spotted sea bass remains largely unexplored and the genomic and tran-
scriptomic data available for this species is still scarce, in this study, we conducted RNA-Seq to
identify and characterize salinity-induced genes expressions in liver tissue of L. maculatus.Our results will provide a valuable resource for a better understanding of osmoregulatory pro-
cess of spotted sea bass. The candidate genes identified in this study would serve as potential
list for gene-assisted genetic breeding program for spotted sea bass as well as other euryhaline
species.
Materials and methods
Ethics statement
All animal experiments were conducted in accordance with the guidelines and approval of the
respective Animal Research and Ethics Committees of Ocean University of China. The field
studies did not involve endangered or protected species.
Salinity challenge and fish sampling
Spotted sea bass fingerlings (10.66 ± 0.05 g) were acquired from Doumen district river fishery
research institute (Zhuhai city, Guangdong province, China). Fish were maintained under a
14:10 h light–dark photoperiod in a 3m�4m�0.5m cement tank for one week before experi-
ment. Water temperature, dissolved oxygen, salinity and pH were maintained at 25.3±0.7˚C,
7.01 ±0.45mg/ L, 20±0.8‰ and 7.8±0.5, respectively. After acclimation, fingerlings were ran-
domly assigned to two groups: low salinity group (LS, 5ppt) and high salinity group (HS,
30ppt) in 6 tanks, all treatment groups were triplicated. After 60 days breeding, 6 fishes per
tank were treated with tricaine methane sulfonate (MS 222, 200 mg/L) and sampled immedi-
ately. Liver tissues were collected and stored at -80˚C for RNA extraction.
RNA extraction, library construction and transcriptome sequencing
Total RNA was isolated from liver samples using the TRIzol1 reagent (Invitrogen, USA) and
treated with the TURBO DNA- free™ kit (Invitrogen) to remove genomic DNA. The concen-
tration and integrity of total RNA were assessed using the Agilent 2100 Bioanalyzer system
(Agilent Technologies, USA). In order to minimize the variation among individuals, equal
amounts of RNA from 6 individual fish in the same salinity tank were pooled as one sample,
and 3 replicated samples were made for each salinity treatment group. A total of 6 sequencing
libraries (3 replicated samples X 2 treatment groups) were generated using NEBNext1 Ultra™RNA Library Prep Kit for Illumina1 (NEB, USA) following manufacturer’s recommendations
and index codes were added to attribute sequences to each sample. Samples were then
sequenced on an IlluminaHiseq 2500 platform and 125 bp paired-end reads were generated.
Raw sequences were deposited in the Short Read Archive of the National Center for Biotech-
nology Information (NCBI) with accession numbers of SRR4409341 (LS) and SRR4409397
(HS).
De novo assembly of sequencing reads
Raw data of FASTQ format were firstly processed through in-house perl scripts. In this step,
clean data were obtained by removing reads containing adapter, reads containing ploy-N and
low quality reads from raw data. Q20, Q30, GC-content and sequence duplication level of the
RNA-Seq of salinity regulated liver transcriptome in spotted sea bass
PLOS ONE | DOI:10.1371/journal.pone.0173238 March 2, 2017 3 / 18

clean data were calculated. All the downstream analyses were based on clean data with high
quality.
The de novo assembly was performed on liver clean reads using Trinity package [24].
Briefly, the reads were assembled into unique sequences of transcripts in Inchworm via greedy
K-mer extension (K-mer = 25). After mapping of reads to Inchworm contigs, Chrysalis incor-
porated reads into de bruijn graphs. Finally the Butterflymodule processed the individual
graphs in parallel, generating full-length transcripts. This Transcriptome Shotgun Assembly
project has been deposited at DDBJ/EMBL/GenBank under the accession GFDU00000000.
The version described in this paper is the first version, GFDU01000000.
Annotations of transcripts and pathways
The assembled transcripts were scanned against the Nr (NCBI non-redundant protein
sequences), Nt (NCBI nucleotide sequences) and Swiss-Prot databases using BLASTX [25]
with E-values at 1.0×10⁻⁵ (E-values less than 1.0×10⁻⁵ were considered as significant).
Domain-based comparisons with Pfam (Protein family) and KOG (a eukaryote-specific ver-
sion of the Clusters of eukaryotic Ortholog Groups) databases were performed using
RPS-BLAST tool from locally installed NCBI BLAST + v2.2.28 and HMMER 3.0 program,
respectively. The top gene identifications and names were initially assigned to each transcript.
In addition, transcripts were used to determine the Gene Ontology (GO) term and the Kyoto
Encyclopedia of Genes and Genomes (KEGG) pathway. GO enrichment (Biological Process,
Cellular Component and Molecular Function at level 2) was performed using Blast 2GO pro-
gram [26]. The overview of metabolic pathway analysis was performed using online KEGG
(http://www.genome.jp/kegg/), which is a database [27] resource for understanding high-level
functions and utilities of the biological system.
Gene differential expression and enrichment analysis
The high-quality clean reads from each library were mapped to the de novo assembled tran-
scripts using bowtie 2 program [28] with no mismatch. The mapped reads from alignments
were counted and then normalized to determine FPKM (expected number of Fragment Per
Kilobase of transcript sequence per Millions base pairs sequenced) using RSEM V1.2.15 [29].
Differential expression statistical analysis of two experimental groups (LS and HS) was per-
formed using the DESeq R package [30]. An adjusted p-value cut off of 0.05 was applied in this
analysis. Transcripts with absolute fold change values higher than 2.0 were regarded as signifi-
cantly differential expressed genes. Gene Ontology (GO) enrichment analysis of the differen-
tially expressed genes (DEGs) was implemented by the GOseq packages based on Wallenius
non-central hyper-geometric distribution [31], which can adjust for gene length bias in DEGs.
Experimental validation by qRT-PCR
Quantitative real-time PCR (qRT-PCR) was used to detect the expression of 10 differential
expressed genes to validate our Illumina sequencing data. RNA samples were generated from
HS and LS groups (with three replicate samples each group) in the preceding experiment.
Primers were designed based on the assembled transcriptome sequence using the Primer5 soft-
ware (Premier Biosoft International) and listed in S1 Appendix. The first strand cDNA was
synthesized from 1 μg of RNA by using M-MLV Reverse Transcription Kit (Promega, USA).
All the cDNA products were diluted to 200ng/μl. The 20 μl qRT-PCR reaction mixture con-
sisted of 2μl template cDNA, 0.4μl of each primer, 10 μl of KAPA SYBR1FAST qPCR Master
Mix (2X), 0.4μl of ROX and 6.8μl of nuclease-free water. PCR amplification was performed as
that incubated in a 96-well optical plate at 95˚C for 2 min, followed by 40 cycles of 95˚C for
RNA-Seq of salinity regulated liver transcriptome in spotted sea bass
PLOS ONE | DOI:10.1371/journal.pone.0173238 March 2, 2017 4 / 18
15s, 56˚C for 15s, and a final extension at 72˚C for 2 min. qRT-PCR was performed using the
StepOne Plus Real-Time PCR system (Applied Biosystems) and 2-ΔΔCT method was used to
analysis the expression level of genes. 18S ribosomal RNA (18S) was used as the reference gene
for qRT-PCR normalization. The correlation coefficient between the fold changes in RNA-Seq
group and qRT-PCR group was determined by SPSS13.0, one-way ANOVA followed by
Duncan’s multiple range tests and differences were accepted as statistically significance when
P< 0.05.
Results
De novo assembly for spotted sea bass
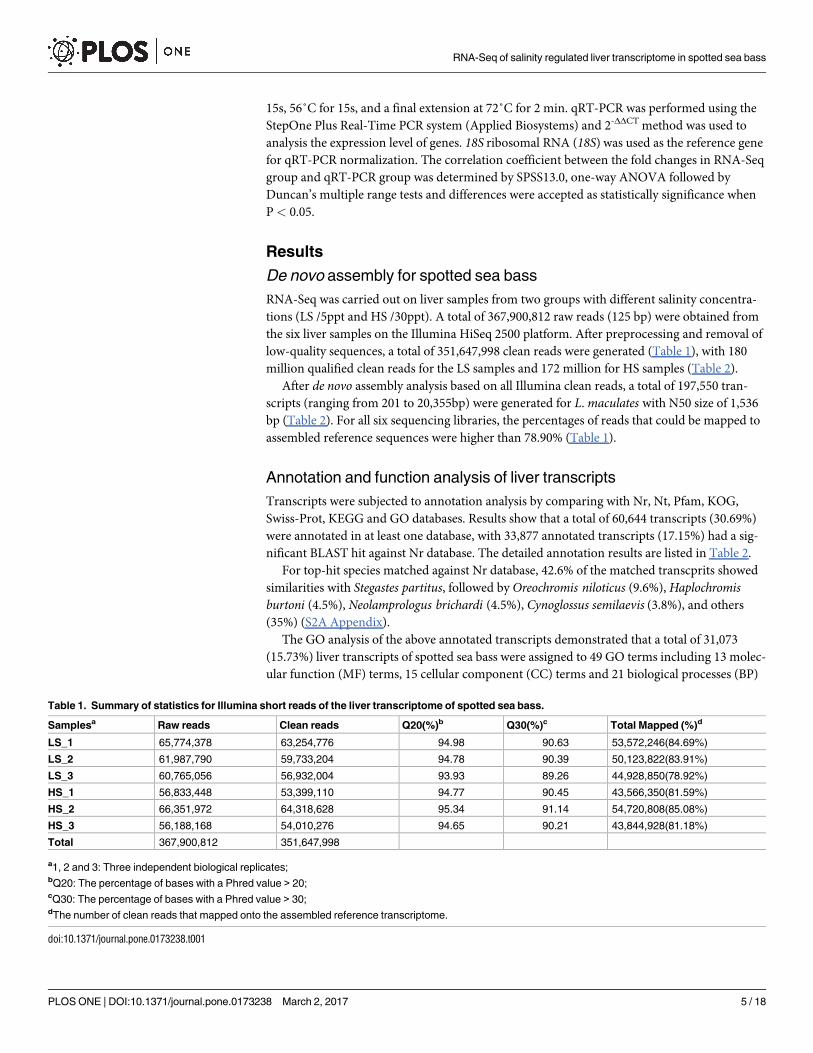
RNA-Seq was carried out on liver samples from two groups with different salinity concentra-
tions (LS /5ppt and HS /30ppt). A total of 367,900,812 raw reads (125 bp) were obtained from
the six liver samples on the Illumina HiSeq 2500 platform. After preprocessing and removal of
low-quality sequences, a total of 351,647,998 clean reads were generated (Table 1), with 180
million qualified clean reads for the LS samples and 172 million for HS samples (Table 2).
After de novo assembly analysis based on all Illumina clean reads, a total of 197,550 tran-
scripts (ranging from 201 to 20,355bp) were generated for L. maculates with N50 size of 1,536
bp (Table 2). For all six sequencing libraries, the percentages of reads that could be mapped to
assembled reference sequences were higher than 78.90% (Table 1).
Annotation and function analysis of liver transcripts
Transcripts were subjected to annotation analysis by comparing with Nr, Nt, Pfam, KOG,
Swiss-Prot, KEGG and GO databases. Results show that a total of 60,644 transcripts (30.69%)
were annotated in at least one database, with 33,877 annotated transcripts (17.15%) had a sig-
nificant BLAST hit against Nr database. The detailed annotation results are listed in Table 2.
For top-hit species matched against Nr database, 42.6% of the matched transcprits showed
similarities with Stegastes partitus, followed by Oreochromis niloticus (9.6%), Haplochromisburtoni (4.5%), Neolamprologus brichardi (4.5%), Cynoglossus semilaevis (3.8%), and others
(35%) (S2A Appendix).
The GO analysis of the above annotated transcripts demonstrated that a total of 31,073
(15.73%) liver transcripts of spotted sea bass were assigned to 49 GO terms including 13 molec-
ular function (MF) terms, 15 cellular component (CC) terms and 21 biological processes (BP)
Table 1. Summary of statistics for Illumina short reads of the liver transcriptome of spotted sea bass.
Samplesa Raw reads Clean reads Q20(%)b Q30(%)c Total Mapped (%)d
LS_1 65,774,378 63,254,776 94.98 90.63 53,572,246(84.69%)
LS_2 61,987,790 59,733,204 94.78 90.39 50,123,822(83.91%)
LS_3 60,765,056 56,932,004 93.93 89.26 44,928,850(78.92%)
HS_1 56,833,448 53,399,110 94.77 90.45 43,566,350(81.59%)
HS_2 66,351,972 64,318,628 95.34 91.14 54,720,808(85.08%)
HS_3 56,188,168 54,010,276 94.65 90.21 43,844,928(81.18%)
Total 367,900,812 351,647,998
a1, 2 and 3: Three independent biological replicates;bQ20: The percentage of bases with a Phred value > 20;cQ30: The percentage of bases with a Phred value > 30;dThe number of clean reads that mapped onto the assembled reference transcriptome.
doi:10.1371/journal.pone.0173238.t001
RNA-Seq of salinity regulated liver transcriptome in spotted sea bass
PLOS ONE | DOI:10.1371/journal.pone.0173238 March 2, 2017 5 / 18

terms. Analysis of level 2 GO term distribution showed that cellular process (GO: 0009987),
metabolic process (GO: 0008152), single-organism process (GO: 0044699), biological regula-
tion (GO: 0065007) and regulation of biological process (GO: 0050789) in BP, cell (GO:
0005623), cell part (GO: 0044464), organelle (GO: 0043226), macromolecular complex (GO:
0032991), membrane (GO: 0016020), membrane part (GO: 0044425) and organelle part
(GO: 0044422) in CC, and binding (GO: 0005488), catalytic activity (GO: 0003824) and trans-
porter activity (GO: 0005215) in MF were the most common annotation terms in the three GO
categories (S2B Appendix).
In order to assess and classify possible functions, assembled transcripts were aligned to the
KOG database in which orthologous gene products were classified. A total of 14,905 (7.54%)
transcripts were assigned to 26 KOG categories. Among the matched sequences, 3,378 tran-
scripts were assigned into the KOG category of signal transduction mechanisms, which repre-
sented the largest functional group, followed by general function prediction (2,850),
posttranslational modification, protein turnover, chaperones (1,405), transcription (1,080),
intracellular trafficking, secretion, and vesicular transport (961), cytoskeleton (890) and other
classifications with smaller numbers of transcripts (S2C Appendix).
KEGG pathway analysis was performed to further elucidate the probable functional status
of assembled transcripts. A total of 17,046 (8.63%) annotated liver transcripts of spotted sea
bass with significant matches were assigned to five main categories that included 271 KEGG
pathways. Among the five main categories that were identified, organismal systems held the
greatest number of transcripts (6,678), followed by environmental information processing
(4,262), metabolism (3,406), cellular processes (3,153) and genetic information processing
(1,838). As shown in S2D Appendix, the five main categories contained 32 sub-categories,
transcripts of which were significantly engaged in signal transduction (3,125), endocrine sys-
tem (1,366), immune response (1,279), cellular community (1,129) and signal molecule inter-
actions (1,019).
Identification of differentially expressed genes
In the liver of spotted sea bass, a total of 455 annotated transcripts showed significantly
differential expression between the two salinity challenged groups (LS vs HS) (adjusted p-
Table 2. Summary of assembly and annotation statistics of the liver transcriptome of spotted sea
bass.
Category Number of transcripts
Total number of clean reads of LS 179,919,984
Total number of clean reads of HS 171,728,014
Average length of all transcripts (bp) 747
N50 length of all transcripts (bp) 1,536
Max length (bp) 20,355
Min length (bp) 201
Total number of annotated transcripts in Nr database 33,877 (17.14%)
Total number of annotated transcripts in Nt database 45,293 (22.92%)
Total number of annotated transcripts in Pfam database 30,854 (15.61%)
Total number of annotated transcripts in KEGG database 17,046 (8.62%)
Total number of annotated transcripts in KOG database 14,905 (7.54%)
Total number of annotated transcripts in GO database 31,073 (15.72%)
Total number of annotated transcripts in Swiss-Prot database 26,511 (13.41%)
Total number of annotated transcripts in at least one database 60,644 (30.69%)
doi:10.1371/journal.pone.0173238.t002
RNA-Seq of salinity regulated liver transcriptome in spotted sea bass
PLOS ONE | DOI:10.1371/journal.pone.0173238 March 2, 2017 6 / 18

value < 0.05), of which 184 genes were up-regulated and 271 genes showed down-regulated in
the LS group relative to HS group (S3 and S4 Appendices).
GO enrichment analysis of the 455 DEGs was performed from three aspects including CC,
MF and BP. Among these categories, most DEGs were enriched in the "cellular component"
category (S5 Appendix), which include 92 transcripts in membrane (GO: 0016020) term, 59
transcripts in membrane part (GO: 0044425) term, 48 transcripts in integral to membrane
(GO: 0016021) term and 48 transcripts in intrinsic to membrane (GO: 0031224) term. Regard-
ing the “BP” and "MF" category, only a few transcripts were enriched. For example, the three
most abundant subcategories in “BP” category including cell adhesion term (GO: 0007155, 15
transcripts), biological adhesion term (GO: 0022610, 15 transcripts), and macromolecular
complex assembly term (GO: 0065003, 10 transcripts). As for the "MF" category, most DEGs
were assigned to 23 peptidase activity that acting on L-amino acid peptides term (GO:
0070011, 23 transcripts), peptidase activity term (GO: 0008233, 23 transcripts), endopeptidase
activity term (GO: 0004175, 18 transcripts) and receptor activity term (GO: 0004872, 17 tran-
scripts) (S5 Appendix).
KEGG pathway analysis showed that the DEGs were engaged in several specific pathways,
such as renin-angiotensin system, glycosaminoglycan biosynthesis-keratan sulfate, hepatitis C,
vitamin digestion and absorption, mucin type O-Glycan biosynthesis and toll-like receptor sig-
naling pathway. The top 15 most enriched KEGG pathways are shown in Table 3
As a non-model species with only limited gene function annotation resources, candidate
DEGs potentially associated with salinity adaptation and osmoregulation were categorized in
to five functional categories including metabolites and ion transporters, energy metabolism,
signal transduction, immune response and structure reorganization (Table 4) based on the
combination of enrichment analysis, annotation and manual literature searches. Imputed
putative functions of these genes are covered in the Discussion.
Table 3. The top 15 enriched KEGG pathways in the DEGs.
Pathway terms KEGG ID DEGs number Background numbera P-Value
Renin-angiotensin system ko04614 4 23 8.13E-05
Glycosaminoglycan biosynthesis—keratan sulfate ko00533 4 28 0.000161
Hepatitis C ko05160 7 220 0.003718
Vitamin digestion and absorption ko04977 3 41 0.006466
Mucin type O-Glycan biosynthesis ko00512 3 42 0.006884
Hypertrophic cardiomyopathy (HCM) ko05410 6 190 0.007295
Legionellosis ko05134 4 106 0.015311
Glutathione metabolism ko00480 3 60 0.017203
Glycosphingolipid biosynthesis—globo series ko00603 2 22 0.018024
Hematopoietic cell lineage ko04640 3 65 0.021042
Glycosphingolipid biosynthesis—ganglio series ko00604 2 25 0.022538
Amino sugar and nucleotide sugar metabolism ko00520 3 69 0.024423
Tight junction ko04530 7 323 0.025092
Cysteine and methionine metabolism ko00270 3 73 0.02808
Leukocyte transendothelial migration ko04670 6 269 0.03268
aBackground number: the number of total genes assigned to the pathway
doi:10.1371/journal.pone.0173238.t003
RNA-Seq of salinity regulated liver transcriptome in spotted sea bass
PLOS ONE | DOI:10.1371/journal.pone.0173238 March 2, 2017 7 / 18

Table 4. Enriched DEGs potentially associated with salinity adaptation and osmoregulation in liver of spotted sea bass.
Functional group Gene name Gene ID log2FoldChange
(LS vs HS)
Gene function Cellular component
Metabolites and
Ion transporters
Sodium-coupled monocarboxylate
transporter(slc5a8,smct)
c96993_g1 -6.4 monocarboxylate transport membrane
Na/Pi cotransport system protein(slc34a,
nptA)
c34916_g1 -4.9 phosphate ion transport membrane
aquaporin 3 (aqp3), c81353_g1 -4.6 Ion transport membrane
TRIC channel c98361_g1 4.811 cation transport membrane
solute carrier family 6, monocarboxylate
transporters member 15-like (slc6a15)
c69992_g1 -4.83 cation transport integral component
of membrane
ryanodine receptor 2-like c61290_g1 5.945 calcium ion transport intracellular
ATP-sensitive inward rectifier potassium
channel(kcnj15)
c96024_g1 -5.07 potassium ion transport membrane
transient receptor potential cation
channel subfamily M(trpm5)
c99386_g1 -3.73 cation channel membrane
apolipoprotein E(Apo-E) c85127_g1 -2.24 lipid transport extracellular region
apolipoprotein B(Apo-B) c103605_g1 -2.38 lipid transport extracellular region
apolipoprotein C(Apo-C) c186781_g1 -4.75 lipid transport extracellular region
transient receptor potential cation
channel, subfamily M, member 5 (trpm5)
c99386_g1 -3.73 cation channel membrane
Na+-K+-2Cl-contransporter (nkcc2) c99411_g1 -7.59 transmembrane transport membrane
solute carrier family 2, facilitated glucose
transporter member 5-like(slc2a5,
GLUT5)
c97450_g1 -2.8 glucose transport integral component
of membrane
solute carrier family 43 member 3-like
(slc43a3)
c105513_g1 2.41 transmembrane transport integral component
of membrane
solute carrier family 39 zinc transporter
member 4(slc39a4)
c87485_g1 -2.6708 transmembrane transport membrane
Energy
metabolism
Glycerophosphodiester
phosphodiesterase
c99721_g1 -4.74 lipid metabolic process - - - - -
adipose triglyceride lipase(ATGL) c104357_g1 -2.69 lipid metabolic process nucleus
Glycerophosphoinositol
inositolphosphodiesterase GDPD
c100119_g1 -3.66 lipid metabolic process membrane
Phosphoinosidtide-specific
phospholipase(PI-PLC X)
c95974_g1 7.473 lipid metabolic process membrane
tyrosine-protein phosphatase non-
receptor type substrate 1-like
c186781_g1 -4.75 lipoprotein metabolic
process
extracellular region
Serine proteinase inhibitor c101702_g1 -4.85 sucrose metabolic process glucosidase II
complex
betaine-homocysteine S-
methyltransferase
c80342_g1 3.053 methionine metabolic
process
- - - - -
acidic mammalian chitinase-like c1493_g1 -5.37 carbohydrate metabolic
process
extracellular region
Stimulator of interferon genes protein c99919_g1 3.44 carbohydrate metabolic
process
DNA polymerase
complex
G-protein coupled receptor 112-like c99494_g1 -4.6 lipid metabolic process membrane
transmembrane protease serine 9-like c99970_g1 -3.68 proteolysis - - - -
cytochrome P450, family 2 c104946_g2 3.348 oxidation-reduction process - - - - -
(Continued)
RNA-Seq of salinity regulated liver transcriptome in spotted sea bass
PLOS ONE | DOI:10.1371/journal.pone.0173238 March 2, 2017 8 / 18

Table 4. (Continued)
Functional group Gene name Gene ID log2FoldChange
(LS vs HS)
Gene function Cellular component
L-amino-acid oxidase-like c90095_g1 -3.26 fatty acid metabolic process cytoplasm
heme oxygenase-like c101847_g1 -3.32 oxidation-reduction process - - - - -
malate dehydrogenase(MDH) c94658_g1 -4.06 oxidation-reduction process - - - - -
chitinase c1493_g1 -5.3717 carbohydrate metabolic
process
extracellular region
acyl-CoA synthetase(ACSS, acs) c92990_g1 -2.869 Tricarboxylic acid cycle - - - - -
glucosidase II complex c49668_g1 3.894 carbohydrate metabolic
process
plasma membrane
Acetyl-CoA acetyltransferase c99741_g1 -2.6296 lipid biosynthetic process - - - - -
Signal
transduction
G-protein coupled receptor 64 c82122_g1 -5.655 G-protein coupled receptor
signaling
membrane
Obscurin-like protein 1 c103887_g1 4.0036 glucocorticoid receptor
signaling pathway
Nucleus
cadherin-17-like c98416_g1 -5.06 signal transduction extracellular region
transmembrane protease serine 13-like c94692_g2 -3.5349 signal transduction membrane
ATP P2X receptor c70881_g1 -4.1795 signal transduction membrane
protein phosphatase 1 regulatory subunit
12B-like
c96161_g1 -3.2971 signal transduction Golgi transport
complex
Kv channel-interacting protein 4-like c94733_g1 2.9938 signal transduction proteinaceous
extracellular matrix
ral guanine nucleotide dissociation
stimulator-like
c94958_g1 -4.6347 regulation of small GTPase
mediated signal
transduction
intracellular
signal transducer and activator of
transcription 1
c104292_g1 2.61 signal transduction nucleus
uromodulin-like c103623_g1 -8.43 signal transduction membrane
collagen alpha-1 c171794_g1 4.681 signal transduction intracellular
peptide Y c79092_g1 -4.225 signal transduction extracellular region
Brain-specific angiogenesis inhibitor
1-associated
c102414_g1 -3.72 signal transduction - - - - -
Bone sialoprotein II (BSP-II) c97890_g2 -3.46 signal transduction membrane
Hyaluronan-binding protein 2 c99450_g1 2.386 neuropeptide signaling
pathway
protein binding
protein Wnt-8b c17833_g1 3.1075 Wnt signaling pathway extracellular region
APJ endogenous ligand c96724_g1 3.015 signal transduction - - - - -
nuclear receptor ROR-beta-like c98760_g1 3.317 signal transduction nucleus
Immune response
CD63 antigen c91869_g1 -5.2891 immune response integral component
of membrane
complement C1q-like protein 2 c96181_g1 3.4958 immune response membrane
interleukin-20 receptor subunit alpha-like c186794_g1 3.57 immune response - - - - -
Colicin E1 (microcin) immunity protein c82286_g1 -8.5878 immune response immunoglobulin
complex
Heat-stable enterotoxin receptor c99469_g1 -3.2616 viral release from host cell host cell membrane
interlukin-8 c75114_g1 -2.7554 immune response extracellular region
interleukin-4 c100507_g1 -2.54 immune response extracellular region
(Continued)
RNA-Seq of salinity regulated liver transcriptome in spotted sea bass
PLOS ONE | DOI:10.1371/journal.pone.0173238 March 2, 2017 9 / 18

Validation of RNA-Seq results by qRT-PCR
To validate our Illumina sequencing results, ten differentially expressed genes between LS and
HS groups including four solute carrier family member genes (slc6a15, slc43a3, slc39a4,
slc5a8), annexin A2 (anxa2), aquaporin 3 (aqp3),G-protein coupled receptor 110 (gpr110), trans-membrane protease serine 13 (tmprss13), betaine-homocysteine S-methyltransferase-5 (bhmt5)
and interlukin-8 (IL8) were selected for qRT-PCR analysis. The results showed that the expres-
sion trends of those genes in qRT-PCR were significantly correlated with the RNA-Seq data
(R2 = 0.9607). On the whole, the RNA-Seq results were verified by the qRT-PCR data, indicat-
ing the reliability and accuracy of the Illumina sequencing and data analysis (Fig 1).
Discussion
The present study is the first whole-genome scale analysis of the transcriptome of spotted sea
bass, an important economical teleost which can tolerant to a broad range of salinity condi-
tions. This RNA-Seq project not only identifies potentially differentially expressed transcripts
between the two salinity environments, but also provides a large number of new annotated
gene sequences in spotted sea bass, a non-model specie without any reference genome for
which only a very limited number of sequences were available so far. Based on the next genera-
tion Illumina sequencing, a total of 197,550 transcripts were generated for L. maculates with
33,877 (17.15% of the total) can be matched in databases. This valuable sequence resource
largely enriched the transcriptome data and prompting the genome studies of spotted sea bass.
RNA-Seq analyses have been accepted as a robust approach to assess transcriptional
responses to different experimental conditions, especially in non-model organisms for which
no reference genome is available [17]. For salinity adaptation study, the comparison of tran-
scriptomic library constructed from the two salinity treatment groups enable identification of
Table 4. (Continued)
Functional group Gene name Gene ID log2FoldChange
(LS vs HS)
Gene function Cellular component
Structure
reorganization
claudin-15-like c11728_g1 -5.5747 structural molecule plasma membrane
claudin-4-like c10230_g1 -4.6235 structural molecule integral component
of membrane
MAM and LDL-receptor class A domain-
containing protein 1
c104114_g1 -4.28 protein binding membrane
claudin-8-lik c103303_g1 -2.7356 structural molecule integral component
of membrane
PTB domain-containing engulfment
adapter protein 1
c35439_g1 -4.26 protein binding - - - - - -
mucin-like protein c84121_g1 -4.14 protein binding - - - - - -
amphiregulin-like c88721_g1 -3.53 protein binding - - - - - -
myosin XV c102433_g1 -3.21 protein binding cytoskeleton
myosin VII c99077_g1 -5.2597 protein binding cytoskeleton
fer-1-like protein 4-like c103495_g2 -5.81 protein binding integral component
of membrane
alpha-tectorin c106780_g2 -5.2489 microtubule-based process microtubule
associated complex
intermediate filament family orphan 1-like c104224_g2 -2.9968 structural molecule intermediate
filament
doi:10.1371/journal.pone.0173238.t004
RNA-Seq of salinity regulated liver transcriptome in spotted sea bass
PLOS ONE | DOI:10.1371/journal.pone.0173238 March 2, 2017 10 / 18

hundreds of potentially differentially expressed genes. In recent years, RNA-Seq analysis has
been conducted in osmoregulatory organs (gill, intestine and kidney) for several kinds of tele-
ost. Those studies identified several potential genes and pathways involved in salinity change
[7,11, 32,33]. Although liver is not an osmoregulatory organ, it is the major source supplying
energy to osmoregulatory organs for iono- and osmoregulation. An adequate and timely
energy supply is a prerequisite for enzymes and transporters used in the iono- and osmoregu-
latory processes [20]. The energy required by the osmoregulatory organs is proved to be pro-
vided by oxidation of glucose and lactate generated from the circulation [20], and liver is the
major organ involved in glucose turnover in fish [21]. Despite the fact that liver metabolism is
likely enhanced during salinity adaptation, little is known about the reorganization of metabo-
lism in liver during this process in fish. In addition, previous studies about energy metabolism
in osmoregulation were focus on the physiological reaction of fish caused by osmotic pressure,
as well as the energy production and expenditure (eg., oxygen consumption and ammonia
excretion rates), but little was known in molecular level. In the present study, a total of 455
transcripts (with 184 up-regulated and 271 down-regulated) were identified differentially
expressed in liver tissue of L. maculates between LS group and HS group. The notable number
of salinity-dependent regulated genes in turn demonstrates the importance of liver in osmo-
regulation of spotted sea bass. We highlight several key constituents of categories and their
potential functions of salinity response below.
Energy metabolism
As we mentioned above, in order to maintain the homeostatic and osmotic balance, the iono-
and osmoregulatory processes are regulated by several kinds of transporters and enzymes, and
the synthesis and operation of these proteins requires a large amounts of energy [20]. There-
fore, it is not surprising that we found a number of L. maculates genes with a primary role in
energy metabolism were up-regulated under high salinity environment. Acetyl-CoA synthe-
tase (ACSS) and cytoplasmic malate dehydrogenase (MDH) genes, both of which code essential
Fig 1. qRT-PCR validation of 10 differentially expressed genes generated from RNA-Seq results in the liver of spotted sea bass. The expression
levels of the selected genes were each normalized to that of the 18S gene. Gene abbreviations are: slc6a15, solute carrier family 6 member 15; slc43a3,
solute carrier family 43 member 3; slc39a4, solute carrier family 39 member 4; slc5a8, solute carrier family 5 member 8; anxa2, annexin A2; aqp3,
aquaporin 3; gpr110, G-protein coupled receptor 110; tmprss13, transmembrane protease serine 13; bhmt5, betaine-homocysteine S-methyltransferase-
5; IL8, interlukin-8.
doi:10.1371/journal.pone.0173238.g001
RNA-Seq of salinity regulated liver transcriptome in spotted sea bass
PLOS ONE | DOI:10.1371/journal.pone.0173238 March 2, 2017 11 / 18

enzymes utilized in various metabolic pathways, showed up-regulation in L. maculates HS
group. ACSS catalyzes the ligation of acetate with CoA to produce acetyl-CoA, playing impor-
tant roles in fatty acid and cholesterol synthesis and tricarboxylic acid cycle [34]. MDH is an
important metabolic enzyme that reversibly catalyzes the oxidation of malate to oxaloacetate
by using the NAD/NADH coenzyme system. This reaction plays an important role in the
malate/aspartate shuttle across the mitochondrial membrane and in the tricarboxylic acid
cycle [35]. In our study, we can infer that in order to maintain the osmotic and ionic homeo-
stasis in the high salinity environment, the high expression levels of ACSS ensure that more
acetyl-CoA came from energy substance metabolism can entered the Krebs cycle and the high
expression of MDH promote the reaction continual. Besides, in our study, several genes
which are likely concerned with lipid metabolism and lipid transportation were also found in
DEG list. For example, Adipose triglyceride lipase (ATGL) is one of the major rate-limiting
enzymes which regulate lipid storage and release in the adipocyte [36]. Previous works have
discussed lipid metabolism in terms of fish osmoregulation as lipids are important energy
source in fish. In fat snook (Centropomus parallelus), the importance of lipids for meeting the
requirement of metabolism after long-term seawater (30 ppt) acclimation have been demon-
strated [37, 38].
Metabolites and ion transporters
Corresponding to the differential expressed genes engaged in energy production, a number of
genes with functions for transporting molecules involved in these metabolic processes stood
out as well. Along with the up-regulation of lipid metabolic enzyme mentioned above, lipid
transporters including apolipoprotein B (Apo-B), apolipoprotein C (Apo-C) and apolipopro-
tein E (Apo-E) were found up-regulated in liver of spotted sea bass in high salinity group. Apo-E has a prominent role in lipid metabolism because of its ability to interact with lipoprotein
receptors [39] and the same role for Apo-B which was found up-regulated in intestine of Dicen-trarchus labrax [40]. For glucose transportation, the GLUT family (a specific group of the SLCfamily, slc2a) was identified to transport monosaccharides, polyols and other small carbon
compounds across cell membranes which play a major role in glucose trafficking [20, 41]. In
liver of L. maculatus in HS group, we observed up-regulation of slc2a5/ GLUT5, which is the
key fructose transporter [42]. Another solute carrier gene, slc5a8 (SMCT), belonging to the Na
+/glucose co-transporter gene family, mediates a variety of mono-carboxylates including lac-
tate, short-chain fatty acids and nicotinate [43]. The monocarboxylate transporters, slc6a15family that involved in amino acid transport [44] and Na/Pi co-transport system protein
(slc34a,nptA) [45]which important for Pi homeostasis were also found in our DEG list, indicat-
ing they may be involved in liver osmoregulation under salinity stress.
In teleost fish, osmotic balance is maintained by coordinated water and ion transport in
the intestine, gill and kidney [46]. Although the liver is not an osmoregulartory organ, several
classical ion transporters were found in our DEG list, such as Na+-K+-2Cl-contransporter
(nkcc2), transient receptor potential cation channel subfamily M member 5 (trmp5), ATP-sen-
sitive inward rectifier potassium channel (kcnj15 and kcnj16), and aquaporin 3 (aqp3), all of
which were significantly up-regulated expressed in high salinity group (Table 4). These ion
transporters were extensively studied for their roles in osmoregulatory organs [47–50]. Results
showed that expression trend of those genes in L. maculates liver were in general agreement
with previously reports on these gene’s roles in fishes’ osmoregulatory organs with one excep-
tion, aqp3 expression has been found decreased in response to high salinity challenge in many
teleost species [51–53], such a discrepancy may result from the different studied species and
tissues.
RNA-Seq of salinity regulated liver transcriptome in spotted sea bass
PLOS ONE | DOI:10.1371/journal.pone.0173238 March 2, 2017 12 / 18

Signal transduction
Adaptive and acclamatory responses of fish to salinity stress depend on efficient mechanisms
of osmosensing and osmotic stress signaling [54]. Instead of directly coupling osmosensors to
osmotic effector proteins, large scale osmoregulatory mechanisms are operated by linking
molecular osmosensors to cell signaling pathways to initiate adaptive reactions [55]. Cellular
signaling pathways are activated by lig-and-receptor binding and are propagated through a
number of transducer proteins via phosphorylation or dephosphorylation events [55]. In that
case, osmosensory signals are not only quickly transduced within cells but also can be ampli-
fied and distributed to many types of downstream osmotic effectors [54, 55]. In our results, we
found several genes involved in signals transduction were differentially expressed between LS
and HS groups (Table 4), such as G-protein coupled receptor 64, cadherin-17-like, ATP P2X
receptor, transmembrane protease serine 13-like and Kv channel-interacting protein 4-like
which are potential osmotically regulated signaling proteins in L. maculates. They may have
important functions in osmo-regulated signaling cascades which are used to amplify or deliver
osmosensory signals, and then modify the functional properties of a variety of downstream
osmotic effectors.
Immune response
It is generally accepted that stresses depress the functions of the immune system in humans
[56]. This connection between stresses and immune system is particularly evident in lower ver-
tebrates [57]. In fish species, a number of immune changes have also been described after dif-
ferent kinds of stress treatment, and those studies suggested that the stress response will
depend on the intensity of the stressor and its duration [57]. Recent work proved that if the
stressor is acute and short-time, the fish immune response presented an activating phase that
specially enhances innate immune responses. On the contrary, if the stressors are chronic and
long-time, the immune response shows depressing effects and therefore the chances of infec-
tion may be enhanced [57]. Correspondingly, we found that several DEGs in liver transcrip-
tome of spotted sea bass were classified into the immune system. For example, complement
C1q-like protein 2, one of members in the complement system, helping destroy the pathogens
and eliminate the infection, showed significantly higher expressed in LS than HS groups
(Table 4). Similarity, in Asian seabass (Latescal carifer), complement C1q-like protein 2-like
showed significant down-regulation after high salinity challenge [18]. Interleukin-8, a major
pro-inflammatory cytokines which play a vital role in initiation of inflammatory responses
against bacterial- and viral-infections [58], also showed differentially regulated between LS
and HS groups (Table 4). Interleukin-8 was also observed appearing on the DEGs list of Asian
seabass after long-time salinity challenge [18]. It may be assumed that the effects caused by
chronic stressors have been mostly associated to the activity of the corticosteroid stress hor-
mones of the hypothalamic-pituitary-interrenal axis, and in particular cortisol [57]. Further
studies should be carried out to illustrate the mechanisms of immune responses linked to the
salinity stress.
Structure reorganization
Hyper or hypo-osmotic stress leads to cell shrinkage and swelling. In that case, cytoskeletal
organization is notably affected by perturbations in cell volume, thus cytoskeletal proteins
have been considered as putative osmosensors [59]. It is believed that cytoplasm’s osmotic
strength by reorganizing the cytoskeleton structure may reflect an attempt to regain osmotic
balance [60]. Correspondingly, in L. maculates liver, genes encoding multiple structural
RNA-Seq of salinity regulated liver transcriptome in spotted sea bass
PLOS ONE | DOI:10.1371/journal.pone.0173238 March 2, 2017 13 / 18

components of the cytoskeleton were also exhibit different expression patterns between LS
and HS group (Table 4).
The validation results of qRT-PCR indicate the reliability and accuracy of NGS data. While
both observations of NGS and qRT-PCR are limited to transcriptional level, it provides insight
into future studies aimed at characterizing and comparing the contributions of salinity regu-
lated genes in osmoregulatory and non-osmoregulatory organs to salt and water balance dur-
ing salinity acclimation.
In conclusion, the research on salinity adaptation and the response to salinity stress has
been long of interest not only for the important physiological significance but also for the
practical application in aquaculture. Our study successfully obtained 455 differentially
expressed genes in the liver of L. maculatus exposed to two salinity concentrations (5 and
30ppt). Those salinity regulated genes are associated with metabolites and Ion transporters,
energy metabolism, signal transduction, immune response and structure reorganization sug-
gesting the important role of liver for osmoregulation and salinity adaptation. The gene
expression patterns and pathways provide insight into understanding the molecular mecha-
nism of salinity acclimation and osmoregulation as well as the response to salinity stress for
aquatic species.
Supporting information
S1 Appendix. Primers used for quantitative Real-Time PCR (qRT-PCR) validations.
(DOCX)
S2 Appendix. Annotation and functional classification of transcripts in liver of spotted sea
bass. A). Top-hit species distribution of BLASTX matches of assembled transcripts. B).
Function annotation of assembled transcripts based on Gene Ontology (GO) analysis. C).
Classification of assembled transcripts based on the euKaryotic Ortholog Groups (KOG)
database. D). Pathway assignment based on the Kyoto Encyclopedia of Genes and
Genomes (KEGG) database. Transcripts were assigned to five main categories (that include
(A) cellular process, (B) environmental information processing, (C) genetic information pro-
cessing, (D) metabolism and (E) organismal systems).
(TIF)
S3 Appendix. Volcano plot for the differentially expressed genes shows the estimated log2
(fold change) (x-axis) against its statistical significance (y-axis) between LS and HS groups.
Using the cutoff adjusted-p value of 0.05 (-log10 (adjusted-p value) = 1.3), a total of 455 DEGs
from the upper left region (in green color, means the expressions of 271 transcripts are lower
in LS group than those in HS group) and the upper right region (in red color, means the
expressions of 184 transcripts are higher in LS group than those in HS group) are selected.
Genes that have the adjusted-p value larger than 0.05 (in blue color) indicated there are no dif-
ferentially expression between the two groups.
(TIF)
S4 Appendix. Information of 455 differential expressed genes between LS and HS groups.
(XLS)
S5 Appendix. GO enrichment analysis of the differentially expressed genes between LS and
HS groups in the liver of spotted sea bass.
(TIF)
RNA-Seq of salinity regulated liver transcriptome in spotted sea bass
PLOS ONE | DOI:10.1371/journal.pone.0173238 March 2, 2017 14 / 18

Acknowledgments
We would like to acknowledge the contributions of several other people to this work. We
would like to thank Doumen district river fishery research institute for contributing fish sam-
ples, Kaiqiang Zhang and Yang Liu for their helps with samples collection. We appreciate the
sequencing services of Novogene (Beijing, China).
Author Contributions
Conceptualization: XZ HSW YL.
Data curation: XZ YL.
Formal analysis: JZ.
Funding acquisition: YL.
Investigation: YL.
Methodology: XZ HLW JZ YR.
Project administration: XZ HSW YL.
Resources: HSW YL.
Software: XZ YR JZ.
Supervision: HSW YL.
Validation: XZ JZ.
Visualization: XZ.
Writing – original draft: XZ.
Writing – review & editing: XZ YL.
References1. Rubio V, Sanchez-Vazquez F, Madrid J. Effects of salinity on food intake and macronutrient selection in
European sea bass. Physiol Behav. 2005; 85: 333–339. doi: 10.1016/j.physbeh.2005.04.022 PMID:
15932763
2. Jung D, Sato JD, Shaw JR, Stanton BA. Expression of aquaporin 3 in gills of the Atlantic killifish (Fundu-
lus heteroclitus): Effects of seawater acclimation. Comp Biochem Phys A. 2012; 161: 320–326.
3. Kim YU, Myoung JG, Kim YS, Han KH, Kang CB, Kim JK, et al. The marine fishes of Korea. Hanguel,
Pusan. 2001. p222.
4. Shao C, Chen S, Xu G, Liao X, Tian Y. Eighteen novel microsatellite markers for the Chinese sea
perch, Lateolabrax maculatus. Conserv Genet. 2009; 10: 623–625.
5. Du T, Huang Y, Qin X Y, Zhang G L. Difference analysis on growth characteristic of one year old Lateo-
labrax Japonicus cultured at different salinity. Oceanologia et Limnologia Sinica. 2013; 44: 337–341 (In
English abstract).
6. Giffard-Mena I, Boulo V, Aujoulat F, Fowden H, Castille R, Charmantier G, et al. Aquaporin molecular
characterization in the sea-bass (Dicentrarchus labrax): the effect of salinity on AQP1 and AQP3
expression. Comp Biochem Phys A.2007; 148: 430–444.
7. Ronkin D, Seroussi E, Nitzan T, Doron-Faigenboim A, Cnaani A. Intestinal transcriptome analysis
revealed differential salinity adaptation between two tilapiine species. Comp Biochem Phys D.2015;
13: 35–43.
8. Gao T, Zhang X, Chen D, Zhang M, Ren Y, Zhang Y. Study on mitochondrial DNA cytochrome b gene
of Chinese sea bass, Lateolabrax sp. J. Ocean Univ. China, 2000; 31: 185–189.
9. Hwang PP, Lee TH. New insights into fish ion regulation and mitochondrion-rich cells. Comp Biochem
Phys A. 2007; 148: 479–497.
RNA-Seq of salinity regulated liver transcriptome in spotted sea bass
PLOS ONE | DOI:10.1371/journal.pone.0173238 March 2, 2017 15 / 18

10. Tseng YC, Hwang PP. Some insights into energy metabolism for osmoregulation in fish. Comp Bio-
chem Phys C. 2008; 148: 419–429.
11. Nguyen TV, Jung H, Nguyen TM, Hurwood D, Mather P. Evaluation of potential candidate genes
involved in salinity tolerance in striped catfish (Pangasianodon hypophthalmus) using an RNA-Seq
approach. Mar Genomics. 2016; 25: 75–88. doi: 10.1016/j.margen.2015.11.010 PMID: 26653845
12. Sanchez CC, Weber GM, Gao G, Cleveland BM, Yao J, Rexroad CE. Generation of a reference tran-
scriptome for evaluating rainbow trout responses to various stressors. Bmc Genomics. 2011; 12: 1.
13. Thanh NM, Jung H, Lyons RE, Chand V, Tuan NV, Thu VT. A transcriptomic analysis of striped catfish
(Pangasianodon hypophthalmus) in response to salinity adaptation: De novo assembly, gene annota-
tion and marker discovery. Comp Biochem Phys D. 2014; 10: 52–63.
14. Ji P, Liu G, Xu J, Wang X, Li J, Zhao Z. Characterization of Common Carp Transcriptome: Sequencing,
De Novo Assembly, Annotation and Comparative Genomics. PloS one. 2012; 7: e35152. doi: 10.1371/
journal.pone.0035152 PMID: 22514716
15. Marguerat S, Bahler J. RNA-seq: from technology to biology. Cell Mol Life Sci.2010; 67: 569–579. doi:
10.1007/s00018-009-0180-6 PMID: 19859660
16. Lai KP, Li JW, Wang SY, Chiu JM, Tse A,Lau K. Tissue-specific transcriptome assemblies of the marine
medaka Oryzias melastigma and comparative analysis with the freshwater medaka Oryzias latipes.
BMC Genomics. 2015; 16: 1.
17. Thanh NM, Jung H, Lyons RE, Njaci I, Yoon BH, Chand V. Optimizing de novo transcriptome assembly
and extending genomic resources for striped catfish (Pangasianodon hypophthalmus). Mar Genomics.
2015; 23: 87–97. doi: 10.1016/j.margen.2015.05.001 PMID: 25979246
18. Xia JH, Liu P, Liu F, Lin G, Sun F, Tu R. Analysis of stress-responsive transcriptome in the intestine of
Asian seabass (Lates calcarifer) using RNA-seq. DNA Res. 2013; 20: 449–460. doi: 10.1093/dnares/
dst022 PMID: 23761194
19. Das M, Banerjee B, Choudhury M G, et al. Environmental Hypertonicity Causes Induction of Gluconeo
genesis in the Air-Breathing Singhi Catfish, Heteropneustesfossilis[J]. PloS one, 2013, 8: e85535. doi:
10.1371/journal.pone.0085535 PMID: 24376888
20. Tseng Y-C, Hwang P-P. Some insights into energy metabolism for osmoregulation in fish. Comp Bio-
chem Phys C.2008; 148: 419–429.
21. Sangiao-Alvarellos S, Laiz-Carrion R, Guzman JM, Mp MDR, Miguez JM, Mancera JM. Acclimation of
S aurata to various salinities alters energy metabolism of osmoregulatory and nonosmoregulatory
organs. Am J Physiol Regul Integr Comp Physiol.2003; 285: 897–907.
22. Sangiao-Alvarellos S, Arjona FJ, del Rıo MP, Miguez JM, Mancera JM, Soengas JL. Time course of
osmoregulatory and metabolic changes during osmotic acclimation in Sparus auratus. J Exp Biol. 2005;
208: 4291–4304. doi: 10.1242/jeb.01900 PMID: 16272252
23. Evans DH, Piermarini PM, Choe KP. The multifunctional fish gill: Dominant site of gas exchange, osmo-
regulation, acid-base regulation, and excretion of nitrogen waste. Physiol Rev. 2005; 85: 97–177. doi:
10.1152/physrev.00050.2003 PMID: 15618479
24. Grabherr MG, Haas BJ, Yassour M, Levin JZ, Thompson DA, Amit I. Full-length transcriptome assem-
bly from RNA-Seq data without a reference genome. Nat Biotechnol. 2011; 29: 644–652. doi: 10.1038/
nbt.1883 PMID: 21572440
25. Altschul SF, Madden TL, Schaffer AA, Zhang J, Zhang Z, Miller W. Gapped BLAST and PSI-BLAST: a
new generation of protein database search programs. Nucleic Acids Res.1997; 25: 3389–3402. PMID:
9254694
26. Gotz S, Garcıagomez JM, Terol J, Williams TD, Nagaraj SH, Nueda MJ. High-throughput functional
annotation and data mining with the Blast2GO suite. Nucleic Acids Res. 2008; 36: 3420–3435. doi: 10.
1093/nar/gkn176 PMID: 18445632
27. Kanehisa M, Araki M, Goto S, Hattori M, Hirakawa M, Itoh M. KEGG for linking genomes to life and the
environment. Nucleic Acids Res. 2008; 36: 480–484.
28. Langmead B, Salzberg SL. Fast gapped-read alignment with Bowtie 2. Nat Med.2012; 9: 357–359.
29. Li B, Dewey CN. RSEM: accurate transcript quantification from RNA-Seq data with or without a refer-
ence genome. Bmc Bioinformatics.2011; 12: 93–99.
30. Anders S, Huber W. Differential expression analysis for sequence count data. Genome Biol.2015; 11:
1–12.
31. Young MD, Wakefield MJ, Smyth GK, Oshlack A. Gene ontology analysis for RNA-seq: accounting for
selection bias. Genome Biol.2010; 11–14.
32. Cutler CP, Martinez AS, Cramb G. The role of aquaporin 3 in teleost fish. Comp Biochem Phys A. 2007;
148: 82–91.
RNA-Seq of salinity regulated liver transcriptome in spotted sea bass
PLOS ONE | DOI:10.1371/journal.pone.0173238 March 2, 2017 16 / 18

33. Malachowicz M, Kijewska A, Wenne R. Transcriptome analysis of gill tissue of Atlantic cod Gadus mor-
hua L. from the Baltic Sea. Mar Genomics. 2015; 23: 37–40. doi: 10.1016/j.margen.2015.04.005 PMID:
25913867
34. Fujino T, Kondo J, Ishikawa M, Morikawa K, Yamamoto TT. Acetyl-CoA synthetase 2, a mitochondrial
matrix enzyme involved in the oxidation of acetate. J. Biol. Inorg. Chem.2001; 276: 11420–11426.
35. Minarik P, Tomaskova N, Kollarova M, Antalik M. Malate dehydrogenases-structure and function. Gen
Physiol Biophys.2002; 21: 257–266. PMID: 12537350
36. Miyoshi H, Perfield JW 2nd, Obin MS, Greenberg AS. Adipose triglyceride lipase regulates basal lipoly-
sis and lipid droplet size in adipocytes. J Cell Biochem. 2008; 105: 1430–1436. doi: 10.1002/jcb.21964
PMID: 18980248
37. da Silva Rocha AJ, Gomes V, Van Ngan P, Rocha MJdAC, Furia RR. Metabolic demand and growth of
juveniles of Centropomus parallelus as function of salinity. J Exp Mar Biol Ecol.2005; 316: 157–165.
38. Rocha AJ, Gomes V, Ngan PV, Passos MJ, Furia RR. Effects of anionic surfactant and salinity on
the bioenergetics of juveniles of Centropomus parallelus (Poey). Ecotoxicol Environ Saf. 2007; 68:
397–404. doi: 10.1016/j.ecoenv.2006.10.007 PMID: 17597208
39. Poupard G, Andre M, Durliat M, Ballagny C, Boeuf G, Babin PJ.Apolipoprotein E gene expression corre-
lates with endogenous lipid nutrition and yolk syncytial layer lipoprotein synthesis during fish develop-
ment. Cell Tissue Res.2000; 300: 251–261. PMID: 10867821
40. Boutet I, Long Ky CL, Bonhomme F. A transcriptomic approach of salinity response in the euryhaline tel-
eost, Dicentrarchus labrax. Gene. 2006; 379: 40–50. doi: 10.1016/j.gene.2006.04.011 PMID:
16737785
41. Mueckler M, Thorens B. The SLC2 (GLUT) family of membrane transporters. Mol Aspects Med. 2013;
34: 121–138. doi: 10.1016/j.mam.2012.07.001 PMID: 23506862
42. Du L, Heaney AP. Regulation of adipose differentiation by fructose and GluT5. Molecular Endocrinol.
2012; 26: 1773–1782.
43. Halestrap AP. Monocarboxylic acid transport. Compr Physiol.2013; 3: 1611–1643. doi: 10.1002/cphy.
c130008 PMID: 24265240
44. Cacabelos R. Epigenetics of Brain Disorders:The Paradigm of Alzheimer’s Disease. J Alzheimers Dis
Parkinsonism 2016; 6: 2161–0460.
45. Forster IC, Hernando N, Biber J, Murer H. Phosphate transporters of the SLC20 and SLC34 families.
Mol Aspects Med.2013; 34: 386–395. doi: 10.1016/j.mam.2012.07.007 PMID: 23506879
46. Evans DH. Teleost fish osmoregulation: what have we learned since August Krogh, Homer Smith, and
Ancel Keys. Am J Physiol Regul Integr Comp Physiol.2008; 295: 704–713.
47. Scott GR, Richards JG, Forbush B, Isenring P, Schulte PM. Changes in gene expression in gills of the
euryhaline killifish Fundulus heteroclitus after abrupt salinity transfer. Am J Physiol Cell Physiol.2004;
287: 300–309.
48. Gregorio SF, Carvalho ES, Encarnacao S, Wilson JM, Power DM, Canario AV. Adaptation to different
salinities exposes functional specialization in the intestine of the sea bream (Sparus aurata L.). J Exp
Biol. 2013; 216: 470–479. doi: 10.1242/jeb.073742 PMID: 23038737
49. Welling PA, Ho K. A comprehensive guide to the ROMK potassium channel: form and function in health
and disease. Am J Physiol Renal Physiol. 2009; 297: 849–863.
50. McCormick SD. Influence of salinity on the localization of Na+/K+-ATPase, Na+/K+/2Cl- cotransporter
(NKCC) and CFTR anion channel in chloride cells of the Hawaiian goby (Stenogobius hawaiiensis). J
Exp Biol.2003; 206: 4575–4583. PMID: 14610041
51. Cutler CP, Cramb G. Branchial expression of an aquaporin 3 (AQP-3) homologue is downregulated in
the European eel Anguilla anguilla following seawater acclimation. J Exp Biol 2002; 205: 2643–2651.
PMID: 12151370
52. Deane EE, Woo NY. Tissue distribution, effects of salinity acclimation, and ontogeny of aquaporin 3 in
the marine teleost, silver sea bream (Sparus sarba). Mar Biotechnol.2006; 8: 663–671. doi: 10.1007/
s10126-006-6001-0 PMID: 16909214
53. Van TK, Van TV, Li W, Sorgeloos P, Bossier P, Nauwynck H. Effects of acute change in salinity and
moulting on the infection of white leg shrimp (Penaeus vannamei) with white spot syndrome virus upon
immersion challenge. J Fish Dis. 2016; 39: 1403–1412. doi: 10.1111/jfd.12471 PMID: 27135899
54. Fiol DF, Kultz D. Osmotic stress sensing and signaling in fishes. Febs Journal. 2007; 274: 5790–5798.
doi: 10.1111/j.1742-4658.2007.06099.x PMID: 17944942
55. Evans TG. Co-ordination of osmotic stress responses through osmosensing and signal transduction
events in fishes.J Fish Biol. 2010; 76: 1903–1925. doi: 10.1111/j.1095-8649.2010.02590.x PMID:
20557646
RNA-Seq of salinity regulated liver transcriptome in spotted sea bass
PLOS ONE | DOI:10.1371/journal.pone.0173238 March 2, 2017 17 / 18

56. Herbert TB, Cohen S. Stress and immunity in humans: a meta-analytic review. Psychosom Med.1993;
55: 364–379. PMID: 8416086
57. Tort L. Stress and immune modulation in fish. Dev Comp Immunol.2011; 35: 1366–1375. doi: 10.1016/
j.dci.2011.07.002 PMID: 21782845
58. Herath H, Elvitigala D, Godahewa GI, Umasuthan N, Whang I, Noh JK. Molecular characterization and
comparative expression analysis of two teleostean pro-inflammatory cytokines, IL-1β and IL-8, from
Sebastes schlegeli. Gene.2015; 575: 732–742. doi: 10.1016/j.gene.2015.09.082 PMID: 26449313
59. Pedersen SF, Hoffmann EK, Mills JW. The cytoskeleton and cell volume regulation. Comp Biochem
Phys A.2001; 130: 385–399.
60. Liu S, Wang X, Sun F, Zhang J, Feng J, Liu H, et al. RNA-Seq reveals expression signatures of genes
involved in oxygen transport, protein synthesis, folding, and degradation in response to heat stress in
catfish. Physiol Genomics. 2013; 45: 462–476. doi: 10.1152/physiolgenomics.00026.2013 PMID:
23632418
RNA-Seq of salinity regulated liver transcriptome in spotted sea bass
PLOS ONE | DOI:10.1371/journal.pone.0173238 March 2, 2017 18 / 18