RMI2 associates with RMI1 and Topoisomerase 3α in two ...
13
GENESDEV/2008/105015, Supplementary Figure 1, Xu et al. RMI2 RPA14 BLM RMI2 Topo 3α RMI1 RPA70 RPA32 RMI1 IP Complex1 Complex2 Complex2 -BLM NE Topo 3α RMI1 B 1 2 3 4 BLAP250 BLM Topo 3α RMI1 RMI2 RPA70 RPA32 Complex1 Complex2 Complex2 -BLM NE Complex1 Complex2 Complex2 -BLM NE Input RMI1 IP C BLM Topo 3α RMI1 RMI2 Load 16 17 18 19 20 21 22 23 24 25 26 27 28 29 30 31 32 33 34 670 kDa 440 kDa Void Complex1 Complex2 A 66 kDa 1 2 3 4 5 6 7 8 Legend. (A) Immunoblotting shows that RMI2 in HeLa nuclear extract fractionates in 2 major peaks by Superose 6 gel-filtration chromatography, which correspond to two complexes designated as Complex 1 and 2 (marked by arrows on top). Notably, the elution profiles of RMI2, RMI1 and Topo 3α are coincident, suggesting that they always associate in complexes. In addition, BLM overlaps with the peak of complex 1 but not complex 2, suggesting that BLM is absent in complex 2. (B)(C) Silver-stained SDS gels (B), and immunoblotting (C), show that while Complex 1 contains all BLM complex components, complex 2 consists of only Topo 3α, RMI1 and RMI2. Immunoprecipitation was done by using RMI1 antibody from crude nuclear extract (NE), fractions containing either Complex 1 or Complex 2, or Complex 2-containing fractions after immuno-depletion of BLM (Complex 2-BLM), as indicated on top of the figure. Notably, RMI1 co-immunoprecipitated with Topo 3α and RMI2 but not BLM (lane 4 in B; lane 8 in C), indicating that the two RMI proteins and Topo 3α form a stable subcomplex. RMI2 associates with RMI1 and Topoisomerase 3α in two different complexes: one contains BLM and the other one does not
Transcript of RMI2 associates with RMI1 and Topoisomerase 3α in two ...

GENESDEV/2008/105015, Supplementary Figure 1, Xu
et al.
RMI2RPA14
BLM
RMI2
Topo 3αRMI1
RPA70
RPA32
RMI1 IP
Com
plex
1Co
mpl
ex2
Com
plex
2-B
LM
NE
Topo 3αRMI1
B
1 2 3 4
BLAP250 BLM
Topo
3α
RMI1
RMI2
RPA70
RPA32
Com
plex
1Co
mpl
ex2
Com
plex
2-B
LM
NE Com
plex
1Co
mpl
ex2
Com
plex
2-B
LM
NE
Input RMI1 IPC
BLM
Topo 3α
RMI1
RMI2
Load 16 17 18 19 20 21 22 23 24 25 26 27 28 29 30
31 32 33 34
670 kDa 440 kDaVoid
Complex1 Complex2A
66 kDa
1 2 3 4 5 6 7 8
Legend. (A) Immunoblotting shows that RMI2 in HeLa nuclear extract fractionates in 2 major peaks by Superose 6 gel-filtration chromatography, which correspond to two complexes designated as Complex 1 and 2 (marked by arrows on top). Notably, the elution profiles of RMI2, RMI1 and Topo 3α
are coincident, suggesting that they always associate in complexes. In addition, BLM overlaps with the peak of complex 1 but not complex 2, suggesting that BLM is absent in complex 2. (B)(C) Silver-stained SDS gels (B), and immunoblotting (C), show that while Complex 1 contains all BLM complex components, complex 2 consists of only Topo 3α, RMI1 and RMI2. Immunoprecipitation was done by using RMI1 antibody from crude nuclear extract (NE), fractions containing either Complex 1 or Complex 2, or Complex 2-containing fractions after immuno-depletion of BLM (Complex 2-BLM), as indicated on top of the figure. Notably, RMI1 co-immunoprecipitated with Topo 3α
and RMI2 but not BLM (lane 4 in B; lane 8 in C), indicating that the two RMI proteins and Topo 3α
form a stable subcomplex.
RMI2 associates with RMI1 and Topoisomerase 3α in two different complexes: one contains BLM and the other one does not
humRMI1-OB1 TTNDLVTAEAQVTPKPWEAKPSRMLMLQLTDGIVQIQGMEYQPIPILHSDLPPGTKILIY 60musRMI1-OB1 TTNDLVSAETQSTPKPWEVRPSRMLMLQLTDGVTHIQGMEYQSIPALHSGLPPGTKILVH 60galRMI1-OB1 TVNEEVTANTQAFQKPWEAKPTRMLMLQLTDGIHQIQGMEYQPVPVLHSNLPPGTKITVH 60xenRMI1-OB1 STNEQVTCTTQQSQKPWEAKPTRMLMLQLTDGTQHIQAMEYRPIQALNANLSPGTKMVLQ 60danRMI1-OB1 CSNDQVSAVTQETQRPWEAKPTRMLMLQLTDGVQNLEGMEYRPIPALNANLPPGTKLQLV 60comRecG-wedge ---ETVQIEATVTHSEVQLRPRRMLKVTVDDGSSTCVLTFFSFYPSQQKTMAPGARLRIR 57delRecG-wedge ---DTVQIEATVTHSEVQLRPRRMLKVTVDDGTAECVLTFFSFYPSHQKTLSVGARLRIR 57eschRecG-wedge -----ATVEGEVLNCNISFGGRRMMTCQISDGSGILTMRFFNFSAAMKNSLAAGRRVLAY 55spRMI1-OB --DDGLTEAQDAVQKGSELKKMCRLILEDSNG-QRFWGLERKPIKGIQLSTKLGTKLLVK 57scRMI1-OB DNNCAKENNSNNNSSAAKNKAVFKLTLQSKSG-DVFFAINSTPIS--WSSCMLGSKIVIL 40
humRMI1-OB1 GNISFRL-GVLLLKPENVKVLGGEVDALLE-------EYAQEKVLAR---LIGEPDLVVS 109musRMI1-OB1 GCILFRL-GVLLLKPENVKVLGGEVDGLSE-------ENAQEKVLAR---LIGELDPTVP 109galRMI1-OB1 GNVAYRL-GVLLLKPENVKLLGGEVDALLE-------EYSQERVLAR---LLGEAENPDS 109xenRMI1-OB1 GTIVCRL-GVLLLKPENVKVLGGEVEALVA-------EYTQTKVLSR---LIGVEDNTVA 109danRmi1-OB1 GPIAVRL-GVLLLKAENIKVLGGEVEQLLE-------IHSQSRVLCG---TLGLPEETHP 109comRecG-wedge GEVKGGFWGRQMMHP-AFRVAGGELP---------------------------------- 82delRecG-wedge GEVKGGFWGRQMLHP-AFRAAGGDLPTALT-------PVYPT--VAG---LPQAYIRRAA 104eschRecG-wedge GEAKRGKYGAEMIHP-EYRVQGDLSTPELQ-------E---------------------- 85spRMI1-OB -NVLVRR-GVLMLDPNNTTILGGSIEEWDK-------DYFPKRLIEE---LKGELSKTKA 105scRMI1-OB PGTVFNR-GVFILKDSQVIFLGGINRVWNENRDQKFCDYLESKLQRDKQLVNGGSKKRKA 99
β1 β2 β3 β4
β5
The RMI1-OB1 domain has sequence similarityto the “Wedge” domain of bacterial RecG helicase
GENESDEV/2008/105015, Supplementary Figure 2, Xu et al.
Legend. Sequence alignment of RMI1-OB1 domain with the wedge domain of RecG helicase. The 5 predicted β-strands of OB-folds are underlined with arrows. The identical and conserved residues are highlighted with red and yellow, respectively. Green highlights residues only conserved in some OB1 and wedge domains. Solid arrow indicates a highly conserved aromatic residue which is important for DNA binding activity of the Wedge domain and also conserved inRMI1-OB1. An empty arrow indicates another aromatic residue critical for DNA binding activity of RecG but notconserved in RMI1. The abbreviations for RMI1 proteins are shown in Fig. 2 Legend.

Moc
k71
2.5
356.
2517
8.13
89.0
644
.53
22.2
711
.13
5.57
2.78
1.39
0.7
0.35
0.17
0.09
0.04
0.02
0.00
22.5 nM
hTOPO3α
+ 10 nM
BLM +
nM
hRMI1-hRMI2(WT)
*
RsaI
HhaI
*
Moc
k50
025
012
562
.531
.25
16.6
37.
813.
911.
950.
980.
490.
240.
120.
060.
030.
020.
00
22.5 nM
hTOPO3α
+ 10 nM
BLM +
nM
hRMI1-hRMI2(K121A)
*
RsaI
HhaI
*
Moc
k
hRM
I2 o
nly
2500
hTO
PO3α
only
1250
625
312.
515
6.3
78.1
39.1
19.5
9.8
0.00
22.5 nM
hTOPO3α
+ 66 nM
BLM +
nM
hRMI2BLM
only
*
RsaI
HhaI
*
Moc
k57
028
514
2.5
71 35.6
17.8
8.9
4.5
2.23
1.11
0.56
0.28
0.14
0.07
0.03
0.02
0.00
22.5 nM
hTOPO3α
+ 10 nM
BLM +
nM
hRMI1 (yeast)
*
RsaI
HhaI
*
RMI1-RMI2 wildtype and RMI1-RMI2(K121A) mutant complexes have similar activity in stimulating double-Holliday Junction dissolution compared to RMI1 alone; RMI2 displays no detectable activity
GENESDEV/2008/105015, Supplementary Figure 3, Xu et al.
A B
D C
Legend. Audioradiographs showing stimulation of double-Holliday Junction (dHJ) dissolution by the recombinant RMI1-RMI2 wildtype complex (A), RMI1 purified from yeast (B), and RMI2 (C), and the RMI1-RMI2 (K121A) mutant complex (D). The
presence of BLM and Topo 3α
is indicated on top. The dHJ substrate and the resolved product are shown on the right.
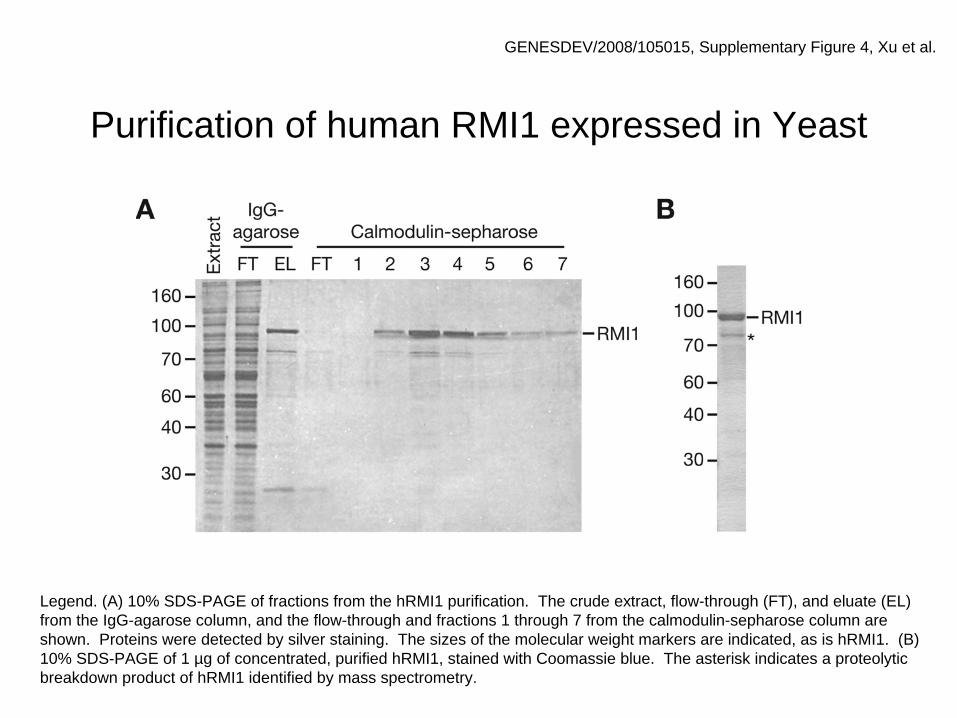
Purification of human RMI1 expressed in Yeast
GENESDEV/2008/105015, Supplementary Figure 4, Xu et al.
Legend. (A) 10% SDS-PAGE of fractions from the hRMI1 purification. The crude extract, flow-through (FT), and eluate (EL) from the IgG-agarose column, and the flow-through and fractions 1 through 7 from the calmodulin-sepharose column are shown. Proteins were detected by silver staining. The sizes of the molecular weight markers are indicated, as is hRMI1. (B) 10% SDS-PAGE of 1 µg of concentrated, purified hRMI1, stained with Coomassie blue. The asterisk indicates a proteolytic breakdown product of hRMI1 identified by mass spectrometry.

Purified recombinant RMI2 and the RMI complex containing either wildtype or K121A mutant of RMI2 from bacteria
K121A
RMI1
RMI2
WTMW
200
11697
66
45
31
2114
RMI1-RMI2complex
GENESDEV/2008/105015, Supplementary Figure 5, Xu et al.
Legend. (A) A Coomassie gel showing recombinant RMI2 protein purified from E.coli. (B) A Coomassie gel showing recombinant RMI complex containing either wildtype (WT) or K121A mutant of RMI2 purified from E.coli. The molecular weight markers (MW, in KDa) were included.
BA
20011697
66
45
31
21
14
MW RMI2
RMI2
Background
Well
10 30 100
300
1 3
RPA (30 nM)RMI (1 µM)
10 30 100
300
1 310 30 100
300
1 3ssDNA (nM)
None
*
RPA-ssDNAcomplexes
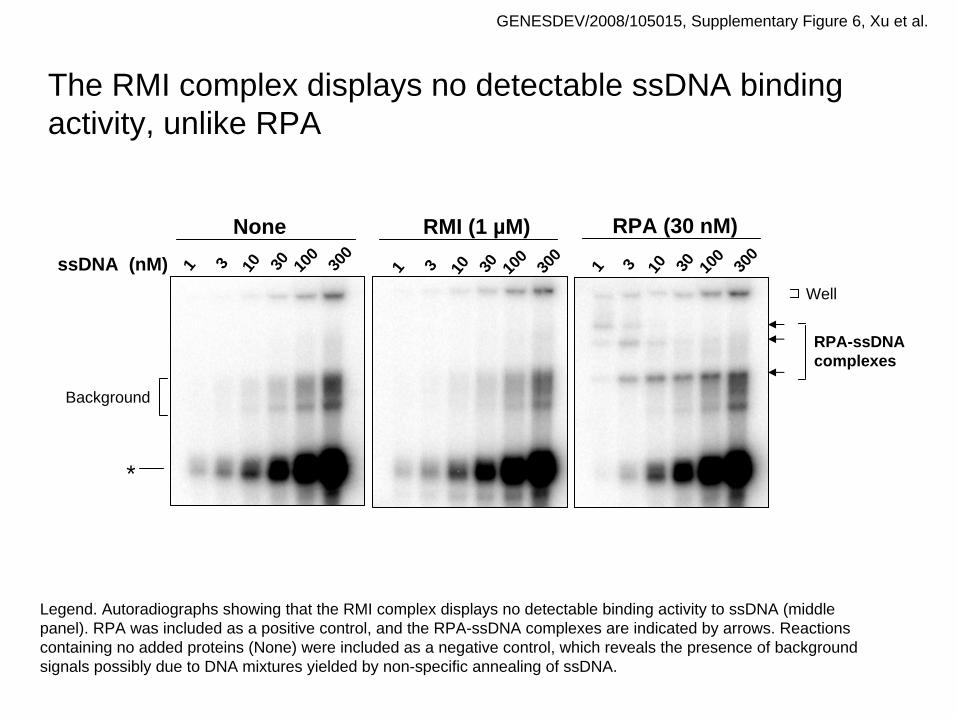
The RMI complex displays no detectable ssDNA binding activity, unlike RPA
GENESDEV/2008/105015, Supplementary Figure 6, Xu et al.
Legend. Autoradiographs showing that the RMI complex displays no detectable binding activity to ssDNA (middle panel). RPA was included as a positive control, and the RPA-ssDNA complexes are indicated by arrows. Reactions containing no added proteins (None) were included as a negative control, which reveals the presence of background signals possibly due to DNA mixtures yielded by non-specific annealing of ssDNA.

GENESDEV/2008/105015, Supplementary Figure 7, Xu et al.
The RMI2-deficient DT40 cells differ from the BLM-deficient cells in that they lack hypersensitivity to DNA damage drugs
Legend. (A) and (B) Histograms showing sensitivity of DT40 cells with various genotypes to cisplatin and methyl methanesulfonate (MMS). Mean and standard deviation from three independent experiments are shown. (C) A histogram showing growth curves of cells of various genotypes as indicated with different color codes. Cells were counted by flow cytometry, and at least three independent experiments are performed.
Cisplatin (nM)
Sur
viva
l (%
)
MMS (10-6 v/v)S
urvi
val (
%)
A B
C
Time (hours)
Cum
ulat
ive
cell
num
ber
0
20
40
60
80
100
0 50 100 150 200
0
20
40
60
80
100
0 4 8 12 16
0
200
400
600
800
0 24 48 72
WildtypeBLM-/-
RMI2-/- clone 1RMI2-/- clone 2BLM-/-/RMI2-/- clone 1BLM-/-/RMI2-/- clone 2

Supplementary Methods Xu et al. Page 1
Supplementary Methods
Immunofluorescence
Indirect immunofluorescence was carried out as described before (Meetei et al., 2003).
HeLa cells grown on chamber slides were washed with phosphate-buffered saline (PBS),
fixed with 3.7% paraformaldehyde, permeabilized with PBS containing 0.2% Triton X-
100 and blocked with a solution of 7.5% BSA in PBS. Primary and secondary antibodies
were diluted in PBS containing 0.5% BSA. Cells were incubated in primary antibody
(1:5000 for RMI1 (rabbit), 1: 300 for Flag (mouse, M2, Sigma), 1:1500 BLM (rabbit))
for 1h at 4ºC. Following five 5-min washes with PBS, secondary antibody was added at
1:1000 (Alexa Fluor 594-conjugated goat anti-rabbit and Alexa Fluor 488-conjugated
goat anti-mouse; Molecular Probes). Nuclei were counterstained with Hoechst 33342 dye
(Molecular Probes). The cells were mounted with anti-fade mounting solution
(Vectashield, Vector Laboratories). For statistical analysis of nuclear foci formation,
wide-field images were taken using a Nikon TE800 microscope with an Optronics
DEI750 camera. Images were processed using Adobe Photoshop 7.0. To analyze
colocalization of two proteins in nuclear foci, deconvolution images were acquired with
the Applied Precision “Image Restoration System” with an inverted Nikon Eclipse
TE200 microscope and standard filter sets, and a CH350L camera and Delta Vision
software. Quantification of nuclear foci was carried out by capturing high-field images
containing up to 5-20 nuclei. Single nuclei were scored for RMI1 foci and BLM foci.
Statistical evaluation of foci-containing nuclei was performed using Microsoft Excel.
SCE analysis
Cells were incubated with 10 μM BrdU for two cell cycles (16-18 hours), and were
treated with 0.1 μg/ml Colcemid for the last 2 hours. After harvesting, cells were
incubated in 0.075 M KCl solution for 20 min, and then fixed in methanol and acetic acid
(3:1 ratio) for 30 min. Cells were dropped onto 50%-ethanol-wet slides and dried. They
were then incubated with 10 μg/ml Hoechst 33258 in phosphate buffer (pH 6.8) for 20
min. Slides were exposed to 352 nm black light for 30-60 min, followed by incubation in
2 x SSC at 62 °C for 1 hour. They were then stained using 3% Giemsa solution (pH 6.8)
for 10min.
Measurement of cellular hypersensitivity to MMS and cisplatin
Supplementary Methods Xu et al. Page 2
DT40 cells of different genotypes were plated in triplicates into 96-well plates at a density of
1500-3000 cells per well. They were then incubated with various concentrations of MMS or
cisplatin for 48 hours. Cells were pulsed with CellTiter 96 Aqueous One Solution Reagent
(Promega) between 1 to 4 hours. Cell viability was measured by luminometer.
Analysis of cell growth rate
DT40 cells of different genotypes were plated in 75-cm2 flasks at 3000 cells/ml in 20 ml fresh
medium, and cultured at 39.5 ºC for 3 days. Viable cells were determined every 24 hours using
the Guava ViaCount Reagent Kit (Guava Technologies, Inc.).
Purification of recombinant RMI complex from E.coli
RMI1 and RMI2 were co-expressed in E.coli (Rosetta2 cells, Novagen) using bi-cistronic
pCDFDuet1 vector. RMI1 was fused to a 6-histidine tag, whereas RMI2 was fused to a
strep-tag. Cells were grown at 30 ºC until log phase, and were induced with 0.3 mM
IPTG at 25 ºC for 2.5 hour. The cell pellet from 4-liter culture was lysed in 50 ml B-PER
buffer (PIERCE) supplemented with 5% glycerol, 200 units DNase I, protease inhibitor
cocktail and 1mM PMSF. The mixture was incubated at 25 ºC for 15 min and centrifuged
at 27,000×g for 30min. Ammonium sulfate precipitation was performed for the
supernatant. The pellet from 20-35% saturated ammonium sulfate was dissolved in 40ml
PBS (10 mM phosphate, pH7.4, 138mM NaCl and 2.7mM KCl) with 5% glycerol, and
incubated with 3 ml TALON metal affinity resin (BD Bioscience) at 4 ºC for 2 hours.
The resin was washed twice with 50 ml PBS containing 10mM imidazole and 5%
glycerol, and twice with 50 ml PBS containing 0.5 M NaCl and 5% glycerol. The resin
was then poured into a Biorad 5ml disposable column and the bound proteins were eluted
with 30 mM imidazole in TBS buffer (50 mM Tris-HCl, pH 7.5, 5% glycerol, 150mM
NaCl). The peak fractions were diluted 1:5 in Q buffer (25 mM Tris-HCl, pH 7.5, 5%
glycerol) and loaded on 1-ml Resource Q column (Pharmacia Biotech), which was
washed with 10ml Q buffer containing 100 mM NaCl and then eluted with a 10-ml
gradient of 100-500 mM NaCl in Q buffer. The peak fractions were pooled and loaded on
a 1-ml Hitrap Phenyl HP column (GE Healthcare) after adjusting NaCl concentration to
1.2 M. The proteins were eluted with a 10-ml gradient of 1.2-0 M NaCl in Q buffer. The
peak fractions were diluted 1:10 in Q buffer and loaded on a 1-ml Hitrap Heparin HP
culomn (GE Healthcare), which was washed with Q buffer containing 100mM NaCl and

Supplementary Methods Xu et al. Page 3
eluted with a 10-ml gradient of 100-500 mM NaCl in Q buffer. Peak fractions were
pooled and concentrated with a 10-kDa Amicon Ultra centrifugal filter device
(Millipore). The final protein yield is about 100 μg.
Purification of human RMI1 expressed in yeast
Growth and Induction
The hRMI1 cDNA (AK022950; NITE Biological Resource Center) was cloned into
p426-GAL1-TAP to generate the plasmid p426-Gal1-hRMI1-TAP, which expresses
RMI1 fused to the TAP tag (Rigaut et al., 1999) under the control of the GAL1 promoter.
The plasmid p426-GAL1-TAP is a derivative of p426-GAL1 (Mumberg et al., 1995) into
which sequences encoding the TAP tag from pBS1479 (Puig et al., 2001) have been
introduced. p426-Gal1-hRmi1-TAP was then transformed along with the plasmid pMTL4
(Puig et al., 2001) into the protease-deficient Saccharomyces cerevisiae strain BJ2168
(MATa, ura3-52, trp1-289, leu2-3, 112, prb1-1122, prc1-407, pep4-3). The transformed
strain was first grown overnight in 5 ml SD-leu-ura at 30°C, then 1 ml of the overnight
culture was diluted into 300 ml SC-leu-ura + 2% raffinose and grown overnight at 30°C.
The 300 ml culture was used to inoculate three 1L SC-leu-ura + 2% raffinose cultures,
which were then grown at 30°C until OD600 reached 0.8 to1.6. Protein expression was
induced by inoculating each of six 1500 ml YP (10 g/l yeast extract, 20 g/l peptone) + 2%
galactose with 500 ml of the overnight, followed by growth for 6 hours at 30°C. Cells
were harvested by centrifugation, washed once with cold H2O, and stored at -80°C.
Extract Preparation and Purification
Cells were lysed by blending the frozen cell pellet with dry ice in a commercial coffee
grinder (KRUPS, Model #F203) for 10 minutes. The dry ice/cell pellet mixture was then
transferred to a glass beaker and left at 4°C until the dry ice had evaporated. The yeast
powder was resuspended in 2x Lysis Buffer (200 mM Tris, pH 8.3, 20% glycerol, 0.2%
Tween 20, 200 mM NaCl, 10 mM sodium pyrophosphate, 1 mM sodium orthovanadate,
2 mM PMSF, 20 µg/ml leupeptin, 20 µg/ml TLCK, 20 µg/ml aprotinin, 2 µg/ml pepstatin
A), 1 ml per 1 g of cells, followed by the addition of cold dH2O so that the volume of the
extract was two times cell mass. The cell extract was centrifuged at 20000 rpm in a
Sorvall SS34 rotor for 10 minutes at 4°C, and the supernatant was collected. 125 µl of

Supplementary Methods Xu et al. Page 4
IgG-agarose (SIGMA #A2909), pre-washed with 1x Lysis Buffer, was added to the
extract and mixed for two hours at 4°C. The mixture was poured into a Poly-Prep
chromatography column (BIORAD #731-1550) and the flow-through was collected. The
IgG-agarose was washed 5 times with 5 ml of wash buffer (50 mM HEPES, pH 7.5, 10%
glycerol, 150 mM NaCl, 0.1% Tween 20, 10 mM sodium pyrophosphate, 50 mM sodium
fluoride, 1mM sodium orthovanadate, 2 mM PMSF, 10 µg/ml leupeptin, 5 µg/ml TLCK,
5 µg/ml aprotinin, 1 µg/ml pepstatin A, 10 mM NaHSO3), and then three times with 5 ml
of TEV Cleavage Buffer (10 mM Tris, pH 8.0, 10% glycerol, 150 mM sodium chloride,
0.05% Tween 20, 0.5 mM EDTA and 1 mM DTT). The protein was eluted by incubating
the IgG-agarose with 100 U TEV protease (Invitrogen, #12575-015) in 1 ml of TEV
Cleavage Buffer overnight at 4°C. The eluate was collected and the IgG-agarose was
washed with an additional 200 μl TEV Cleavage Buffer. The eluate (1.2 ml ) was added
to 1.2 ml CaM Binding Buffer (10 mM Tris pH 8.0, 10% glycerol, 150 mM sodium
chloride, 0.05% Tween 20, 1 mM magnesium acetate, 1 mM imidazole, pH 8.0, 2 mM
CaCl2, and 1 mM DTT) plus 2.4 μl 1M CaCl2, and mixed with 200 μl of pre-washed
Calmodulin-sepharose for two hours at 4°C. The mixture was poured into a Poly-Prep
column and the flow-through was collected. The column was washed five times with 5
ml of CaM Binding Buffer and then eluted ten times with 200 μl of Elution Buffer (10
mM Tris, pH 8.0, 10% glycerol, 150 mM NaCl, 0.05% Tween 20, 1 mM imidazole, pH
8.0, 2 mM EGTA, and 1 mM DTT). Fractions with the highest protein concentration
were pooled and concentrated using spin filters (BIOMAX – 10K NMWL; Millipore).
Purification of recombinant RMI2 from E.coli
Recombinant RMI2 was expressed in E.coli as fusion protein tagged with both GST and
6-histidine (GST-His6-RMI2) (Rosetta2 cells, Novagen) using pET41a vector (Novagen).
Cells were grown at 30 ºC until log phase, and were induced with 0.3 mM IPTG at 25 ºC
for 2 hours. The cell pellet from 2-liter culture was lysed in 40 ml B-PER buffer (PIECE)
supplemented with 5% glycerol, 200 units DNase I, protease inhibitor cocktail, and 1mM
PMSF. The mixture was incubated at 25 ºC for 15 min and centrifuged at 27,000×g for
30 min. The supernatant was incubated with 3 ml TALON metal affinity resin (BD
Bioscience) at 4 ºC for 2 hours. The resin was washed twice with 50 ml PBS containing
10 mM imidazole and 5% glycerol, and twice with 50 ml PBS containing 0.5 M NaCl
Supplementary Methods Xu et al. Page 5
and 5% glycerol. The resin was then poured into a Biorad 5ml disposable column, and
the bound proteins were eluted with 50 mM imidazole in TBS buffer (50 mM Tris-HCl,
pH 7.5, 5% glycerol, 150 mM NaCl). The peak fractions were collected and incubated
with 1 ml Glutathione Sepharose 4 Fast Flow (GE Healthcare) at 4 ºC overnight. The
resin was washed twice with 50 ml PBS containing 5% glycerol and poured into a Biorad
2 ml disposable column. The bound protein GST-His6-RMI2 was cleaved with 10 ng/ml
enterokinase (Biolabs) at room temperature for 6 hours. The free RMI2 was eluted with
PBS containing 5% glycerol, and loaded onto a Superdex75 10/300 GL gel-filtration
column (GE Healthcare) which was pre-equilibrated with PBS containing 5% glycerol.
Peak fractions was pooled and concentrated with a 10-kD Amicon Ultra centrifugal filter
device (Millipore).
Supplementary References
Meetei, A. R., de Winter, J. P., Medhurst, A. L., Wallisch, M., Waisfisz, Q., van de Vrugt, H. J., Oostra, A. B., Yan, Z., Ling, C.,
Bishop, C. E., et al. (2003). A novel ubiquitin ligase is deficient in Fanconi anemia. Nat Genet 35, 165-170.
Mumberg, D., Muller, R., and Funk, M. (1995). Yeast vectors for the controlled expression of heterologous proteins in different genetic
backgrounds. Gene 156, 119-122.
Puig, O., Caspary, F., Rigaut, G., Rutz, B., Bouveret, E., Bragado-Nilsson, E., Wilm, M., and Seraphin, B. (2001). The tandem affinity
purification (TAP) method: a general procedure of protein complex purification. Methods 24, 218-229.
Rigaut, G., Shevchenko, A., Rutz, B., Wilm, M., Mann, M., and Seraphin, B. (1999). A generic protein purification method for protein
complex characterization and proteome exploration. Nat Biotechnol 17, 1030-1032.