RMA SPRING CONFERENCE LOAN REVIEW AND CREDIT QUALITY FROM THE AUDITORS POINT OF VIEW
23
RMA SPRING CONFERENCE LOAN REVIEW AND CREDIT QUALITY FROM THE AUDITORS POINT OF VIEW
description
RMA SPRING CONFERENCE LOAN REVIEW AND CREDIT QUALITY FROM THE AUDITORS POINT OF VIEW. Presenting Panel Cynthia A. Dopjera, Shareholder Brian P. Holle, Advisory Manager Kevin C. Horton, Assurance Principal. Topics for Discussion:. Underwriting Observations in 2013 - PowerPoint PPT Presentation
Transcript of RMA SPRING CONFERENCE LOAN REVIEW AND CREDIT QUALITY FROM THE AUDITORS POINT OF VIEW

RMASPRING CONFERENCE
LOAN REVIEW AND CREDIT QUALITY FROM THE
AUDITORS POINT OF VIEW

Presenting Panel
Cynthia A. Dopjera, ShareholderBrian P. Holle, Advisory Manager
Kevin C. Horton, Assurance Principal

Topics for Discussion:
Underwriting Observations in 2013
Borrower Financial Statements – Fraud Indicators and Methods to Assist in Analyzing Financial Statements
3

Community Banks $100MM - $2.5B Houston & Southeast Texas
Most Frequent Loan Policy Exceptions from 2013 Reviews (regardless of loan origination/vintage): High Loan to Value (LTV)
Financial Statements (FS) below standard
Waive personal guarantees
Extended amortization schedule
Underwriting Observations in 2013
4

New Loans Underwritten since 4Q2012:
43% are CRE
19% are CRE owner occupied
28% are C&I loans
Underwriting Observations in 2013
5

CRE Lending Underwriting: Sponsor/guarantor Global Cash Flow (GCF) Analysis
40% of CRE subject to GCF Analysis 33% of CRE did not need GCF Analysis 27% of CRE needed GCF, but was not performed
GCF Analysis Consistency Complete documentation challenges Sponsor guarantor GCF trends
Underwriting Observations in 2013
6

CRE and C&I Underwriting – Common Technical Challenges: Not documenting/verifying guarantor personal liquidity Excessive reliance on pro-forma future CF estimates for
DSCR Failing to consider borrower’s debt service requirements from
other lenders in DSCR Relying on non-recurring cash flows to support DSCR Not accounting for AR exceptions/carve-outs in borrowing
base agreements Not establishing any financial ratio covenants
Underwriting Observations in 2013
7

What is Fraudulent Financial Reporting?
Common Types of Schemes
Indicators of Financial Statement Fraud
Methods to Assist in Analyzing Financial Statements
Borrower Financial Statements – Fraud Indicators and Methods to Assist in Analyzing Financial Statements
8

What is Fraudulent Financial Reporting?
Manipulation, falsification, or alteration of accounting records or supporting documentation from which financial statements are prepared
Misrepresentation in, or intentional omissions from, the financial statements of events, transactions, or other significant information
Intentional misapplication of accounting principles relating to amounts, classification, manner of presentation or disclosure within financial statements
Borrower Financial Statements – Fraud Indicators and Methods to Assist in Analyzing Financial Statements
9

Common Types of Schemes:
Improper Revenue Recognition
Overstatement of Assets
Understatement of Liabilities (including contingent liabilities)
Borrower Financial Statements – Fraud Indicators and Methods to Assist in Analyzing Financial Statements
10
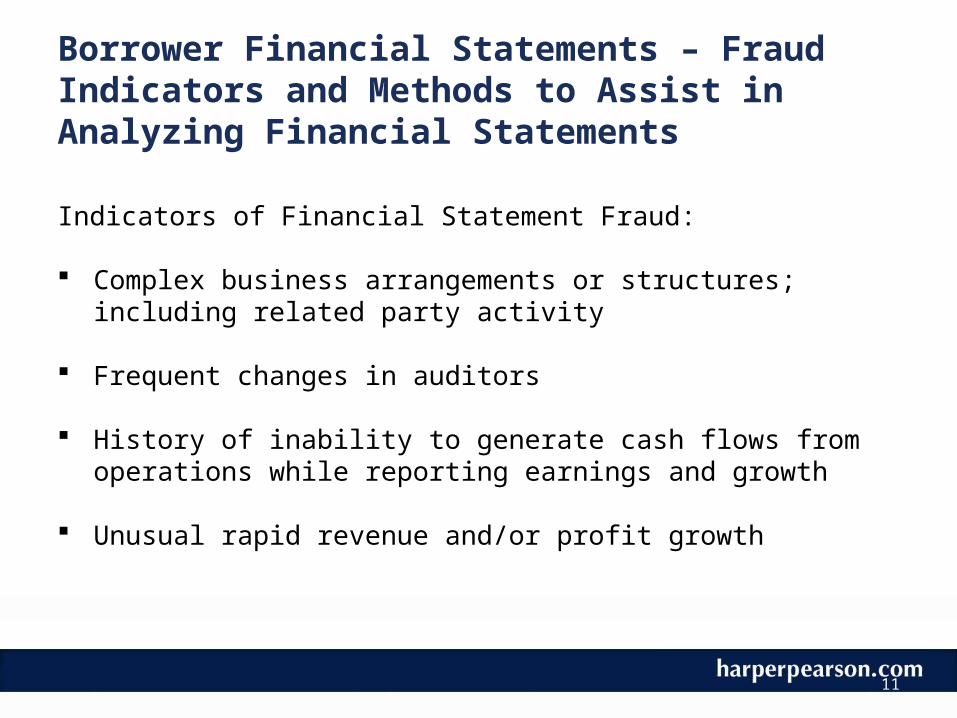
Indicators of Financial Statement Fraud:
Complex business arrangements or structures; including related party activity
Frequent changes in auditors
History of inability to generate cash flows from operations while reporting earnings and growth
Unusual rapid revenue and/or profit growth
Borrower Financial Statements – Fraud Indicators and Methods to Assist in Analyzing Financial Statements
11

Methods to Assist in Analyzing Financial Statements:
Beneish M-Score Model
Ratio Analysis
Vertical and Horizontal Analysis
Altman Z-Score
Borrower Financial Statements – Fraud Indicators and Methods to Assist in Analyzing Financial Statements
12

Beneish M-Score Model: Professor Messod Beneish published an empirical equation
using eight ratios to detect earnings manipulation M stands for manipulation M-Score model is based on eight values determined from
the financial statements of the company DSRI – Days’ Sales Receivables Index GMI – Gross Margin Index AQI – Asset Quality Index SGI – Sales Growth Index DEPI – Depreciation Index SGAI – Sales, General and Administrative Expense Index LVI – Leverage Index TATA – Total Accruals to Total Assets
Borrower Financial Statements – Fraud Indicators and Methods to Assist in Analyzing Financial Statements
13

Beneish M-Score Model – (continued):
An M Score> -2.22 indicates a strong likelihood of the company being a manipulator
Borrower Financial Statements – Fraud Indicators and Methods to Assist in Analyzing Financial Statements
14

Borrower Financial Statements – Fraud Indicators and Methods to Assist in Analyzing Financial Statements
15
Beneish M-Scorehttp://investexcel.net
Parameters GlossaryYear 2008 2009 SGA Selling, General and Administrative ExpensesNet Sales 93823 93685 CA Current AssetsCost of Goods 52155 49193 DSRI Days Sales in Receivables IndexNet Receivables 1174 1373 GMI Gross Margin IndexCurrent Assets 73717 67991 AQI Asset Quality IndexProperty, Plant and Equipment 2532 2058 SGI Sales Growth IndexDepreciation 1696 1716 DEPI Depreciation IndexTotal Assets 86291 84832 SGAI Sales, General and Administrative Expenses IndexSGA Expense 32426 33013 LVGI Leverage IndexNet Income 5741 9888 TATA Total Accruals to Total AssetsCash Flow from Operations 8416 2877Current Liabilities 26297 26275Long-term Debt 1232 1470Derived VariablesOther L/T Assets [TA-(CA+PPE)] 10042 14783DSRI 0.854GMI 1.069AQI 0.668SGI 1.001DEPI 1.134SGAI 0.981TATA -0.031LVGI 0.975M-score5 variable model -3.16 if M > -2.22, firm is likely to be a manipulator8 variable model -2.83
Notes5 variable equationM = -6.065+ .823 DSRI + .906 GMI + .593 AQI + .717 SGI + .107 DEPI8 variable equationM = -4.84 + .920 DSRI + .528 GMI + .404 AQI + .892 SGI + .115 DEPI -.172 SGAI + 4.679 Accrual to TA - .327 Leverage

Vertical & Horizontal Analysis -Balance Sheet
Borrower Financial Statements – Fraud Indicators and Methods to Assist in Analyzing Financial Statements
16

Vertical & Horizontal Analysis -Income Statement
Borrower Financial Statements – Fraud Indicators and Methods to Assist in Analyzing Financial Statements
17

Ratios:
Borrower Financial Statements – Fraud Indicators and Methods to Assist in Analyzing Financial Statements
18
Formula Example MeaningCurrent Ratio Current Assets
Current Liabilities1.35 There is 1.35 in current
assets to pay every $1.00 in current liabilities.
Quick Ratio Cash + Accounts ReceivableCurrent Liabilities
0.49 There is $0.49 in quickassets (liquid) to payevery $1.00 in currentliabilities.
Debt to Equity Ratio Total LiabilitiesEquity
0.45 The creditors have put $0.45in the business for every $1.00the owners have put in.
Gross Profit Margin Gross ProfitSales
30.7% For every $1.00 of salesthere is $0.307 in gross profit.
Pre-Tax ProfitMargin
Profit Before TaxesSales
0.15% For every $1.00 of salesthere is $0.00015 in pre-taxprofit.

Ratios – (continued):
Borrower Financial Statements – Fraud Indicators and Methods to Assist in Analyzing Financial Statements
19
Formula Example MeaningSales to Assets Sales
Total Assets1.98 There is $1.98 in sales for
every $1.00 in assets employedin the business.
Return to Assets Profit Before TaxesEquity
0.3% There is $0.003 in profit for every $1.00 in assets employedin the business.
Inventory Turnover Cost of Goods SoldInventory
4x On average, the inventoryturns over 4 times a year.
Inventory Days 365 DaysInventory Turnover
91 days On average, the inventoryturns over every 91 days.
Accounts Receivable SalesAccounts Receivable
10.9x On average, the accounts receivable turn over 10.9times a year.
Turnover Collection Period
365 DaysAccounts Receivable Turnover
33 days On average, the accountsreceivable turn over every 33days.

Altman Z-Score: Developed by Professor Edward Altman Indicator of a company’s financial solvency Z-Score is based on five ratios; each ratio is weighted
Return on total assets Sales to total assets Equity to debt Working capital to total assets Retained earnings to total assets
A Z-Score of 1.81 or below indicates possible future insolvency
Borrower Financial Statements – Fraud Indicators and Methods to Assist in Analyzing Financial Statements
20

Borrower Financial Statements – Fraud Indicators and Methods to Assist in Analyzing Financial Statements
21
Weighting Weighted Ratio Formula Factor Ratio
Return on Earnings Before Total Assets Interest and Taxes / x3.3 Total Assets
Sales to Net Sales /Total Assets Total Assets x.0999
Equity to Debt Market Value of Equity / Total Liabilities x0.6
Working Capital Working Capital / to Total Assets Total Assets x1.2
Retained Earnings Retained Earnings / to Total Assets Total Assets x1.4
Total of all Weighted Ratios -= Z-Score

22

www.harperpearson.com
23