
Ritmos Emocionais Cerebrais e o Seu Reflexo Em Pacientes Pós-trauma
13
r Human Brain Mapping 34:1344–1356 (2013) r Emotional Brain Rhythms and their Impairment in Post-Traumatic Patients Jonathan E. Cohen, 1 Hadar Shalev, 2 Roee Admon, 3 Shy Hefetz, 1 Christopher J. Gasho, 4 Lavi J. Shachar, 1 Ilan Shelef, 4 Talma Hendler, 3,5 and Alon Friedman 1 * 1 Department of Physiology and Neurobiology, Zlotowski Center for Neuroscience, Ben-Gurion University of the Negev, POB 653, Beer-Sheva 84105, Israel 2 Department of Psychiatry, Soroka University Medical Center and Zlotowski Center for Neuroscience, Ben-Gurion University of the Negev, POB 653, Beer-Sheva 84105, Israel 3 Functional Brain Center, Wohl Institute for Advanced Imaging, Tel Aviv Sourasky Medical Center, Tel Aviv, Israel 4 Department of Radiology, Soroka University Medical Center and Zlotowski Center for Neuroscience, Ben-Gurion University of the Negev, POB 653, Beer-Sheva 84105, Israel 5 Departments of Psychology, Physiology and Pharmacology, Tel Aviv University, Tel Aviv, Israel r r Abstract: Patients with post-traumatic stress disorder (PTSD) suffer from a failure of cognitive control over emotional distracters. The physiological substrates of cognitive-emotional interactions and their breakdown in disease are, however, unknown. Here, we studied brain activity in PTSD patients and healthy controls in response to emotion-provoking pictures using electroencephalography and functional magnetic resonance imaging (fMRI). We demonstrate that in healthy individuals, emotion-induced frontal theta rhythm modulates activity in the beta rhythm mainly in sensory-motor regions. In contrast, in PTSD patients, beta activity is elevated irrespective of emotion, and is not modulated by frontal theta activity in response to negative emotion. EEG source localization and fMRI findings suggest that theta activity is localized to the prefrontal and anterior cingulate cortices while beta activity is localized to sensory-motor regions. We further found that beta activity in sensory-motor regions is related to the emotion-induced slowing of the motor response in healthy controls while the excess frontal theta activity in PTSD is related to the intensity of negative emotional experience. These findings reveal for the first time the importance of brain electrical oscillations and coherence in emotional top-down modulation and point to specific fail- ure of these mechanisms in PTSD. Hum Brain Mapp 34:1344–1356, 2013. V C 2012 Wiley Periodicals, Inc. Key words: post-traumatic stress disorder; brain rhythm; electroencephalography; emotion; functional magnetic resonance imaging; theta r r Additional Supporting Information may be found in the online version of this article. Contract grant sponsor: The Israel Science Foundation (BIKURA Program); Contract grant sponsor: Israel Ministry of Science (the ‘‘Merkava’’ program); Contract grant sponsor: the Chief Scientist’s Office, Israeli Ministry of Health; Contract grant sponsor: The German Research Foundation (DFG) Trilateral Program; Contract grant sponsor: the Adams Super Center for Brain Studies, Tel Aviv University (fellowship to RA). Jonathan E. Cohen is currently at the Sharett Institute of Oncology, Hadassah Medical Organization, Jerusalem, Israel. *Correspondence to: Professor Alon Friedman, M.D., Ph.D., Department of Physiology and Neurobiology, Faculty of Health Sciences, Ben-Guion University of the Negev, Beer-Sheva POB 653, 84105, Israel. E-mail: [email protected] Received for publication 14 July 2010; Revised 15 October 2011; Accepted 17 October 2011 DOI: 10.1002/hbm.21516 Published online 14 February 2012 in Wiley Online Library (wileyonlinelibrary.com). V C 2012 Wiley Periodicals, Inc.
-
Upload
isabel-antunes -
Category
Documents
-
view
213 -
download
0
description
neurociencias
Transcript of Ritmos Emocionais Cerebrais e o Seu Reflexo Em Pacientes Pós-trauma
r Human Brain Mapping 34:1344–1356 (2013) r
Emotional Brain Rhythms and their Impairment inPost-Traumatic Patients
Jonathan E. Cohen,1 Hadar Shalev,2 Roee Admon,3 Shy Hefetz,1
Christopher J. Gasho,4 Lavi J. Shachar,1 Ilan Shelef,4 Talma Hendler,3,5
and Alon Friedman1*
1Department of Physiology and Neurobiology, Zlotowski Center for Neuroscience, Ben-Gurion University ofthe Negev, POB 653, Beer-Sheva 84105, Israel
2Department of Psychiatry, Soroka University Medical Center and Zlotowski Center for Neuroscience,Ben-Gurion University of the Negev, POB 653, Beer-Sheva 84105, Israel
3Functional Brain Center, Wohl Institute for Advanced Imaging, Tel Aviv Sourasky Medical Center, Tel Aviv, Israel4Department of Radiology, Soroka University Medical Center and Zlotowski Center for Neuroscience,
Ben-Gurion University of the Negev, POB 653, Beer-Sheva 84105, Israel5Departments of Psychology, Physiology and Pharmacology, Tel Aviv University, Tel Aviv, Israel
r r
Abstract: Patients with post-traumatic stress disorder (PTSD) suffer from a failure of cognitive controlover emotional distracters. The physiological substrates of cognitive-emotional interactions and theirbreakdown in disease are, however, unknown. Here, we studied brain activity in PTSD patients andhealthy controls in response to emotion-provoking pictures using electroencephalography and functionalmagnetic resonance imaging (fMRI). We demonstrate that in healthy individuals, emotion-induced frontaltheta rhythm modulates activity in the beta rhythm mainly in sensory-motor regions. In contrast, in PTSDpatients, beta activity is elevated irrespective of emotion, and is not modulated by frontal theta activity inresponse to negative emotion. EEG source localization and fMRI findings suggest that theta activity islocalized to the prefrontal and anterior cingulate cortices while beta activity is localized to sensory-motorregions. We further found that beta activity in sensory-motor regions is related to the emotion-inducedslowing of the motor response in healthy controls while the excess frontal theta activity in PTSD is relatedto the intensity of negative emotional experience. These findings reveal for the first time the importanceof brain electrical oscillations and coherence in emotional top-down modulation and point to specific fail-ure of these mechanisms in PTSD. Hum Brain Mapp 34:1344–1356, 2013. VC 2012 Wiley Periodicals, Inc.
Keywords: post-traumatic stress disorder; brain rhythm; electroencephalography; emotion; functionalmagnetic resonance imaging; theta
r r
Additional Supporting Information may be found in the onlineversion of this article.
Contract grant sponsor: The Israel Science Foundation (BIKURAProgram); Contract grant sponsor: Israel Ministry of Science (the‘‘Merkava’’ program); Contract grant sponsor: the Chief Scientist’sOffice, Israeli Ministry of Health; Contract grant sponsor: The GermanResearch Foundation (DFG) Trilateral Program; Contract grantsponsor: the Adams Super Center for Brain Studies, Tel AvivUniversity (fellowship to RA).
Jonathan E. Cohen is currently at the Sharett Institute ofOncology, Hadassah Medical Organization, Jerusalem, Israel.
*Correspondence to: Professor Alon Friedman, M.D., Ph.D.,Department of Physiology and Neurobiology, Faculty of HealthSciences, Ben-Guion University of the Negev, Beer-Sheva POB653, 84105, Israel. E-mail: [email protected]
Received for publication 14 July 2010; Revised 15 October 2011;Accepted 17 October 2011
DOI: 10.1002/hbm.21516Published online 14 February 2012 in Wiley Online Library(wileyonlinelibrary.com).
VC 2012 Wiley Periodicals, Inc.
INTRODUCTION
Emotions are conscious mental reactions subjectivelyexperienced as strong feelings usually directed toward aspecific object and typically accompanied by physiologicaland behavioral changes in the body [Merriam-Webster,2011]. From an evolutionary perspective, emotions aremodes of functioning that increase the ability to meetadaptive challenges [Nesse and Ellsworth, 2009]. Interac-tions between emotion and cognition are central to our abil-ity to cope with stressful life events. Emotional stimulimodulate attention and perception [Vuilleumier, 2005]assigning extra importance to threatening situations, whileattention and purposeful cognitive effort can alter emo-tional processing [Ochsner and Gross, 2005] allowing goaldirected overcoming of emotional distracters; failure of thefine balance between cognition and emotion may contributeto psychopathology. One case of psychopathology is post-traumatic stress disorder (PTSD); a mental condition arisingsubsequent to traumatic life events, characterized by re-experiencing of the trauma, avoidance of trauma associatedstimuli, and hyperarousal [DSM-IV, 2000]. PTSD patientsexhibit abnormal emotional processing with increasedresponsiveness and interference by stimuli of negative va-lence [Mueller-Pfeiffer et al., 2010].
Although it is known that classical ‘‘cognitive brainregions’’ are affected by emotional stimuli and ‘‘emotionalregions’’ by cognitive stimuli, functional magnetic reso-nance imaging (fMRI) experiments have shown that thereare specific regions, including the prefrontal cortex (PFC)[specifically, the anterior cingulate cortex (ACC), ventro-medial PFC, and dorsolateral PFC] that are activated bytasks involving interactions between emotional and cogni-tive aspects [Pessoa, 2008]. Indeed, in a recent fMRI study[Eldar et al., 2007], we demonstrated increased lateral PFCactivation in response to emotional stimuli. However, thelow time resolution of the blood oxygenation level-de-pendent (BOLD) response in fMRI studies in comparisonto brain electrical activity, which changes within the milli-second range, precludes inspection of interactions betweenthese processes within these brain regions on a moredetailed time-scale.
Emotional valence has been shown to modulate event-related potentials (ERP) measured using scalp electrodes[Olofsson et al., 2008], specifically in sensory-related brainregions [Schupp et al., 2006]. Recent findings, however,highlight the importance of the frequency components ofbrain electrical activity [Hummel and Gerloff, 2006]. Initialstudies of emotion induced non-time-locked frequencyresponse reported a decrease in alpha band power and anincrease in beta band activation. Further work demon-strated emotion induced higher frequency activity (>20Hz) specifically in the right hemisphere in time-lockedanalyses paralleling ERP studies [reviewed in Keil, 2006].A role for theta synchronization has also been reported.For example, Aftanas et al. [2001] who report increasedtheta event related synchronization (ERS) to negative stim-
uli over right anterior and for positive stimuli over left an-terior brain regions. Attention and higher cognitivefunction have been commonly associated with higher fre-quency synchronization (i.e., high-beta and gamma bands)although a role for theta and specifically for theta-gammacoherence has been reported as well [reviewed in Jensenet al., 2007; Wang, 2010]. Indeed, cross regional synchroni-zation in general and cross low-to-high frequency modula-tion in particular have been shown to be important forfacilitating functional brain connectivity [Canolty et al.,2006; Jensen and Colgin, 2007]. In affective research,Miskovic and Schmidt [2010] reported increased inter-frequency coherence in the 14–30 Hz range between pre-frontal and posterior scalp regions in response to emotion-ally arousing stimuli.
To explore the neural correlates and specifically the fre-quency contributions to emotional processing, we meas-ured brain activation in response to real-life visualemotional stimuli viewed during a choice response task;focusing on the frequency components of the electricalbrain response obtained from scalp EEG. This temporaldomain of emotional brain activity was further character-ized for spatial localization via fMRI and for behavioralsignificance based on task reaction time. A nonemotionalchoice response task was chosen to probe emotional inter-ference with task performance [Keil, 2006] and highlightthe interactions between emotion and cognition. We testedboth healthy subjects and PTSD patients to ascertain thesignificance of our findings for ‘‘normal’’ emotional proc-essing and explore the neural basis of its breakdown inpsychopathology. We predicted that known ERP compo-nents reflecting emotional processing would be reflected inthe frequency domain; specifically in the theta and beta-gamma bands that have been implicated in emotionalresponse. We further predicted that this activity wouldlocalize to visual and prefrontal regions reflecting the re-ciprocal bottom-up and top-down processes involved inemotion-cognition interactions. We hypothesized that crossfrequency coherence is a mechanism for functional net-work connectivity, specifically of emotion-cognition relatednetworks. Finally, we predicted that in PTSD patientsscalp electrical activity and BOLD signal would reflect anexaggerated emotional response, an inappropriate behav-ioral one and failure of network connectivity.
METHODS AND MATERIALS
Subjects
A total of 25 PTSD patients (diagnosed via clinical inter-view) took part in this study, from whom a subset withextremely severe PTSD (as determined by a CAPS scoreexceeding 80, [Weathers et al., 2001]) was selected for thisanalysis for the sake of homogeneity, 14 for EEG and 10for fMRI analysis (Table I for details). Exclusion criteriaincluded any significant head trauma, preexisting neuro-psychiatric disorders, or previous use of medication or
r Emotion in Health and Post-Trauma r
r 1345 r
illicit drugs affecting the central nervous system. Werecruited 14 healthy subjects (mean age: 26.1 � 3.3, educa-tion years: 15.6 � 2.1, 9 males) for EEG recordings and 10(30.6 � 2.4 mean age, 18 � 0.6 yr education, 6 males) forfMRI. All procedures were approved by the Soroka Uni-versity Medical Center institutional review board. Writteninformed consent was obtained from all participants.
Emotion Paradigm
Pictures from the international affective picture system(IAPS [Lang et al., 2001]) ranked on a valence scale [fromone (positive) to nine (negative)] were sorted into threegroups: positive, negative, or neutral emotional content(Supporting Information Table I for a list of pictures).These pictures are widely employed in affective behavioraland neurophysiological studies. Two sets of pictures werecreated (version A: valence scores of 7.32 � 0.08, 2.84 �0.12, and 4.98 � 0.05; version B: 7.31 � 0.11, 2.78 � 0.12,and 4.97 � 0.08 for negative, positive, and neutral groups,respectively). For subjects examined with both fMRI andEEG, versions were alternated. The experiment consistedof four runs, each consisting of three blocks, one for eachemotional valence [negative, positive, and neutral]. Withinblocks, eight pictures were presented for 1.5 s each fol-lowed by 0.5 s of a black screen. Each emotional block waspreceded by a fixation block in which a cross was pre-sented eight times, again for 1.5 s each, with a 0.5 s inter-val (Fig. 1A). Block order was randomized within runs. Ablock design was chosen to accommodate fMRI analysisbut is suitable also for ERP studies as electrocorticalresponses to affective stimuli have been shown to be ro-bust across wide experimental conditions [Schupp et al.,2006]. Subjects performed a choice response task in whichthey were instructed to press one of two buttons using
their right hand depending on the presence or absence ofa person or human part in the picture. Stimuli were pre-sented and responses collected using E-prime 1.1 software.Following EEG and/or fMRI acquisition, subjects rankedviewed pictures for valence using the self-assessment man-ikin scale of one (positive) to nine (negative).
EEG Acquisition
EEGs were collected on a 128-channel digital acquisitionunit (CEEGRAPH IV, Biological Systems Corp., Munde-lein, IL) employing a 64- (58 EEG) electrode cap (Electro-Cap, Eaton, OH), as described previously [Korn et al.,2005], sampling rate was 256 Hz, online filtering was per-formed between 0.1 and 100 Hz. An additional channelregistered onset of stimuli via an optocoupler box built in-house. Subjects were seated at a distance (from the eyes)of 1.5 m from a 15-inch computer screen.
EEG Analysis
Unless otherwise stated, analysis was performed usingin-house prepared Matlab scripts ([2007b] MathWork,Natick, MA). EEG segments were inspected visually forgross artifacts and in their absence cut according to experi-mental blocks and sorted in to the corresponding emotionalgroups. Electrodes in adjacent anatomical regions wereaveraged to generate 17 scalp regions (for list of electrodessee Supporting Information Table II; for source localizationanalysis the complete set of electrodes was employed).
Time domain analysis
For conventional ERP analysis, data was band-pass fil-tered at 1–30 Hz. Valence specific, stimulus time-locked
TABLE I. PTSD population characteristics
SubjectAge
(years) SexCAPSscore Trauma
Time sincetrauma Pharmacotherapy EEG fMRI
1 45 M 115 Work accident 8 months Vanlafaxine, Carbamazepine H H2 24 M 110 Fall from height 2 months – H H3 24 M 127 MVA 3 months – H H4 27 M 92 Combat-related 1 year – H H5 37 M 82 Assault 45 months – H H6 22 F 82 MVA 3.5 months – H7 48 M 97 MVA 13 months Paroxetine, Oxazepam, Oxycodone H H8 37 M 98 MVA 4 months Brotizolam H9 51 M 102 Fall from height 13 years Vanlafaxine, Diazepam, Valproic acid H10 30 F 85 MVA 12 months – H11 23 M 102 MVA 16 months Paroxetine H H12 25 M 84 Combat-related 31 months – H H13 40 F 90 MVA 8 months – H14 18 F 86 MVA 8 months – H15 44 M 94 Assault 25 months Escitalopram H16 27 F 103 MVA 1 month Brotizolam H
CAPS ¼ Clinician- Administered PTSD Scale; MVA ¼ motor vehicle accident.
r Cohen et al. r
r 1346 r

segments were averaged within subjects and resultantERPs were subject to statistical analysis across subjectsand valence.
Frequency domain analysis
EEG data was band-pass filtered using a zero-phase leastsquare linear phase finite impulse response (FIR) digital fil-ter (FIRLS command in Matlab), with a filter order of 300.Due to filter-introduced artifacts at the extremities of the
data, the first and last 2 s of each 16 s filtered segment (i.e.,each experimental block) were omitted. Filtered bandswere as follows: theta (y) 3–6 Hz, alpha (a) 9–12 Hz, low-beta (Lb) 13–24 Hz, high-beta (Hb) 25–30 Hz, and gamma(c) 31–50 Hz. Band passed data was subsequently subjectedto the Hilbert transform and the result squared to producecurves of time varying instantaneous power (signal enve-lope power). Stimulus time-locked segments were thenaveraged to yield event-related synchronization/desynch-ronization (ERS/ERD [Clochon et al., 1996]) data.
Figure 1.
A: Experimental design. Pictures were presented in a block
design comprising four runs, each containing three blocks, one
of each valence (positive, negative, and neutral) in a pseudo-
randomized order. Each block was preceded by a fixation block.
In each block, eight pictures or fixation crosses were presented
for 1.5 s, followed by 0.5 s of a black screen each time. B: Visual
ERPs in control and PTSD subjects in response to the fixation
cross. C: ERPs in control subjects in response to pictures versus
fixation (left) and by stimulus emotional valence (right). Insets:
enlarged traces. Arrow: negative emotion associated increased
negative deflection. D: Averaged (all electrodes) ERS to emo-
tional stimuli at the different frequency bands.
r Emotion in Health and Post-Trauma r
r 1347 r

Statistical analysis
To normalize data across subjects, for each subject thebase 10 logarithm of the ratio between pairs of valence (i.e.,the negative to neutral ratio) was computed for the ERS’sfor each electrode and band. One-sample t-tests were thenperformed for each time point and region to determine sta-tistical significance of ERS differences. Such differenceswere deemed significant if the P value was below 0.05. Toavoid error from randomly generated low P values relatedto multiple comparisons, results were regarded as signifi-cant only when at least five contiguous time points werestatistically significant. This threshold leads to a 0.00079probability of type I error (0.05 ^ 5 [probability of 5 contig-uous errors] � 150[number of five contiguous points in the600 ms time window] � 17 [regions]).
Amplitude coherence analysis
Short time cross correlation (STCC) was calculated tosearch for coherence between the amplitudes of frequencyresponses based on a previously described method[Zygierewicz et al., 2006]. Briefly, STCC between ERS’s inthe beta and theta frequency bands was calculated in eachsubject for each pair of scalp regions, and in each emo-tional condition with a time window of ~312 ms (80 sam-ples) and overlap of ~156 ms (40 samples). STCC wasaveraged across neighboring segments to yield a meanSTCC for the 150–300, 300–450, and 450–600 ms time inter-vals. An R value exceeding 0.7 was taken to indicate a sig-nificant correlation and designated as such in binaryterms. STCC was computed for 50 positive and 50 nega-tive lags (lag ¼ one sample point); subsequently each 10lags were averaged. Finally, to test for emotion-inducedalterations in STCC, a nonparametric Monte Carlo basedtest was employed comparing STCC between emotionalconditions [Durka et al., 2004; Nichols and Holmes, 2002].
Source localization
Source estimation was performed using sLORETA soft-ware [Pascual-Marqui, 2002] as described previously[Browne et al., 2006]. Briefly, subject frequency and va-lence specific mean ERS/ERDs were transformed into thesLORETA domain, than averaged across subjects withineach experimental group. Localization of power was thendetermined for time windows determined to differ signifi-cantly between conditions in the temporal statisticalanalysis.
Functional MRI Acquisition
A 1.5-tesla MRI instrument was employed (Intera, Phi-lips Medical Systems, Best, The Netherlands). BOLD sig-nals were collected employing a gradient echo EPIsequence (21 axial slices covering the whole cerebrum; TR¼ 2,000 ms; TE ¼ 40–50 ms; FA ¼ 90�; FOV ¼ 220 mm,
voxel size: 1.72/3.6 � 1.72/3.6 � 5 mm2). Stimuli werepresented employing the Integrated Functional ImagingSystem (MRI Devices Corporation, Waukesha, WI).
Functional MRI Analysis
The Statistical Parametric Mapping software package,SPM2 (Wellcome Department of Imaging Neuroscience,London, UK) with Matlab 7.0.4 was employed. Functionalimages were superimposed onto the 3D data sets throughtrilinear interpolation and transformed into MNI spacewith a voxel size of 3 � 3 � 3 mm. Preprocessing includedhigh-pass filtering and assessment for head movement. Toallow for T2* equilibration effects, the first six images ofeach scan were rejected. Data was spatially smoothed(FWHM: 6 mm) and a hemodynamic lag of 6 s wasassumed and verified for each subject. Whole brain statisti-cal analysis was based on the general linear model (GLM)in which voxels showing sensitivity to stimuli as com-pared to fixation, were included. Based on the separatecalculation for each subject, a 3D statistical parametricmap was created using multi-study GLM statistics.
RESULTS
Negative Emotional Stimuli Lead to Specific
Temporal and Spatial Brain Responses That
Are Altered In PTSD Patients
In accordance with others [e.g., Odom et al., 2004] TheERPs to presentation of a ‘‘fixation condition’’ were com-prised of two positive deflections peaked at~90 and 200 msand two negative ones at ~140 and ~360 ms post-stimulusonset (Fig. 1B). No significant differences were foundbetween healthy controls and PTSD patients in theseresponses.
To identify regional and temporal aspects of electricalresponses specifically related to the processing of pictures,we compared ERPs from healthy controls in response topicture presentations with ERPs in response to the fixationcondition. Most prominent in occipital electrodes, picturesinduced an increased positivity at ~90 ms after stimuluspresentation, and an earlier and larger negative voltagedeflection between 170 and 390 ms, peaking at ~300 ms,compared to 360 ms in the fixation condition. The largenegative potential was followed by two positive deflec-tions between ~400 and 600 ms not present in the fixationcondition (Fig. 1C). Within picture groups, we found thatnegative emotional pictures generated ERPs with excessnegativity in the early 200–400 ms post-stimulus intervalas compared to neutral and positive emotional stimuli(Fig. 1C). These findings, correspond to early posteriornegativity peaking at ~250–300 ms as reflecting emotionalprocessing [Olofsson et al., 2008; Schupp et al., 2006].
To determine the frequency contributions to theobserved ERP differences, we performed a time-frequency
r Cohen et al. r
r 1348 r
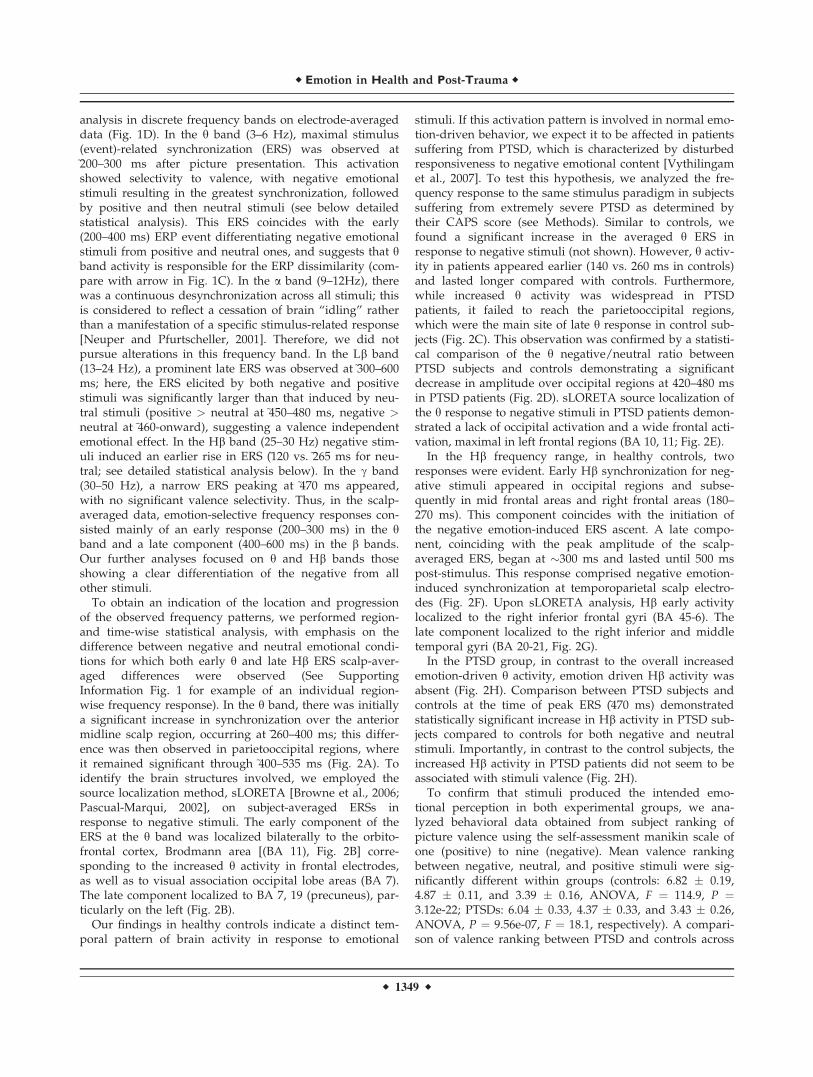
analysis in discrete frequency bands on electrode-averageddata (Fig. 1D). In the y band (3–6 Hz), maximal stimulus(event)-related synchronization (ERS) was observed at~200–300 ms after picture presentation. This activationshowed selectivity to valence, with negative emotionalstimuli resulting in the greatest synchronization, followedby positive and then neutral stimuli (see below detailedstatistical analysis). This ERS coincides with the early(200–400 ms) ERP event differentiating negative emotionalstimuli from positive and neutral ones, and suggests that yband activity is responsible for the ERP dissimilarity (com-pare with arrow in Fig. 1C). In the a band (9–12Hz), therewas a continuous desynchronization across all stimuli; thisis considered to reflect a cessation of brain ‘‘idling’’ ratherthan a manifestation of a specific stimulus-related response[Neuper and Pfurtscheller, 2001]. Therefore, we did notpursue alterations in this frequency band. In the Lb band(13–24 Hz), a prominent late ERS was observed at~300–600ms; here, the ERS elicited by both negative and positivestimuli was significantly larger than that induced by neu-tral stimuli (positive > neutral at ~450–480 ms, negative >neutral at ~460-onward), suggesting a valence independentemotional effect. In the Hb band (25–30 Hz) negative stim-uli induced an earlier rise in ERS (~120 vs.~265 ms for neu-tral; see detailed statistical analysis below). In the c band(30–50 Hz), a narrow ERS peaking at ~470 ms appeared,with no significant valence selectivity. Thus, in the scalp-averaged data, emotion-selective frequency responses con-sisted mainly of an early response (200–300 ms) in the yband and a late component (400–600 ms) in the b bands.Our further analyses focused on y and Hb bands thoseshowing a clear differentiation of the negative from allother stimuli.
To obtain an indication of the location and progressionof the observed frequency patterns, we performed region-and time-wise statistical analysis, with emphasis on thedifference between negative and neutral emotional condi-tions for which both early y and late Hb ERS scalp-aver-aged differences were observed (See SupportingInformation Fig. 1 for example of an individual region-wise frequency response). In the y band, there was initiallya significant increase in synchronization over the anteriormidline scalp region, occurring at ~260–400 ms; this differ-ence was then observed in parietooccipital regions, whereit remained significant through ~400–535 ms (Fig. 2A). Toidentify the brain structures involved, we employed thesource localization method, sLORETA [Browne et al., 2006;Pascual-Marqui, 2002], on subject-averaged ERSs inresponse to negative stimuli. The early component of theERS at the y band was localized bilaterally to the orbito-frontal cortex, Brodmann area [(BA 11), Fig. 2B] corre-sponding to the increased y activity in frontal electrodes,as well as to visual association occipital lobe areas (BA 7).The late component localized to BA 7, 19 (precuneus), par-ticularly on the left (Fig. 2B).
Our findings in healthy controls indicate a distinct tem-poral pattern of brain activity in response to emotional
stimuli. If this activation pattern is involved in normal emo-tion-driven behavior, we expect it to be affected in patientssuffering from PTSD, which is characterized by disturbedresponsiveness to negative emotional content [Vythilingamet al., 2007]. To test this hypothesis, we analyzed the fre-quency response to the same stimulus paradigm in subjectssuffering from extremely severe PTSD as determined bytheir CAPS score (see Methods). Similar to controls, wefound a significant increase in the averaged y ERS inresponse to negative stimuli (not shown). However, y activ-ity in patients appeared earlier (140 vs. 260 ms in controls)and lasted longer compared with controls. Furthermore,while increased y activity was widespread in PTSDpatients, it failed to reach the parietooccipital regions,which were the main site of late y response in control sub-jects (Fig. 2C). This observation was confirmed by a statisti-cal comparison of the y negative/neutral ratio betweenPTSD subjects and controls demonstrating a significantdecrease in amplitude over occipital regions at 420–480 msin PTSD patients (Fig. 2D). sLORETA source localization ofthe y response to negative stimuli in PTSD patients demon-strated a lack of occipital activation and a wide frontal acti-vation, maximal in left frontal regions (BA 10, 11; Fig. 2E).
In the Hb frequency range, in healthy controls, tworesponses were evident. Early Hb synchronization for neg-ative stimuli appeared in occipital regions and subse-quently in mid frontal areas and right frontal areas (180–270 ms). This component coincides with the initiation ofthe negative emotion-induced ERS ascent. A late compo-nent, coinciding with the peak amplitude of the scalp-averaged ERS, began at �300 ms and lasted until 500 mspost-stimulus. This response comprised negative emotion-induced synchronization at temporoparietal scalp electro-des (Fig. 2F). Upon sLORETA analysis, Hb early activitylocalized to the right inferior frontal gyri (BA 45-6). Thelate component localized to the right inferior and middletemporal gyri (BA 20-21, Fig. 2G).
In the PTSD group, in contrast to the overall increasedemotion-driven y activity, emotion driven Hb activity wasabsent (Fig. 2H). Comparison between PTSD subjects andcontrols at the time of peak ERS (~470 ms) demonstratedstatistically significant increase in Hb activity in PTSD sub-jects compared to controls for both negative and neutralstimuli. Importantly, in contrast to the control subjects, theincreased Hb activity in PTSD patients did not seem to beassociated with stimuli valence (Fig. 2H).
To confirm that stimuli produced the intended emo-tional perception in both experimental groups, we ana-lyzed behavioral data obtained from subject ranking ofpicture valence using the self-assessment manikin scale ofone (positive) to nine (negative). Mean valence rankingbetween negative, neutral, and positive stimuli were sig-nificantly different within groups (controls: 6.82 � 0.19,4.87 � 0.11, and 3.39 � 0.16, ANOVA, F ¼ 114.9, P ¼3.12e-22; PTSDs: 6.04 � 0.33, 4.37 � 0.33, and 3.43 � 0.26,ANOVA, P ¼ 9.56e-07, F ¼ 18.1, respectively). A compari-son of valence ranking between PTSD and controls across
r Emotion in Health and Post-Trauma r
r 1349 r

Figure 2.
Emotional valence is reflected in spatiotemporal-frequency alter-
ations. A, C, F, and H: Statistical analysis of the ERSs in the
negative versus neutral emotion contrast in the y (A controls; C
PTSD) and Hb bands (F controls; H PTSD). Statistical signifi-
cance at a P-value threshold of 0.05 is plotted for each region
and time point. Below are scalp maps of regional statistical sig-
nificance for representative time windows in which a significant
difference was found in the frequency response; red indicates a
significant increase, blue a significant decrease at a threshold of
P < 0.05. D: Regional statistical significance for comparison of
the negative/neutral y ERS ratio from PTSD to that of controls
at 420–480 ms. B, E, and G: Source localization (employing
sLORETA) of the signals in response to negative stimuli in the y(B controls; E PTSD) and Hb bands (G controls). Lt.: left (for all
axial sections), A: anterior (sagittal).
r Cohen et al. r
r 1350 r

emotional groups did not reveal significant differences(ANOVA, F ¼ 2.07, P ¼ 0.13). Thus, our behavioral dataconfirm that stimuli generated similar differential emo-tional perceptions according to their designated valence inboth control and PTSD subjects.
Emotional and Behavioral Associations of the
Frequency Response and the Relationship
Between Theta and Beta in Healthy Controls
and PTSD
Next, we set out to determine the association betweenfrequency-specific activity, perception, and resulting behav-ior. Individual valence ranking for negative stimuli waschosen as a measure of perception and was correlated with
the amplitudes of brain activity in the different frequencybands. In healthy controls, we found a slight negative cor-relation between individual negative/neutral y amplitudeand valence ranking in midline skull regions only in the400- to 500-ms time window (e.g., posterior midline, r ¼�0.66, P ¼ 0.009, Fig. 3A) while no correlation was foundwith Hb (data not shown; correlation was examined at 100-ms intervals between 0 and 600 ms). Interestingly, in PTSDpatients, significant correlation was found between individ-ual negative/neutral y amplitudes and valence of the nega-tive stimuli; this was found throughout the 100–600 mspost-stimulus peaking at 300–400 ms, in which all regionsshowed significant correlation (Fig. 3A).
We chose influence of negative emotional content on themotor response time (RT) as a simple behavioral measure[Blair et al., 2007]. Our results showed a delayed response
Figure 3.
Behavioral correlates of the frequency response. A: Scalp maps of
correlation between y (negative to neutral ratio) and valence
ranking of negative stimuli; R values with a P-value < 0.05 are pre-
sented. Time windows with maximal correlation are presented
for controls (left, the 400–500 ms post-stimulus interval) and
PTSD (center, the 300–400 ms interval). An example of correla-
tion in the 300–400 ms interval in the right parietal region is
shown for PTSD (right; one extreme value was removed from fig-
ure, correlation with this value was higher: R ¼ 0.84; P ¼ 0.0006).
B: Scalp maps of correlation between the negative to neutral
ratios of Hb activity in the 100–300 ms interval and RTs; R values
with a P-value < 0.05 are presented for controls (left) and PTSD
(center). An example of correlation in the 100–300 ms interval in
the left central scalp region for controls is shown (right).
r Emotion in Health and Post-Trauma r
r 1351 r
to negative versus neutral stimuli in both control andPTSD groups (mean RT 894.3 � 28.4 vs. 758.6 � 33.5 ms, P¼ 0.00004 and 1005.2 � 35.2 vs. 850.3 � 41.0 ms, P ¼0.0006, respectively). Although PTSD patients showed aslower response to both neutral and negative stimuli, dif-ferences reached statistical significance only for negativestimuli (P ¼ 0.02, for neutral stimuli P ¼ 0.09). Interest-ingly, in control subjects a linear correlation between Hbnegative/neutral amplitude ratio and RT was found inelectrodes positioned over central and midfrontal regionsin the 100–300 ms after stimulation (e.g., the left centralregion P ¼ 0.004, r ¼ 0.70, Fig. 3B). Conversely, there wasno correlation between Hb activity and RT for other timewindows or between y activity and RT in any time win-dow (e.g., the left central region P ¼ 0.20, r ¼ 0.36, for the100–300 ms interval). In contrast, in PTSD patients a nega-tive correlation was found between negative/neutral Hbactivity and motor RT only in one region (left frontal) inthe 100–300 ms time window (Fig. 3B).
Cross-Frequency Correlation
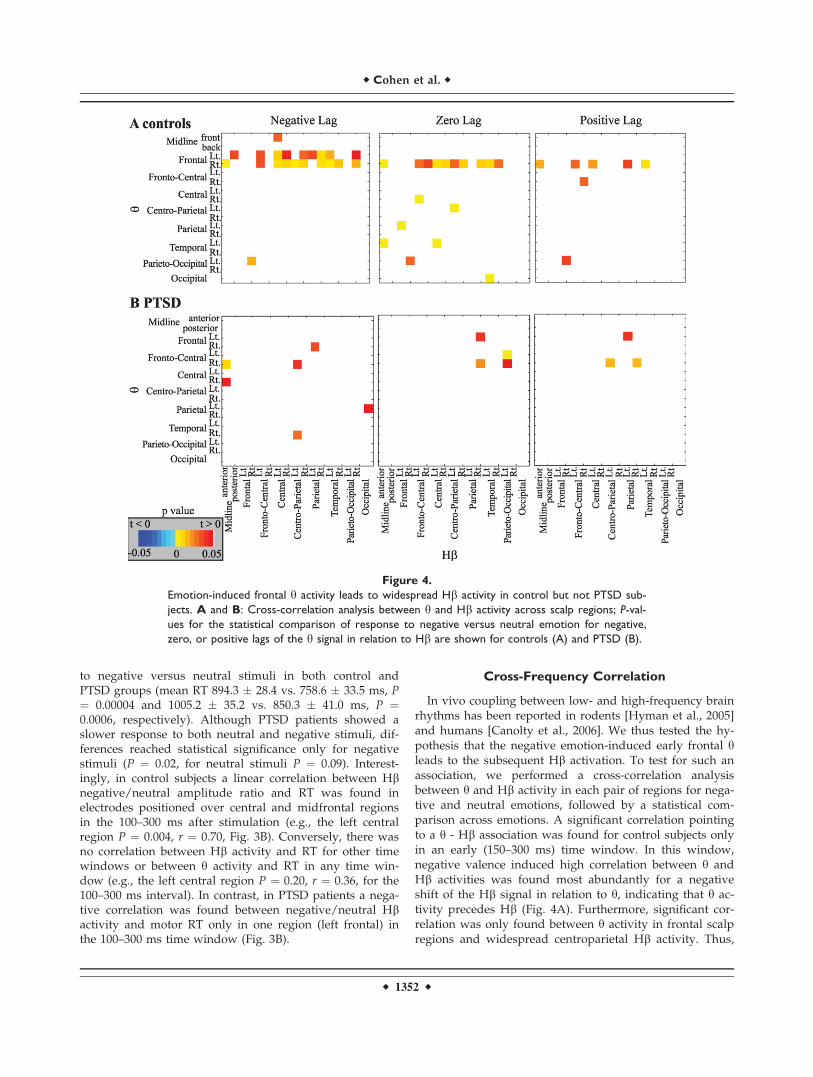
In vivo coupling between low- and high-frequency brainrhythms has been reported in rodents [Hyman et al., 2005]and humans [Canolty et al., 2006]. We thus tested the hy-pothesis that the negative emotion-induced early frontal yleads to the subsequent Hb activation. To test for such anassociation, we performed a cross-correlation analysisbetween y and Hb activity in each pair of regions for nega-tive and neutral emotions, followed by a statistical com-parison across emotions. A significant correlation pointingto a y - Hb association was found for control subjects onlyin an early (150–300 ms) time window. In this window,negative valence induced high correlation between y andHb activities was found most abundantly for a negativeshift of the Hb signal in relation to y, indicating that y ac-tivity precedes Hb (Fig. 4A). Furthermore, significant cor-relation was only found between y activity in frontal scalpregions and widespread centroparietal Hb activity. Thus,
Figure 4.
Emotion-induced frontal y activity leads to widespread Hb activity in control but not PTSD sub-
jects. A and B: Cross-correlation analysis between y and Hb activity across scalp regions; P-val-
ues for the statistical comparison of response to negative versus neutral emotion for negative,
zero, or positive lags of the y signal in relation to Hb are shown for controls (A) and PTSD (B).
r Cohen et al. r
r 1352 r
the data suggest that emotional stimuli induce y rhythmsin frontal association cortical regions, which in turn modu-late electrical activity within more posteriorly located sen-sory-motor regions (through increased Hb). In PTSDpatients, only a negligible increase in cross-correlationbetween emotional-driven y and Hb activity was found ascompared to healthy control subjects (Fig. 4B). Thus, ourdata show that in PTSD patients, while emotional stimuliinduce early and diffuse y activity, it fails to increase Hbresponse in sensory-motor cortical regions.
FMRI Emotional Activation and Its
Behavioral Correlates Lend Support to
Electrophysiological Data
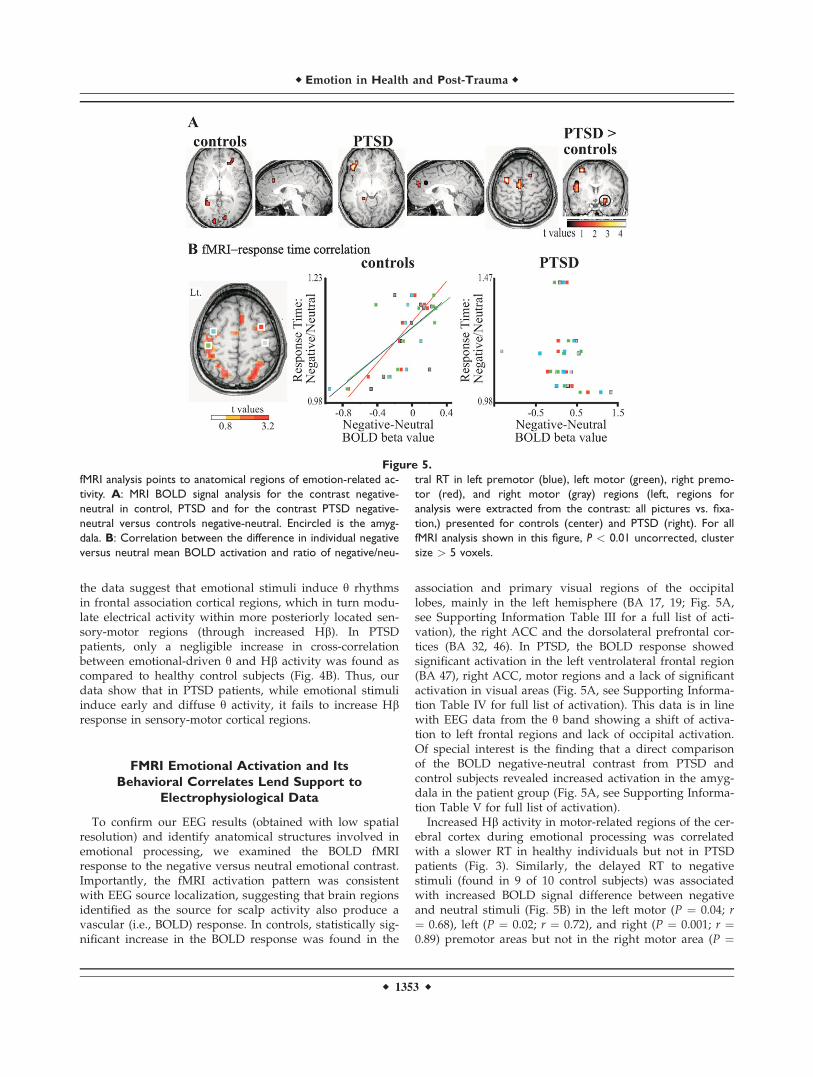
To confirm our EEG results (obtained with low spatialresolution) and identify anatomical structures involved inemotional processing, we examined the BOLD fMRIresponse to the negative versus neutral emotional contrast.Importantly, the fMRI activation pattern was consistentwith EEG source localization, suggesting that brain regionsidentified as the source for scalp activity also produce avascular (i.e., BOLD) response. In controls, statistically sig-nificant increase in the BOLD response was found in the
association and primary visual regions of the occipitallobes, mainly in the left hemisphere (BA 17, 19; Fig. 5A,see Supporting Information Table III for a full list of acti-vation), the right ACC and the dorsolateral prefrontal cor-tices (BA 32, 46). In PTSD, the BOLD response showedsignificant activation in the left ventrolateral frontal region(BA 47), right ACC, motor regions and a lack of significantactivation in visual areas (Fig. 5A, see Supporting Informa-tion Table IV for full list of activation). This data is in linewith EEG data from the y band showing a shift of activa-tion to left frontal regions and lack of occipital activation.Of special interest is the finding that a direct comparisonof the BOLD negative-neutral contrast from PTSD andcontrol subjects revealed increased activation in the amyg-dala in the patient group (Fig. 5A, see Supporting Informa-tion Table V for full list of activation).
Increased Hb activity in motor-related regions of the cer-ebral cortex during emotional processing was correlatedwith a slower RT in healthy individuals but not in PTSDpatients (Fig. 3). Similarly, the delayed RT to negativestimuli (found in 9 of 10 control subjects) was associatedwith increased BOLD signal difference between negativeand neutral stimuli (Fig. 5B) in the left motor (P ¼ 0.04; r¼ 0.68), left (P ¼ 0.02; r ¼ 0.72), and right (P ¼ 0.001; r ¼0.89) premotor areas but not in the right motor area (P ¼
Figure 5.
fMRI analysis points to anatomical regions of emotion-related ac-
tivity. A: MRI BOLD signal analysis for the contrast negative-
neutral in control, PTSD and for the contrast PTSD negative-
neutral versus controls negative-neutral. Encircled is the amyg-
dala. B: Correlation between the difference in individual negative
versus neutral mean BOLD activation and ratio of negative/neu-
tral RT in left premotor (blue), left motor (green), right premo-
tor (red), and right motor (gray) regions (left, regions for
analysis were extracted from the contrast: all pictures vs. fixa-
tion,) presented for controls (center) and PTSD (right). For all
fMRI analysis shown in this figure, P < 0.01 uncorrected, cluster
size > 5 voxels.
r Emotion in Health and Post-Trauma r
r 1353 r

0.12; r ¼ �0.54; Fig. 5B). Conversely, in the PTSD group,no significant correlation was found between negative-neutral BOLD activation and ratio of negative to neutralRT [left motor (P ¼ 0.45; r ¼ �0.31), left premotor (P ¼0.53; r ¼ �0.25) right premotor (P ¼ 0.52; r ¼ �0.26), rightmotor area (P ¼ 0.47; r ¼ �0.29; Fig. 5B]. Our data thussupport the conclusion that the emotion-related, y-drivenHb activity in motor-related cortical regions underlies thealtered motor response (delayed RT) to negative emotionalvisual stimuli in healthy subjects.
DISCUSSION
Our results demonstrated frequency-specific electricalbrain activity in healthy subjects in response to negativeemotion. We showed early prefrontal y synchronizationand later frontal and temporooccipital Hb synchronizationin response to negative stimuli. Complementary fMRIexperiments suggest that emotional response is localizedat the dorsal anterior cingulate and dorsolateral PFC. Earlyemotion-driven y activity correlated with increased Hb ac-tivity in more posterior sensory-motor brain regions and aslower RT to negative pictures. In PTSD patients, negative-valence-induced y activity was evident earlier and wasmore widespread than in controls. However, y activityfailed to modulate Hb activity in sensory-motor regionsand, in accordance with this failure, was not associatedwith increased motor RT. In PTSD patients, but not in con-trol subjects, negative valence ranking was associated withthe amplitude of the y response.
The Functional Significance of Theta
Synchronization
Electrical activity in the y band has been associated withemotional processing in both limbic and cortical regions inanimal and human studies [Mitchell et al., 2008]. In keepingwith these studies, our combined EEG and BOLD signaldata point to negative-valence-induced activity in discretefrontal cortical regions (e.g., dorsolateral frontal lobe)known to be instrumental for emotional and cognitive-emo-tion interactions. Conversely, we found Hb activity to belargely confined to more posteriorly located areas associ-ated with sensory-motor processing, consistent with previ-ous studies showing b activity to be associated with motorresponse [Neuper and Pfurtscheller, 2001]. Indeed, emo-tional-driven Hb activity correlated with motor RT suggest-ing that it is closely related to an adequate behavioralresponse to emotional stimuli. In addition, the finding thatthe enhanced frontal y activity in PTSD patients is corre-lated with degree of negativity perception, suggests that itrepresents emotional processing (Fig. 3A). Furthermore, theearly and robust increased emotional-driven y in PTSDpatients was accompanied by increased BOLD response inthe amygdala as well as in several frontal brain regions(e.g., left middle and orbitofrontal) supporting the hypothe-
sis that early frontal activity in the y range is related toamygdala-mediated emotional activation. This is also sup-ported by a recent magnetoencephalography study demon-strating y activity in the amygdala and frontal regions inresponse to fearful faces [Maratos et al., 2009].
Interfrequency Interaction Underlies Top-Down
Regulation During Emotional Processing
Visual processing of emotional stimuli is amenable tocompetitive modulation from the amygdala, supportingprocessing of fear-related (i.e., negative emotion) stimuli,while the PFC supports task-related processing. Within thePFC, the ACC is thought to detect attentional conflictbetween the tasks and fear cues, while the lateral PFC wassuggested to carry out task-related attentional control[Bishop, 2008]. In anxiety (in both healthy and psychiatricpopulations), amygdala activity, as demonstrated by fMRI,is amplified, while PFC activity is diminished, tilting thebalance in favor of fear attention [Bishop, 2007]. The physi-ological substrates underlying cortical processing of visualemotional stimuli are not fully known; though evidencefor reentrant anterior to early visual modulation has beenprovided from Granger causality analysis of visual evokedpotentials [Keil et al., 2009]. Based on the current findings,we propose that frequency-specific alterations and coher-ence underlie this modulation and a failure of thesechanges leads to disturbed emotional processing, asobserved in PTSD. A theoretical model [Siegel et al., 2000]predicts that top-down modulation of visual processing ingeneral depends on synchronous low frequency (e.g., y)activity. Bottom-up or failure of top-down modulation,however, results in high frequency synchrony. Our resultslend empirical support to this proposition. We observedearly posterior Hb synchrony in healthy controls thatseems likely to reflect bottom-up visual information trans-fer. In healthy individuals, right PFC regions (dorsolateral-PFC and ACC), probably responding to direct input fromcortical visual regions and/or subcortical regions, possiblythe amygdala, demonstrate increased y synchrony inresponse to emotional stimuli, which in turn modulates ac-tivity (i.e., enhances synchronicity in the Hb range) in cort-ical regions associated with the processing of sensoryinformation. We posit that this y modulation of Hb consti-tutes the physiological basis for PFC top-down modula-tion. In PTSD, behavioral data suggest failure of top-downmodulation, resulting in significant emotional distractionfrom the primary task (e.g., employing the affective Strooptask [Vythilingam et al., 2007]). Indeed, in PTSD patients,we observed widespread valence-induced PFC responsethat failed to modulate Hb activity.
Differences in stimulus physical characteristics and eyemovement artifacts could be confounding factors in thisstudy. Analysis of luminance, however, revealed no signif-icant differences between negative and neutral pictures. Torule out eye movements as underlying our results, EEG
r Cohen et al. r
r 1354 r

segments with gross eye movement artifacts were ex-cluded from further analysis. In addition, analysis ofrecordings from EOG channels failed to reproduce statisti-cal significant differences across emotional conditions asthose observed in the EEG data excluding eye-movementas underlying our results.
A further factor to be considered regarding the currentstudy is the choice of frequency bands vis-a-vis the use ofthe Hilbert transform. A prerequisite for a correct estima-tion of the signal amplitude by the Hilbert transform is anarrowly filtered signal [Boashash, 1992]. There is no con-sensus regarding the definition of ‘‘narrow’’; choice ofbandwidth for this type of analysis in the literature varies;for example, 2 Hz [Graimann and Pfurtscheller, 2006],3 Hz [Cohen, 2008], 4 Hz [Koskinen et al., 2001], and up to30 Hz [Park et al., 2011; Tort et al., 2010]. Our choice ofthe bands investigated here (i.e., theta, alpha, low-, andhigh-beta) falls well within the range employed in theliterature.
CONCLUSION
Based on EEG-fMRI analysis we suggest specific interac-tions between brain region and frequencies as the basis fortop-down modulation during visual emotional stimulation.The differences found between healthy controls and PTSDpatients may offer novel avenues for the understanding,diagnosis and follow-up of affective brain pathologies.
ACKNOWLEDGMENTS
The authors thank Dorit Ben-Shalom for critical reviewand Sigal Alyagon and Rotem Saar for technicalassistance.
REFERENCES
Aftanas LI, Varlamov AA, Pavlov SV, Makhnev VP, Reva NV(2001): Affective picture processing: Event-related synchroniza-tion within individually defined human theta band is modu-lated by valence dimension. Neurosci Lett 303:115–118.
Bishop SJ (2007): Neurocognitive mechanisms of anxiety: An inte-grative account. Trends Cogn Sci 11:307–316.
Bishop SJ (2008): Neural mechanisms underlying selective atten-tion to threat. Ann N Y Acad Sci 1129:141–152.
Blair KS, Smith BW, Mitchell DG, Morton J, Vythilingam M, Pes-soa L, Fridberg D, Zametkin A, Sturman D, Nelson EE, Dre-vets WC, Pine DS, Martin A, Blair RJ (2007): Modulation ofemotion by cognition and cognition by emotion. Neuroimage35:430–440.
Boashash B (1992): Estimating and Interpreting the InstantaneousFrequency of a Signal .1. Fundamentals. Proc IEEE 80:520–538.
Browne RO, Moyal-Segal LB, Zumsteg D, David Y, Kofman O,Berger A, Soreq H, Friedman A (2006): Coding region paraoxo-nase polymorphisms dictate accentuated neuronal reactions inchronic, sub-threshold pesticide exposure. FASEB J 20:1733–1735.
Canolty RT, Edwards E, Dalal SS, Soltani M, Nagarajan SS, KirschHE, Berger MS, Barbaro NM, Knight RT (2006): High gammapower is phase-locked to theta oscillations in human neocor-tex. Science 313:1626–1628.
Clochon P, Fontbonne J, Lebrun N, Etevenon P (1996): A newmethod for quantifying EEG event-related desynchronization:Amplitude envelope analysis. Electroencephalogr Clin Neuro-physiol 98:126–129.
Cohen MX (2008): Assessing transient cross-frequency coupling inEEG data. J Neurosci Methods 168:494–499.
DSM-IVTFo (2000): Diagnostic and Statistical Manual of MentalDisorders. Washington, DC: American Psychiatric Association.pp 943.
Durka PJ, Zygierewicz J, Klekowicz H, Ginter J, Blinowska KJ(2004): On the statistical significance of event-related EEGdesynchronization and synchronization in the time-frequencyplane. IEEE Trans Biomed Eng 51:1167–1175.
Eldar E, Ganor O, Admon R, Bleich A, Hendler T (2007): Feelingthe real world: Limbic response to music depends on relatedcontent. Cereb Cortex 17:2828–2840.
Graimann B, Pfurtscheller G (2006): Quantification and visualiza-tion of event-related changes in oscillatory brain activity in thetime-frequency domain. Prog Brain Res 159:79–97.
Hummel FC, Gerloff C (2006): Interregional long-range and short-range synchrony: A basis for complex sensorimotor processing.Prog Brain Res 159:223–236.
Hyman JM, Zilli EA, Paley AM, Hasselmo ME (2005): Medial pre-frontal cortex cells show dynamic modulation with the hippo-campal theta rhythm dependent on behavior. Hippocampus15:739–749.
Jensen O, Colgin LL (2007): Cross-frequency coupling betweenneuronal oscillations. Trends Cogn Sci 11:267–269.
Jensen O, Kaiser J, Lachaux JP (2007): Human gamma-frequencyoscillations associated with attention and memory. TrendsNeurosci 30:317–324.
Keil A (2006): Macroscopic brain dynamics during verbal and picto-rial processing of affective stimuli. Prog Brain Res 156:217–232.
Keil A, Sabatinelli D, Ding M, Lang PJ, Ihssen N, Heim S (2009):Re-entrant projections modulate visual cortex in affective per-ception: Evidence from Granger causality analysis. Hum BrainMapp 30:532–540.
Korn A, Golan H, Melamed I, Pascual-Marqui R, Friedman A(2005): Focal cortical dysfunction and blood-brain barrier dis-ruption in patients with Postconcussion syndrome. J Clin Neu-rophysiol 22:1–9.
Koskinen M, Seppanen T, Tuukkanen J, Yli-Hankala A, Jantti V(2001): Propofol anesthesia induces phase synchronizationchanges in EEG. Clin Neurophysiol 112:386–392.
Lang PJ, Bradley MM, Cuthbert BN (2001): International affectivepicture system (IAPS): Instruction manual and affective rat-ings. Technical report A-5. Gainesville, FL: The Center forResearch in Psychphysiology, University of Florida.
Maratos FA, Mogg K, Bradley BP, Rippon G, Senior C (2009):Coarse threat images reveal theta oscillations in the amygdala:A magnetoencephalography study. Cogn Affect Behav Neuro-sci 9:133–143.
Merriam-Webster (2011): Emotion. Merriam-Webster.com.
Miskovic V, Schmidt LA (2010): Cross-regional cortical synchroni-zation during affective image viewing. Brain Res 1362:102–111.
Mitchell DJ, McNaughton N, Flanagan D, Kirk IJ (2008): A reviewof frontal-midline theta from the perspective of hippocampalTHETA. Prog Neurobiol 86:156–185.
r Emotion in Health and Post-Trauma r
r 1355 r

Mueller-Pfeiffer C, Martin-Soelch C, Blair JR, Carnier A, Kaiser N,Rufer M, Schnyder U, Hasler G (2010): Impact of emotion oncognition in trauma survivors: What is the role of posttrau-matic stress disorder? J Affect Disord 126:287–292.
Nesse RM, Ellsworth PC (2009): Evolution, emotions, and emo-tional disorders. Am Psychol 64:129–139.
Neuper C, Pfurtscheller G (2001): Event-related dynamics of corti-cal rhythms: Frequency-specific features and functional corre-lates. Int J Psychophysiol 43:41–58.
Nichols TE, Holmes AP (2002): Nonparametric permutation testsfor functional neuroimaging: A primer with examples. HumBrain Mapp 15:1–25.
Ochsner KN, Gross JJ (2005): The cognitive control of emotion.Trends Cogn Sci 9:242–249.
Olofsson JK, Nordin S, Sequeira H, Polich J (2008): Affective pic-ture processing: An integrative review of ERP findings. BiolPsychol 77:247–265.
Park JY, Lee Y-R, Lee J (2011): The relationship between theta-gamma coupling and spatial memory ability in older adults.Neurosci Lett 498:37–41.
Pascual-Marqui RD (2002): Standardized low-resolution brain elec-tromagnetic tomography (sLORETA): Technical details. Meth-ods Find Exp Clin Pharmacol 24 Suppl D:5–12.
Pessoa L (2008): On the relationship between emotion and cogni-tion. Nat Rev Neurosci 9:148–158.
Schupp HT, Flaisch T, Stockburger J, Junghofer M (2006): Emotionand attention: Event-related brain potential studies. Prog BrainRes 156:31–51.
Siegel M, Kording KP, Konig P (2000): Integrating top-down andbottom-up sensory processing by somato-dendritic interac-tions. J Comput Neurosci 8:161–173.
Tort AB, Komorowski R, Eichenbaum H, Kopell N (2010): Meas-uring phase-amplitude coupling between neuronal oscillationsof different frequencies. J Neurophysiol 104:1195–1210.
Vuilleumier P (2005): How brains beware: Neural mechanisms ofemotional attention. Trends Cogn Sci 9:585–594.
Vythilingam M, Blair KS, McCaffrey D, Scaramozza M, Jones M,Nakic M, Mondillo K, Hadd K, Bonne O, Mitchell DG, Pine DS,Charney DS, Blair RJ (2007): Biased emotional attention in post-traumatic stress disorder: A help as well as a hindrance? Psy-chol Med 37:1445–1455.
Wang X-J (2010): Neurophysiological and Computational Principlesof Cortical Rhythms in Cognition. Physiol Rev 90:1195–1268.
Weathers FW, Keane TM, Davidson JR (2001): Clinician-adminis-tered PTSD scale: A review of the first ten years of research.Depress Anxiety 13:132–156.
Zygierewicz J, Mazurkiewicz J, Durka PJ, Franaszczuk PJ, CroneNE (2006): Estimation of short-time cross-correlation betweenfrequency bands of event related EEG. J Neurosci Methods157:294–302.
r Cohen et al. r
r 1356 r