Risk properties of AMU denominated Asian bonds · In Ogawaand Shimizu (2002, 2004), the G3...
22
UNCORRECTED PROOF DTD 5 Risk properties of AMU denominated Asian bonds Junko Shimizu, Eiji Ogawa * Graduate School of Commerce and Management, Hitotsubashi University, 2-1 Naka, Kunitachi, Tokyo 186-8601, Japan Received 16 November 2004; received in revised form 27 May 2005; accepted 1 June 2005 Abstract This paper aims to investigate the risk properties of Asian Monetary Unit (AMU) denominated Asian bonds by comparing them with those of local currency denominated bonds issued in East Asian countries. We suppose the AMU as an Asian currency unit which is formed as a currency basket of East Asian currencies. In this paper, we simulate a currency basket composed of the ASEAN5 countries, Japan, China, Korea, and Hong Kong. Our results indicate that the AMU denominated bonds can lower the risks for both US and Japanese investors, because the portfolio effects of the AMU reduce foreign exchange risk. However, these results depend on the currency system in the East Asian countries. # 2005 Published by Elsevier Inc. JEL classification: F31; F33; G15 Keywords: Asian bond; A currency basket; Asian Monetary Unit (AMU); Foreign exchange risk 1. Introduction After experiencing the Asian Currency Crisis in 1997, East Asian countries have recognized the underlying problems caused by a double over-dependence on the banking sector in their financial systems and on the US dollar in their currency systems. We propose to establish an Asian bond market denominated in terms of, not the US dollar, but a basket currency as the method of simultaneously solving both of these problems. The monetary Journal of Asian Economics xxx (2005) xxx–xxx 1 2 3 4 5 6 7 8 9 10 11 12 13 14 15 16 17 18 19 20 21 22 23 24 25 26 27 28 29 30 * Corresponding author. Tel.: +81 42 580 8859; fax: +81 42 580 8747. E-mail address: [email protected] (E. Ogawa). 1049-0078/$ – see front matter # 2005 Published by Elsevier Inc. doi:10.1016/j.asieco.2005.06.003 ASIECO 396 1–22
Transcript of Risk properties of AMU denominated Asian bonds · In Ogawaand Shimizu (2002, 2004), the G3...

UN
CO
RR
EC
TED
PR
OO
F
DTD 5
Risk properties of AMU denominated Asian bonds
Junko Shimizu, Eiji Ogawa *
Graduate School of Commerce and Management, Hitotsubashi University, 2-1 Naka,
Kunitachi, Tokyo 186-8601, Japan
Received 16 November 2004; received in revised form 27 May 2005; accepted 1 June 2005
Abstract
This paper aims to investigate the risk properties of Asian Monetary Unit (AMU) denominated
Asian bonds by comparing them with those of local currency denominated bonds issued in East Asian
countries. We suppose the AMU as an Asian currency unit which is formed as a currency basket of
East Asian currencies. In this paper, we simulate a currency basket composed of the ASEAN5
countries, Japan, China, Korea, and Hong Kong. Our results indicate that the AMU denominated
bonds can lower the risks for both US and Japanese investors, because the portfolio effects of the
AMU reduce foreign exchange risk. However, these results depend on the currency system in the East
Asian countries.
# 2005 Published by Elsevier Inc.
JEL classification: F31; F33; G15
Keywords: Asian bond; A currency basket; Asian Monetary Unit (AMU); Foreign exchange risk
1. Introduction
After experiencing the Asian Currency Crisis in 1997, East Asian countries have
recognized the underlying problems caused by a double over-dependence on the banking
sector in their financial systems and on the US dollar in their currency systems. We propose
to establish an Asian bond market denominated in terms of, not the US dollar, but a basket
currency as the method of simultaneously solving both of these problems. The monetary
Journal of Asian Economics xxx (2005) xxx–xxx1
2
3
45
6
789
10
1112
13
14
15
16
17
18
19
20
21
22
23
24
2526
27
28
29
30
* Corresponding author. Tel.: +81 42 580 8859; fax: +81 42 580 8747.
E-mail address: [email protected] (E. Ogawa).
1049-0078/$ – see front matter # 2005 Published by Elsevier Inc.
doi:10.1016/j.asieco.2005.06.003
ASIECO 396 1–22

UN
CO
RR
EC
TED
PR
OO
F
authorities of East Asian countries, including Japan, are actually promoting the Asian Bond
Market Initiative, that is, an international cooperation to establish Asian bond markets in
East Asia.
Recent discussions of the Asian Bond Market Initiative have focused on the choice of
denomination currency and the credit guarantee and rating agency. Ito (2003) proposed an
Asian bond which is designed to be a fund of the local currency denominated bonds issued
by governments of East Asian countries. However, there is another choice which is
denominated in terms of the US dollar. Actually, as an initiative of the EMEAP, the Asian
Bond Fund (ABF) was launched in its first version (ABF1) in June 2003 as a basket of US
dollar denominated bonds issued by Asian sovereign and quasi-sovereign issuers in
EMEAP economies (excluding Australia, Japan and New Zealand).1 The EMEAP has
worked to extend the ABF concept to bonds denominated in local currencies and has
announced the launch of the second stage of ABF (ABF2) in December 2004.
In previous research, Ogawa and Shimizu (2002, 2004) compared Asian bonds
denominated in terms of the G3 currency basket (a currency basket of the US dollar, the
euro, and the Japanese yen) with single currency (the US dollar, the euro, the Japanese yen
and seven East Asian currencies) denominated bonds. In this paper, we investigate the risk
properties of Asian Bonds denominated in terms of another currency basket, the Asian
Monetary Unit (AMU) which is formed as a currency basket of ASEAN + 4 (Japan, China,
Korea, and Hong Kong). As Kawai, Ogawa, and Ito (2004) noted, an AMU composed of a
currency basket of ASEAN + 3 (Japan, China, and Korea) currencies would be expected to
be equivalent to the G3 currency basket if each of the East Asian countries uses the G3
currency basket as a reference or target in conducting their exchange rate policies. The G3
currency basket denominated Asian bonds and AMU denominated Asian bonds would
therefore be equivalent, even though this is not the case under the current circumstances.
The remainder of this paper consists of the following sections. Section 2 briefly
summarizes the preceding literature on this area. Section 3 describes our method to
simulate the risks of AMU denominated bonds and compares the risk properties between
AMU denominated bonds with each of the local currency denominated bonds issued in the
East Asian countries. Section 4 considers foreign exchange risk reduction through
internationally diversified investments and the effectiveness of AMU denominated bonds
in reducing foreign exchange risk. The final section offers concluding remarks.
2. Contagion of financial crises and Asian bond markets
One of the main features of financial crises, especially those that occurred across the
world in the 1990s, is that they tend to spill over from one country to neighboring countries.
This was the case in the Asian Crisis, were contagion throughout the regional economies
was fuelled by strong trade linkages among the East Asian countries. At the international
level, some emphasize the imperfections of the international financial markets as one of the
major causes of contagion (Kaminisky, Lyons, & Schmukler, in press; Krugman, 1999).
J. Shimizu, E. Ogawa / Journal of Asian Economics xxx (2005) xxx–xxx2
DTD 5
ASIECO 396 1–22
30
31
32
3334
35
36
37
38
39
40
41
42
4344
45
46
47
48
49
50
51
52
53
54
5556
57
58
59
60
61
62
6364
65
66
67
68
69
1 Executives’ Meeting of East-Asia and Pacific Central Banks (EMEAP) is a cooperative organization of central
banks and monetary authorities in the East Asia and Pacific region.

UN
CO
RR
EC
TED
PR
OO
F
One approach to explain how contagion operates in financial crises uses the finance
theory of portfolio management. Schinasi and Smith (1999) used a model of the basic
portfolio theory to explain ‘‘contagion selling’’ of higher risk assets. They showed that a
shock to a single asset’s return distribution may lead to a reduction in position of other risky
assets.2 In addition, Mello and Hussein (2001) used a simple model of foreign debt
portfolio management to explain that the currency composition of a country’s foreign debt
portfolio was responsive to exchange rate movements. They conducted an empirical
analysis on the existence of a stable long-run relationship between the currency
composition of a country’s foreign debt portfolio and exchange rate movements in the case
of fourteen emerging market economies and four major currencies (the US dollar, the
Deutsche mark, the Japanese yen, and the Swiss francs) during an analytical period of
1970–1998. Their results indicated that foreign debt portfolios were not managed
optimally for the investors, in the sense that adverse movements in exchange rates were not
offset by an increase in portfolio shares of debts denominated in terms of appreciating
currencies.3
The East Asian currency crisis of 1997–1998 has created a strong awareness of the
necessity for regional cooperation, and from this have developed several policy proposals
in order to strengthen regional financial cooperation. Kuroda and Kawai (2003) proposed a
more effective surveillance process and considered the option of creating a common pool
of foreign exchange reserves to allow flexible financial supports at times of crises and
contagion, which would also reduce the problem of moral hazard. Monetary authorities in
East Asian countries recently established the Chaing Mai Initiative, that is, a swap
agreement in order to prevent future currency and financial crises.4 The establishment and
development of regional bond markets in East Asia have been proposed in order to directly
circulate regional savings into regional investments in East Asia. In addition, the possibility
of introducing a common currency or a common currency basket unit as a new regional
financial architecture in East Asia is also often discussed.5
In order to assess the effectiveness of basket currency denominated bonds in East Asian
countries, Ogawa and Shimizu (2004) conducted an empirical analysis from the standpoint
of the bond issuer’s side. A comparison was made between the G3 currency basket (a
currency basket of the US dollar, the euro, and the Japanese yen) denominated bonds and
each of the single local currency denominated bonds of East Asian currencies and three
major currencies in terms of both relative risk and liquidity. The results showed that issuing
currency basket denominated bonds contributes to reducing foreign exchange risk for bond
issuers in East Asian countries, except for the dollar-pegging countries of Malaysia, China,
and Hong Kong.
J. Shimizu, E. Ogawa / Journal of Asian Economics xxx (2005) xxx–xxx 3
DTD 5
ASIECO 396 1–22
69
70
71
72
73
74
75
76
77
78
79
80
81
82
83
8485
86
87
88
89
90
91
92
93
94
95
9697
98
99
100
101
102
103
104
105
2 They conclude that an investor with a leveraged portfolio will reduce risky asset positions if the return on the
leveraged portfolio is less than the cost of funding.3 This is particularly true in the case of Japanese yen denominated foreign debt. The persistent appreciation of
the Japanese yen vis-a-vis the US dollar has not made investors reduce the volume of Japanese yen denominated
debt in their portfolios. These findings may be attributed to some rigidity in the currency composition of foreign
debts, which impose constraints on portfolio diversification for investors.4 The Chiang Mai Initiative, agreed in May 2000, created bilateral swap agreements worth US$ 40 billion.5 As for the existing research concerning the common currency basket system, Ito, Ogawa, and Sasaki (1998),
Benassy-Quere (1999), Williamson (2000), Ogawa and Ito (2002) and Ogawa, Ito, and Sasaki (2004) are listed.

UN
CO
RR
EC
TED
PR
OO
F
In Ogawa and Shimizu (2002, 2004), the G3 currency basket was used as the currency of
denomination of Asian bonds, however, another type of currency basket, that is, the AMU,
a composition of local currencies in East Asia, may also be considered. In doing so, it is
important to recognize the risk properties of AMU denominated bonds, and thus, the
objective of this paper is to investigate the risk properties of AMU denominated bonds for
foreign investors who evaluate their returns in terms of their own currencies, such as the US
dollar, the euro, and the Japanese yen.
3. Risk properties of AMU denominated bonds and single local currency
denominated bonds
In this section, we calculate the returns of local currency denominated bonds for foreign
investors and evaluate their risk properties by using yield data of benchmark local bonds
issued in the nine East Asian countries of the ASEAN5 countries, Japan, China, Korea, and
Hong Kong. A partial equilibrium approach is applied to analyzing an investor model
under the assumption that interest rates and exchange rates are taken as given (therefore
returns and risks are taken as given). This means that we do not consider the situation that
the investor’s behavior affects bond returns and risks.
The discussion of risk in this paper treats bonds as an asset class in isolation to all other
assets since we would like to recommend AMU denominated bonds, rather than US dollar
denominated bonds or local currency denominated bonds, as an object of investment for
foreign investors. In addition to the standard deviation of bond returns, we also use the
Sharpe ratio as an indicator of risk since we focus solely on bond portfolios from the
standpoint of sub-optimal principal-agent reasons. Also, we think it is useful to measure
risk-adjusted performance among the various kinds of bonds. The Sharpe ratio is basically
a measure of portfolio returns, and AMU denominated bonds themselves are considered to
be a type of portfolio fund.6
In order to make the source of returns clear, we divide bond returns into interest returns
and foreign exchange returns. Then we compare the returns of the AMU denominated
bonds to each of the local currency denominated bonds in terms of interest rate and foreign
exchange risks.
3.1. Risk properties of single local currency denominated bonds in East Asia
3.1.1. Data and calculation formulas
Table 1 shows the details of the yield data of benchmark bonds in the nine East Asian
countries denominated in terms of the local currency. First, we calculate returns for
international investors who evaluate their returns in terms of the major currencies. We
suppose that there are two types of international investors: US investors, who evaluate their
returns in terms of US dollars, and Japanese investors, who evaluate their returns in terms
of Japanese yen. As explained in the previous section, standard deviation of returns is used
J. Shimizu, E. Ogawa / Journal of Asian Economics xxx (2005) xxx–xxx4
DTD 5
ASIECO 396 1–22
105
106
107
108
109
110
111
112
113
114115
116
117
118
119
120
121122
123
124
125
126
127
128
129
130131
132
133
134
135
136137
138
139
140
141
142
6 Actually, the type of the fund of funds, which invests in a portfolio of several funds (or investment trusts), is
becoming more common and increasingly popular for private investors in Japan recently.

UN
CO
RR
EC
TED
PR
OO
F
as an indicator of the risk of investing in bonds. We show average returns, standard
deviation of returns, and the ratio of returns to risk (the Sharpe ratio) for each of the bonds.
In order to look at the effects of time horizons on reducing risks, we suppose two
investment time horizons: 1 month and 6 months. For an investor who evaluates returns in
terms of US dollars, returns on investing in bonds are calculated as follows: the investor
exchanges an initial fund of US dollars into a local currency at the relevant exchange rate,
purchases local currency denominated bonds at a price in terms of the local currency, holds
them for 1 month (6 months), sells them at their price in terms of the local currency 1 month
(6 months) later, and exchanges the revenue in terms of the local currency into US
dollars.7,8 The returns are then divided into interest rate (bonds yield) returns and foreign
exchange returns. A similar calculation is conducted for investors who evaluate their
returns in terms of Japanese yen.
Our formula for calculating the value of a local currency denominated bond in terms of
US dollars for a 1-month investment is represented as follows:
Bond valuet ðUS dollar equivalentÞ
¼ 100Etð1 þ YtÞEtþ1
¼ 100 þ�
100EtYt
Etþ1
�þ�
100Et
Etþ1
� 100
�
ð¼ principal þ interest return þ foreign exchange returnÞ (1)
where Et is the closing rate of the foreign exchange rate against the US dollar at month t,
and Yt is the closing rate of bond yields on a monthly basis at month t.
The interest returns for each of the bonds are calculated from yield data of local bonds,
and foreign exchange returns are calculated from actual ex-post returns which are
uncovered by forward transactions at the beginning of the month and realized when the
bond values are converted to US dollars at the end of the month.
J. Shimizu, E. Ogawa / Journal of Asian Economics xxx (2005) xxx–xxx 5
DTD 5
ASIECO 396 1–22
142
143
144145
146
147
148
149
150
151
152
153
154155
156157
158
159160
161
162
163
Table 1
Bond yield of East Asian countries
Categories of bond Sample period
Singapore Singapore Treasury Bonds 10 years January 1999–December 2003
Thailand Loan Bonds 10 years January 1999–December 2003
Korea Korea Treasury Bond 5 years January 1999–December 2003
Philippines Fixed Rate Treasury Notes 7 years January 1999–December 2003
Indonesia Recapitalization Bonds (RECAP) July 2002–December 2003
Malaysia Malaysian Government Securities 10 years January 1999–December 2003
Hong Kong Exchange Fund Notes 5 years January 1999–December 2003
China Treasury Bonds 10 years May 2001–December 2003
Japan Japanese Government Bond 10 years January 1999–December 2003
Source: Datastream, Bloomberg, and HomePage of Central Banks.
7 We suppose the case in which investors do not use forward swap transactions for covering foreign exchange
risk.8 We suppose each local bond as a zero coupon bond. In addition, the yield data are rate on annual basis, so we
convert them to a monthly basis for calculation.

UN
CO
RR
EC
TED
PR
OO
F
Our formula for calculating the value of a local currency denominated bond in terms of
US dollars for a 6-month investment is represented as follows:
Bond valuet ðUS dollar equivalentÞ
¼ 100Etð1 þ Ytþ6t Þ
Etþ6
¼ 100 þ�
100EtYtþ6t
Etþ6
�þ�
100Et
Etþ6
� 100
�
ð¼ principal þ interest return þ foreign exchange returnÞ (2)
where Et is the closing rate of the foreign exchange rate against the US dollar at month t,
and Ytþ6t is bond yield calculated at compound interest for 6 months at month t.
Values of local currency denominated bonds in terms of Japanese yen for 1 month and 6-
month investments are calculated in the same way as in terms of US dollars.
3.1.2. The case of 1-month investments
Table 2 shows bonds values and returns of local currency denominated bonds for
1-month investments evaluated in terms of US dollars. The data during the sample period
clearly show that the standard deviations of bond value of the dollar-pegging countries
(Malaysia, China, and Hong Kong) are far lower than the other countries. Their fluctuations
are mainly attributed to fluctuations in interest returns for bonds issued in terms of the
dollar-pegged currencies. The standard deviation of Hong Kong dollar denominated bonds
is the highest among the three dollar-pegging countries.
The standard deviations of bond value for the non-dollar-pegging countries
are relatively high in comparison with the dollar-pegging countries, and they are
mainly attributed to fluctuations in foreign exchange returns, which are far larger
than those of interest returns. Among the non-dollar-pegging countries, Singaporean
bonds have the lowest standard deviation of bond value (1.35%), Japanese bonds
have the highest (2.51%), and Korean bonds have the second highest value (2.45%).9
Korean bonds have the highest average of bond value (100.56), while Malaysian bonds
have the lowest (100.25). The Sharpe ratios of the dollar-pegged currency denominated
bonds are much larger than those of the non-dollar-pegged currency denominated bonds.
Among the non-dollar-pegged currency denominated bonds, the Philippine bonds have
the lowest Sharpe ratio (0.16), and the Singaporean and Korean bonds have the highest
(0.23).
Table 3 shows bond values and returns of single local currency denominated bonds for
investments evaluated in terms of Japanese yen. In contrast to investments evaluated in
terms of US dollars, the standard deviations of bond value are not so different between the
dollar-pegging countries and the others, and their levels are much higher than those of bond
value returns in terms of US dollars. Excluding Japanese bonds, the Singaporean bonds
have the lowest standard deviation (2.40%), while Philippine bonds have the highest
(3.34%) among the local bonds. The fluctuations are mainly attributed to fluctuations in
foreign exchange returns. Korean bonds have the highest average of bond value (100.44),
J. Shimizu, E. Ogawa / Journal of Asian Economics xxx (2005) xxx–xxx6
DTD 5
ASIECO 396 1–22
163
164
165166
167
168169
170
171172
173
174
175
176
177
178179
180
181
182
183
184
185
186
187
188
189
190191
192
193
194
195
196
197
198
9 Due to the lack of sample number, we do not compare the standard deviations of Chinese and Indonesian
bonds.

UNCORRECTED PROOF
J.S
him
izu,
E.
Og
aw
a/Jo
urn
al
of
Asia
nE
con
om
icsxxx
(20
05
)xxx–
xxx7
DT
D5
AS
IEC
O3
96
1–
22
198
Table 2
One month bond value of Asian local bonds in terms of US dollar 1999–2003
Singapore Thailand Korea Philippines Indonesia Malaysia Hong Kong China Japan
Bond value
Maximum 103.78 106.58 106.12 106.20 105.29 100.46 101.00 100.56 105.06
Minimum 96.90 94.21 94.18 91.35 97.72 100.19 99.97 100.45 94.05
Average (m) 100.31 100.36 100.56 100.33 101.39 100.25 100.42 100.50 100.46
Return (%) (m � 100)/100 0.31 0.36 0.56 0.33 1.39 0.25 0.42 0.50 0.46
Standard deviation (s) 1.35 2.10 2.45 2.15 1.98 0.05 0.15 0.03 2.51
Return/s 0.23 0.17 0.23 0.16 0.70 5.10 2.90 17.28 0.18
Interest return
Maximum 0.394 0.695 0.808 1.503 1.271 0.459 0.588 0.554 0.129
Minimum 0.154 0.240 0.346 0.536 0.708 0.224 0.201 0.454 0.043
Average (m) 0.309 0.459 0.557 0.930 0.935 0.252 0.428 0.500 0.096
Standard deviation (s) 0.060 0.106 0.133 0.241 0.186 0.046 0.124 0.028 0.024
m/s 5.13 4.31 4.17 3.87 5.02 5.43 3.44 17.62 4.00
Foreign exchange return
Maximum 3.468 6.023 5.533 5.000 4.374 0.026 0.717 0.010 4.941
Minimum �3.384 �6.280 �6.417 �9.677 �3.055 �0.039 �0.282 �0.011 �6.058
Average (m) 0.003 �0.096 0.006 �0.596 0.450 �0.001 �0.003 0.000 0.364
Standard deviation (s) 1.340 2.106 2.426 2.104 1.928 0.015 0.105 0.005 2.503
m/s 0.00 �0.05 0.00 �0.28 0.23 �0.06 �0.03 0.09 0.15
Note. Bond value for 1 month is starting from 100 at the beginning of month. Then it is invested into every Asian local bond for 1 month and converted in terms of US
dollar by using every foreign exchange rate against US dollar at the end of month. All series without Indonesia and China are from 2/1999 to 12/2003, and the number of
sample is 59. Indonesia and China are starting from 8/2002 and 6/2001, and each number of sample is 17 and 31, respectively. Interest returns are calculated by every bond
yield. Foreign exchange returns are the actual ex-post foreign exchange related returns which are uncovered by forward transaction at the beginning of period and realized
when the bond value are converted in terms of US dollar at the end of period.

UNCORRECTED PROOF
J.S
him
izu,
E.
Og
aw
a/Jo
urn
al
of
Asia
nE
con
om
icsxxx
(20
05
)xxx–
xxx8 D
TD
5
AS
IEC
O3
96
1–
22
Table 3
One month bond value of Asian local bonds in terms of Japanese yen 1999–2003
Singapore Thailand Korea Philippines Indonesia Malaysia Hong Kong China Japan
Bond value
Maximum 105.92 106.11 106.29 108.30 105.60 107.07 107.31 107.01 100.12
Minimum 94.41 91.49 91.77 92.30 97.47 93.59 93.86 95.81 100.04
Average (m) 100.19 100.25 100.44 100.23 100.74 100.15 100.33 100.20 100.10
Return (%) (m � 100)/100 0.19 0.25 0.44 0.23 0.74 0.15 0.33 0.20 0.10
Standard deviation (s) 2.40 3.01 2.92 3.34 2.56 2.86 2.85 2.53 0.02
Return/s 0.08 0.08 0.15 0.07 0.29 0.05 0.11 0.08 4.07
Return on interest rate
Maximum 0.394 0.709 0.845 1.525 1.258 0.468 0.589 0.581 0.124
Minimum 0.154 0.236 0.341 0.521 0.696 0.215 0.202 0.455 0.044
Average (m) 0.309 0.458 0.556 0.931 0.931 0.252 0.428 0.499 0.096
Standard deviation (s) 0.060 0.108 0.133 0.248 0.191 0.048 0.125 0.032 0.024
m/s 5.15 4.25 4.17 3.76 4.87 5.25 3.41 15.35 4.07
Foreign exchange return
Maximum 5.567 5.631 5.448 7.171 4.676 6.814 6.850 6.457 0.000
Minimum �5.916 �8.994 �8.808 �8.733 �3.229 �6.638 �6.680 �4.707 0.000
Average (m) �0.116 �0.212 �0.120 �0.704 �0.192 �0.099 �0.102 �0.302 0.000
Standard deviation (s) 2.396 2.998 2.895 3.242 2.468 2.847 2.834 2.513 0.000
m/s �0.05 �0.07 �0.04 �0.22 �0.08 �0.03 �0.04 �0.12 0.00
Note. Bond value for 1 month is starting from 100 at the beginning of month. Then it is invested into every Asian local bond for 1 month and converted in terms of US
dollar by using every foreign exchange rate against US dollar at the end of month. All series without Indonesia and China are from 2/1999 to 12/2003, and the number of
sample is 59. Indonesia and China are starting from 8/2002 and 6/2001, and each number of sample is 17 and 31, respectively. Interest returns are calculated by every bond
yield. Foreign exchange returns are the actual ex-post foreign exchange related returns which are uncovered by forward transactional the beginning of period and realized
when the bond value are converted in terms of Japanese yen at the end of period.

UN
CO
RR
EC
TED
PR
OO
F
while Malaysian bonds have the lowest (100.15). As for the Sharpe ratio, Korean bonds
have the highest value (0.15), and Malaysian bonds have the lowest (0.05), though there is
little difference between them.
3.1.3. The case of 6-month investments
Table 4 shows bond values and returns of single local currency denominated bonds
for 6-month investments evaluated in terms of US dollars. The results exhibit almost
the same characteristics as the case of 1-month investments. Standard deviations of
bond value for the dollar-pegged currency denominated bonds are lower than the others.
In addition, the variation of standard deviations among the non-dollar-pegging
countries is larger in the case of 6-month investments than the case of 1-month
investments. Among the non-dollar-pegging countries, Singaporean bonds have the
lowest standard deviation (2.51%), Japanese bonds have the highest (7.69%), and
Korean bonds have the second highest (6.05%). Fluctuations in the bond values of the
non-dollar-pegged currency denominated bonds are mainly attributed to fluctuations in
foreign exchange returns. However, the fluctuation in interest returns are larger than the
case of the 1-month investments, suggesting that the difference of bond yields between
countries becomes a more important factor for 6-month investments than for 1-month
investments. Also, the Sharpe ratios are higher for 6-month investments than for 1-
month investments, an indication that longer investment periods lead to higher Sharpe
ratios.
Table 5 shows bond values and returns of 6-month investments in local currency
denominated bonds for investments evaluated in terms of Japanese yen. All the standard
deviations of bond value are higher than for 1-month investments. Excluding Japanese
bonds, Philippine bonds have the highest standard deviation (9.22%), while the
Singaporean bonds have the lowest (5.67%). The impacts of interest returns on bond
values are larger than in the case of 1-month investments. Furthermore, the impacts of
foreign exchange returns and their fluctuations are larger than in the case of 1-month
investments. Thus, foreign exchange returns are still a main contributing factor to
fluctuations in bonds values for investments evaluated in terms of Japanese yen. Korean
bonds have the highest average of bond value (103.02), while the Malaysian bonds have the
lowest (101.11). Korean bonds also have the highest Sharpe ratio (0.51), while the
Malaysian bonds and Philippine bonds have the lowest (0.15). These levels are higher than
for month investments, though they are still lower than for investments evaluated in terms
of US dollars.
3.2. Risk properties of AMU denominated bonds
3.2.1. Composition of AMU denominated bonds and calculation formulas
Next, we simulate returns of AMU denominated bonds which are composed of the
nine East Asian countries’ government bonds to investigate their risk properties. In order to so
this, however, we need to decide on the allocation of weights to each country’s government
bond.
At first, we apply an equal weight as a benchmark, that is, we assume AMU denominated
bonds which are composed of an equal share of each of the East Asian countries’ government
J. Shimizu, E. Ogawa / Journal of Asian Economics xxx (2005) xxx–xxx 9
DTD 5
ASIECO 396 1–22
198
199
200
201
202203
204
205
206
207
208
209
210
211
212
213
214
215
216
217
218219
220
221
222
223
224
225
226
227
228
229
230
231
232
233
234235
236
237
238239

UNCORRECTED PROOF
J.S
him
izu,
E.
Og
aw
a/Jo
urn
al
of
Asia
nE
con
om
icsxxx
(20
05
)xxx–
xxx1
0
DT
D5
AS
IEC
O3
96
1–
22
240
Table 4
Six month bond value of Asian local bonds in terms of US dollar 1999–2003
Singapore Thailand Korea Philippines Indonesia Malaysia Hong Kong China Japan
Bond value
Maximum 106.68 111.94 115.25 111.77 114.75 102.06 103.29 103.25 120.23
Minimum 96.74 89.49 86.70 85.95 102.25 101.34 101.46 102.83 86.92
Average (m) 101.74 101.95 103.70 101.71 109.09 101.48 102.57 103.03 101.63
Return (%) (m � 100)/100 1.74 1.95 3.70 1.71 9.09 1.48 2.57 3.03 1.63
Standard deviation (s) 2.51 4.91 6.05 4.67 4.17 0.14 0.60 0.15 7.69
Return/s 0.69 0.40 0.61 0.37 2.18 10.93 4.26 20.18 0.21
Interest return
Maximum 2.359 3.698 5.183 7.373 7.206 2.059 3.471 3.250 1.065
Minimum 1.066 1.729 2.245 3.248 4.415 1.366 1.459 2.835 0.346
Average (m) 1.854 2.751 3.421 5.560 5.881 1.484 2.603 3.026 0.699
Standard deviation (s) 0.346 0.545 0.826 1.275 0.959 0.133 0.726 0.150 0.180
m/s 5.36 5.05 4.14 4.36 6.13 11.16 3.58 20.13 3.89
Foreign exchange return
Maximum 4.686 8.239 10.631 4.539 8.485 0.026 0.719 0.010 19.191
Minimum �4.935 �13.414 �16.217 �19.286 �2.293 �0.039 �0.335 �0.008 -13.773
Average (m) �0.118 �0.798 0.279 �3.850 3.212 �0.002 �0.030 0.000 0.929
Standard deviation (s) 2.473 5.043 5.773 4.504 3.693 0.014 0.187 0.005 7.638
m/s �0.05 �0.16 0.05 �0.85 0.87 �0.13 �0.16 �0.04 0.12
Note. Bond Value for 6 months is starting from 100 at the beginning of month. Then it is invested into every Asian local bond for 6 months and converted in terms of US
dollar by using every foreign exchange rate against US dollar at the end of period. All series without Indonesia and China are from 2/1999 to 12/2003, and the number of
sample is 53. Indonesia and China are starting from 8/2002 and 6/2001, and each number of sample is 11 and 25, respectively. Interest returns are calculated by every bond
yield. Foreign exchange returns are the actual ex-post foreign exchange related returns which are uncovered by forward transaction at the beginning of period and realized
when the bond values are converted in terms of US dollar at the end of period.

UNCORRECTED PROOF
J.S
him
izu,
E.
Og
aw
a/Jo
urn
al
of
Asia
nE
con
om
icsxxx
(20
05
)xxx–
xxx1
1
DT
D5
AS
IEC
O3
96
1–
22
240
Table 5
Six month bond value of Asian local bonds in terms of Japanese yen 1999–2003
Singapore Thailand Korea Philippines Indonesia Malaysia Hong Kong China Japan
Bond value
Maximum 114.02 116.86 117.17 120.93 116.11 117.82 119.40 116.03 100.90
Minimum 88.18 82.36 89.58 82.97 91.36 85.16 86.66 91.39 100.35
Average (m) 101.21 101.47 103.02 101.35 105.54 101.11 102.20 101.43 100.69
Return (%) (m � 100)/100 1.21 1.47 3.02 1.35 5.54 1.11 2.20 1.43 0.69
Standard deviation (s) 5.67 7.70 5.89 9.22 7.49 7.55 7.72 6.70 0.17
Return/s 0.21 0.19 0.51 0.15 0.74 0.15 0.28 0.21 4.08
Interest return
Maximum 2.371 3.719 5.231 8.342 7.217 2.032 3.607 3.574 0.902
Minimum 1.071 1.610 2.073 2.899 3.940 1.227 1.384 2.581 0.347
Average (m) 1.844 2.746 3.399 5.580 5.712 1.480 2.599 2.982 0.694
Standard deviation (s) 0.350 0.597 0.810 1.501 1.100 0.181 0.760 0.285 0.170
m/s 5.26 4.60 4.20 3.72 5.19 8.16 3.42 10.46 4.08
Foreign exchange return
Maximum 11.785 13.707 11.935 12.587 9.769 15.957 15.937 12.459 0.000
Minimum �13.804 �20.189 �14.139 �22.291 �12.575 �16.101 �16.224 �11.406 0.000
Average (m) �0.636 �1.275 �0.377 �4.226 �0.170 �0.373 �0.402 �1.553 0.000
Standard deviation (s) 5.576 7.542 5.603 8.274 6.632 7.423 7.408 6.450 0.000
m/s �0.11 �0.17 �0.07 �0.51 �0.03 �0.05 �0.05 �0.24 0.00
Note. Bond value for 6 months is starting from 100 at the beginning of month. Then it is invested into every Asian local bond for 6 months and converted in terms of US
dollar by using every foreign exchange rate against US dollar at the end of period. All series without Indonesia and China are from 2/1999 to 12/2003, and the number of
sample is 53. Indonesia and China are starting from 8/2002 and 6/2001, and each number of sample is 11 and 25, respectively. Interest returns are calculated by every bond
yield. Foreign exchange returns are the actual ex-post foreign exchange related returns which are uncovered by forward transaction at the beginning of period and realized
when the bond values are converted in terms of Japanese yen at the end of period.

UN
CO
RR
EC
TED
PR
OO
Fbonds. This is an abstraction from the case of real-world international bond funds, which
investors often use as an index for international portfolio investments, in which their
composition weights are practically based on their size of market capitalization or
outstanding of bonds.10 Table 6 shows the current outstanding of East Asian government
bonds in the market. It indicates that the current outstanding of Japanese government bonds is
much larger than the other East Asian countries, meaning that Japanese bonds would occupy
an extremely large part of the AMU denominated bonds if we decided its composition on the
basis of the current outstanding of the government bonds in market.
In addition to the equally weighted AMU, we calculate two more kinds of AMUs, each
with different country weights. Instead of the above data, we use two kinds of quarterly
data on external debts classified by country and obtained from the Quarterly Review of
BIS: International Debt Securities by Nationality of Issuer (Table 12A in the Quarterly
Review), and International Bonds Notes by Country of Residence (Table 14B in the
Quarterly Review). Based on this data, we calculate two patterns of country weights, BIS1
and BIS2, shown in Tables 7 and 8, respectively.
We next use these three types of AMU denominated bonds to simulate their returns for
US and Japanese investors in the same way as was done for single local currency
denominated bonds. Our formula for calculating the value of AMU denominated bonds in
J. Shimizu, E. Ogawa / Journal of Asian Economics xxx (2005) xxx–xxx12
DTD 5
ASIECO 396 1–22
240
241
242
243
244
245
246
247
248249
250
251
252
253
254
255256
257
258
Table 6
Government bond market outstanding of East Asian countries
Government bond market outstanding
In local currency In the US dollar (billion)
Singaporea 63050 (S$ million) 37.13
Thailandb 742176 (Baht million) 18.73
Malaysiac 130800 (RM million) 34.40
Indonesiad 386522 (IDR billion) 45.89
Philippinese 512646 (PHP million) 9.23
Koreaf 105332 (Won billion) 88.40
Hong Kongg 120152 (HK$ million) 15.48
Chinah 870866 (Yuan million) 105.21
Japani 437564 (Yen billion) 4082.89
Note. We use closing rate of foreign exchange rates against the US dollar in 2003 to convert the outstanding in local
currency into the US dollar. For China, the figure is not a market outstanding but a spot trading turnover of T-Bond
in 2002 due to the constraint of data. The details of each data are fol1ows.a December 2003. Total outstanding of Bills and Bonds of Singapore Government Securities by MAS.b December 2003. Thai BDC Trading and Outstanding of Government securities by BOT.c December 2003. Balances of Conventional Malaysian Government Securities by Bank Negara Malaysia.d November 2003. Market capitalization of government bond in Surabaya Stock Exchange by Bank Indonesia.e May 2003. Claims on National Government Securities by Central Bank of Philippines.f November 2003. Outstanding amounts of Monetary Stabilisation Bonds (public offerings) by Bank of Korea.g December 2003. Outstanding amount of Exchange Fund Bills and Notes by Hong Kong Monetary Authority.h Total in 2002. Turnover of spot trading of T-Bond transaction by People’s Bank of China.i September 2003. Outstanding amounts of Government Bonds by Ministry of Finance HP.
10 For example, the Asian Dollar Bond Index (ADBI) of HSBC is calculated on the basis of shares of the total
market capital in each of East Asian countries.

UN
CO
RR
EC
TED
PR
OO
F
J. Shimizu, E. Ogawa / Journal of Asian Economics xxx (2005) xxx–xxx 13
DTD 5
ASIECO 396 1–22
Table 7
Country weights on the basis of BIS1 (International Debt Securities) (%)
Singapore Thailand Korea Philippines Indonesia Malaysia Hong Kong China Japan
1998/4Q 1.2 3.2 12.0 2.4 na 2.8 7.2 na 71.2
1999/1Q 1.4 3.3 11.7 2.7 na 3.0 7.8 na 70.0
1999/2Q 1.4 3.4 11.3 2.9 na 3.2 8.1 na 69.7
1999/3Q 1.5 3.1 10.5 3.0 na 3.2 8.0 na 70.8
1999/4Q 1.4 3.1 10.4 3.1 na 3.2 8.2 na 70.5
2000/1Q 1.5 3.4 11.6 1.8 na 3.2 6.2 na 72.3
2000/2Q 1.9 3.4 11.6 1.7 na 3.2 6.1 na 72.0
2000/3Q 2.0 3.3 11.8 3.8 na 3.3 7.1 na 68.7
2000/4Q 2.3 3.4 11.9 3.8 na 3.6 7.4 na 67.6
2001/1Q 2.7 3.3 11.8 3.7 na 3.7 8.5 na 66.4
2001/2Q 2.9 3.3 11.5 3.7 na 3.8 8.9 na 65.9
2001/3Q 3.3 2.8 10.7 3.4 na 3.9 8.3 4.1 63.5
2001/4Q 3.7 2.7 11.3 3.7 na 3.8 8.5 4.2 62.1
2002/1Q 4.1 2.7 11.0 4.2 na 4.3 9.7 4.6 59.4
2002/2Q 3.6 2.5 11.2 4.2 na 4.6 9.4 4.2 60.4
2002/3Q 3.6 2.7 11.5 4.2 2.1 4.6 9.0 3.9 58.4
2002/4Q 3.7 2.6 12.0 4.4 2.1 5.0 9.1 3.8 57.2
2003/1Q 3.8 2.6 12.3 4.7 2.1 5.0 9.6 3.6 56.3
2003/2Q 4.2 2.4 12.7 4.9 2.1 5.1 10.0 3.7 54.8
2003/3Q 4.2 2.2 13.3 4.9 2.1 4.8 9.7 3.7 55.0
Source: BIS Quarterly Review, International Debt Securities by Nationality of Issuer (BIS Table 12A). Note.
Country weights are calculated according to the data availability.
Table 8
Country weights on the basis of BIS 2 (International Bonds and Notes) (%)
Singapore Thailand Korea Philippines Indonesia Malaysia Hong Kong China Japan
1998/4Q 2.0 4.9 20.8 3.6 na 5.1 8.4 na 55.3
1999/1Q 2.4 5.2 20.2 4.1 na 5.2 9.3 na 53.5
1999/2Q 2.5 5.5 19.9 4.5 na 5.7 8.9 na 53.0
1999/3Q 4.1 5.5 20.9 6.3 na 6.1 9.4 na 47.8
1999/4Q 4.2 5.4 21.0 6.3 na 6.7 9.7 na 46.7
2000/1Q 3.0 5.5 20.8 5.9 na 5.8 9.9 na 49.1
2000/2Q 3.9 5.5 20.7 6.0 na 5.9 9.2 na 48.7
2000/3Q 2.7 5.1 18.8 4.7 na 5.8 9.6 na 53.4
2000/4Q 3.1 5.7 21.0 5.5 na 6.5 10.7 na 47.5
2001/1Q 4.3 5.3 20.9 6.1 na 6.9 10.2 na 46.3
2001/2Q 4.6 5.1 19.8 6.0 na 6.8 10.4 na 47.4
2001/3Q 5.5 4.5 18.2 5.8 na 7.0 11.3 5.8 42.1
2001/4Q 6.5 4.3 18.7 6.2 na 6.7 10.8 5.6 41.2
2002/1Q 6.8 4.2 17.3 6.6 na 7.1 13.0 5.8 39.2
2002/2Q 6.2 3.8 17.3 6.6 na 7.7 13.0 5.0 40.3
2002/3Q 6.2 3.7 18.7 7.0 1.0 8.0 13.8 5.0 36.7
2002/4Q 6.1 3.6 17.9 7.0 0.9 8.2 13.6 4.4 38.2
2003/1Q 6.2 3.5 18.0 7.2 0.9 8.1 13.9 4.3 37.9
2003/2Q 6.3 3.0 18.3 7.3 1.1 7.9 14.6 4.0 37.4
2003/3Q 6.6 3.0 18.8 7.4 1.3 7.4 14.5 3.9 37.2
Source: BIS Quarterly Review, International Bonds and Notes by Country of Residence (BIS Table 14B). Note.
Country weights are calculated according to the data availability.

UN
CO
RR
EC
TED
PR
OO
F
terms of US dollars for a 1-month investment is represented as follows:11
Bond valuet ðUS dollar equivalentÞ ¼X9
i¼1
wi
�100Et;ið1 þ Yt;iÞ
Etþ1;i
�
¼ 100 þX9
i¼1
wi
�100Et;iYt;i
Etþ1;i
�þX9
i¼1
wi
�100Et;i
Etþ1;i� 100
�
ð¼ principal þ interest return þ foreign exchange returnÞ
(3)
where Et,i is the closing rate of the foreign exchange rate of country i against the US dollar at
month t, and Yt,i is the closing rate of bonds yield of country i on a monthly basis at month t.
Our formula for calculating the value of AMU denominated bonds in terms of US
dollars for a 6-month investment is represented as follows:
Bond valuet ðUS dollar equivalentÞ ¼X9
i¼1
wi
�100Et;ið1 þ Ytþ6
t;i ÞEtþ6;i
�
¼ 100 þX9
i¼1
wi
�100Et;iY
tþ6t;i
Etþ6;i
�þX9
i¼1
wi
�100Et;i
Etþ6;i� 100
�
ð¼ principal þ interest return þ foreign exchange returnÞ
(4)
where Et,i is the closing rate of the foreign exchange rate of country i against the US dollar
at month t, and Ytþ6t is bonds yield calculated at compound interest for 6 months at month t.
Values of the AMU denominated bonds in terms of Japanese yen for 1 month and 6-
month investments are calculated in the same way as in terms of US dollars.
3.2.2. The case of 1-month investments
At first we compare the AMU denominated bonds with single local currency
denominated bonds in terms of risk and Sharpe ratio. Table 9 shows bond values, returns,
and risks evaluated in terms of US dollars. The standard deviation of the equally weighted
AMU denominated bonds is lower than those of each government bond in the six non-
dollar-pegging East Asian countries.
There are two reasons for the equally weighted AMU bond’s risk reducing ability.
Firstly, there is a large reduction of foreign exchange risk due to the equal sharing of
government bonds of all the countries, therefore foreign exchange risk is reduced through
the portfolio effect. Secondly, the inclusion of the Japanese, Malaysian and Singaporean
government bonds reduces interest risk because their interest rates are quite stable. The
Sharpe ratio (0.36) substantially exceeds those of each of the government bonds of non-
dollar-pegging countries. The results suggest that for the investors who evaluate their
returns in terms of US dollars, both foreign exchange risk and interest risk are reduced by
investing in AMU denominated bonds rather than each of the local currency denominated
bonds.
J. Shimizu, E. Ogawa / Journal of Asian Economics xxx (2005) xxx–xxx14
DTD 5
ASIECO 396 1–22
258
259260
261
262263
264265
266
267268
269
270271
272
273
274
275276
277
278
279
280
281
282
283
284
285
11 We suppose the AMU denominated Asian bond as a portfolio investment into the nine East Asian countries’
government bond in this paper.

UN
CO
RR
EC
TED
PR
OO
FThere exist differences in standard deviations among the three types of AMU
denominated bonds, with the standard deviation of the BIS1 type of AMU denominated
bonds having the highest value (2.08%). This is because the weight attributed to Japanese
government bonds is 50–70%, which is relatively higher than the others. With the
exception of Singapore (1.35%), the standard deviation of the BIS2 type of AMU
denominated bonds (1.68%) is lower than the return of investing into single currency
denominated bonds of the non-dollar-pegging countries. The share of Japanese
government bonds in the BIS2 type of AMU denominated bonds is 30–50%, which is
still higher than the equally weighted AMU denominated bonds. The results suggest that a
smaller share of the Japanese government bonds is better for investors who evaluate their
returns in terms of US dollars because the returns of Japanese government bonds are low
with high fluctuations.12
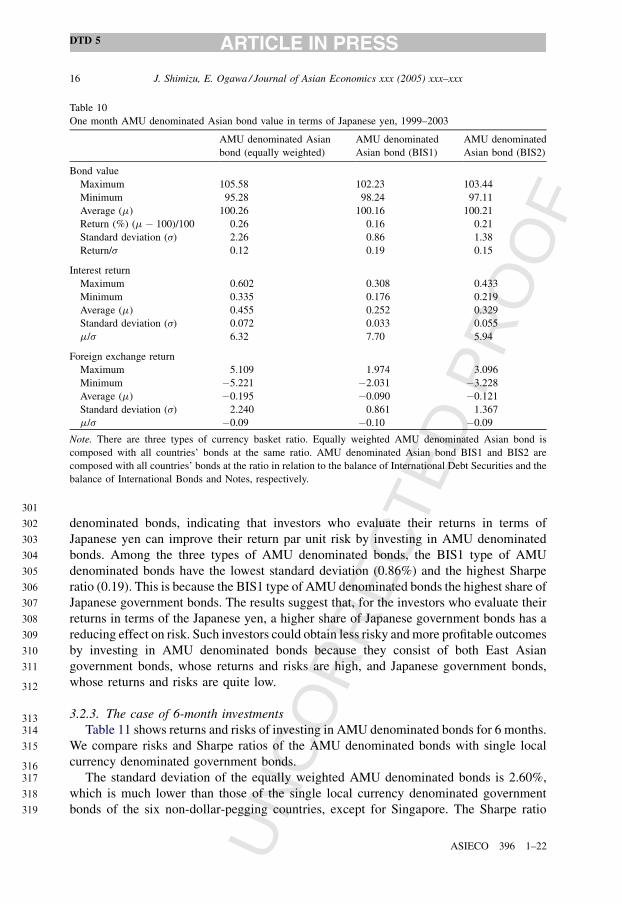
Table 10 shows that, excluding Japanese bonds, the standard deviation of AMU
denominated bonds for investors who evaluate their returns in terms of Japanese yen are
lower than those of the single local currency denominated bonds. Also, with the exception
of Japanese and Korean bonds, their Sharpe ratios are higher than the single local currency
J. Shimizu, E. Ogawa / Journal of Asian Economics xxx (2005) xxx–xxx 15
DTD 5
ASIECO 396 1–22
285
286
287
288
289
290
291
292
293
294
295
296
297298
299
300
301
Table 9
One month AMU denominated Asian bond value in terms of US dollar, 1999–2003
AMU denominated Asian
bond (equally weighted)
AMU denominated
Asian bond (BIS1)
AMU denominated
Asian bond (BIS2)
Bond value
Maximum 102.81 105.58 104.28
Minimum 97.22 94.89 95.55
Average (m) 100.39 100.32 100.35
Return (%) (m � 100)/100 0.39 0.32 0.35
Standard deviation (s) 1.07 2.08 1.68
Return/s 0.36 0.15 0.21
Interest return
Maximum 0.561 0.308 0.426
Minimum 0.345 0.175 0.218
Average (m) 0.462 0.253 0.329
Standard deviation (s) 0.059 0.033 0.055
m/s 7.78 7.65 6.00
Foreign exchange return
Maximum 2.333 5.277 3.858
Minimum �3.194 �5.331 �4.745
Average (m) �0.072 0.066 0.022
Standard deviation (s) 1.068 2.078 1.672
m/s �0.07 0.03 0.01
Note. There are three types of currency basket ratio. Equally weighted AMU denominated Asian bond is
composed with all countries’ bonds at the same ratio. AMU denominated Asian bond BIS1 and BIS2 are
composed with all countries’ bonds at the ratio in relation to the balance of International Debt Securities and the
balance of International Bonds and Notes, respectively.
12 In this paper we focus on the risks and returns of bonds. However, higher share of the Japanese bond should be
desirable if we take into account other factors such as the transaction cost, grade and liquidity in the market.
UN
CO
RR
EC
TED
PR
OO
Fdenominated bonds, indicating that investors who evaluate their returns in terms of
Japanese yen can improve their return par unit risk by investing in AMU denominated
bonds. Among the three types of AMU denominated bonds, the BIS1 type of AMU
denominated bonds have the lowest standard deviation (0.86%) and the highest Sharpe
ratio (0.19). This is because the BIS1 type of AMU denominated bonds the highest share of
Japanese government bonds. The results suggest that, for the investors who evaluate their
returns in terms of the Japanese yen, a higher share of Japanese government bonds has a
reducing effect on risk. Such investors could obtain less risky and more profitable outcomes
by investing in AMU denominated bonds because they consist of both East Asian
government bonds, whose returns and risks are high, and Japanese government bonds,
whose returns and risks are quite low.
3.2.3. The case of 6-month investments
Table 11 shows returns and risks of investing in AMU denominated bonds for 6 months.
We compare risks and Sharpe ratios of the AMU denominated bonds with single local
currency denominated government bonds.
The standard deviation of the equally weighted AMU denominated bonds is 2.60%,
which is much lower than those of the single local currency denominated government
bonds of the six non-dollar-pegging countries, except for Singapore. The Sharpe ratio
J. Shimizu, E. Ogawa / Journal of Asian Economics xxx (2005) xxx–xxx16
DTD 5
ASIECO 396 1–22
301
302
303
304
305
306
307
308
309
310
311
312
313314
315
316317
318
319
Table 10
One month AMU denominated Asian bond value in terms of Japanese yen, 1999–2003
AMU denominated Asian
bond (equally weighted)
AMU denominated
Asian bond (BIS1)
AMU denominated
Asian bond (BIS2)
Bond value
Maximum 105.58 102.23 103.44
Minimum 95.28 98.24 97.11
Average (m) 100.26 100.16 100.21
Return (%) (m � 100)/100 0.26 0.16 0.21
Standard deviation (s) 2.26 0.86 1.38
Return/s 0.12 0.19 0.15
Interest return
Maximum 0.602 0.308 0.433
Minimum 0.335 0.176 0.219
Average (m) 0.455 0.252 0.329
Standard deviation (s) 0.072 0.033 0.055
m/s 6.32 7.70 5.94
Foreign exchange return
Maximum 5.109 1.974 3.096
Minimum �5.221 �2.031 �3.228
Average (m) �0.195 �0.090 �0.121
Standard deviation (s) 2.240 0.861 1.367
m/s �0.09 �0.10 �0.09
Note. There are three types of currency basket ratio. Equally weighted AMU denominated Asian bond is
composed with all countries’ bonds at the same ratio. AMU denominated Asian bond BIS1 and BIS2 are
composed with all countries’ bonds at the ratio in relation to the balance of International Debt Securities and the
balance of International Bonds and Notes, respectively.

UN
CO
RR
EC
TED
PR
OO
F(0.87) substantially exceeds those of the single local currency denominated government
bonds. The reason for this improvement in the Sharpe ratio is attributable to the higher
Sharpe ratio of interest return (8.36). The results suggest that the effect on interest returns
from including the high yield bonds in the AMU denominated bonds increases for longer
investment periods. Among the three types of AMU denominated bonds, the standard
deviations of the BIS1 and BIS2 types of AMU denominated bonds are higher at 5.72 and
4.72%, respectively. Accordingly, investors who evaluate their returns in terms of US
dollars are likely to prefer the equally weighted type to the other types which are based on
the outstanding of external debts.
Table 12 shows the performances of the AMU denominated bonds evaluated in
terms of Japanese yen. The standard deviations of the AMU denominated bonds are
lower than those of the single local currency denominated bonds, with the exception of
Japanese bonds. Their Sharpe ratios are higher than those of the single local currency
denominated bonds, except for Japanese and Korean bonds. Among the three types of
AMU denominated bonds, the standard deviation of the BIS1 type of AMU denominated
bonds is the lowest (2.12%), and its Sharpe ratio is the highest (0.52). Investors
who evaluate their investments in terms of the Japanese yen could invest in AMU
denominated bonds to improve the Sharpe ratio because AMU denominated bonds have a
higher Sharpe ratio of interest return. The results suggest that the effect of including the
J. Shimizu, E. Ogawa / Journal of Asian Economics xxx (2005) xxx–xxx 17
DTD 5
ASIECO 396 1–22
319
320
321
322
323
324
325
326
327
328329
330
331
332
333
334
335
336
337
338
Table 11
Six month AMU denominated Asian bond value in terms of US dollar, 1999–2003
AMU denominated Asian
bond (equally weighted)
AMU denominated
Asian bond (BIS1)
AMU denominated
Asian bond (BIS2)
Bond value
Maximum 106.69 115.24 112.56
Minimum 96.19 89.57 90.69
Average (m) 102.26 101.90 102.11
Return (%) (m � 100)/100 2.26 1.90 2.11
Standard deviation (s) 2.60 5.72 4.76
Return/s 0.87 0.33 0.44
Interest return
Maximum 3.387 1.915 2.644
Minimum 2.183 1.161 1.433
Average (m) 2.771 1.506 1.977
Standard deviation (s) 0.332 0.204 0.323
m/s 8.36 7.40 6.12
Foreign exchange return
Maximum 4.005 13.381 10.235
Minimum �6.655 �11.905 �11.127
Average (m) �0.506 0.392 0.129
Standard deviation (s) 2.667 5.655 4.724
m/s �0.19 0.07 0.03
Note. There are three types of currency basket ratio. Equally weighted AMU denominated Asian bond is
composed with all countries’ bonds at the same ratio. AMU denominated Asian bond BIS1 and BIS2 are
composed with all countries’ bonds at the ratio in relation to the balance of International Debt Securities and the
balance of International Bonds and Notes, respectively.

UN
CO
RR
EC
TED
PR
OO
Fhigh yield bonds in the AMU denominated bonds on interest returns increases for longer
time periods.
4. The foreign exchange risk reduction effect of the AMU denominated bonds
In the previous section, we conducted a simulation analysis to show that investors would
be able to reduce the risk of investment returns by investing in AMU denominated bonds. In
this section, we focus specifically on foreign exchange risk and give a theoretical
explanation on how investing in AMU denominated bonds can contribute to reducing
foreign exchange risk.
International portfolio diversification is widely practiced by investors who seek to
reduce their investment risks. Recently, international investors have been turning to foreign
markets to obtain greater scope for diversification than can be offered in domestic markets.
However, when investing in foreign currency denominated bonds it is important to
consider, not only the portfolio effects on interest returns and risks, but also foreign
exchange returns and risks.
To expand on this, at first, we use a basic portfolio theory to explain the portfolio effect
on reducing investment risks. A return (Rp) of portfolio investment in bonds of country i (its
J. Shimizu, E. Ogawa / Journal of Asian Economics xxx (2005) xxx–xxx18
DTD 5
ASIECO 396 1–22
338
339
340
341342
343
344
345
346347
348
349
350
351
352353
354
Table 12
Six month AMU denominated Asian bond value in terms of Japanese yen, 1999–2003
AMU denominated Asian
bond (equally weighted)
AMU denominated
Asian bond (BIS1)
AMU denominated
Asian bond (BIS2)
Bond value
Maximum 112.81 105.50 108.31
Minimum 87.97 96.51 94.44
Average (m) 101.74 101.11 101.39
Return (%) (m � 100)/100 1.74 1.11 1.39
Standard deviation (s) 5.77 2.12 3.27
Return/s 0.30 0.52 0.43
Interest return
Maximum 3.404 1.845 2.651
Minimum 2.008 1.159 1.383
Average (m) 2.762 1.496 1.968
Standard deviation (s) 0.398 0.199 0.343
m/s 6.94 7.50 5.74
Foreign exchange return
Maximum 9.767 3.883 6.146
Minimum �14.678 �4.874 �7.513
Average (m) �1.027 �0.390 �0.577
Standard deviation (s) 5.565 2.049 3.122
m/s �0.18 �0.19 �0.18
Note. There are three types of currency basket ratio. Equally weighted AMU denominated Asian bond is
composed with all countries’ bonds at the same ratio. AMU denominated Asian bond BIS1 and BIS2 are
composed with all countries’ bonds at the ratio in relation to the balance of International Debt Securities and the
balance of International Bonds and Notes, respectively.

UN
CO
RR
EC
TED
PR
OO
F
return is Ri) with its share w at time t is represented as follows:
Rp;t ¼Xn
i¼1
wRi;t (5)
where w ¼ ðw1;w2; . . . ;wnÞ.This portfolio has the following expected returns and var-
iance:
mp ¼ nXi¼1
wimi
s2p ¼
XXi; j
si j ¼ ðw1; . . . ;wnÞs11; s12; . . . ; s1n
..
. ... ..
.
sn1; sn2; . . . ; snn
0B@
1CA
w1
..
.
wn
0B@
1CA ¼ wTVw
(6)
where mi is the expectation value of Ri, s2i is the variance of Ri, sij is the covariance with Ri
and Rj, rij is the correlation coefficient with Ri and Rj, and
V is the variance–covariance matrix of sij.
Then we separate the variance (V2p ) of the portfolio return into a sum of variances and a
sum of covariance as follows:
V2p ¼
Xn
i¼1
w2i s
2i þ 2
XXi< j
wiw jsi j (7)
The portfolio effect means that the variance of portfolio returns should be smaller when
investors increase the diversity of bonds, because fluctuations in each bond’s return partly
cancels out with each other. We can use the portfolio theory to examine the portfolio effect
on foreign exchange risk of AMU denominated bonds for international investors, so in this
section we focus on how AMU denominated bonds can reduce foreign exchange risk.
The variance of returns from the equally weighted AMU denominated bonds is
represented as follows:
s2p ¼ 1
n
�1
n
Xn
i¼1
s2i
�þ 2
n2
XXi< j
i j ¼ 1
nðaverage of s2
i Þ þnðn � 1Þ
n2ðaverage of si jÞ
(8)In the above equation, the first term is the average of foreign exchange risk of each of
the local government bonds. The AMU denominated bonds are composed of the non-
dollar-pegging countries’ government bonds and the dollar-pegging countries’
government bonds. The former have a high foreign exchange risk while the latter have
a nearly zero exchange risks against the US dollar. Accordingly, the foreign exchange risk
of investing AMU denominated bonds is substantially lower than that of investing in
individual local government bonds in non-dollar-pegging countries. The second term is
almost equal to an average of covariance of exchange rate returns among the local
government bonds.
The covariance (sij) is described as follows:
si j ¼ ri jsis j (9)
J. Shimizu, E. Ogawa / Journal of Asian Economics xxx (2005) xxx–xxx 19
DTD 5
ASIECO 396 1–22
354
355356
357
358359
360
361
362363
364365366367
368
369
370
371372
373374375376
377
378
379
380
381
382
383
384
385386

UN
CO
RR
EC
TED
PR
OO
F
If the correlation coefficient rij is negative and, in turn, sij also is negative, portfolio
investments reduce foreign exchange risk more. The AMU denominated bonds consist of the
dollar-pegged currency denominated bonds and the non-dollar-pegged currency denomi-
nated bonds. Even for the non-dollar-pegging countries in East Asia, their currencies are
highly correlated movements in the US dollar. Correlation coefficients among East Asian
currencies, especially the dollar-pegged currencies and the Japanese yen tend to be negative
in terms of the foreign exchange returns. Tables 13 and 14 show correlation coefficient
matrixes of investing in government bonds in terms of US dollars during 1- and 6-month
periods, respectively. Both of the tables show that most of the correlation coefficients
between the dollar-pegging countries and the non-dollar-pegging countries are negative.
Accordingly, for investors who evaluate their returns in terms of US dollars, the AMU
denominated bonds should be effective in reducing foreign exchange risk.
For investors who evaluate their returns in terms of Japanese yen, the average of foreign
exchange risk in the first term could be reduced by including the Japanese government
bonds in the AMU denominated bonds. The higher is the share of the Japanese government
bonds; the lower is the foreign exchange risk of the AMU denominated bonds.
Accordingly, the AMU denominated bonds are likely to have the portfolio effect of
reducing foreign exchange risks for Asian bonds regardless of whether the investor
evaluates returns in terms of US dollars or Japanese yen.
J. Shimizu, E. Ogawa / Journal of Asian Economics xxx (2005) xxx–xxx20
DTD 5
ASIECO 396 1–22
385386387388
389
390
391
392
393
394
395
396
397
398
399400
401
402
403404
405
406
Table 13
Pairwise correlation matrix for 1 month Asian Government bond returns in terms of US dollar
Singapore Thailand Malaysia Philippines Indonesia Korea Hong Kong China Japan
Singapore 1.0000 0.5946 �0.0535 0.3486 0.3076 0.4203 0.1060 0.1626 0.5449
Thailand 0.5946 1.0000 �0.0848 0.6382 0.3444 0.4245 �0.0183 0.1259 0.2808
Malaysia �0.0535 �0.0848 1.0000 �0.0092 0.1418 �0.0982 0.3295 0.2159 �0.0831
Philippines 0.3486 0.6382 �0.0092 1.0000 0.2945 0.1739 0.0036 0.1552 0.1306
Indonesia 0.3076 0.3444 0.1418 0.2945 1.0000 0.3026 0.1946 0.2635 0.0809
Korea 0.4203 0.4245 �0.0982 0.1739 0.3026 1.0000 0.1017 0.1023 0.3954
Hong Kong 0.1060 �0.0183 0.3295 0.0036 0.1946 0.1017 1.0000 0.4358 0.0910
China 0.1626 0.1259 0.2159 0.1552 0.2635 0.1023 0.4358 1.0000 �0.0965
Japan 0.5449 0.2808 �0.0831 0.1306 0.0809 0.3954 0.0910 �0.0965 1.0000
Note. Author’s calculation.
Table 14
Pairwise correlation matrix for 6 month Asian Government bond returns in terms of US dollar
Singapore Thailand Malaysia Philippines Indonesia Korea Hong Kong China Japan
Singapore 1.0000 0.2848 �0.0576 �0.0037 �0.5217 0.5050 �0.1326 0.0653 0.8201
Thailand 0.2848 1.0000 �0.5065 0.7084 �0.1620 0.4801 �0.4753 0.1519 0.2645
Malaysia �0.0576 �0.5065 1.0000 �0.2357 0.1929 �0.3150 0.6806 �0.1344 �0.0719
Philippines �0.0037 0.7084 �0.2357 1.0000 0.8133 0.1773 �0.2250 0.6002 �0.0654
Indonesia �0.5217 �0.1620 0.1929 0.8133 1.0000 0.0944 �0.4720 �0.1560 �0.6802
Korea 0.5050 0.4801 �0.3150 0.1773 0.0944 1.0000 �0.0600 0.2846 0.6343
Hong Kong �0.1326 �0.4753 0.6806 �0.2250 �0.4720 �0.0600 1.0000 0.8772 �0.0579
China 0.0653 0.1519 �0.1344 0.6002 �0.1560 0.2846 0.8772 1.0000 �0.2712
Japan 0.8201 0.2645 �0.0719 �0.0654 �0.6802 0.6343 �0.0579 �0.2712 1.0000
Note. Author’s calculation.

UN
CO
RR
EC
TED
PR
OO
F
5. Conclusions
In this paper, we conducted a simulation analysis to investigate the risk properties of
AMU denominated bonds, where risks where divided into interest risk and foreign
exchange risk.For both investors who evaluate their returns in terms of the US dollar and
investors who evaluate their returns in terms of Japanese yen, the risk of investing in AMU
denominated bonds are likely to be lower than those of investmenting in each of the local
currency denominated bonds in the East Asian countries, except for the dollar-pegging
countries. Especially for investors who evaluate their returns in terms of US dollars,
investing in equally weighted AMU denominated bonds is effective, both in reducing risk
and improving the Sharpe ratio, in comparison with investing in each of the East Asian
countries’ government bonds, with the exception of the dollar-pegging countries. The is
due to the reduction of foreign exchange risk from the portfolio effect. It is important to
note, however, that these results depend on the currency system in the East Asian countries.
On the other hand, the composition weight of the Japanese yen denominated bonds in
the AMU denominated bonds is critical for investors who evaluate their returns in terms of
Japanese yen. Due to the higher composition weight of Japanese government bonds in the
BIS1 type of AMU denominated bonds, these bonds should have the lowest risk and the
highest Sharpe ratio for investors who evaluate their returns in terms of the Japanese yen, in
contrast to investors who evaluate their returns in terms of US dollars. In addition, for both
investors who evaluate their returns in terms of US dollars and Japanese yen, the effect on
the interest return from including high yield bonds in AMU denominated bonds is larger for
longer investment periods.
When investors evaluate their returns of investing in single currency denominated
government bonds, their risks depend on foreign exchange risk rather than interest risk.
Therefore, the introduction of AMU denominated bonds could prevent contagion selling of
local currency denominated bonds caused by a sudden depreciation of one local currency.
In this paper, our results were obtained after making some simplifying assumptions in
our analysis, however, these assumptions will be reconsidered in future research. Firstly,
we assumed a partial equilibrium, and therefore we did not consider the possibility of bond
returns and risks being affected by investors’ behavior. Examining the effects of the
widespread adoption of AMU bonds in East Asian countries on bond returns and risks is
therefore a topic for future discussion.
Secondly, in this paper we focused only on the risk reduction effects of AMU
denominated bonds. However, other important factors such as transaction costs, market
liquidity and credit rating, all influence investors’ decisions, so they also need to be
included in the analysis.13 Finally, our results indicate that the risk reduction effect of AMU
denominated bonds largely depends on the country share, meaning that, while taking into
account returns from AMU denominated bonds, further discussion on optimal share levels
for risk reduction will be called for in the near future.
J. Shimizu, E. Ogawa / Journal of Asian Economics xxx (2005) xxx–xxx 21
DTD 5
ASIECO 396 1–22
406
407408
409
410
411
412
413
414
415
416
417
418
419420
421
422
423
424
425
426
427
428429
430
431
432433
434
435
436
437
438439
440
441
442
443
444
445
13 For example, concerning the influence of transaction cost, when transaction cost is required for holding
overseas assets, the efficient frontier shifts to the lower part equal to the transaction cost amount and the investor’s
utility is seemed to decrease.

UN
CO
RR
EC
TED
PR
OO
F
Uncited references
Ito and Park (2004) and Ito (2004).
Acknowledgements
The authors are grateful to the anonymous referees, Yu-chin Chen and participants of
the Asian Crisis VI Conference and the APEF Conference.
References
Benassy-Quere, A. (1999). Optimal pegs for East Asian currencies. Journal of the Japanese and International
Economies, 13, 44–60.
Ito, T. (2003). Construction of infrastructures for the development of regional bonds market. In C. Y. Ahn, T. Ito,
M. Kawai, & Y. C. Park (Eds.), Financial development and integration in East Asia (pp. 206–222). Korea
Institute for International Economic Policy.
Ito, T. (2004). Promoting Asian basket currency bonds. In T. Ito, & Y. C. Park (Eds.), Developing Asian
BONDSMARKETS (pp. 67–89). Asian Pacific Press at the Australian National University.
Ito, T., Ogawa, E., & Sasaki, N. Y. (1998). How did the dollar peg fail in Asia? Journal of the Japanese and
International Economies, 12, 256–304.
Ito, T., & Park, Y. C. (2004). Overview: Challenges and strategies. In T. Ito, & Y. C. Park (Eds.), Developing Asian
BONDSMARKETS (pp. 1–15). Asian Pacific Press at the Australian National University.
Kaminisky, G. L., Lyons, R., & Schmukler, S. (in press). Manager, investors, and crises: Mutual fund strategies in
emerging markets, Journal of International Economics.
Kawai, M., Ogawa, E., & Ito, T. (2004). Developing new regional financial architecture: A proposal (mimeo).
Krugman, P. (1999). Balance sheets, the transfer problem, and financial crises. International Tax and Public
Finance, 459–473.
Kuroda, H., & Kawai, M. (2003). Strengthening Regional Financial Cooperation in East Asia (PRI Discussion
Paper Series No. 03A-10).
Mello, L. de, & Hussein, K. (2001). Is foreign debt portfolio management efficient in emerging economies? (IMF
Working Paper WP/01/121).
Ogawa, E., & Ito, T. (2002). On the desirability of a regional basket currency arrangement. Journal of the Japanese
and International Economies, 16(3), 317–334.
Ogawa, E., Ito, T., & Sasaki, N. Y. (2004). Costs, benefits, and constraints of the basket currency regime. In Asian
Development Bank (Ed.), Monetary and financial integration in East Asia: The way ahead (Vol. 2, pp. 209–
239). Palgrave.
Ogawa, E., & Shimizu, J. (2002). Roles of regional currency in bonds markets in East Asia (Working Paper No.
81). Hitotsubashi University, Faculty of Commerce.
Ogawa, E., & Shimizu, J. (2004). Bonds issuers’ trade-off for common currency basket denominated bonds in East
Asia. Journal of Asian Economics, 15, 719–738.
Schinasi, G. J., & Smith, R. T. (1999). Portfolio diversification, leverage, and financial contagion (IMF Working
Paper WP/99/136).
Williamson, J. (2000). Exchange rate regimes of emerging markets: Reviving the intermediate option. Institute for
International Economics: Washington, DC.
J. Shimizu, E. Ogawa / Journal of Asian Economics xxx (2005) xxx–xxx22
DTD 5
ASIECO 396 1–22
445
446
447
448449
450
451452
453454
455
456457
458459
460461
462463
464
465466
467468
469470
471472
473474
475
476477
478479
480481
482483
484484