Risk Attributor US - Hedge Fund Software | Arbor … as VaR (Value at Risk), risk ratios (Sharpe,...
8
© Arbor Financial Systems 2017 [email protected] www.arborfs.com 1 Arbor Risk Attributor Overview Arbor Risk Attributor is now seamlessly integrated into Arbor Portfolio Management System. Our newest feature enables you to automate your risk reporting needs, covering substantial areas such as VaR (Value at Risk), risk ratios (Sharpe, Sortino & Treynor Ratio) and statistical fund volatility indicators (skewness, kurtosis, correlation coefficient & information ratio) for multiple asset classes. Data from our Risk Attributor can also be sent on a daily basis to our Reporting Portal. This allows us (or you) to create interactive reports and slideshows with drilldown capability, which will look great in your pitch-decks and management level reporting. These reports can be viewed on your phone, tablets or PC. Report can be automated from Arbor Portfolio Manager and delivered in your preferred frequency (daily, weekly or monthly). At the same time, your risk reporting data can also be integrated to Arbor Reporting Portal, allowing you to create stylish, interactive and transparent report on risk analysis for multiple asset classes within the past 12 months.
Transcript of Risk Attributor US - Hedge Fund Software | Arbor … as VaR (Value at Risk), risk ratios (Sharpe,...

1
Arbor Risk Attributor
Overview Arbor Risk Attributor is now seamlessly integrated into Arbor Portfolio Management System. Our newest feature enables you to automate your risk reporting needs, covering substantial areas such as VaR (Value at Risk), risk ratios (Sharpe, Sortino & Treynor Ratio) and statistical fund volatility indicators (skewness, kurtosis, correlation coefficient & information ratio) for multiple asset classes. Data from our Risk Attributor can also be sent on a daily basis to our Reporting Portal. This allows us (or you) to create interactive reports and slideshows with drilldown capability, which will look great in your pitch-decks and management level reporting. These reports can be viewed on your phone, tablets or PC. Report can be automated from Arbor Portfolio Manager and delivered in your preferred frequency (daily, weekly or monthly). At the same time, your risk reporting data can also be integrated to Arbor Reporting Portal, allowing you to create stylish, interactive and transparent report on risk analysis for multiple asset classes within the past 12 months.

2
Value at Risk (VaR) In Arbor’s standard risk reporting package, clients will gain a comprehensive overview of their short-term and long-term VaR (with 95% confidence level). We will also provide details on each product’s volatility based on its prices within the past year – enabling you to examine which products are riskier than others. Stress Testing & Stressed VaR Besides regular VaR, our Risk Attributor also enables the users to identify particular periods where prices or return on asset classes, portfolio or individual investments fluctuate more than the calculated VaR. We can also include statistical analysis containing price, standard deviation and volatility shocks. In the graph below, you can see that Stressed VaR is generally higher than its regular counterpart in the respective timeframe.
Risk Ratios (Sharpe, Treynor, Sortino) In our risk-reporting package, you can opt in to add several risk ratios to your risk reports and dashboard. Sharpe and Treynor ratio provide you with a risk-adjusted performance indicator in terms of diversifiable risk (risk based on positions in your fund), also known as market risk. Our report, as shown below, will automate each risk ratio for each reporting month. This makes it easy to recognize the fund period when your fund is more volatile fundamentally and / or systematically.

3
The green graph above represents Sortino Ratio, which assists you in evaluating your fund return based on the volatility level of your losing positions. A higher Sortino ratio shows the fund period where your fund is more volatile to positions with negative return. Information Ratio Information Ratio (or IR for short), is useful to measure not only a fund manager’s ability to generate excess return, but also the consistency of the performance of his investment. A high information ratio shows the period where a fund outperforms its benchmark in terms of return and diversifiable risk, making this ratio especially important for hedge funds with multiple fund managers, which host investors with multiple risk profiles.
4
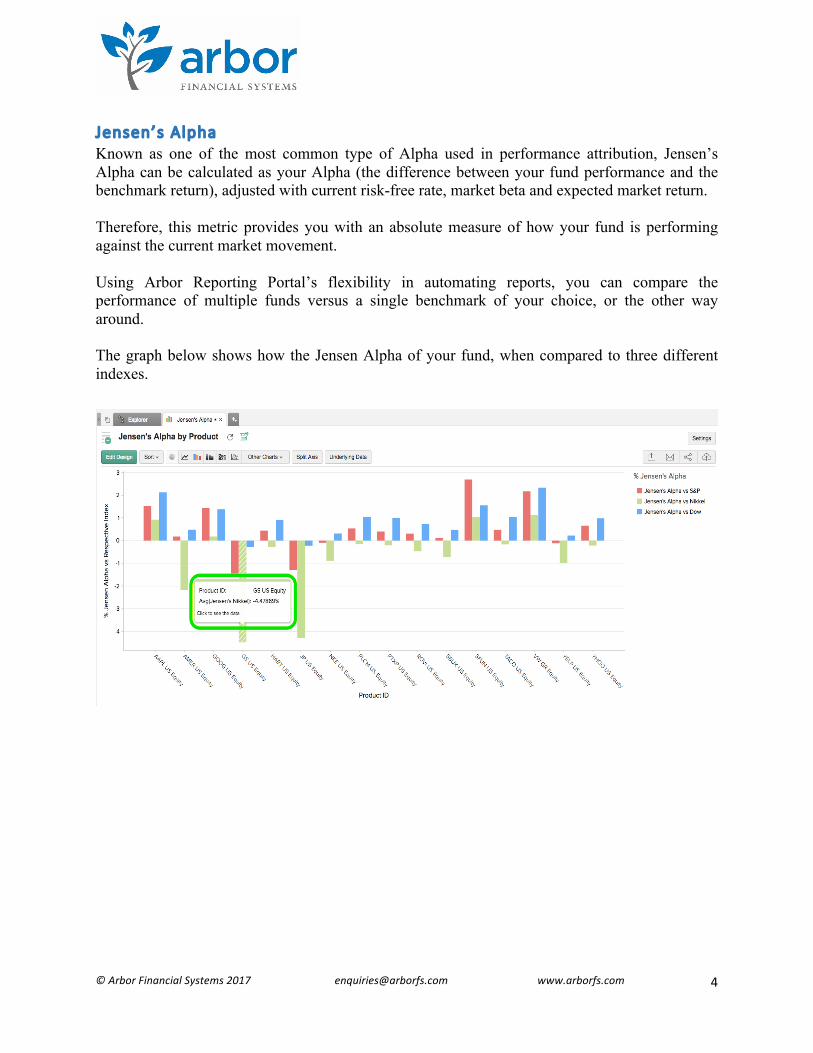
Jensen’s Alpha Known as one of the most common type of Alpha used in performance attribution, Jensen’s Alpha can be calculated as your Alpha (the difference between your fund performance and the benchmark return), adjusted with current risk-free rate, market beta and expected market return. Therefore, this metric provides you with an absolute measure of how your fund is performing against the current market movement. Using Arbor Reporting Portal’s flexibility in automating reports, you can compare the performance of multiple funds versus a single benchmark of your choice, or the other way around. The graph below shows how the Jensen Alpha of your fund, when compared to three different indexes.
5
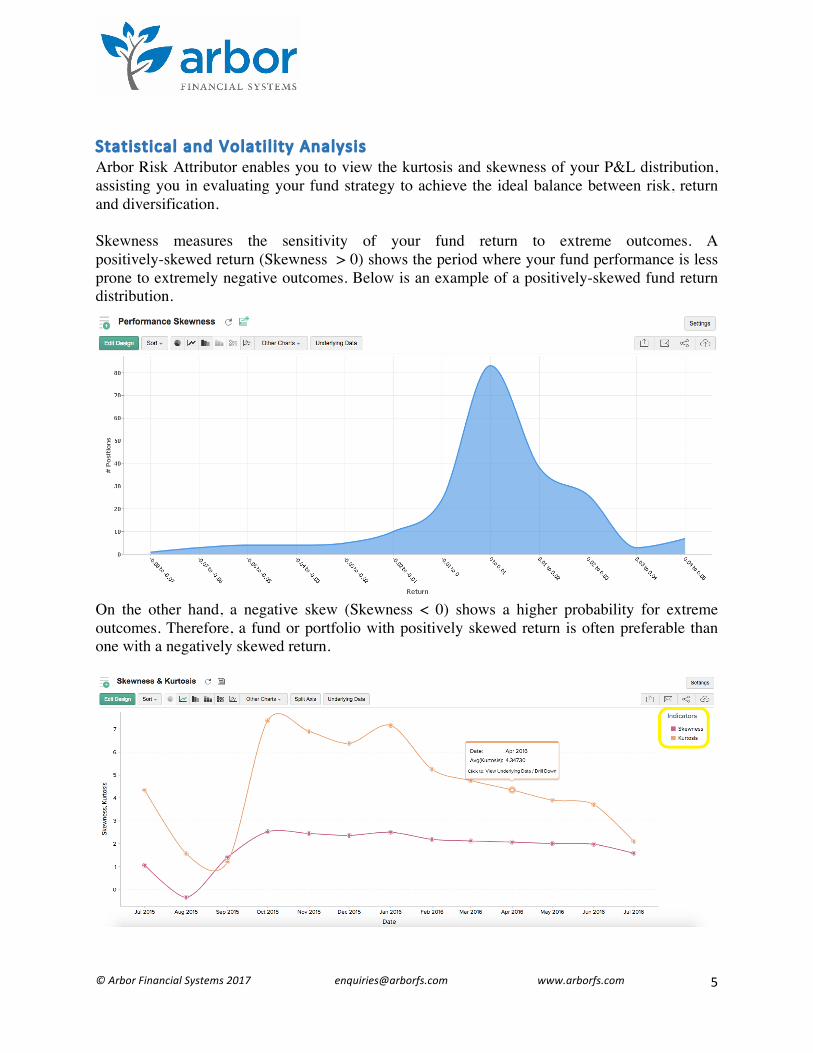
Statist ical and Volati l ity Analysis Arbor Risk Attributor enables you to view the kurtosis and skewness of your P&L distribution, assisting you in evaluating your fund strategy to achieve the ideal balance between risk, return and diversification. Skewness measures the sensitivity of your fund return to extreme outcomes. A positively-skewed return (Skewness > 0) shows the period where your fund performance is less prone to extremely negative outcomes. Below is an example of a positively-skewed fund return distribution. On the other hand, a negative skew (Skewness < 0) shows a higher probability for extreme outcomes. Therefore, a fund or portfolio with positively skewed return is often preferable than one with a negatively skewed return.

6
Similarly, kurtosis measures the extremity of your fund return. A leptokurtic return (Kurtosis > 3) informs you the periods when your fund is less prone to extreme outcomes, or when your returns are close to your average P&L, whereas a platykurtic return (kurtosis < 3) signals higher probability of extreme outcomes. The graph above shows a month where a fund’s Kurtosis and Skewness are unusually high. We can also group these parameters based on metrics you find important, such as product ID, asset class or investment sector. Performance Statist ics Reports Arbor Performance Statistic Reports allows you to see all the risk metrics that have been comprehensively discussed in several paragraphs above. You can also gauge metrics not only on risk, but also on investor consistency (such as standard error and tracking error) and on movement between your fund and its benchmark (correlation coefficient & coefficient of determination). Tracking Error Tracking error measures the consistency of your fund against a benchmark over a period of time. A high tracking error underlines the volatility in a portfolio – for example, a tracking error of 1% assumes that your fund will return its benchmark return, plus or minus 1%. Therefore, a fund that realized low returns and has a high tracking error shows something wrong with the included investments. This means that the fund is performing worse than the benchmark, and is also more volatile at the same time.

7
Standard Error Standard error measures how widely dispersed a range of parameter is from its average. In trading, standard error can be considered as an accurate estimate of the difference between the opening and closing price. The higher the standard error of a product, the more likely its closing price will deviate from its opening price – which is great for risk-seeking investors, but not ideal for risk-averse traders. Correlation Coefficient Correlation coefficient measures the strength and direction of a linear relationship between two variables (e.g: prices between 2 products, P&L between 2 funds, etc). If the correlation between a fund and its benchmark is close to 1 (like graph above), their movements are more likely to be similar (when the index value goes up, the fund also goes up).

8
A correlation close to 0 (like the graph above) shows a total independence between a fund and its benchmark, which means that an increase (or decrease) of your fund return doesn’t have anything to do with the increase or decrease of the benchmark return. On the other hand, if the correlation between your fund and its benchmark is close to -1, they are likely to move in the opposite direction (e.g: if your fund value goes up, the benchmark value goes down, and vice versa). Coefficient of Determination Coefficient of determination, also known as ‘R2’ or Goodness of Fit, measures whether a fund / benchmark can be utilized to measure the variability of another fund. Coefficient of determination ranges between 0 and 1. The closer it is to one, the more likely each factor (e.g: a fund and its benchmark) is dependent on one another. If it’s closer to 0, there’s higher possibility that these two factors are independent from each other. Coefficient of determination can easily be calculated by squaring correlation (R2). Should you require further information on our Risk Attributor, please contact us at [email protected] or at +1(415)500-9880.