RISE OF THE GLOBAL STARTUP CITY - Martin Prosperity...
36
RISE OF THE GLOBAL STARTUP CITY The Geography of Venture Capital Investment in Cities and Metros across the Globe Cities
Transcript of RISE OF THE GLOBAL STARTUP CITY - Martin Prosperity...

RISE OF THE GLOBAL STARTUP CITY
The Geography of Venture Capital Investment in Cities and Metros across the Globe
Cities

The Cities Project at the Martin Prosperity Institute focuses on the role of cities as the key economic and social organizing unit of global capitalism. It explores both the opportunities and challenges facing cities as they take on this heightened new role.
The Martin Prosperity Institute, housed at the University of Toronto’s Rotman School of Management, explores the requisite underpinnings of a democratic capitalist economy that generate prosperity that is both robustly growing and broadly experienced.
RISE OF THE GLOBAL STARTUP CITY
The Geography of Venture Capital Investment in Cities and Metros across the Globe
Richard FloridaKaren M. King

4 Rise of the Global Startup City
Contents
Executive Summary 6
Introduction 8
Mapping the World’s Leading Venture Capital Centers 10 Mapping Venture Capital Investment per Capita 10
Mapping Venture Capital Investment as a Share of Economic Output 13
Venture Capital Centers Compared to Leading Global Cities 16
Venture Capital Investment by Geographic Region 18 Venture Capital Investment in North America 18
Venture Capital Investment in Europe 22
Venture Capital Investment in Asia 27
Conclusion 32
Data and Methodology 33
References 34
About the Authors 35

Rise of the Global Startup City5
Exhibits
Exhibit 1 Global Venture Capital Investment 10
Exhibit 2 Top 20 Global Metros by Venture Capital Investment 11
Exhibit 3 Venture Capital Investment per Capita by Metro 12
Exhibit 4 Top 20 Metros by Venture Capital Investment per Capita 13
Exhibit 5 Venture Capital Investment as a Share of Metro Economic Output 14
Exhibit 6 Top 20 Metros by Venture Capital Investment as a Share of Economic Output 15
Exhibit 7 Comparing Global Cities and Venture Capital Investment 17
Exhibit 8 Venture Capital Investment in North America 18
Exhibit 9 Top 20 Metros in North America by Venture Capital Investment 19
Exhibit 10 Venture Capital Investment in North America per Capita 20
Exhibit 11 Top 10 Metros in North America by Venture Capital Investment per Capita 21
Exhibit 12 Venture Capital Investment in North America as a Share of Metro Economic Output 21
Exhibit 13 Top 10 Metros in North America by
Venture Capital Investment as a Share of Metro Economic Output 22
Exhibit 14 Venture Capital Investment in Europe 23
Exhibit 15 Top 20 Metros in Europe by Venture Capital Investment 24
Exhibit 16 Venture Capital Investment in Europe per Capita 25
Exhibit 17 Top 10 Metros in Europe by Venture Capital Investment per Capita 25
Exhibit 18 Venture Capital Investment in Europe as a Share of Metro Economic Output 26
Exhibit 19 Top 10 Metros in Europe by Venture Capital Investment as a Share of Metro Economic Output 26
Exhibit 20 Venture Capital Investment in Asia 27
Exhibit 21 Top 20 Metros in Asia by Venture Capital Investment 28
Exhibit 22 Venture Capital Investment in Asia per Capita 29
Exhibit 23 Top 10 Metros in Asia by Venture Capital Investment per Capita 29
Exhibit 24 Venture Capital Investment in Asia as a Share of Metro Economic Output 30
Exhibit 25 Top 10 Metros in Asia by Venture Capital Investment as a Share of Metro Economic Output 30

6 Rise of the Global Startup City
Executive Summary
Once the province of American tech hubs like California’s Silicon Valley, venture capital has gone global. This report uses detailed data from Thomson Reuters to chart the world’s leading centers for ven-ture capital investment.
Its main findings are as follows.
• Venture capital investment across the world totalled $42 billion in 2012, spread across more than 150 cities and metro regions globally.
• The top 10 metros account for more than half (52 percent), the top 20 metros account for almost two-thirds, and the top 50 more than 90 percent of total global venture investment.
• The United States accounts for nearly 70 percent (68.6 percent) of total global venture capital, followed by Asia (14.4 percent) and Europe (13.5 percent).
• The San Francisco Bay Area, which spans Silicon Valley and San Francisco proper, remains the world’s leading center for venture capital investment attracting nearly $11 billion dollars, more than
Rise of the Global Startup City7
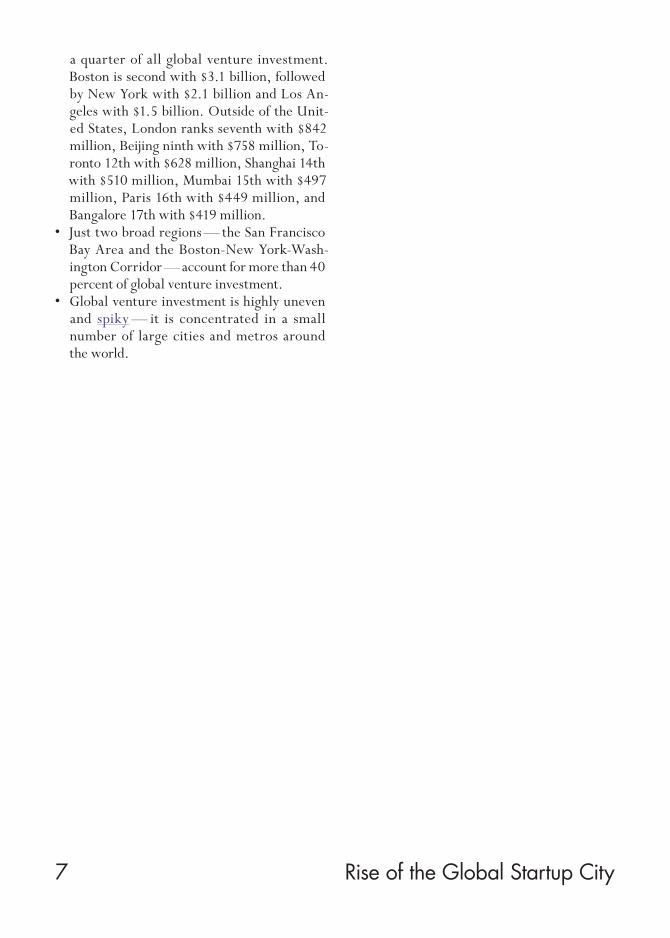
a quarter of all global venture investment. Boston is second with $3.1 billion, followed by New York with $2.1 billion and Los An-geles with $1.5 billion. Outside of the Unit-ed States, London ranks seventh with $842 million, Beijing ninth with $758 million, To-ronto 12th with $628 million, Shanghai 14th with $510 million, Mumbai 15th with $497 million, Paris 16th with $449 million, and Bangalore 17th with $419 million.
• Just two broad regions — the San Francisco Bay Area and the Boston-New York-Wash-ington Corridor — account for more than 40 percent of global venture investment.
• Global venture investment is highly uneven and spiky — it is concentrated in a small number of large cities and metros around the world.
8 Rise of the Global Startup City
Introduction
Once the near exclusive province of American tech hubs like Cali-fornia’s Silicon Valley, venture capital has gone global. A number of studies over the past several years attempted to trace the world’s leading centers for startups, high-tech industry clusters, and venture capital investment.1 While these studies provide useful information and context to understand the globalization of startups and venture capital, they tend to be based on data that is not necessarily compa-rable and systematic.
This report uses detailed data from Thomson Reuters to chart the world’s leading centers for venture capital investment. These data provide granular information on venture capital investment globally as well as the geographic location of venture investments. We aggre-gated these venture investments by zip or postal code and metropol-itan area. This generated data on roughly 2000 venture investments across 170 metros. We then analyzed these data by population and economic output to control for metro size. (See the appendix for more detail on our methodology).

Rise of the Global Startup City9
Venture capital investment across the world surged to $42 billion in 2012, spanning over 150 cities or metro regions globally. The top 10 metros account for approximately 52 percent, the top 20 metros account for almost two-thirds, and the top 50 more than 90 percent of total global venture investment.2 The United States accounts for nearly 70 percent (68.6 per-cent) of total global venture capital, followed by Asia (14.4 percent) and Europe (13.5 percent).3
This report is the third instalment of a larger and ongoing Martin Prosperity Institute research project on the changing geography of venture investment and the rise of the startup city.4
The rest of the report is organized as follows. The first part charts the leading metros for glob-al venture capital investment overall and then as conditioned by population and economic out-put. The second part looks at the geography of venture capital investment in North America, Europe, and Asia respectively. The conclusion summarizes our key findings.
10 Rise of the Global Startup City
Mapping the World’s Leading Venture Capital Centers
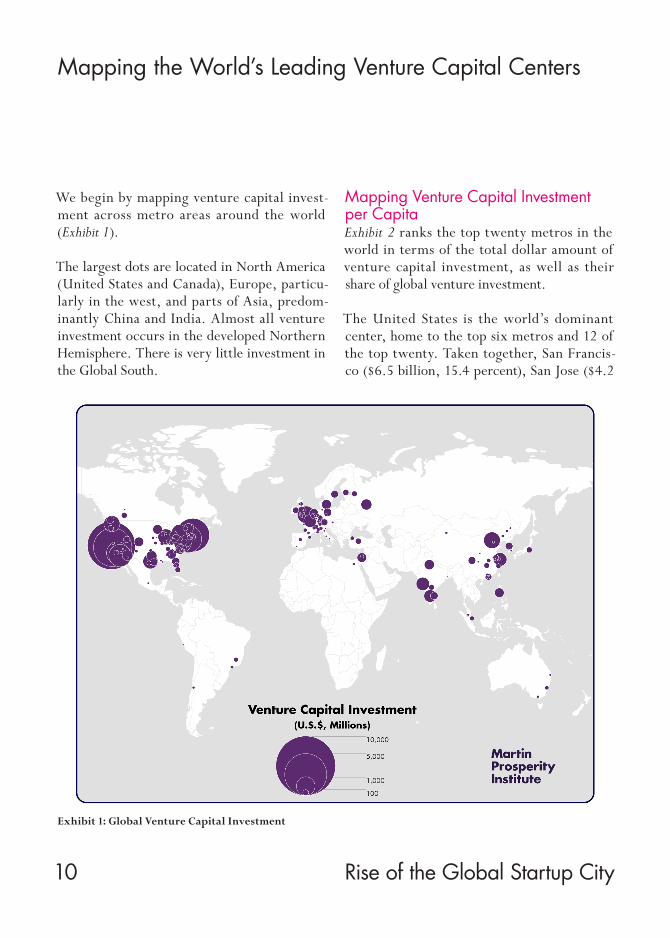
We begin by mapping venture capital invest-ment across metro areas around the world (Exhibit 1).
The largest dots are located in North America (United States and Canada), Europe, particu-larly in the west, and parts of Asia, predom-inantly China and India. Almost all venture investment occurs in the developed Northern Hemisphere. There is very little investment in the Global South.
Exhibit 1: Global Venture Capital Investment
Mapping Venture Capital Investment per CapitaExhibit 2 ranks the top twenty metros in the world in terms of the total dollar amount of venture capital investment, as well as their share of global venture investment.
The United States is the world’s dominant center, home to the top six metros and 12 of the top twenty. Taken together, San Francis-co ($6.5 billion, 15.4 percent), San Jose ($4.2

Rise of the Global Startup City11
billion, 9.9 percent), Boston ($3.1 billion, 7.5 percent), New York ($2.1 billion, 5.0 percent), Los Angeles ($1.5 billion, 3.4 percent), and San Diego ($1.4 billion, 3.3 percent) account for 44.5 percent of total global venture capi-tal investment. Just two broad regions — the San Francisco Bay Area and the Boston-New York-Washington Corridor — account for more than 40 percent of global venture investment.
But, there are considerable centers of venture capital investment outside the United States.
London ($842 million, 2.0 percent) ranks seventh, Toronto ($628 million, 1.5 percent) is 12th, and Paris ($449 million, 1.1 percent) is 16th.
China and India are each represented by a pair of metros. Beijing ($758 million, 1.8 percent) and Shanghai ($510 million, 1.2 percent) are ranked ninth and fourteenth while Mumbai ($497 million, 1.2 percent) and Bangalore ($419 million, 1.0 percent) are 15th and 17th.
Exhibit 2: Top 20 Global Metros by Venture Capital Investment*U.S. million dollars
Rank MetroVenture Capital
Investment*Share of Global Venture
Capital Investment
1 San Francisco $6,471 15.4%
2 San Jose $4,175 9.9%
3 Boston $3,144 7.5%
4 New York $2,106 5.0%
5 Los Angeles $1,450 3.4%
6 San Diego $1,410 3.3%
7 London $842 2.0%
8 Washington, D.C. $835 2.0%
9 Beijing $758 1.8%
10 Seattle $727 1.7%
11 Chicago $688 1.6%
12 Toronto $628 1.5%
13 Austin $626 1.5%
14 Shanghai $510 1.2%
15 Mumbai $497 1.2%
16 Paris $449 1.1%
17 Bangalore $419 1.0%
18 Philadelphia $413 1.0%
19 Phoenix $325 0.8%
20 Moscow $318 0.8%
Top 20 Metros $26,790 63.6%
Total $42,121 100.0%

12 Rise of the Global Startup City
Venture capital investment is largely concen-trated in a small number of metros across the world with 63.6 percent of investment located in the top 20 metros and 90.1 percent in the top 50.
Larger metros, like New York, London, and Beijing, have an advantage based on their sheer size. To control for this, we also examined ven-ture capital investment on a per capita basis. Exhibit 3 charts venture capital investment per capita in leading global cities. Again, the larg-est dots are in North America in on the East and West Coasts of the United States. There is a sizeable concentration of dots in Europe and a smattering in Asia.
Exhibit 3: Venture Capital Investment per Capita by Metro
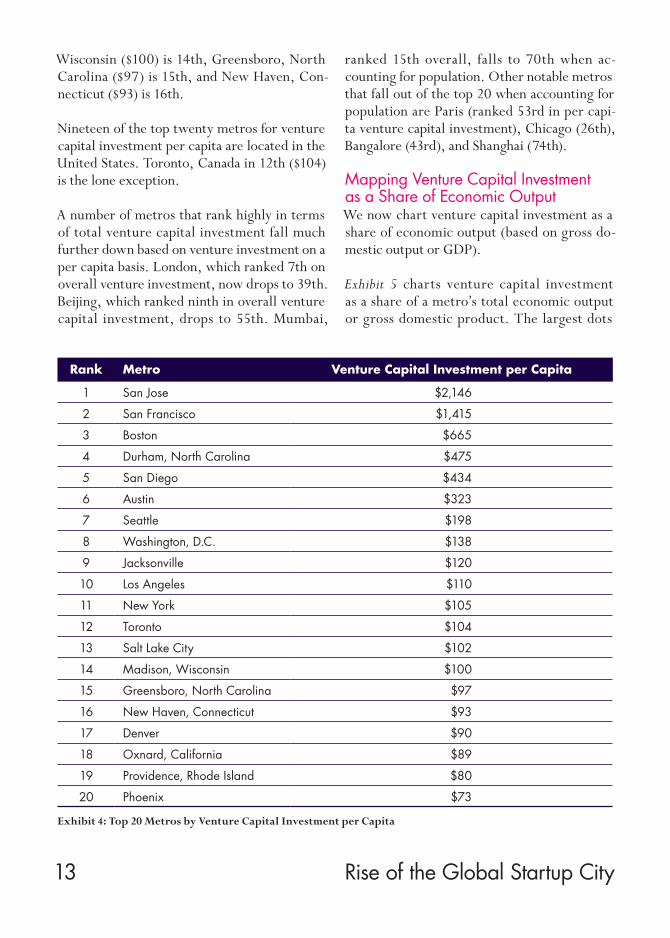
Exhibit 4 lists the top 20 metros for venture cap-ital investment per capita. Even on a per capi-ta basis, the Bay Area continues to dominate. San Jose ($2,146) and San Francisco ($1, 415) once again top the list with more than double Boston who follows in third place ($665). But now, Durham, in the North Carolina Research Triangle, moves up to fourth place ($475), followed by San Diego ($434) in fifth. Tech hubs like Austin (sixth, $323), Seattle (sev-enth, $198), and Denver (17th, $90) also make the list, as do superstar cities like Los Ange-les (10th, $110), New York (11th, $105), and Toronto (12th, $104). But now smaller met-ros across the United States move up the list as well: Jacksonville ($120) is ninth, Madison,
Rise of the Global Startup City13
Wisconsin ($100) is 14th, Greensboro, North Carolina ($97) is 15th, and New Haven, Con-necticut ($93) is 16th.
Nineteen of the top twenty metros for venture capital investment per capita are located in the United States. Toronto, Canada in 12th ($104) is the lone exception.
A number of metros that rank highly in terms of total venture capital investment fall much further down based on venture investment on a per capita basis. London, which ranked 7th on overall venture investment, now drops to 39th. Beijing, which ranked ninth in overall venture capital investment, drops to 55th. Mumbai,
ranked 15th overall, falls to 70th when ac-counting for population. Other notable metros that fall out of the top 20 when accounting for population are Paris (ranked 53rd in per capi-ta venture capital investment), Chicago (26th), Bangalore (43rd), and Shanghai (74th).
Exhibit 4: Top 20 Metros by Venture Capital Investment per Capita
Rank Metro Venture Capital Investment per Capita
1 San Jose $2,146
2 San Francisco $1,415
3 Boston $665
4 Durham, North Carolina $475
5 San Diego $434
6 Austin $323
7 Seattle $198
8 Washington, D.C. $138
9 Jacksonville $120
10 Los Angeles $110
11 New York $105
12 Toronto $104
13 Salt Lake City $102
14 Madison, Wisconsin $100
15 Greensboro, North Carolina $97
16 New Haven, Connecticut $93
17 Denver $90
18 Oxnard, California $89
19 Providence, Rhode Island $80
20 Phoenix $73
Mapping Venture Capital Investment as a Share of Economic OutputWe now chart venture capital investment as a share of economic output (based on gross do-mestic output or GDP).
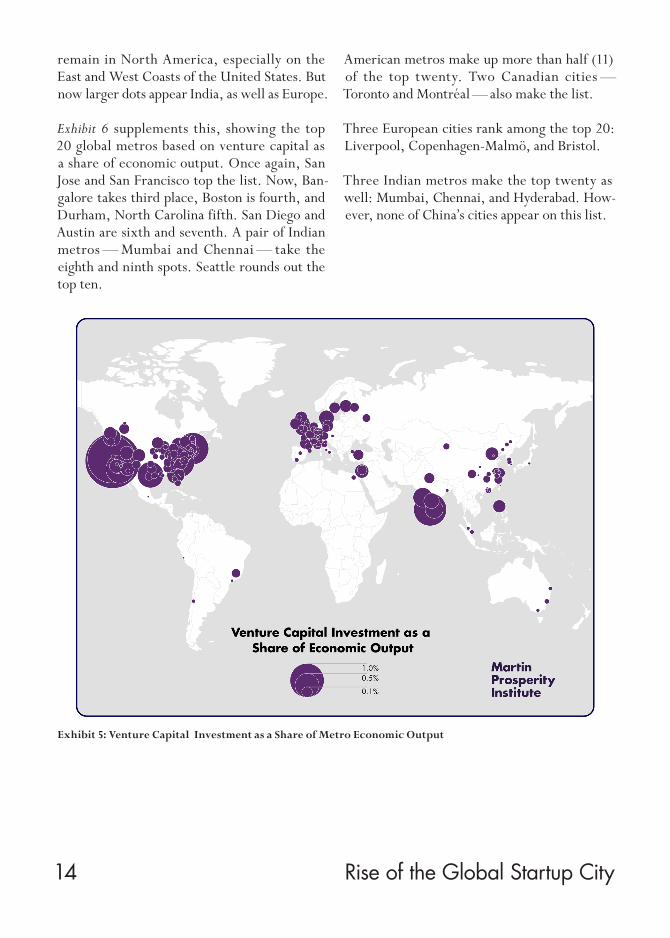
Exhibit 5 charts venture capital investment as a share of a metro’s total economic output or gross domestic product. The largest dots
14 Rise of the Global Startup City
remain in North America, especially on the East and West Coasts of the United States. But now larger dots appear India, as well as Europe.
Exhibit 5: Venture Capital Investment as a Share of Metro Economic Output
Exhibit 6 supplements this, showing the top 20 global metros based on venture capital as a share of economic output. Once again, San Jose and San Francisco top the list. Now, Ban-galore takes third place, Boston is fourth, and Durham, North Carolina fifth. San Diego and Austin are sixth and seventh. A pair of Indian metros — Mumbai and Chennai — take the eighth and ninth spots. Seattle rounds out the top ten.
American metros make up more than half (11) of the top twenty. Two Canadian cities — Toronto and Montréal — also make the list.
Three European cities rank among the top 20: Liverpool, Copenhagen-Malmö, and Bristol.
Three Indian metros make the top twenty as well: Mumbai, Chennai, and Hyderabad. How-ever, none of China’s cities appear on this list.

Rise of the Global Startup City15
Exhibit 6: Top 20 Metros by Venture Capital Investment as a Share of Economic Output
Rank MetroVenture capital investment as share
of metro economic output*
1 San Jose 2.60%
2 San Francisco 1.95%
3 Bangalore 0.92%
4 Boston 0.87%
5 Durham 0.70%
6 San Diego 0.70%
7 Austin 0.58%
8 Mumbai 0.33%
9 Chennai 0.28%
10 Seattle 0.27%
11 Jacksonville 0.27%
12 Toronto 0.23%
13 Liverpool 0.23%
14 Hyderabad 0.21%
15 Copenhagen-Malmö 0.20%
16 Washington, D.C. 0.19%
17 Greensboro, North Carolina 0.18%
18 Bristol, UK 0.18%
19 Montréal 0.17%
20 Los Angeles 0.17%
*Economic output as measured by gross domestic product

16 Rise of the Global Startup City
Venture Capital Centers Compared to Leading Global Cities
Venture capital, as we have seen, is spiky, con-centrated in a small number of metros world-wide. But how do these metros match up with the world’s dominant global cities?
To get at this, Exhibit 7 compares the top 20 venture capital centers to world’s most eco-nomically powerful cities.5
While there is some overlap, the lists are far from identical.
New York, the world’s most economically powerful city, is fourth for venture capital in-vestment. Conversely, greater San Francisco, which is far and away the world’s leading ven-ture capital center, ranks 23rd on the list of leading global cities.
There are a number of leading global cities that also rank highly as venture capital hubs. Lon-don, the world’s second most powerful global city, ranks seventh in venture capital. Paris, the fifth leading global city, is 16th in venture capi-tal. Los Angeles, the seventh ranked global city,
is fifth. Chicago, 12th on the global city rank-ings, is 11th. Boston, Beijing, and Shanghai, all tied for the 18th leading global city, are third, ninth and 14th on venture capital respectively. Washington, D.C., the 23rd ranked global cit-ies, is eighth in venture capital.
That said other leading global cities rank much further down the list of venture capital cen-ters. Tokyo, the third leading global city, ranks just ranks 54th in venture investment. Hong Kong, the fourth leading global city, ranks 107th; Singapore, the sixth ranking global city, is 79th; Vienna, the ninth ranked global city, is 128th; and Zurich, ranked 13th in terms of global cities, is 97th.
Ultimately, twelve of the world’s leading cities rank among the top 25 venture capital centers. Fifteen of the top 25 global cities rank among the world’s top 60 venture capital centres.
The world’s leading cities are spiky and so is the venture capital industry. But, the two are not one in the same.

Rise of the Global Startup City17
Exhibit 7: Comparing Global Cities and Venture Capital Investment
Metro Global City Rank Venture Capital Investment Rank
New York 1 4
London 2 7
Tokyo 3 54
Hong Kong 4 107
Paris 5 16
Singapore 6 79
Los Angeles 7 5
Seoul 8 37
Vienna 9 128
Stockholm 10 (tie) 40
Toronto 10 (tie) 12
Chicago 12 11
Zurich 13 97
Sydney 14 (tie) 85
Helsinki 14 (tie) 52
Dublin 16 (tie) 50
Osaka-Kobe 16 (tie) N/A
Boston 18 (tie) 3
Oslo 18 (tie) N/A
Beijing 18 (tie) 9
Shanghai 18 (tie) 14
Geneva 22 71
Washington, D.C. 23 (tie) 8
San Francisco 23 (tie) 1
Moscow 23 (tie) 20
Source: MPI rankings of the world’s most economically powerful cities. Richard Florida, “Sorry, London: New York Is the World’s Most Economically Powerful City,” CityLab, March 3, 2015.

18 Rise of the Global Startup City
Venture Capital Investment by Geographic Region
We now take a closer look at venture capital in-vestment across the world’s three leading geo-graphic regions: North America, Europe, and Asia. We exclude South America and Africa due to the limited amount of venture capital investment for them.
Venture Capital Investment in North AmericaNorth America, as we have seen, dominates the venture capital industry. Exhibit 8 charts ven-
Exhibit 8: Venture Capital Investment in North America
ture capital across the continent. The largest dots are on the East and West Coasts, but there is a smattering of activity in the Pacific North-west, Florida, Texas, Colorado, and parts of the South and the Midwest. There is no investment in Mexico.
The Bay Area tops the list as North America’s leading venture capital hub (Exhibit 9). San Francisco accounts for a fifth ($6.5 billion, 21.8 percent) of all venture capital investment

Rise of the Global Startup City19
followed by nearby San Jose ($4.2 billion, 14.0 percent). Together they account for $10.7 bil-lion and 35.8 percent of venture investment across the continent. Boston is third ($3.1 bil-lion, 10.6 percent), New York fourth ($2.1 bil-lion, 7.1 percent), and Los Angeles fifth ($1.5 billion, 4.9 percent). San Diego (1.4 billion, 4.7 percent), Washington, D.C. ($834 million, 2.8 percent), Seattle ($727 million, 2.5 per-
cent), and Chicago ($688 million, 2.3 percent) are next. Toronto ($628 million, 2.1 percent) rounds out the top ten.
Two Texas metros are found in the bottom half of the top 20. Austin ($626 million, 2.1 per-cent) is eleventh and Dallas ($308 million, 1.0 percent) is 14th. Philadelphia ($413 million, 1.4 percent) is 12th and Phoenix ($325 million, 1.1
Exhibit 9: Top 20 Metros in North America by Venture Capital Investment*U.S. million dollars
Rank MetroVenture Capital
Investment*
Share of North American Venture Capital Investment
Share of Global Venture Capital
Investment
1 San Francisco $6,471 21.78% 15.36%
2 San Jose $4,175 14.05% 9.91%
3 Boston $3,144 10.58% 7.46%
4 New York $2,106 7.09% 5.00%
5 Los Angeles $1,450 4.88% 3.44%
6 San Diego $1,410 4.74% 3.35%
7 Washington, D.C. $834 2.81% 1.98%
8 Seattle $727 2.45% 1.73%
9 Chicago $688 2.32% 1.63%
10 Toronto $628 2.11% 1.49%
11 Austin $626 2.11% 1.49%
12 Philadelphia $413 1.39% 0.98%
13 Phoenix $325 1.09% 0.77%
14 Dallas $308 1.04% 0.73%
15 Montréal $267 0.90% 0.63%
16 Atlanta $260 0.87% 0.62%
17 Durham $258 0.87% 0.61%
18 Denver $246 0.83% 0.58%
19 Minneapolis $245 0.82% 0.58%
20 Jacksonville $169 0.57% 0.40%
Total – Top 20 $24,750 83.30% 58.80%
Total – North America $29,715 — 70.55%
20 Rise of the Global Startup City
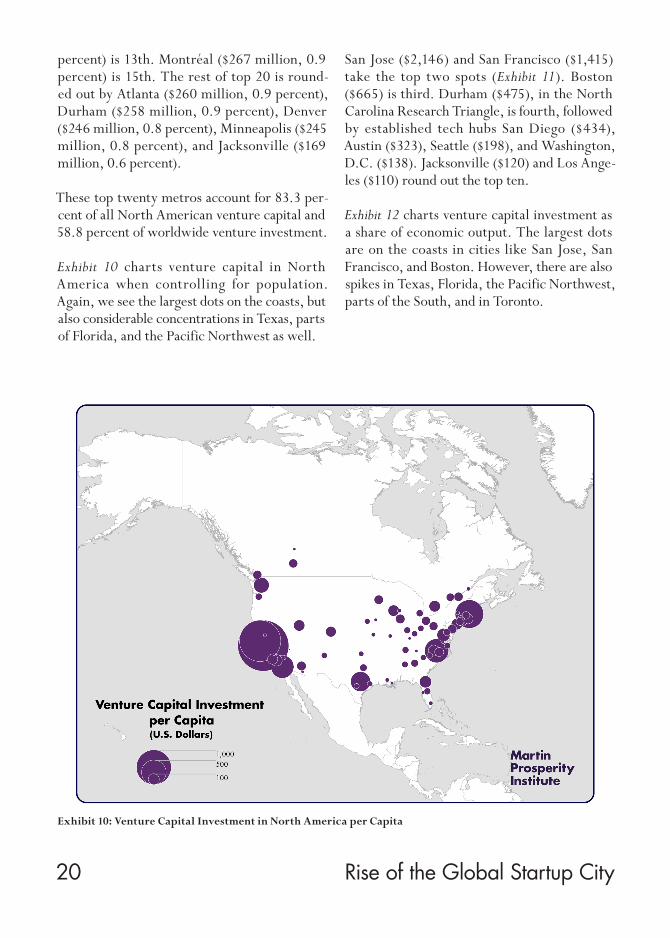
percent) is 13th. Montréal ($267 million, 0.9 percent) is 15th. The rest of top 20 is round-ed out by Atlanta ($260 million, 0.9 percent), Durham ($258 million, 0.9 percent), Denver ($246 million, 0.8 percent), Minneapolis ($245 million, 0.8 percent), and Jacksonville ($169 million, 0.6 percent).
These top twenty metros account for 83.3 per-cent of all North American venture capital and 58.8 percent of worldwide venture investment.
Exhibit 10 charts venture capital in North America when controlling for population. Again, we see the largest dots on the coasts, but also considerable concentrations in Texas, parts of Florida, and the Pacific Northwest as well.
Exhibit 10: Venture Capital Investment in North America per Capita
San Jose ($2,146) and San Francisco ($1,415) take the top two spots (Exhibit 11). Boston ($665) is third. Durham ($475), in the North Carolina Research Triangle, is fourth, followed by established tech hubs San Diego ($434), Austin ($323), Seattle ($198), and Washington, D.C. ($138). Jacksonville ($120) and Los Ange-les ($110) round out the top ten.
Exhibit 12 charts venture capital investment as a share of economic output. The largest dots are on the coasts in cities like San Jose, San Francisco, and Boston. However, there are also spikes in Texas, Florida, the Pacific Northwest, parts of the South, and in Toronto.

Rise of the Global Startup City21
Exhibit 11: Top 10 Metros in North America by Venture Capital Investment per Capita
Durham
Boston
San Francisco
San Diego
MetroRank
4
3
2
San Jose1
5
Austin6
Seattle7
Washington, D.C.8
Jacksonville9
Los Angeles10
0 1,000 1,500 2,000 2,500500
Venture Capital Investment per Capita
Exhibit 12: Venture Capital Investment in North America as a Share of Metro Economic Output*Economic output as measure by gross domestic product

22 Rise of the Global Startup City
Exhibit 13 shows the top 20 North American metros on venture capital investment as a share of economic output. With the exception of Jack-sonville, these are all established tech hubs. San Jose and San Francisco again take the top two spots, followed by Boston, Durham, San Diego, Austin, and Seattle. Jacksonville, Toronto, and Washington, D.C. round out the top ten.
Exhibit 13: Top 10 Metros in North America by Venture Capital Investment as a Share of Metro Economic Output*Economic output as measure by gross domestic product
Durham
Boston
San Francisco
San Diego
MetroRank
4
3
2
San Jose1
5
Austin6
Seattle7
Jacksonville8
Toronto9
Washington, D.C.10
0 2 3 4 5%1
Venture Capital Investment as a Share of Metro Economic Output*
*economic output as measured by gross domestic product
Venture Capital Investment in EuropeWe now turn to venture capital investment in Europe. Europe, as we have seen, accounts for 13.5 percent of global venture capital investment.
Exhibit 14 charts venture capital investment across Europe. The largest dots are in London and Paris with smaller concentrations around Moscow, Copenhagen-Malmö, and Amster-dam-Rotterdam.
Exhibit 15 lists the top 20 European metros for venture capital investment. London is first with $842 million or 14.8 percent of the continent’s total, followed by Paris ($449 million, 7.9 per-
cent), and Moscow ($318 million, 5.6 percent). Together these three metro areas make up more than a quarter (28 percent) of total European venture capital. Copenhagen-Malmö ($254 million, 4.5 percent) and Amsterdam-Rotter-dam ($205 million, 3.6 percent) round out the top five. Berlin ($178 million, 3.1 percent) is sixth, followed by Stockholm ($148 million, 2.6 percent), Liverpool ($148 million, 2.6 per-cent), Stuttgart ($125 million 2.2 percent), and Munich ($120 million, 2.1 percent).
Dublin ($103 million, 1.8 percent) is 11th, fol-lowed by Helsinki ($99 million, 1.7 percent), Saint Petersburg ($86 million, 1.5 percent), Bristol ($84 million, 1.5 percent), and Frank-furt am Main ($78 million, 1.4 percent) in 15th. Brussels ($67 million, 1.2 percent), Ge-neva ($66 million, 1.2 percent), Karlsruhe ($46 million, 0.8 percent), in Southwest Germany, near the French boarder, Istanbul ($44 million, 0.8 percent), and Edinburgh ($42 million, 0.7 percent) round out the top 20. Moscow, Saint Petersburg, and Istanbul are the only metros outside of Western Europe to make the list.

Rise of the Global Startup City23
Exhibit 14: Venture Capital Investment in Europe
The top 20 metros in the region account for 61.4 percent of all venture investment in Eu-rope but only 8.3 percent of total global ven-ture investment.
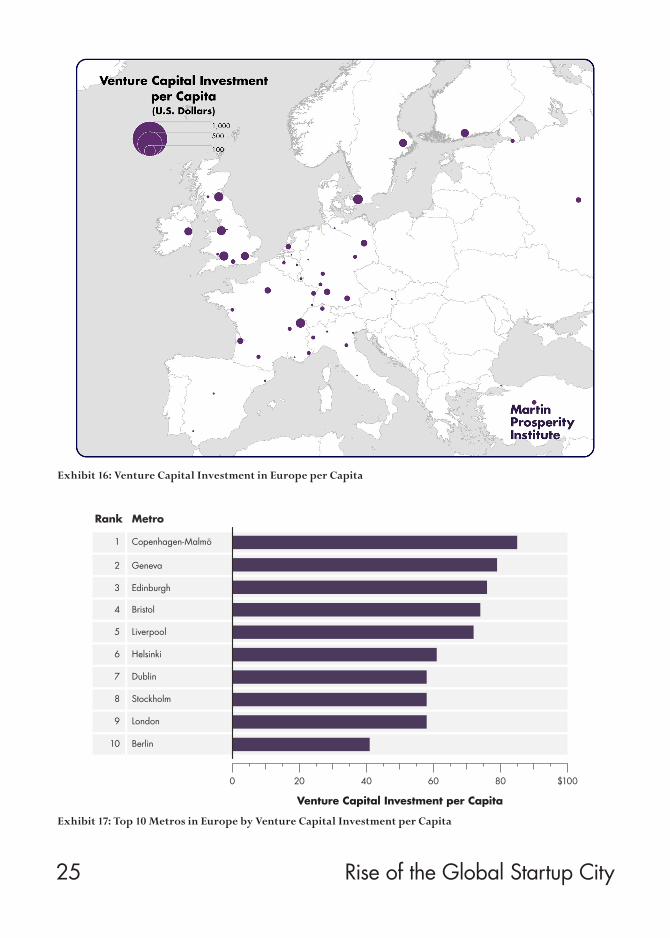
Exhibit 16 charts venture capital investment in Europe on a per capita basis. There are dots smattered across the region. Several metros in the United Kingdom have relatively larger dots, while several metros in France and Germany have smaller ones as well. A few dots appear in Scandinavian nations, while smaller dots are in Spain.
Copenhagen-Malmö tops the list followed by Geneva, Edinburg, Bristol, and Liverpool. Rounding out the top ten are Helsinki, Dublin, Stockholm, London, and Berlin (Exhibit 17).
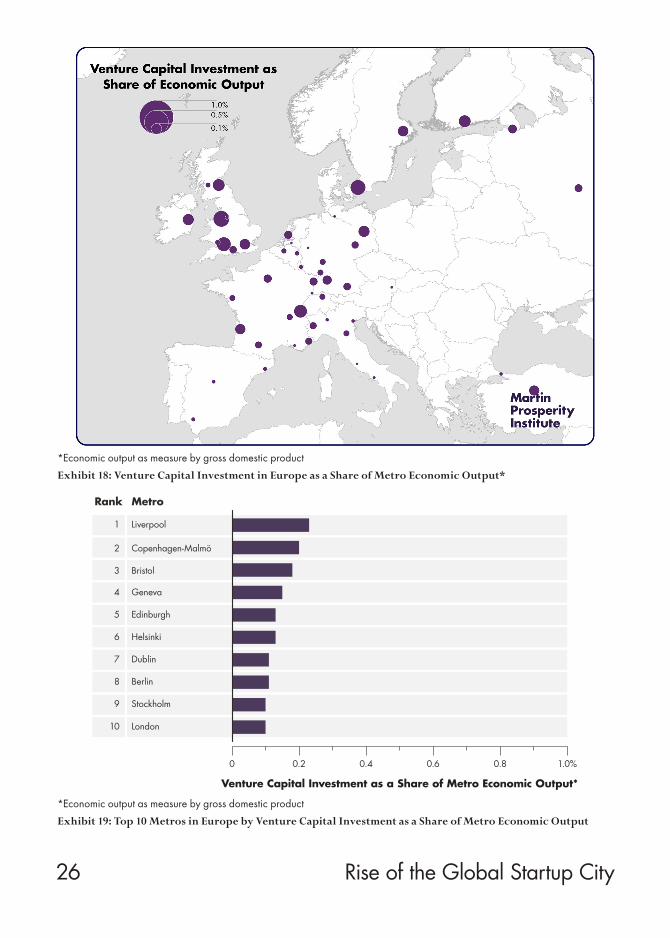
Exhibit 18 shows venture capital investment as a share of economic output. Again, the dots are widely scattered across the United Kingdom, Germany, and France.
Exhibit 19 lists Europe’s top ten metros for ven-ture capital investment as a share of economic output. Liverpool is first, followed by Copen-hagen-Malmö, Bristol, Geneva, and Edinburg. Helsinki, Dublin, Berlin, Stockholm, and Lon-don round out the top ten.

24 Rise of the Global Startup City
Exhibit 15: Top 20 Metros in Europe by Venture Capital Investment*U.S. million dollars
Rank MetroVenture Capital
Investment*
Share of European Venture Capital
Investment
Share of Global Venture Capital
Investment
1 London $842 14.76% 2.00%
2 Paris $449 7.87% 1.07%
3 Moscow $318 5.58% 0.76%
4 Copenhagen-Malmö $254 4.46% 0.60%
5 Amsterdam-Rotterdam $205 3.60% 0.49%
6 Berlin $178 3.13% 0.42%
7 Stockholm $148 2.60% 0.35%
8 Liverpool $148 2.60% 0.35%
9 Stuttgart $125 2.19% 0.30%
10 Munich $120 2.11% 0.29%
11 Dublin $103 1.80% 0.24%
12 Helsinki $99 1.74% 0.24%
13 Saint Petersburg $86 1.51% 0.20%
14 Bristol $84 1.46% 0.20%
15 Frankfurt am Main $78 1.36% 0.18%
16 Brussels $67 1.18% 0.16%
17 Geneva $66 1.16% 0.16%
18 Karlsruhe $46 0.80% 0.11%
19 Istanbul $44 0.77% 0.10%
20 Edinburgh $42 0.74% 0.10%
Total – Top 20 $3,503 61.4% 8.32%
Total – Europe $5,705 — 13.54%
Rise of the Global Startup City25
Exhibit 16: Venture Capital Investment in Europe per Capita
Exhibit 17: Top 10 Metros in Europe by Venture Capital Investment per Capita
Bristol
Edinburgh
Geneva
Liverpool
MetroRank
4
3
2
Copenhagen-Malmö1
5
Helsinki6
Dublin7
Stockholm8
London9
Berlin10
0 20 40 $10060 80
Venture Capital Investment per Capita
26 Rise of the Global Startup City
Exhibit 18: Venture Capital Investment in Europe as a Share of Metro Economic Output**Economic output as measure by gross domestic product
Exhibit 19: Top 10 Metros in Europe by Venture Capital Investment as a Share of Metro Economic Output*Economic output as measure by gross domestic product
Geneva
Bristol
Copenhagen-Malmö
Edinburgh
MetroRank
4
3
2
Liverpool1
5
Helsinki6
Dublin7
Berlin8
Stockholm9
London10
0 0.4 0.6 0.8 1.0%0.2
Venture Capital Investment as a Share of Metro Economic Output*
*economic output as measured by gross domestic product

Rise of the Global Startup City27
Venture Capital Investment in AsiaWe now turn to venture capital investment in Asia, which accounts for 14.4 percent of ven-ture capital investment worldwide. Exhibit 20 tracks Asia’s largest centers for venture capital investment.
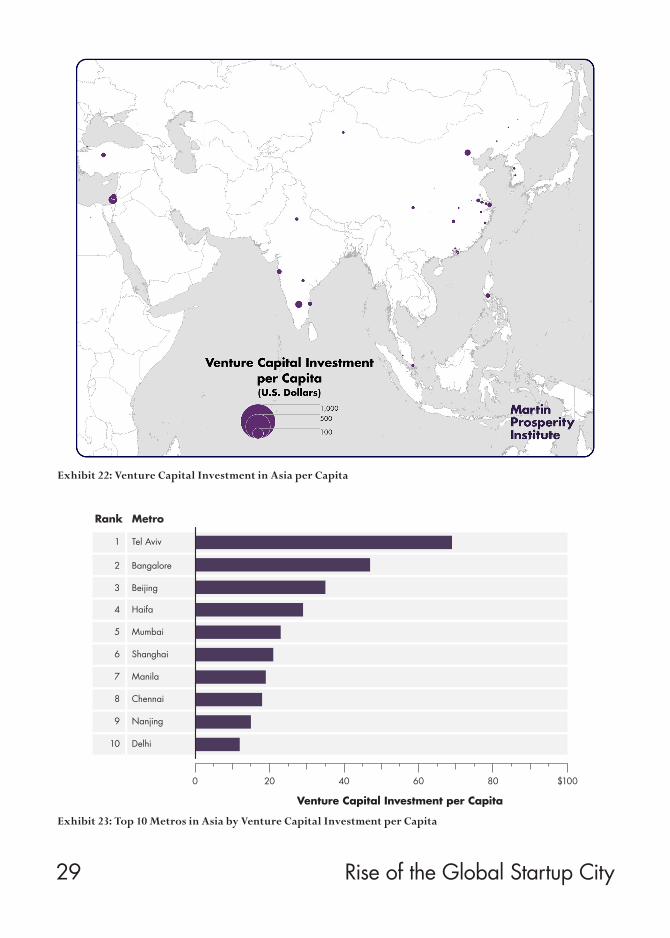
Venture investment in Asia is concentrated in China and India. The biggest dots in China are concentrated along its coastline. There are smaller dots in the Philippines, South Korea, and somewhat surprisingly, Japan. There are a few dots in the Middle East, in Israel and Egypt.
Exhibit 21 shows the top 20 centers for ven-ture capital investment in Asia. Beijing tops the list with $758 million or 12.5 percent of the region’s total. It is followed by Shanghai ($510 million, 8.4 percent) in second. Together
these two metros account for roughly a fifth all venture investment in Asia. Three Indian metros — Mumbai ($497 million, 8.2 percent), Bangalore ($419 million, 6.9 percent), and Delhi ($277 million, 4.6 percent) — round out the top five. Manila is sixth with $250 million (4.1 percent) in investment, followed closely by Tel Aviv ($250 million, 4.1 percent). Chen-nai ($165 million, 2.7 percent), on India’s east coast, is eighth. Seoul-Incheon (156 million, 2.6 percent) is ninth and Chengdu ($152 mil-lion, 2.5 percent), in Southwest China, is tenth. The remainder of the top 20 includes a number of metro areas across China, India, and Japan.
Overall, the top 20 metros in Asia account for 69.8 percent of all Asian venture capital, but just 10.1 percent of global venture capital in-vestment.
Exhibit 20: Venture Capital Investment in Asia

28 Rise of the Global Startup City
Exhibit 21: Top 20 Metros in Asia by Venture Capital Investment*U.S. million dollars
Rank Metro
Total Venture Capital*
Share of Asian Venture Capital
Investment
Share of Global Venture Capital
Investment
1 Beijing $758 12.49% 1.80%
2 Shanghai $510 8.42% 1.21%
3 Mumbai $497 8.19% 1.18%
4 Bangalore $419 6.91% 0.99%
5 Delhi $277 4.57% 0.66%
6 Manila $250 4.13% 0.59%
7 Tel Aviv $250 4.12% 0.59%
8 Chennai $165 2.72% 0.39%
9 Seoul-Incheon $156 2.57% 0.37%
10 Chengdu $152 2.51% 0.36%
11 Shenzhen $117 1.93% 0.28%
12 Ankara $100 1.65% 0.24%
13 Nanjing $96 1.57% 0.23%
14 Tokyo $94 1.55% 0.22%
15 Changsha $88 1.45% 0.21%
16 Hyderabad $84 1.38% 0.20%
17 Wenzhou $62 1.02% 0.15%
18 Singapore $57 0.94% 0.14%
19 Hangzhou $55 0.91% 0.13%
20 Suzhou $46 0.76% 0.11%
Top 20 – Asia $4,234 69.81% 10.05%
Total – Asia $6,064 — 14.40%
Rise of the Global Startup City29
Exhibit 22: Venture Capital Investment in Asia per Capita
Exhibit 23: Top 10 Metros in Asia by Venture Capital Investment per Capita
Haifa
Beijing
Bangalore
Mumbai
MetroRank
4
3
2
Tel Aviv1
5
Shanghai6
Manila7
Chennai8
Nanjing9
Delhi10
0 20 40 $10060 80
Venture Capital Investment per Capita

30 Rise of the Global Startup City
Exhibit 24: Venture Capital Investment in Asia as a Share of Metro Economic Output**Economic output as measure by gross domestic product
Exhibit 25: Top 10 Metros in Asia by Venture Capital Investment as a Share of Metro Economic Output*Economic output as measure by gross domestic product
Hyderabad
Chennai
Mumbai
Tel Aviv
MetroRank
4
3
2
Bangalore1
5
Beijing6
Manila7
Ankara8
Delhi9
Shanghai10
0.0 0.4 0.6 0.8 1.0%0.2
Venture Capital Investment as a Share of Economic Output*
*economic output as measured by gross domestic product

Rise of the Global Startup City31
Exhibit 22 charts the leading centers for ven-ture capital investment in Asia on a per capita basis. Exhibit 23 lists Asia’s top ten metros for venture investment per capita. Tel Aviv is far out in front with $69 per capita. Bangalore is second, followed by Beijing. Haifa, in northern Israel, is fourth and Mumbai is fifth. Shanghai, Manila, Chennai, Nanjing, and Delhi round out the top ten.
Exhibit 24 charts Asia’s leading centers for ven-ture capital investment as a share of metro eco-nomic output. Exhibit 25 lists Asia’s ten leading metros based on venture capital investment as a share of economic output. Indian metros take the top four spots: Bangalore, Mumbai, Chen-nai, and Hyderabad. Tel Aviv was fifth. Beijing is sixth followed by Manila, Ankara, Delhi, and Shanghai.

32 Rise of the Global Startup City
Conclusion
This report has examined the world’s leading centers of venture capital investment. Its main findings are as follows.
Venture capital investment across the world amounted to $42 billion in 2012, spread across more than 150 cities and metro regions globally.
That said, global venture capital investment is quite concentrated. The top 10 metros account for approximately 52 percent, the top 20 met-ros account for almost two-thirds, and the top 50 more than 90 percent of total global venture investment.
The United States accounts for nearly 70 per-cent (68.6 percent) of total global venture capi-tal, followed by Asia (14.4 percent), and Europe (13.5 percent).
The San Francisco Bay Area, which spans Sili-con Valley and San Francisco proper, remains the world’s leading center for venture capital in-vestment with nearly $11 billion dollars, more than a quarter of all global venture investment. Boston is second with $3.1 billion followed by New York with $2.1 billion and Los Angeles with $1.5 billion. Just two broad regions — the
San Francisco Bay Area and the Boston-New York-Washington Corridor — account for more than 40 percent of global venture investment.Outside of the United States, London ranks seventh with $842 million, Beijing ninth with $758 million, Toronto 12th with $628 million, Shanghai 14th with $510 million, Mumbai 15th with $497 million, Paris 16th with $449 mil-lion, and Bangalore 17th with $419 million.
While there is some overlap between the world’s leading venture capital centers and its most powerful global cities, the two are not identical. New York, the world’s most econom-ically powerful city, is fourth for venture capital investment. Conversely, greater San Francisco, which is far and away the world’s leading ven-ture capital center, only ranks as the world’s 23rd leading global city. Twelve of the world’s leading cities rank among the top 25 venture capital centers. Fifteen of the top 25 global cities rank among the world’s top 60 venture capital centres.
Ultimately, global venture investment is high-ly uneven and spiky — concentrated in a small number of large cities and metros around the world.
Rise of the Global Startup City33
Data and Methodology
This report uses detailed data from Thomson Reuters to chart the world’s leading centers for venture capital investment. These data, for the year 2012, provide granular information on ven-ture capital investment globally and include the total dollar value of the investment, the name and industry of the recipient company, and the geographic location of venture investments. We set an upper-level cut-off $200 million to elim-inate investments that are too large to be con-sidered classic venture capital and a lower level cut-off of $5 million to eliminate investments that are too small. This generated venture cap-ital investments for 2,215 companies.
We aggregated these venture investments by zip or postal code and assigned them to locations according to defined global metro boundaries based on global boundary shape files (provid-ed by the Brookings Institution). Of the 2,215 companies we identified 125 or 5.6 percent that did not have an accompanying postal or zip code. These companies accounted for a com-bined investment of $2.4 billion or 5.8 percent of all investment. In addition, we encountered some difficulty geocoding investments in Israel. The postal codes provided for Israel are based on 5 digits. However, in 2013 Israel switched to 7 digit postal codes. Due to this change, we
were unable to map venture investments in Is-rael by postal code. We were, however, able to assign them to their major metro. We assigned 70 of the 125 investment records that did not have postal or zip codes to a metropolitan area.
We ultimately ended up with data for 1,919 venture capital investments spanning 170 metro areas. This accounted for a total $36.5 billion in venture capital investment. We then conditioned these data by population, and eco-nomic output to control for metro size. Popula-tion and economic output for metros are from the Brookings Institution report for 2014.6

34 Rise of the Global Startup City
References
1 See, Richard Florida, “The World’s Leading Cities for Start-Ups,” CityLab, November 21, 2012, http://www.citylab.com/work/2012/11/worlds-leading-cities-startups/3937/; Florida, “The New Global Start-Up Cities,” CityLab, June 4, 2013, http://www.citylab.com/work/2013/06/new-global-start-cities/5144/; Florida, “The World’s Leading Startup Cities,” CityLab, http://www.citylab.com/tech/2015/07/the-worlds-leading-startup-cities/399623/; Startup Genome, Startup Ecosystem Report, 2012 Part One, 2012, https://s3.ama-zonaws.com/startupcompass-public/StartupEcosystemReportPart1v1.2.pdf.
2 See, Richard Florida, Tim Gul-den, and Charlotta Mellander, “The Rise of the Mega-Region,” Cambridge Journal of Regions, Economy and Society, 1, 3, 2008, pp. 459–76; Also, Florida, “Megaregions: The Importance of Place,” Harvard Busi-ness Review, March 2008, https://hbr.org/2008/03/megaregions-the-importance-of-place; Florida,
“The Rise of the Mega-Region,” The
Wall Street Journal, April 12, 2008, http://www.wsj.com/articles/SB120796112300309601; Florida, The Mega-Regions of North Ameri-ca, Martin Prosperity Institute, 2014, http://martinprosperity.org/content/the-mega-regions-of-north-america/; Florida, “The Dozen Regional Pow-erhouses Driving the U.S. Economy,” CityLab, March 12, 2014, http://www.citylab.com/work/2014/03/dozen-regional-powerhouses-driv-ing-us-economy/8575/.
3 See, Richard Florida, “The World Is Spiky,” The Atlantic, October 2005, http://www.theatlantic.com/past/docs/images/issues/200510/world-is-spiky.pdf.
4 See, Richard Florida, Startup City: The Urban Shift in Venture Capital and High Technology, Toronto, ON: Martin Prosperity Institute, 2014, http://martinprosperity.org/media/Startup%20City_14-03-14.pdf.; Florida and Karen King, Startup City Canada: The Geography of Venture Capital and Startup Activity in Canada,
Toronto, ON: Martin Prosperity Insti-tute, 2015, http://martinprosperity.org/content/startup-city-canada-the- geography-of-venture-capital-and- startup-activity-in-canada.
5 Based on our Martin Prosperity rankings of the world’s most econom-ically powerful cities. See, Richard Florida, “Sorry, London: New York Is the World’s Most Economically Powerful City,” CityLab, March 3, 2015, http://www.citylab.com/work/2015/03/sorry-london-new-york-is-the-worlds-most-economically-powerful-city/386315/.
6 Data on metro gross domestic product is from the Brookings Institu-tion. See, Joseph Parilla, Jesus Leal Trujillo, and Alan Berube, “Global Metro Monitor 2014: An Uncertain Recovery,” The Brookings Institution, 2014, http://www.brookings.edu/~/ media/Research/Files/Reports/2015/ 01/22-global-metro-monitor/bmpp_GMM_final.pdf?la=en p. 5.

About the Authors
Richard FloridaRichard is Director of Cities at the Martin Prosperity Institute at the Uni-versity of Toronto’s Rotman School of Management. He is also Global Re-search Professor at New York University, and the founder of the Creative Class Group. He is a senior editor for The Atlantic, where he co-founded and serves as Editor-at-Large for CityLab.
Karen M. KingKaren is senior researcher and research project manager of Cities. Karen’s quantitative research examines the challenges and divides created by urban prosperity with a particular focus on migration and immigration in the United States and Canada. Karen holds a PhD in Geography from McMas-ter University and a Masters of Economics from the University of Toronto.
The authors thank Isabel Ritchie for research assistance and maps; Nick Lombardo for research assistance; Michelle Hopgood for graphics; & Ian Gormely for his editing.

Martin Prosperity InstituteRotman School of ManagementUniversity of Toronto105 St. George St., Ste. 9000Toronto, ON M5S 3E6
w martinprosperity.orge [email protected] 416.946.7300f 416.946.7606
© January 2016ISBN 978-1-928162-04-9