Riparian Instream Flow - Susitna-Watana Hydro...Riparian Instream Flow Riparian Process Domain...
46
Technical WorkGroup Meeting Riparian Instream Flow Riparian Process Domain Delineation and Riparian Vegetation Sampling, including Focus Areas 14-15 February 2013 Prepared by R2 Resource Consultants & ABR, Inc.
Transcript of Riparian Instream Flow - Susitna-Watana Hydro...Riparian Instream Flow Riparian Process Domain...
Technical WorkGroup Meeting
Riparian Instream Flow
Riparian Process Domain Delineation and
Riparian Vegetation Sampling, including
Focus Areas
14-15 February 2013
Prepared by
R2 Resource Consultants & ABR, Inc.

Road Map for Today’s Presentation
1. Riparian Process Domains − Susitna River floodplain stratified sampling approach
2. Cluster Analysis: delineation of riparian process domains
a. Methods
b. Results
3. Floodplain Vegetation Sampling Approach a. Methods
b. Results
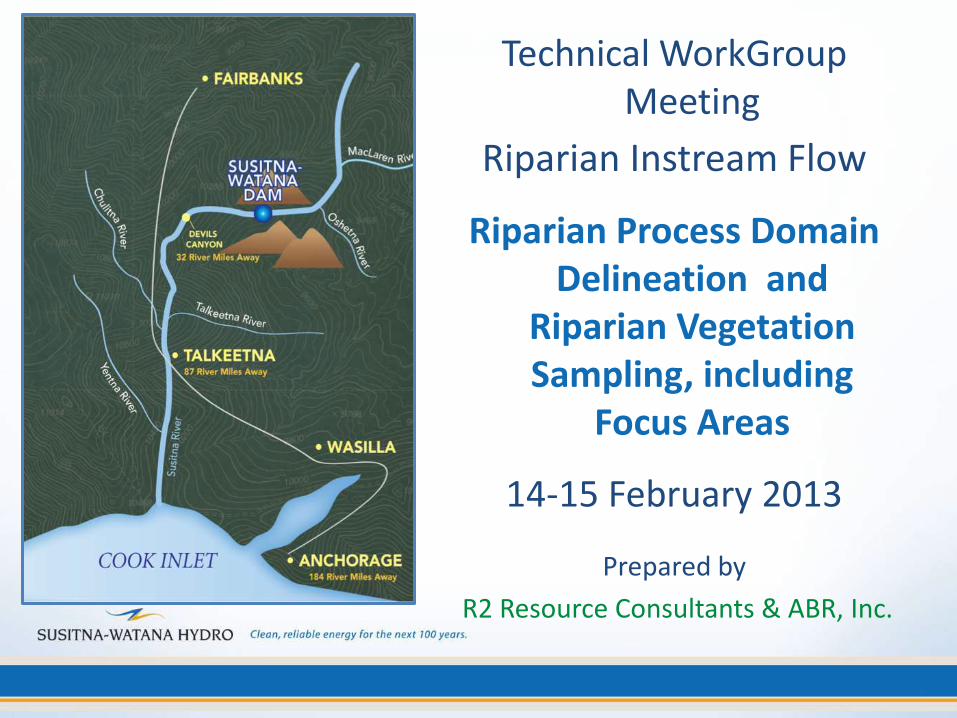
Riparian Process Domain Concept (after Montgomery 1999)
• Riparian (floodplain) process domains are distinct areas of the active valley within which similar suites of geomorphological processes govern floodplain habitat type, structure and dynamics.
• Geomorphic processes and elements may be mapped.
• Approach to stratify the river network for sampling floodplain vegetation variability and modeling
• Primary Susitna River geomorphic processes:
– Hydroregime
– Sediment transport
– Channel migration (erosion and deposition)
– Beaver dams (biogeomorphic process)
– Ice processes: ice damming and associated flooding, sediment and vegetation disturbance (shear forces)
Riparian Process Domain Framework
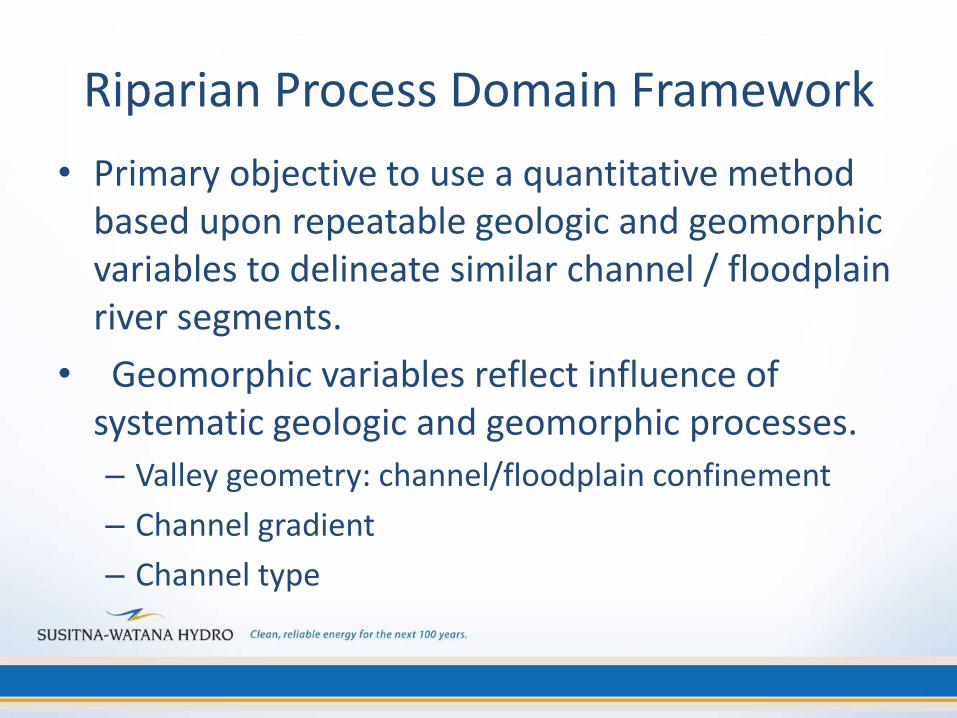
• Primary objective to use a quantitative method based upon repeatable geologic and geomorphic variables to delineate similar channel / floodplain river segments.
• Geomorphic variables reflect influence of systematic geologic and geomorphic processes.
– Valley geometry: channel/floodplain confinement
– Channel gradient
– Channel type
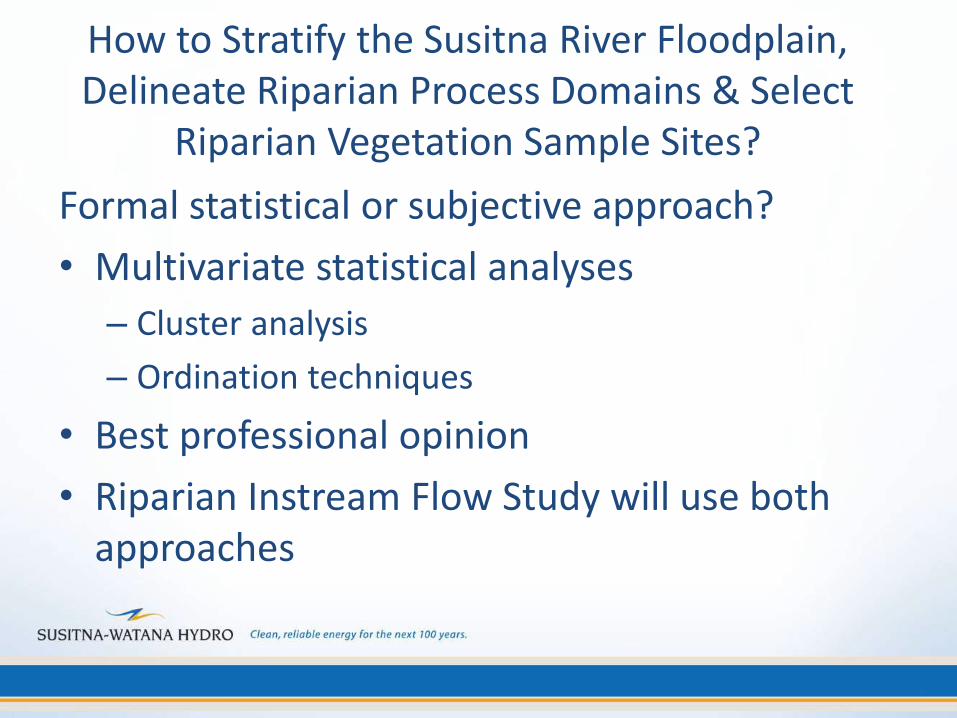
How to Stratify the Susitna River Floodplain, Delineate Riparian Process Domains & Select
Riparian Vegetation Sample Sites?
Formal statistical or subjective approach?
• Multivariate statistical analyses
– Cluster analysis
– Ordination techniques
• Best professional opinion
• Riparian Instream Flow Study will use both approaches

Riparian Process Domain Delineation Cluster Analysis
What is cluster analysis:
statistically grouping objects similar in the same group and also identify distinctions or separations between groups of objects (Legendre 2012,Numerical Ecology)
• There are various types of cluster analyses
Cluster Analysis
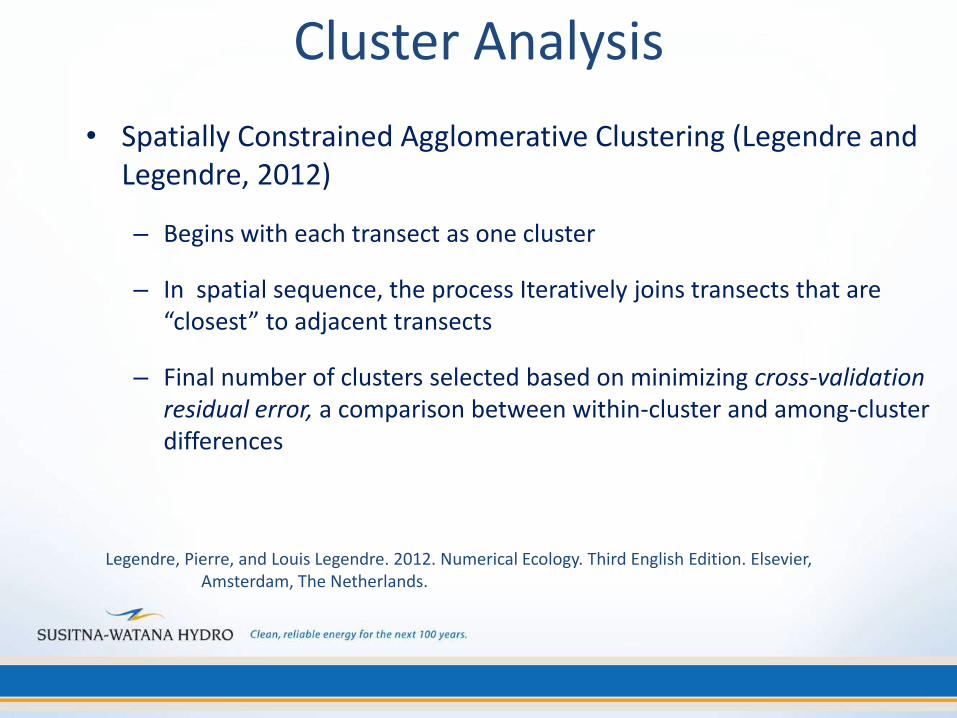
• Spatially Constrained Agglomerative Clustering (Legendre and Legendre, 2012)
– Begins with each transect as one cluster
– In spatial sequence, the process Iteratively joins transects that are “closest” to adjacent transects
– Final number of clusters selected based on minimizing cross-validation residual error, a comparison between within-cluster and among-cluster differences
Legendre, Pierre, and Louis Legendre. 2012. Numerical Ecology. Third English Edition. Elsevier, Amsterdam, The Netherlands.

Cluster Analysis
• Multivariate distance, or dissimilarity, based on Gower Coefficient of Similarity (1971)
– For continuous variables (channel slope and confinement ratio) distance is scaled difference │Xi – Xj│/max(difference)
– Ordered factors (channel type; values 1 to 9 with increasing complexity) are treated the same
• Multivariate distance is simply the average of the distances for the three variables.
Gower, J.C. 1971. A general coefficient of similarity and some of its properties. Biometrics 27:857-871.

Riparian Process Domain Delineation Cluster Analyses
Iterative Process conducted Q1 & Q4 2013
• First Run (Q1 February 2013)to preliminarily delineate riparian process domains and provide quantitative basis for selecting Focus Areas
• Second and Third Runs Q4 2013 – Additional 2013 field data
– Ice processes
– Beaver Complexes

Cluster Analysis: Geologic and Geomorphic Variables
I Confinement-entrenchment ratio
– CR=Wfloodplain: Wchannel
• Is a contiuum
• Confined (CR<2) vs. Moderate (2≤ CR ≤4) vs. Unconfined (CR > 4)
II Channel Type (general channel planform)
III Channel Slope
• To-be-included in Q4 2013 Analyses:
– Beaver dam complex areas
– Ice−floodplain interaction field survey data
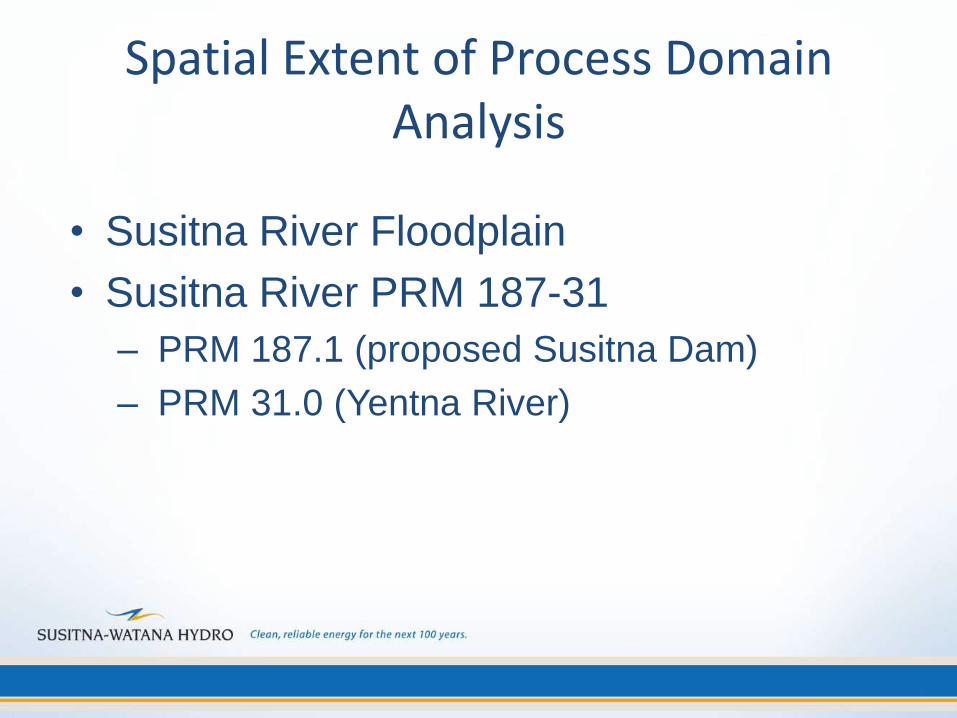
Spatial Extent of Process Domain Analysis
• Susitna River Floodplain
• Susitna River PRM 187-31
– PRM 187.1 (proposed Susitna Dam)
– PRM 31.0 (Yentna River)

Project River Mile (PRM) System

Transect Generated Every ¼ Mile
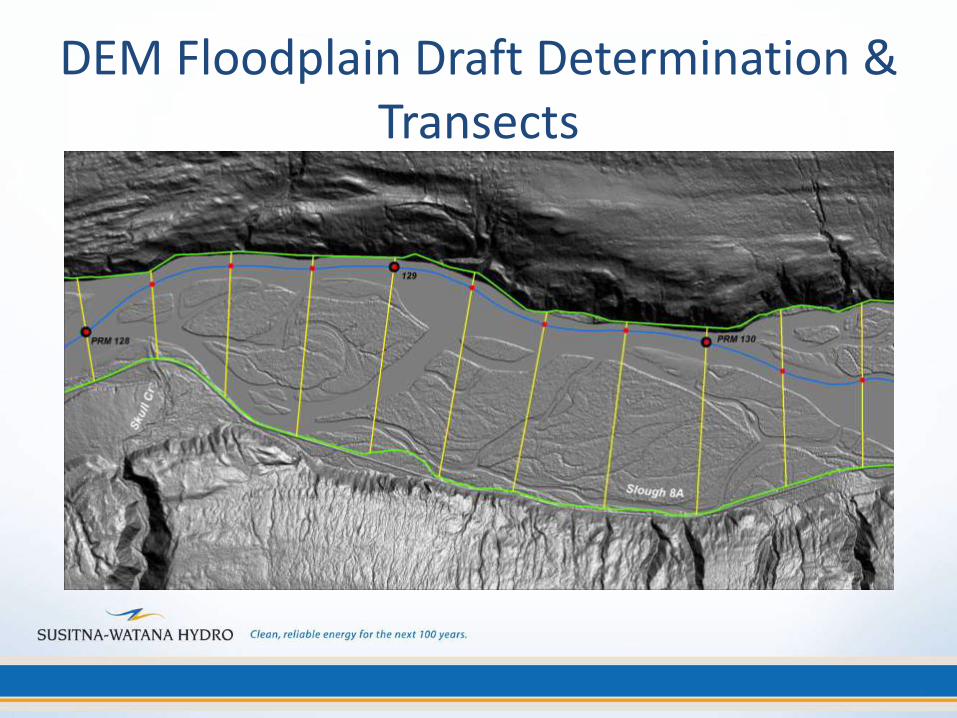
DEM Floodplain Draft Determination & Transects

Susitna River Channel Slope (2012 survey data)
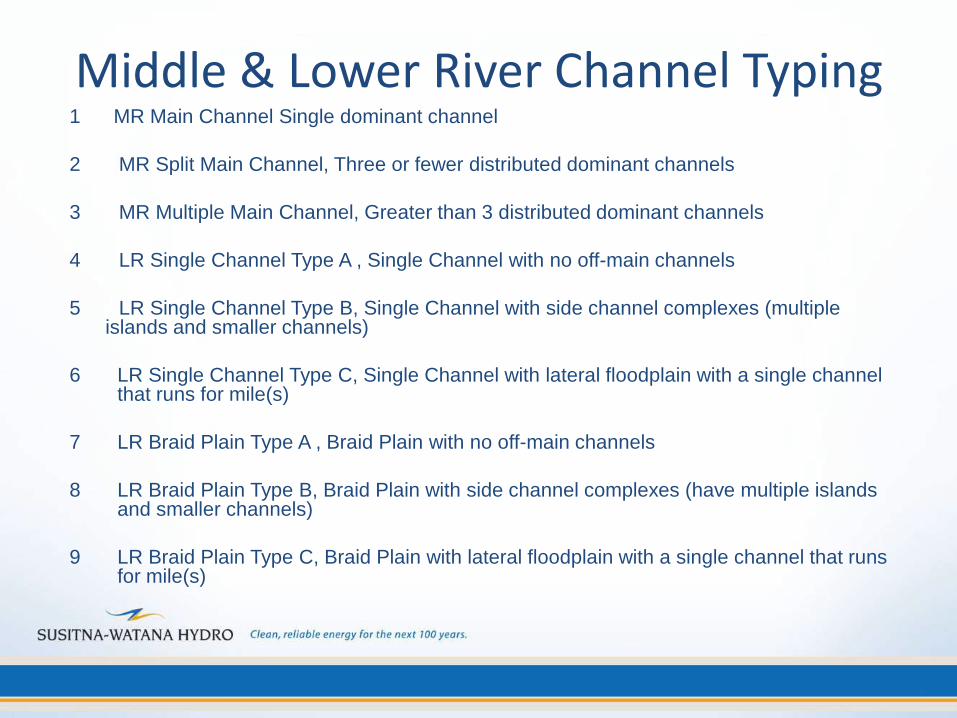
Middle & Lower River Channel Typing 1 MR Main Channel Single dominant channel
2 MR Split Main Channel, Three or fewer distributed dominant channels
3 MR Multiple Main Channel, Greater than 3 distributed dominant channels
4 LR Single Channel Type A , Single Channel with no off-main channels
5 LR Single Channel Type B, Single Channel with side channel complexes (multiple islands and smaller channels)
6 LR Single Channel Type C, Single Channel with lateral floodplain with a single channel that runs for mile(s)
7 LR Braid Plain Type A , Braid Plain with no off-main channels
8 LR Braid Plain Type B, Braid Plain with side channel complexes (have multiple islands and smaller channels)
9 LR Braid Plain Type C, Braid Plain with lateral floodplain with a single channel that runs for mile(s)

Channel Typing

Confinement Ratio
Confinement Ratio
Floodplain Width Active Channel Width
=
Floodplain Width
Active Channel Width

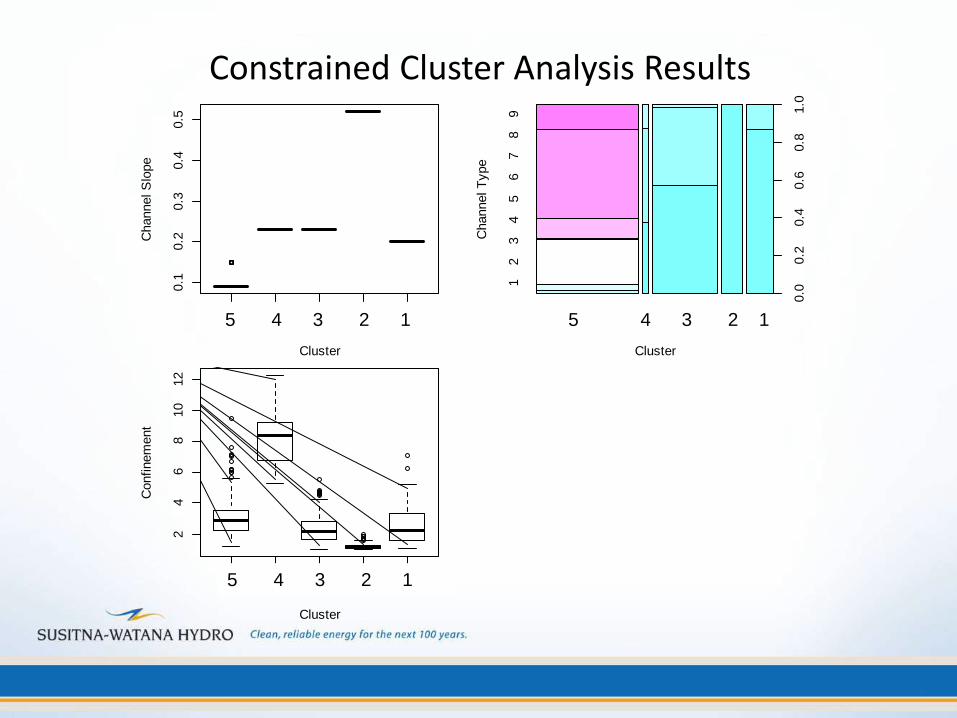
Riparian Process Domain Cluster Analysis Results
• Numerical Results
• River Network Projection
• Comparison and Contrast with
Geomorphic Channel Classification
1 2 3 4 5
0.1
0.2
0.3
0.4
0.5
Constrained Clustering Geomorph
NO Beavers Orig Transects ONLY
Cluster
Channel S
lope
Cluster
Channel T
ype
1 2 3 4 5
12
34
56
78
9
0.0
0.2
0.4
0.6
0.8
1.0
1 2 3 4 5
24
68
10
12
Cluster
Confinem
ent
1 2 3 4 5
0.0
0.2
0.4
0.6
0.8
1.0
Cluster
Beaver
Pre
sence
1 2 3 4 5
0.1
0.2
0.3
0.4
0.5
Constrained Clustering Geomorph
NO Beavers Orig Transects ONLY
Cluster
Channel S
lope
Cluster
Channel T
ype
1 2 3 4 5
12
34
56
78
9
0.0
0.2
0.4
0.6
0.8
1.0
1 2 3 4 5
24
68
10
12
Cluster
Confinem
ent
1 2 3 4 5
0.0
0.2
0.4
0.6
0.8
1.0
Cluster
Beaver
Pre
sence
Constrained Cluster Analysis Results
5 4 3 2 1 5 4 3 2 1
5 4 3 2 1

0
1
2
3
4
5
0 50 100 150 200
Clu
ste
r
Project River Mile
Constrained Cluster Analysis Results

Lower River
Middle River
Three Rivers
Yentna River
Draft Cluster Analysis Results

Lower River Riparian Process Domains: Cluster Analysis
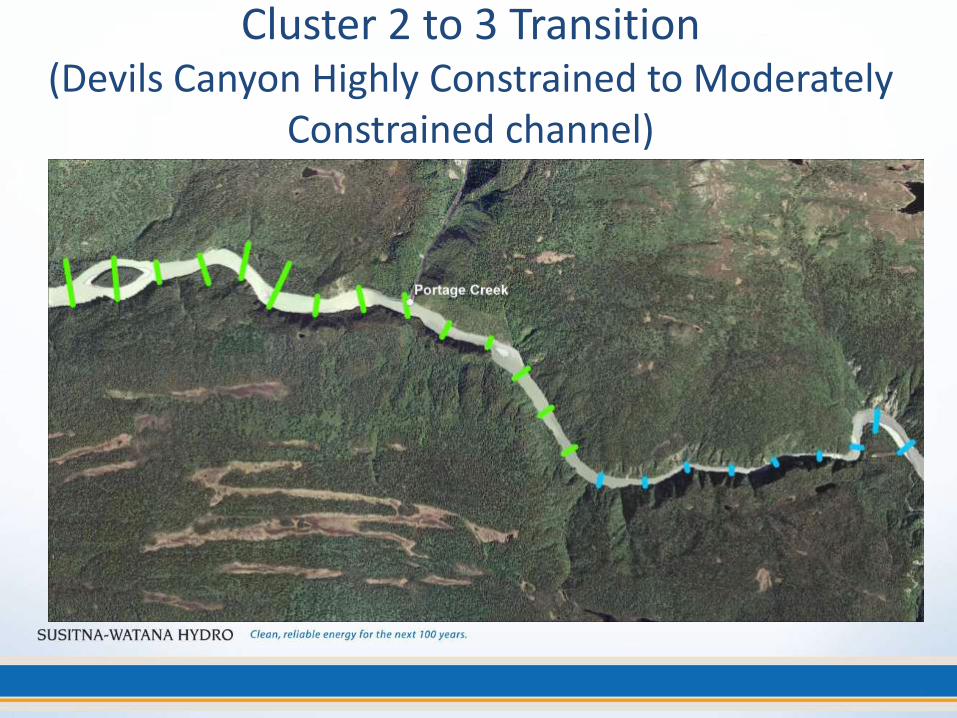
Cluster 2 to 3 Transition (Devils Canyon Highly Constrained to Moderately
Constrained channel)

Three Rivers Confluence: Clusters 3, 4, 5 Transitions

Geomorphic Reach Classification & Cluster Analysis Results
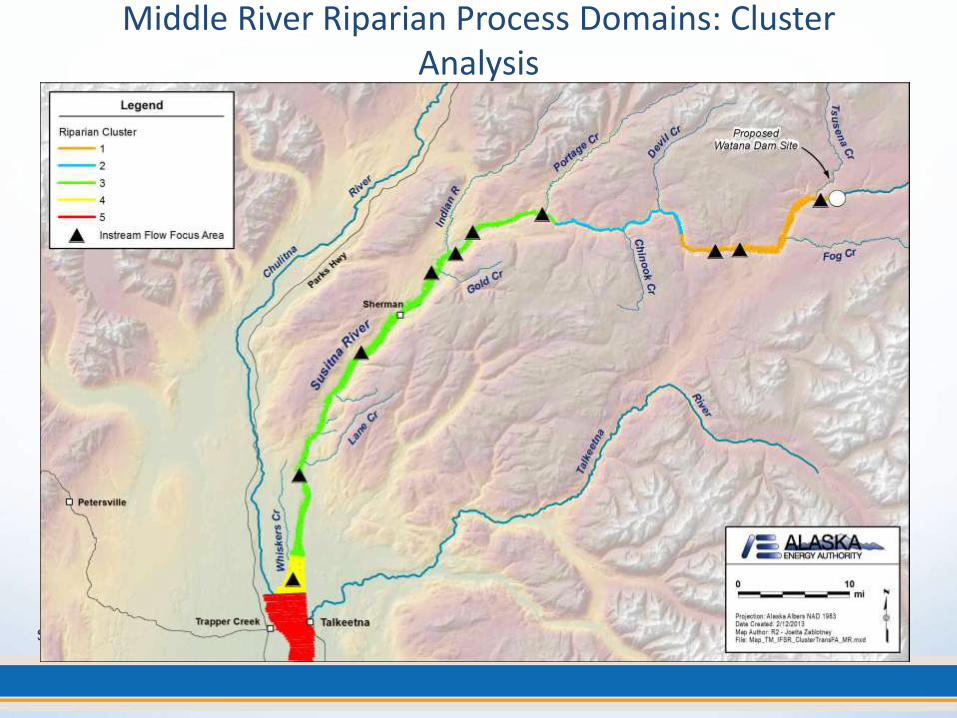
Middle River Riparian Process Domains: Cluster Analysis
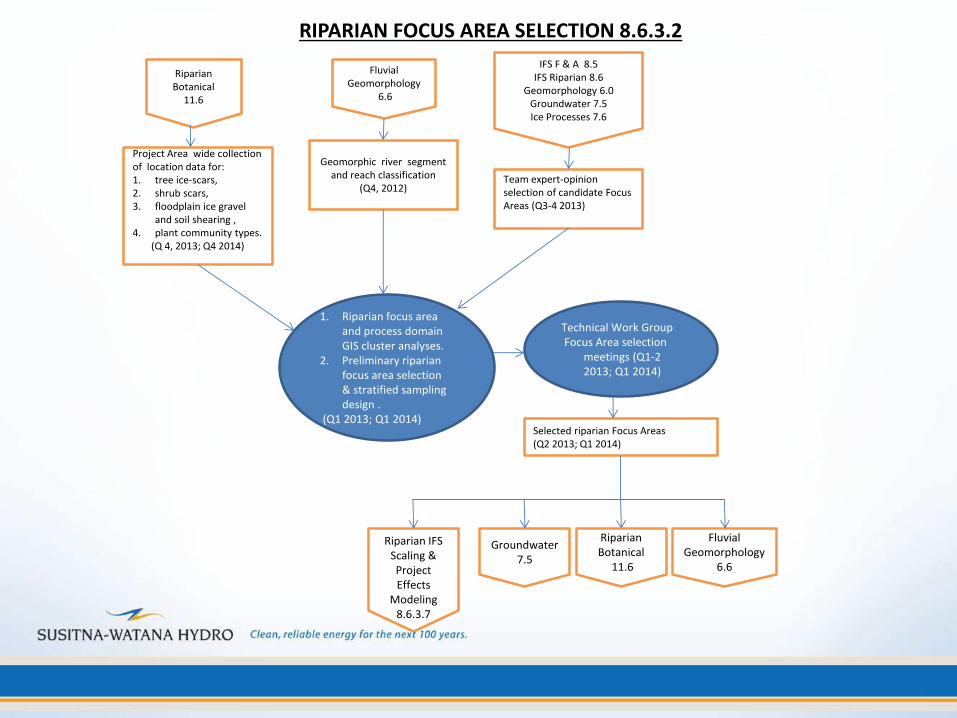
Riparian Botanical
11.6
Fluvial Geomorphology
6.6
Project Area wide collection of location data for:1. tree ice-scars,2. shrub scars,3. floodplain ice gravel
and soil shearing ,4. plant community types.
(Q 4, 2013; Q4 2014)
Geomorphic river segment and reach classification
(Q4, 2012)Team expert-opinion selection of candidate Focus Areas (Q3-4 2013)
RIPARIAN FOCUS AREA SELECTION 8.6.3.2
Technical Work GroupFocus Area selection
meetings (Q1-2 2013; Q1 2014)
Selected riparian Focus Areas(Q2 2013; Q1 2014)
Groundwater 7.5
Riparian Botanical
11.6
Fluvial Geomorphology
6.6
IFS F & A 8.5IFS Riparian 8.6
Geomorphology 6.0Groundwater 7.5Ice Processes 7.6
1. Riparian focus area and process domain GIS cluster analyses.
2. Preliminary riparian focus area selection & stratified sampling design .
(Q1 2013; Q1 2014)
Riparian IFS Scaling & Project Effects
Modeling 8.6.3.7

ABR Integrated Terrain Unit (ITU) Mapping
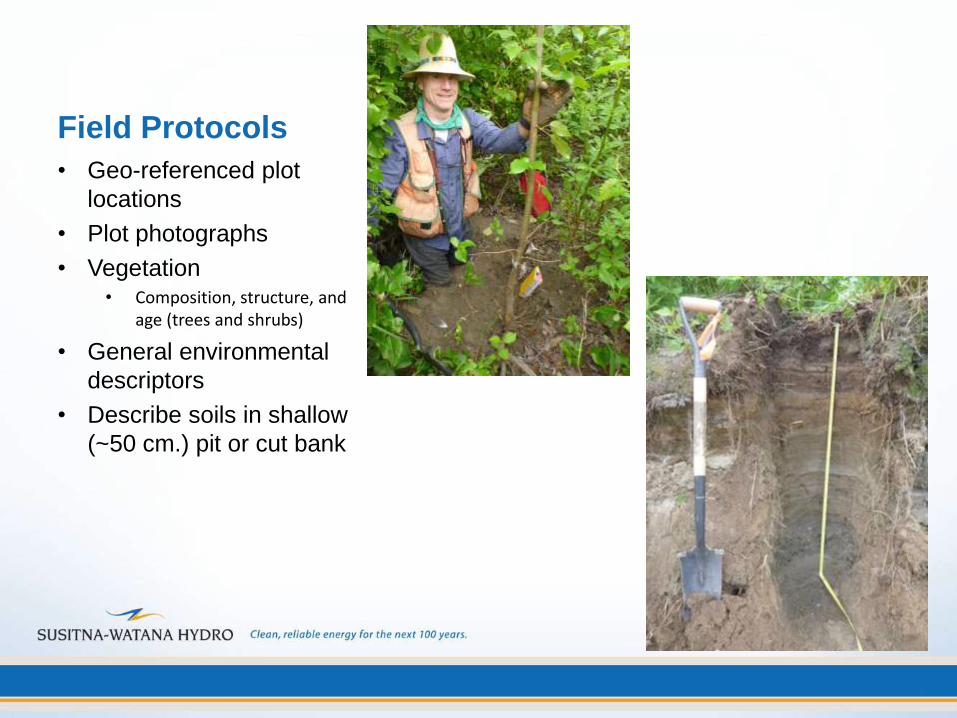
Field Protocols
• Geo-referenced plot
locations
• Plot photographs
• Vegetation • Composition, structure, and
age (trees and shrubs)
• General environmental
descriptors
• Describe soils in shallow
(~50 cm.) pit or cut bank

Draft Riparian Study Area and 2012 Field Plots
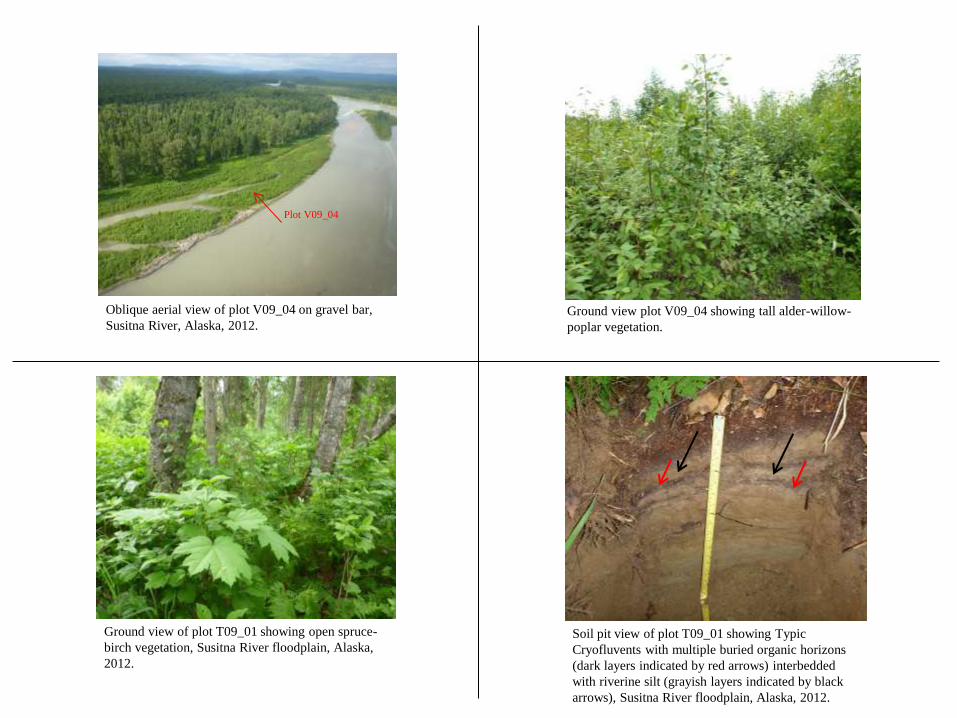
Plot V09_04
Oblique aerial view of plot V09_04 on gravel bar,
Susitna River, Alaska, 2012. Ground view plot V09_04 showing tall alder-willow-
poplar vegetation.
Ground view of plot T09_01 showing open spruce-
birch vegetation, Susitna River floodplain, Alaska,
2012.
Soil pit view of plot T09_01 showing Typic
Cryofluvents with multiple buried organic horizons
(dark layers indicated by red arrows) interbedded
with riverine silt (grayish layers indicated by black
arrows), Susitna River floodplain, Alaska, 2012.
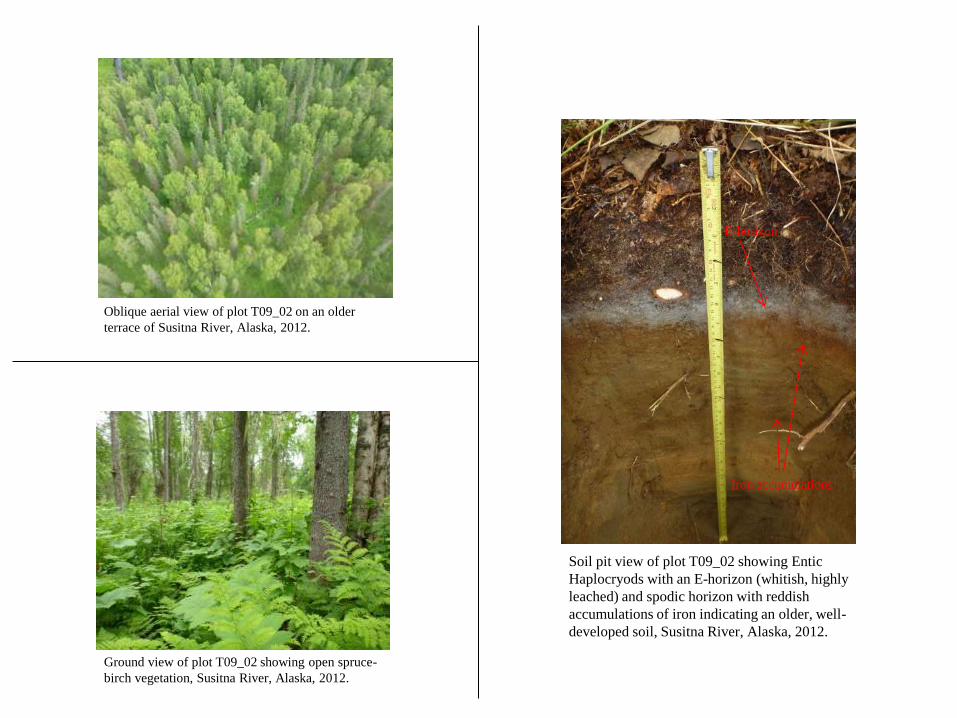
Oblique aerial view of plot T09_02 on an older
terrace of Susitna River, Alaska, 2012.
Ground view of plot T09_02 showing open spruce-
birch vegetation, Susitna River, Alaska, 2012.
Soil pit view of plot T09_02 showing Entic
Haplocryods with an E-horizon (whitish, highly
leached) and spodic horizon with reddish
accumulations of iron indicating an older, well-
developed soil, Susitna River, Alaska, 2012.
E-horizon
Iron accumulations

Toposequences – Pattern and Process
Alluvial
Terrace
Open Spruce-Birch
Forest (gappy)
Abandoned
Channels &
Deposits
Meander Active Channel Deposit
Closed Tall
Alder-Willow-
Poplar sapling
Betula papyrifera
Picea glauca
Viburnum edule
Gymnocarpium dryopteris
Streptopus amplexifolius
Meander Inactive Overbank Deposit
Floating
organic mat Non-
patterned
River
Water
Non-
patterned
Partially
Vegetated
Bluejoint-
Herb
Meadow
Glacial
River
Calamagrostis
canadensis
Equisetum arvense
Polemonium acutiflorum
Heracleum lanatum
Athyrium filix-femina
Picea glauca
Betula papyrifera
Oplopanax horridus
Alnus crispa
Dryopteris dilatata
Matteuccia struthiopteris
Potentilla palustris
Carex canescens
Equisetum fluviatile
Carex utriculata
Cicuta mackenzieana
Salix alaxensis
Salix barclayi
Alnus tenuifolia
Populus balsamifera
Aster sibirica
Artemisia tilesii
Agropyron boreale
Equisetum variegatum
Water
Regular flooding/ice Regular
flooding/ice
Semi-regular to irregular
flooding/ice; wind throw
Semi-regular to
irregular flooding/
ice/beaver
Open Spruce-
Birch Forest
(gappy)
Tree mounds (downed
logs and root balls)
Beaver/
paludification
Lowland Wet
Sedge Meadow Open Spruce-
Birch Forest
Non-
patterned
Fire, wind
throw
Susitna River
Inactive channel or
‘slough’
Abandoned channel
w/ floating organic
mat
Water table
sandy
gravel
Oxyaquic
Cryorthents
Plot V09_04
(Figs. 2-3) Typic Cryofluvents
Plot T09_01
(Figs. 4-7)
sandy
gravel
2.0
m
stratified
silt and
sand
silt
sand
Buried
organics
Oi
O
e
1.0
m
stratified
silt and
sand
Oi
Silt (above), sand
(below) with broken
buried organics and
irregular boundary
Ice
dis
turb
ance
Typic Cryofluvents
Plot
V09_03
(Figs. 8-10)
1.0
m
0 m
Oi
O
e
Hydric
Cryofibri
st
Water
Table
Water
Plot
V09_02
(Figs. 11-
12)
3.5
m
Stratified silt
and sand
Loam w/
Fe2+ and
Al3+
Loamy sand
Oi O
e
Entic
Haplocryods
Plot T09_02
(Figs. 13-
15)
4 m
~1 km
Water Table
0 m
0.75 m
sand
sandy
gravel
Integrated Terrain Unit (ITU) mapping
• An integrated, multivariate mapping approach (Jorgenson
et al. 2003)
• Terrain unit map boundaries are adjusted so that there is
increased coincidence between the boundaries and
occurrences of interdependent variables
• e.g., geomorphology, vegetation, poplar size class
• Mapping conducted by hand-digitizing over high-res (≤1-
m) aerial or satellite imagery at 1:3,000 to 1:5,000 scale.
• Verified by field data

ITU Geomorphology
Legend
ITU Mapping
Geomorph
Fboa:Braided Active Overbank Deposit
Fbraf:Braided Fine Active Channel Deposit
Fmraf:Meander Fine Active Channel Deposit
Fmrif:Meander Fine Inactive Channel Deposit
Fto:Old Alluvial Terrace
He:Excavation
Hfg:Gravel Fill
Ofc:Channel Fen
Wlscv:Shallow Connected Beaver Pond
fbob:Braided Abandoned Overbank Deposit
fboi:Braided Inactive Overbank Deposit
fbrac:Braided Coarse Active Channel Deposit
fbrif:Braided Fine Inactive Channel Deposit
fmoa:Meander Active Overbank Deposit
fmob:Meander Abandoned Overbank Deposit
fmoi:Meander Inactive Overbank Deposit
fmrac:Meander Coarse Active Channel Deposit
ob:Bogs
wldcr:Deep Connected Riverine Lake
wldir:Deep Isolated Riverine Lake
wlscr:Shallow Connected Riverine Lake
wlsir:Shallow Isolated Riverine Lake
wrlg:Lower Perennial Glacial River
wrug:Upper Perennial Glacial River
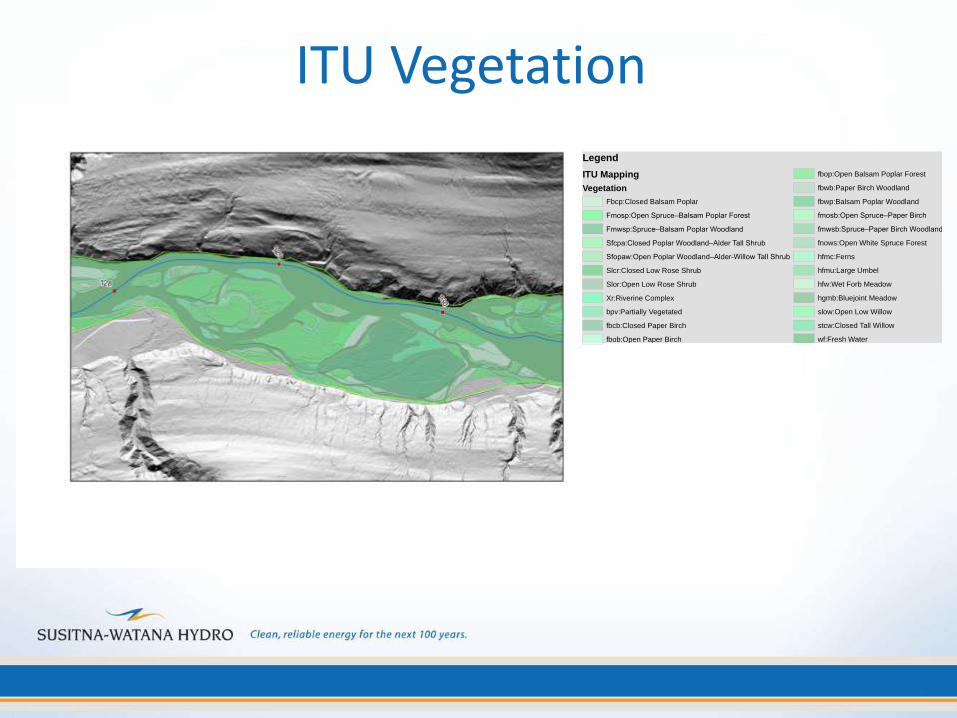
ITU Vegetation
Legend
ITU Mapping
Vegetation
Fbcp:Closed Balsam Poplar
Fmosp:Open Spruce–Balsam Poplar Forest
Fmwsp:Spruce–Balsam Poplar Woodland
Sfcpa:Closed Poplar Woodland–Alder Tall Shrub
Sfopaw:Open Poplar Woodland–Alder-Willow Tall Shrub
Slcr:Closed Low Rose Shrub
Slor:Open Low Rose Shrub
Xr:Riverine Complex
bpv:Partially Vegetated
fbcb:Closed Paper Birch
fbob:Open Paper Birch
fbop:Open Balsam Poplar Forest
fbwb:Paper Birch Woodland
fbwp:Balsam Poplar Woodland
fmosb:Open Spruce–Paper Birch
fmwsb:Spruce–Paper Birch Woodland
fnows:Open White Spruce Forest
hfmc:Ferns
hfmu:Large Umbel
hfw:Wet Forb Meadow
hgmb:Bluejoint Meadow
slow:Open Low Willow
stcw:Closed Tall Willow
wf:Fresh Water
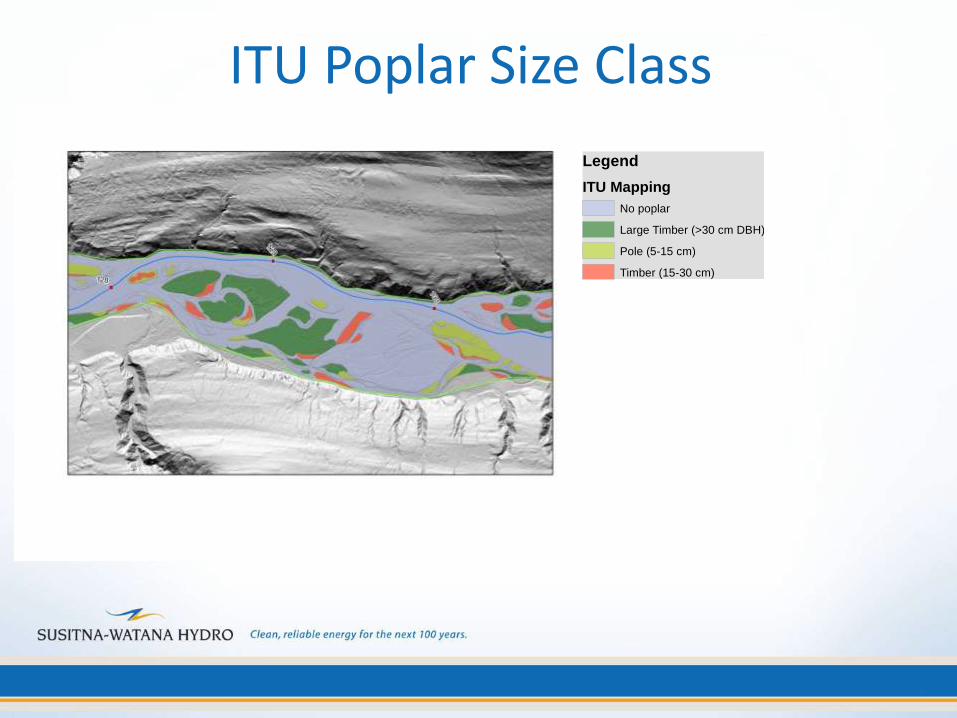
ITU Poplar Size Class
Legend
ITU Mapping
No poplar
Large Timber (>30 cm DBH)
Pole (5-15 cm)
Timber (15-30 cm)

Draft Riparian Study Area and 2012 Field Plots
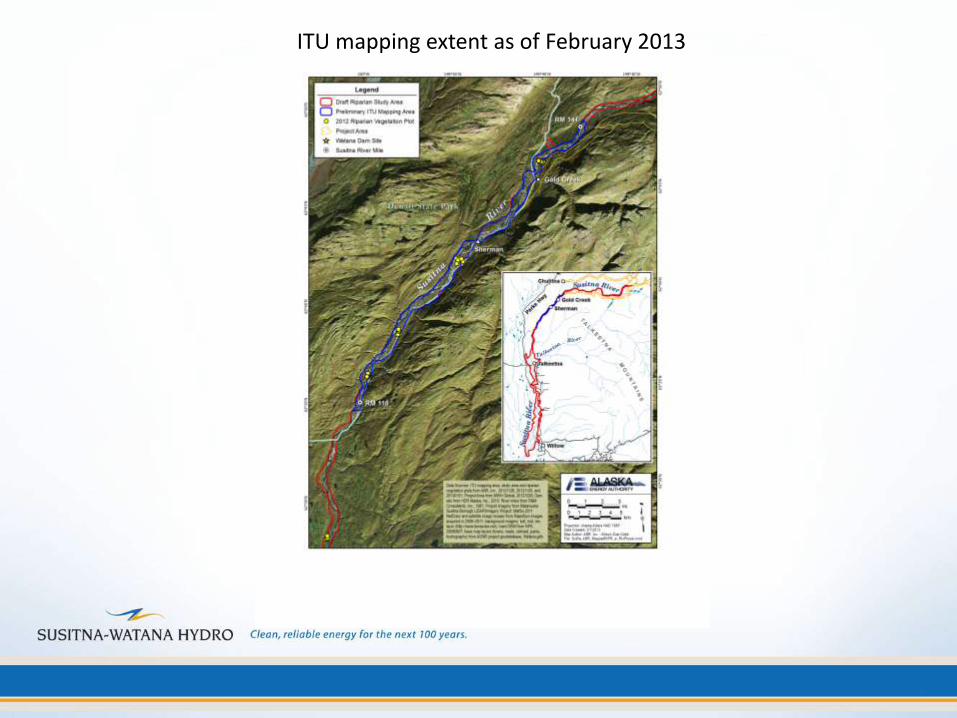
ITU mapping extent as of February 2013

Vegetation Transects: AVC Level III Veg Class
Legend
Aquatic Habitats
BP: LR - Braid Plain
BW: Broadleaf Woodland
CBF: Closed Broadleaf Forest
CCF: Closed Conifer Forest
CMF: Closed Mixed Forest
CW : Conifer woodland
CWS: Closed Alder/Willow Shrub
HM: Human Modified
HRB: Herbaceous
MW: Mixed Woodland
OBF: Open Broadleaf Forest
OCF: Open Conifer Forest
OMF: Open Mixed Forest
OWS: Open Alder/Willow Shrub
PV: Partially Vegetated
RD: Road
UNK: Unknown
WTR: Other Water Features

0%
5%
10%
15%
20%
25%
30%
35%
40%
45%
50%P
erc
en
t To
tal T
tan
sect
Le
ngt
h
CCFOCFCWCMFOMFMWCBFOBFBWCWSOWSPVHRB
Vegetation Communities by Cluster AVC Level III (Viereck et al. 1992)
Cluster 1 13 n = 317 38945 m
Cluster 2 9 n = 96 8920 m
Cluster 3 12 n = 1180 142856 m
Veg Types Segments Total Length
Cluster 4 12 n=205 44461 m
Vegetation transects, ITU mapping, and 2013 Study Design
• ITU vegetation mapping represents strata for use in
developing the stratified random sample design within
each focus area.
• Number and location of focus areas based on variability
and abundance of vegetation types (from veg transects)
within each process domain.
• Vegetation transects will be used to select focus areas
representative of each process domain as a whole.
• Number of plots per focus area determined from a
combination of number and area of veg classes (from
ITU) and veg transect complexity in each focus area

Vegetation Complexity Each vegetation transect:
• Remove all transects less than 0.2 km total length
• Number of vegetation type transitions per transect (veg)
• Total length of each transect (km)
• Calculate # of veg type transitions per kilometer of transect as veg/km
• Summarize across all transects in each reach
Box and Whisker Diagram: Veg type transitions per kilometer by reach
Veg
type
tran
sitio
ns p
er k
ilom
eter
of t
rans
ect
Reach (Cluster)

Middle River Riparian Process Domains: Cluster Analysis
Riparian Instream Flow & Vegetation Study Team
• Thanks to the Riparian IFS Team!
– Joetta Zablotney, R2 GIS Lead
– Kate Knox, R2 Remote Sensing and Ecological Analyses
– Alice Shelly, R2 Environmental Statistician
– Tracy Christopherson, ABR Soil Scientist & Remote Sensing
– Ellen Trainor, ABR Botanist
– Allison Zusi-cobb, ABR GIS Lead