Rio Grande Silvery Minnow Reproductive Monitoring
20
Rio Grande Silvery Minnow Reproductive Monitoring (2001–2019) Robert K. Dudley 1,2 , Adam L. Barkalow 1 , Tessia O. Robbins 1 , Steven P. Platania 1,2 , and Gary C. White 1,3 1 American Southwest Ichthyological Researchers (ASIR); 800 Encino Place NE, Albuquerque, NM, 87102 2 Museum of Southwestern Biology (Fishes), UNM; MSC03-2020, Albuquerque, NM, 87131 3 Dept. of Fish, Wildlife, and Conservation Biology, CSU; 10 Wagar, Fort Collins, CO, 80523
Transcript of Rio Grande Silvery Minnow Reproductive Monitoring
Rio Grande Silvery Minnow Reproductive Monitoring(2001–2019)
Robert K. Dudley1,2, Adam L. Barkalow1, Tessia O. Robbins1, Steven P. Platania1,2, and Gary C. White1,3
1 American Southwest Ichthyological Researchers (ASIR); 800 Encino Place NE, Albuquerque, NM, 871022 Museum of Southwestern Biology (Fishes), UNM; MSC03-2020, Albuquerque, NM, 871313 Dept. of Fish, Wildlife, and Conservation Biology, CSU; 10 Wagar, Fort Collins, CO, 80523
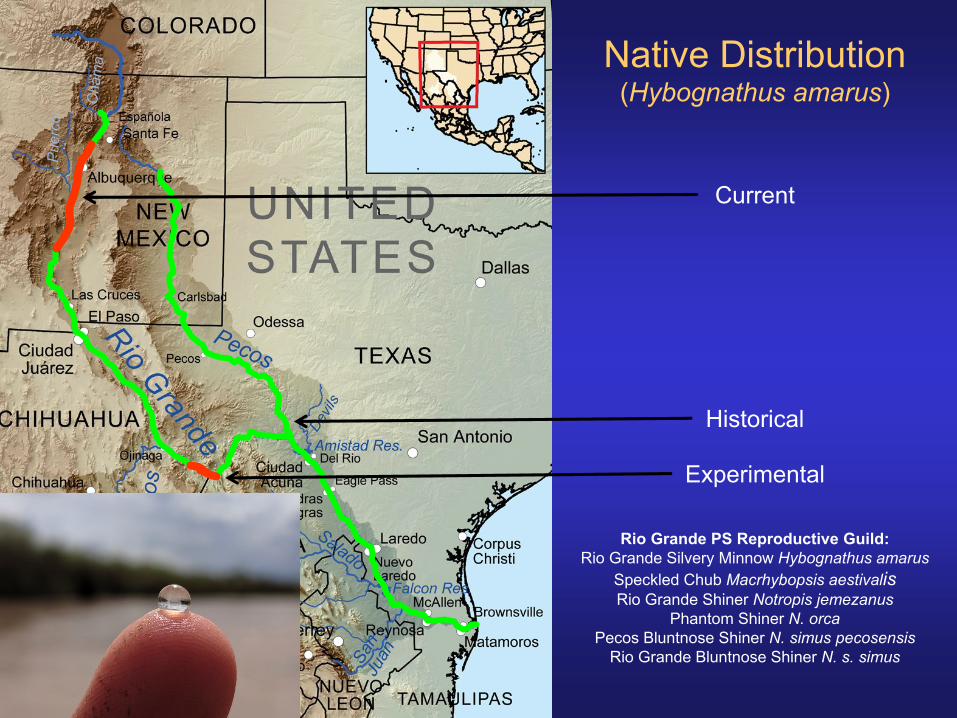
Historical
Current
Native Distribution (Hybognathus amarus)
Experimental
Rio Grande PS Reproductive Guild:
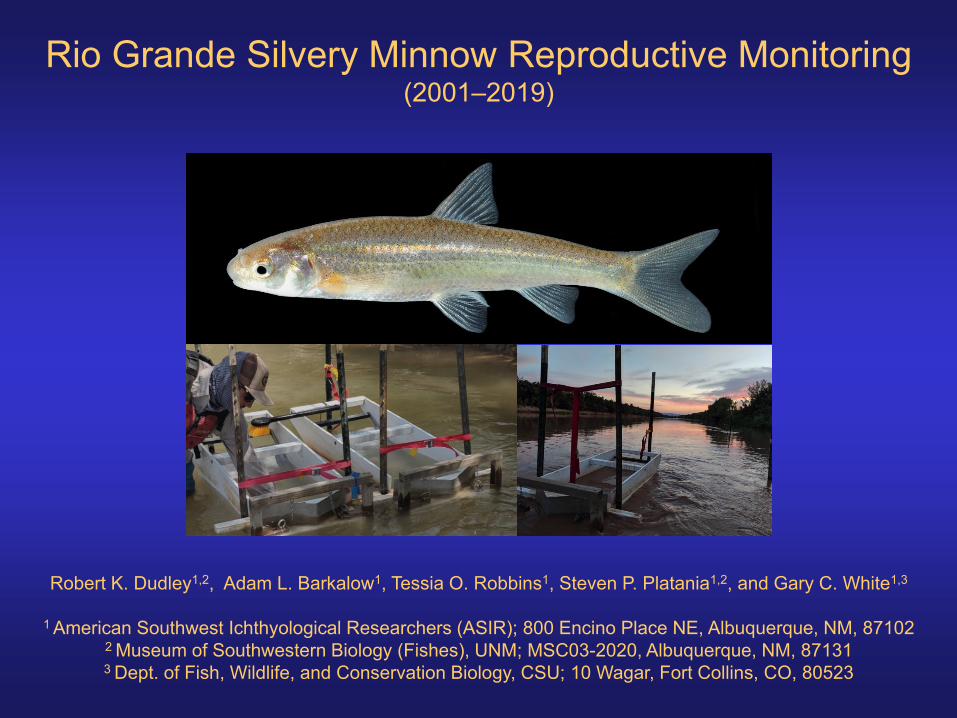
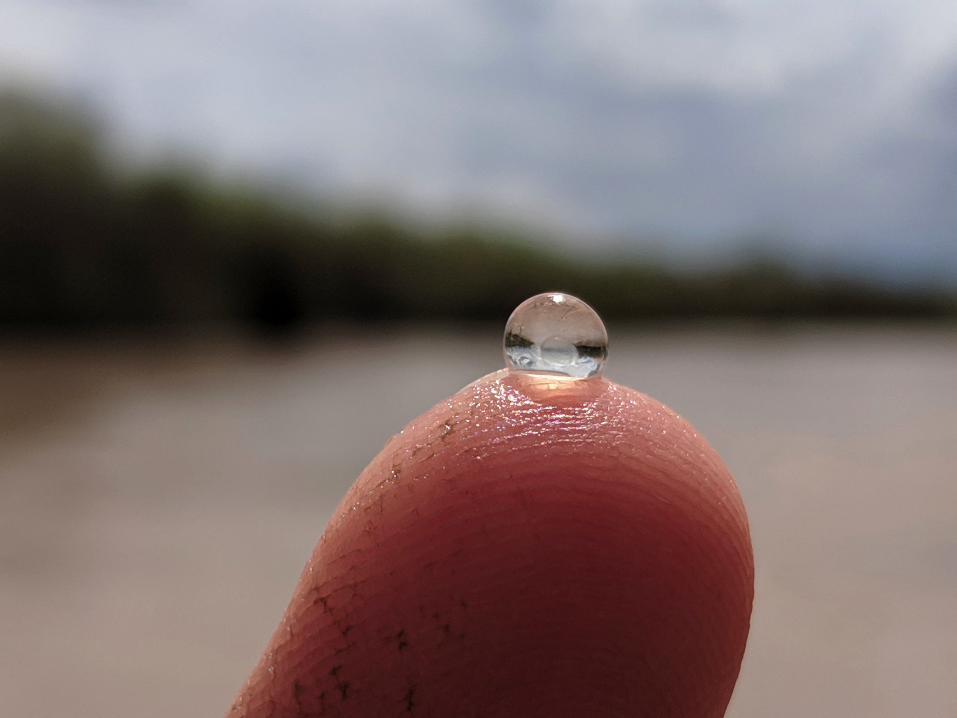
Rio Grande Silvery Minnow Hybognathus amarus
Speckled Chub Macrhybopsis aestivalisRio Grande Shiner Notropis jemezanus
Phantom Shiner N. orca
Pecos Bluntnose Shiner N. simus pecosensis
Rio Grande Bluntnose Shiner N. s. simus
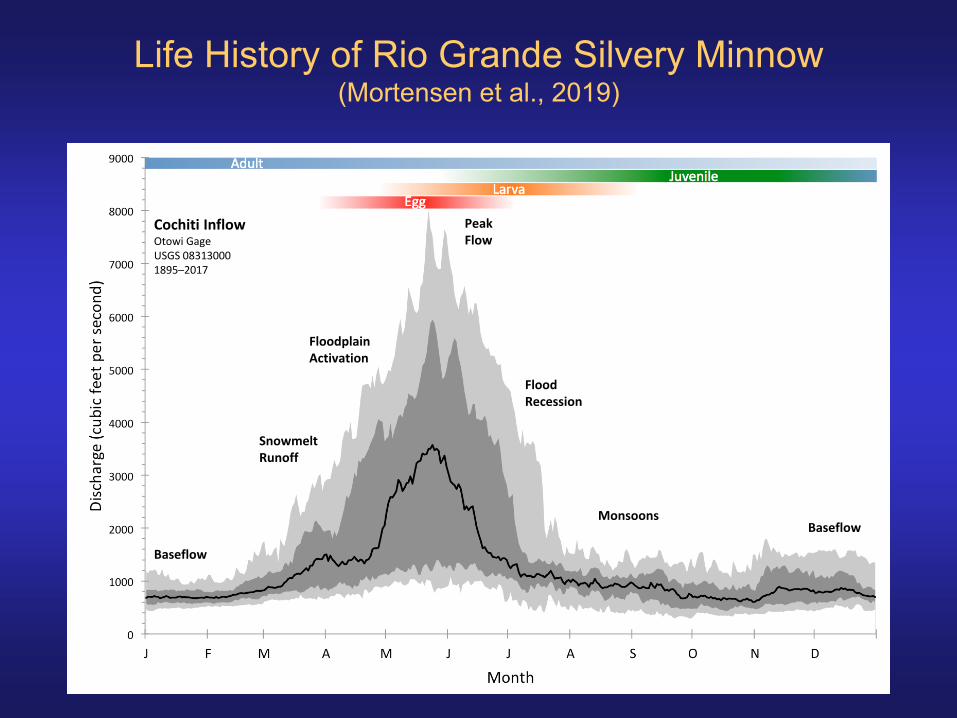
Life History of Rio Grande Silvery Minnow(Mortensen et al., 2019)
Cochiti InflowOtowi GageUSGS 08313000 1895–2017
Floodplain Activation
FloodRecession
Baseflow
BaseflowMonsoons
Snowmelt Runoff
PeakFlow
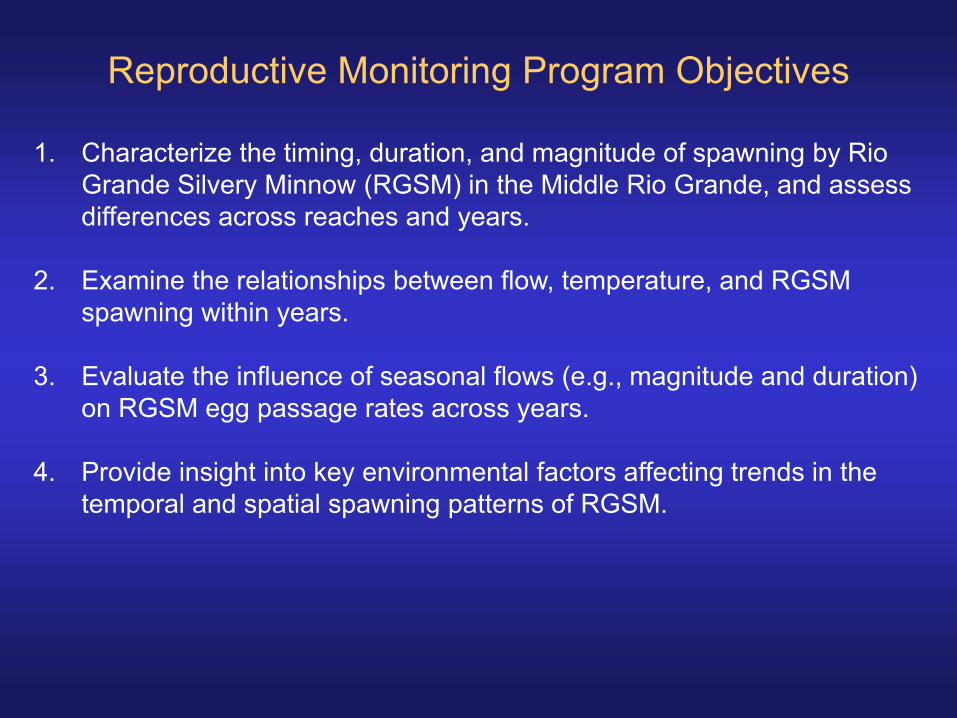
Reproductive Monitoring Program Objectives
1. Characterize the timing, duration, and magnitude of spawning by Rio
Grande Silvery Minnow (RGSM) in the Middle Rio Grande, and assess
differences across reaches and years.
2. Examine the relationships between flow, temperature, and RGSM
spawning within years.
3. Evaluate the influence of seasonal flows (e.g., magnitude and duration)
on RGSM egg passage rates across years.
4. Provide insight into key environmental factors affecting trends in the
temporal and spatial spawning patterns of RGSM.
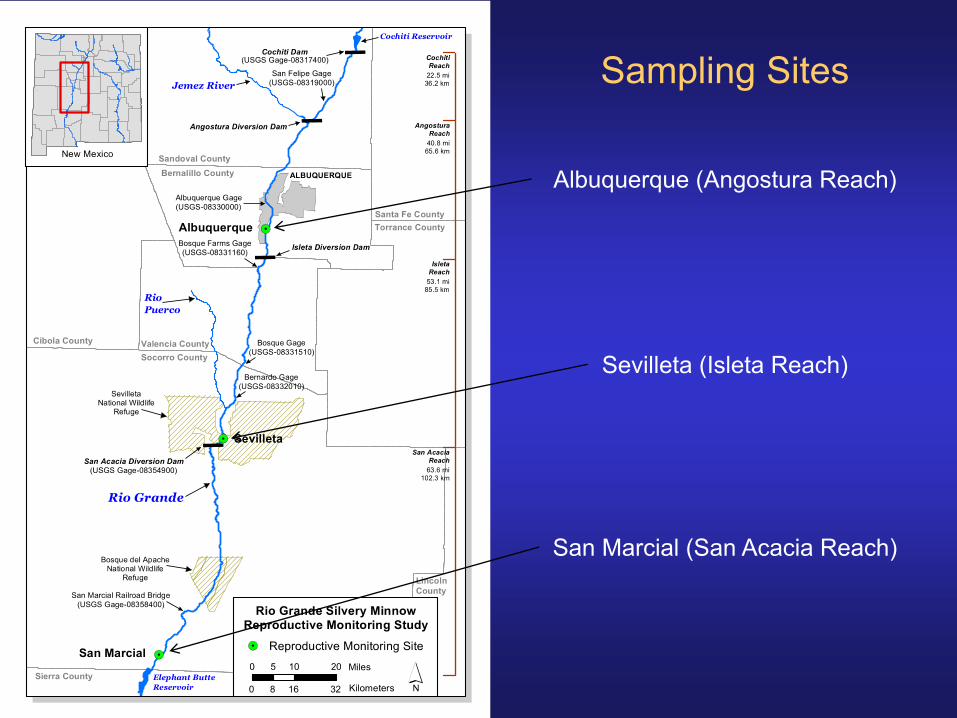
Sampling Sites
Albuquerque (Angostura Reach)
Sevilleta (Isleta Reach)
San Marcial (San Acacia Reach)
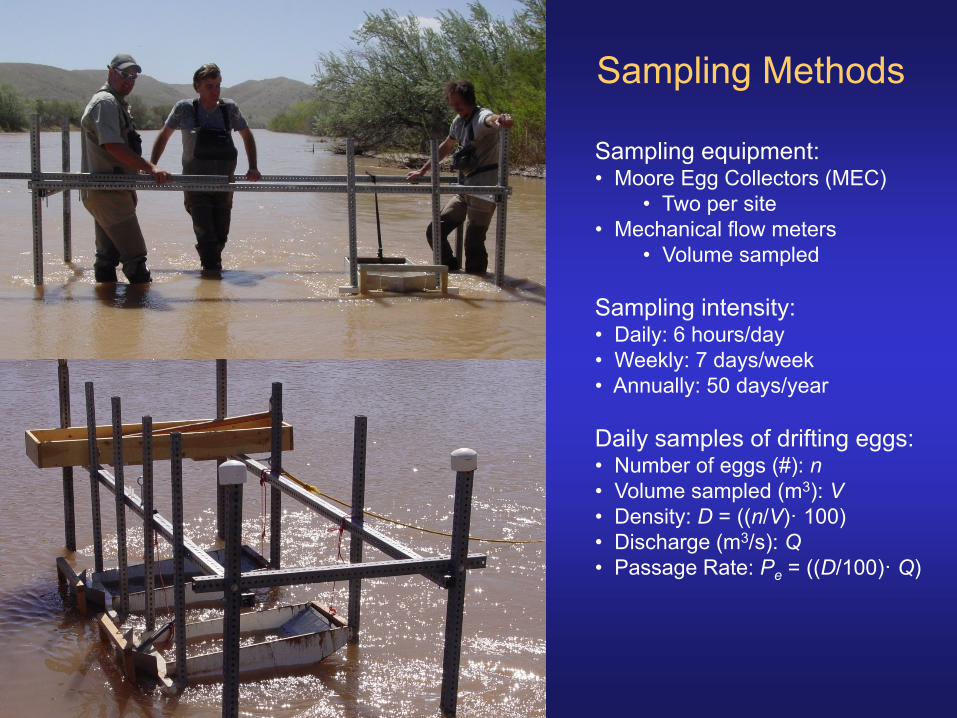
Sampling Methods
Sampling equipment:• Moore Egg Collectors (MEC)
• Two per site
• Mechanical flow meters
• Volume sampled
Sampling intensity:• Daily: 6 hours/day
• Weekly: 7 days/week
• Annually: 50 days/year
Daily samples of drifting eggs:• Number of eggs (#): n
• Volume sampled (m3): V
• Density: D = ((n/V)· 100)
• Discharge (m3/s): Q
• Passage Rate: Pe = ((D/100)· Q)
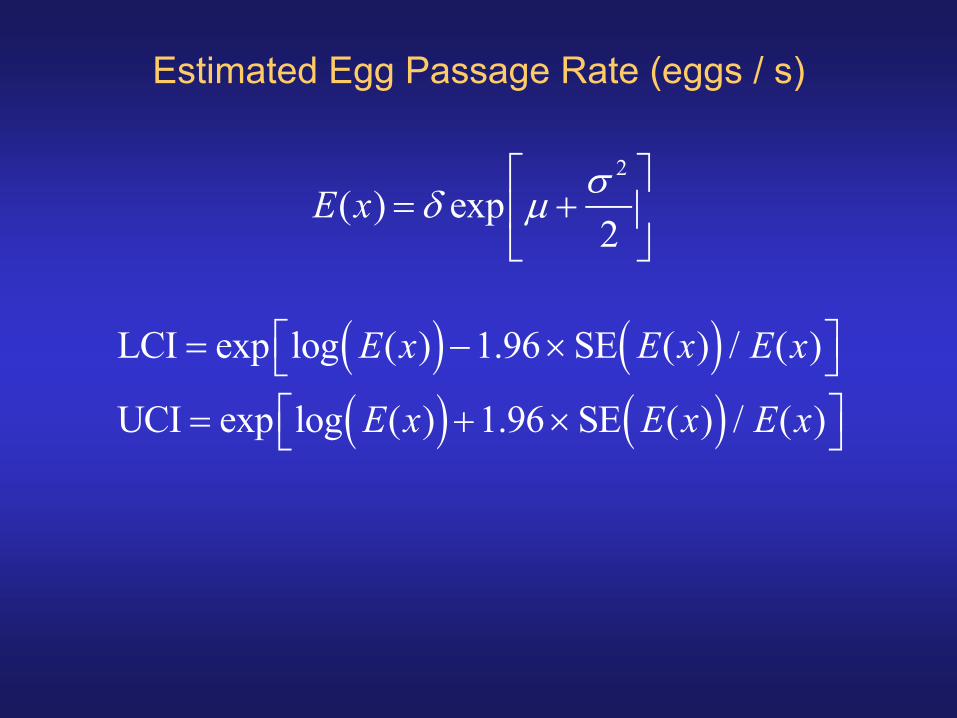
Estimated Egg Passage Rate (eggs / s)
LCI = exp log E(x)( )-1.96 ´SE E(x)( ) / E(x)éë
ùû
UCI = exp log E(x)( )+1.96 ´SE E(x)( ) / E(x)éë
ùû
E(x) = d exp m +s 2
2
é
ëê
ù
ûú
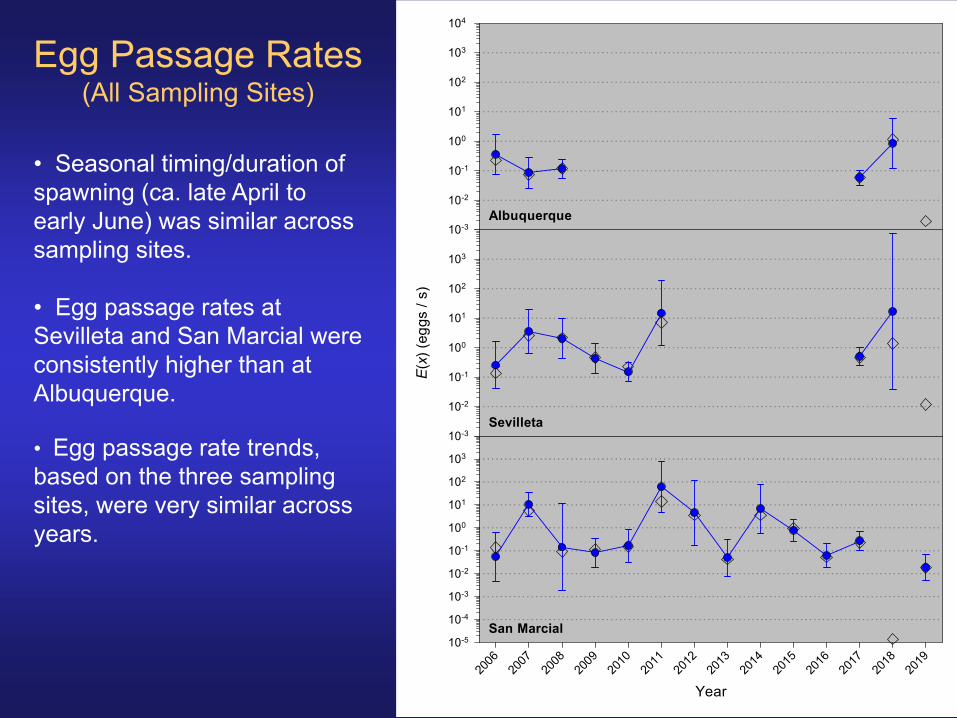
Egg Passage Rates(All Sampling Sites)
• Seasonal timing/duration of
spawning (ca. late April to
early June) was similar across
sampling sites.
• Egg passage rates at
Sevilleta and San Marcial were
consistently higher than at
Albuquerque.
• Egg passage rate trends,
based on the three sampling
sites, were very similar across
years.
Year
10-3
10-2
10-1
100
101
102
103
104
2006
2007
2008
2009
2010
2011
2012
2013
2014
2015
2016
2017
2018
2019
10-5
10-4
10-3
10-2
10-1
100
101
102
103
E(x
) (e
gg
s /
s)
10-3
10-2
10-1
100
101
102
103
Albuquerque
San Marcial
Sevilleta
Q (
cfs
)
0
500
1000
1500
1 4 7 10 13 16 19 22 25 28 31 3 6 9 12 15 18 21 24
Egg
s p
er
100 m
3
10-2
10-1
100
101
102
103
Te
mp
. (°
C)
15.0
20.0
25.0
30.0
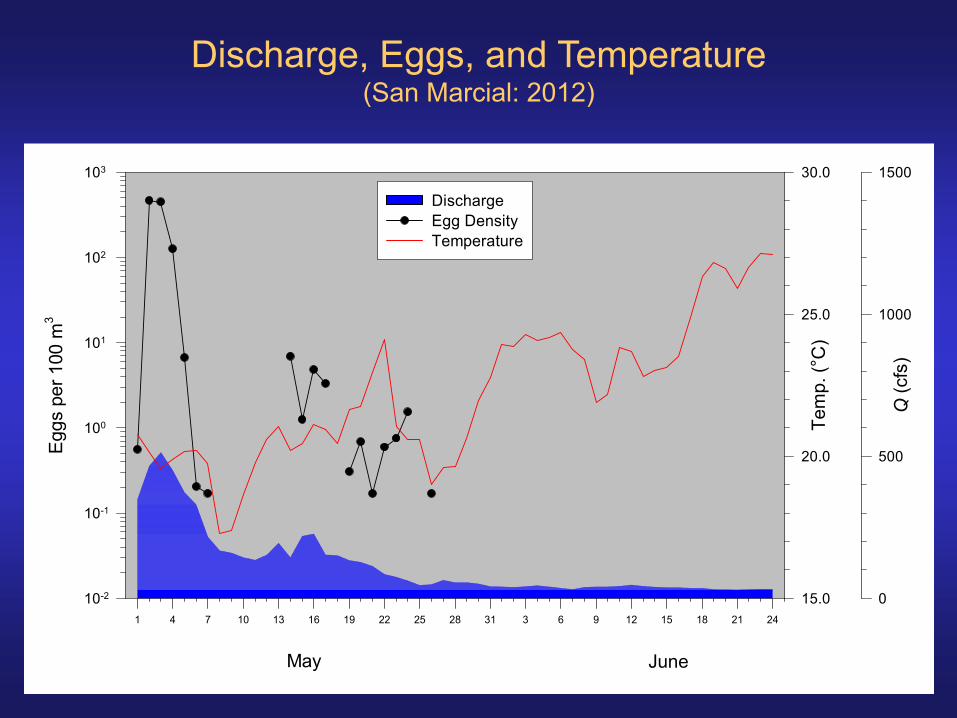
Discharge
Egg Density
Temperature
May June
Discharge, Eggs, and Temperature(San Marcial: 2012)
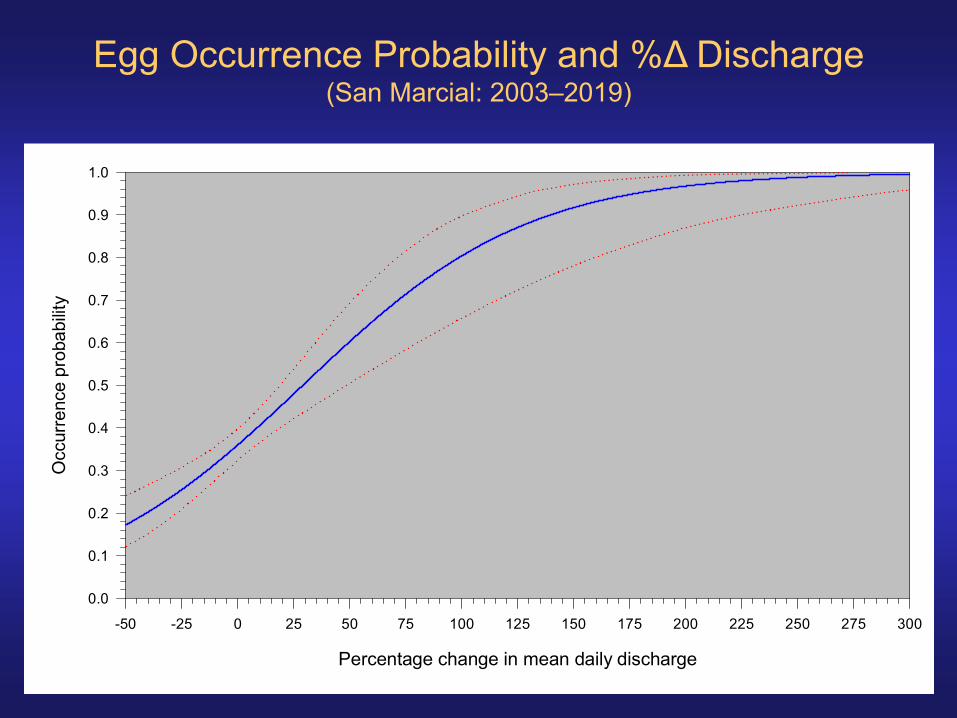
Egg Occurrence Probability and %Δ Discharge(San Marcial: 2003–2019)
Percentage change in mean daily discharge
-50 -25 0 25 50 75 100 125 150 175 200 225 250 275 300
Occurr
ence p
robabili
ty
0.0
0.1
0.2
0.3
0.4
0.5
0.6
0.7
0.8
0.9
1.0
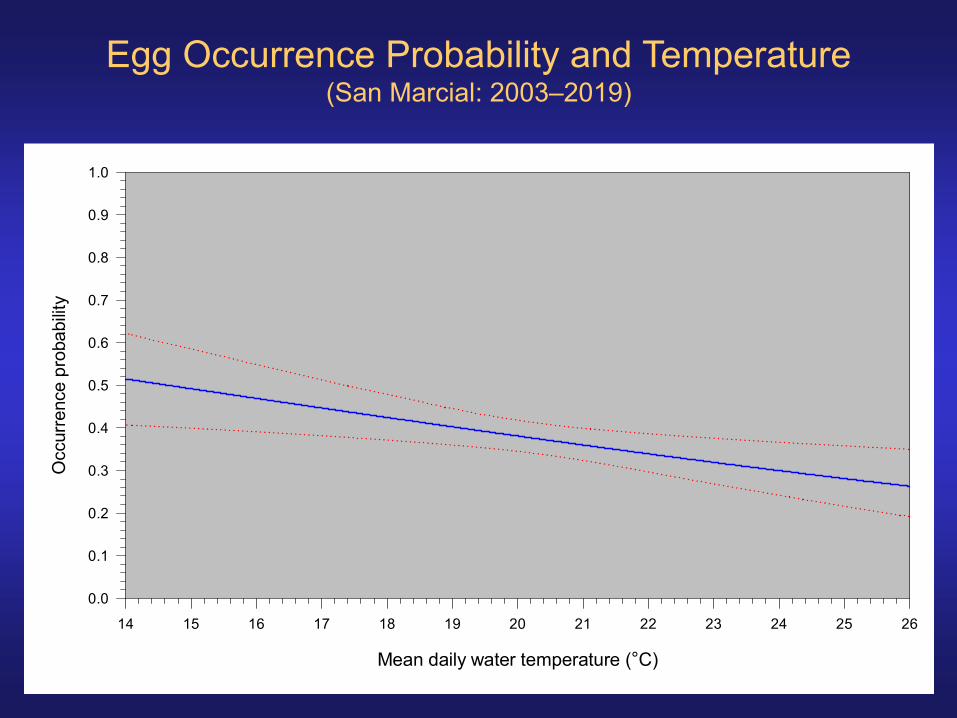
Egg Occurrence Probability and Temperature(San Marcial: 2003–2019)
Mean daily water temperature (°C)
14 15 16 17 18 19 20 21 22 23 24 25 26
Occurr
ence p
robabili
ty
0.0
0.1
0.2
0.3
0.4
0.5
0.6
0.7
0.8
0.9
1.0
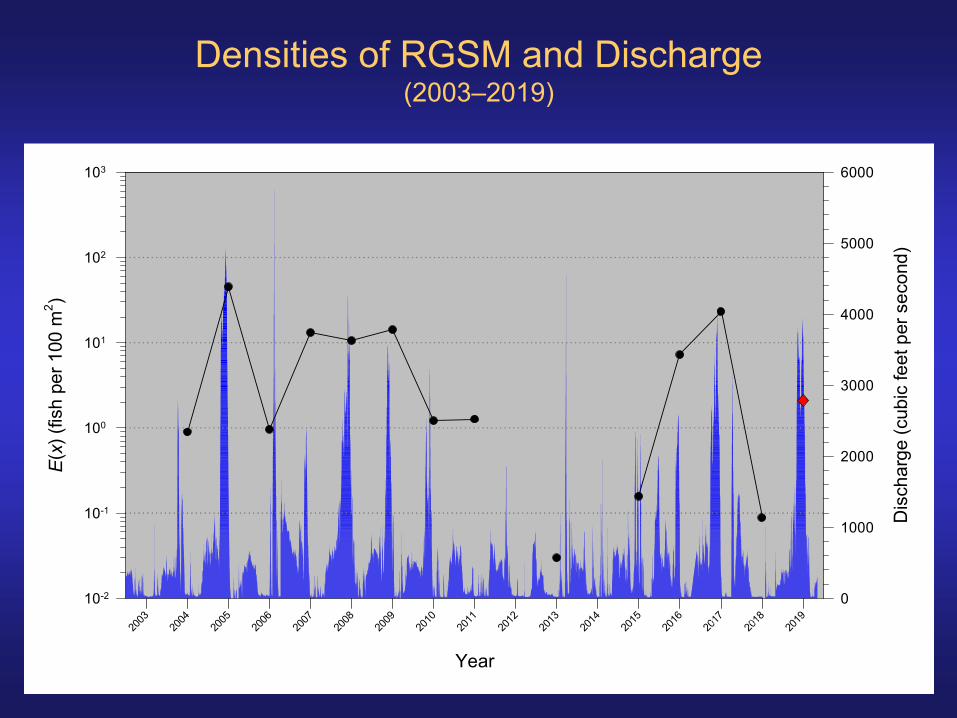
Densities of RGSM and Discharge(2003–2019)
Dis
ch
arg
e (
cubic
fe
et p
er
se
co
nd
)
0
1000
2000
3000
4000
5000
6000
Year
2003
2004
2005
2006
2007
2008
2009
2010
2011
2012
2013
2014
2015
2016
2017
2018
2019
E( x
) (f
ish
pe
r 1
00
m2)
10-2
10-1
100
101
102
103
E(x) = 0 E(x) = 0

Dis
ch
arg
e (
cubic
fe
et p
er
se
co
nd
)
0
1000
2000
3000
4000
5000
6000
Year
2003
2004
2005
2006
2007
2008
2009
2010
2011
2012
2013
2014
2015
2016
2017
2018
2019
E( x
) (e
ggs / s
)
10-3
10-2
10-1
100
101
102
103
E(x) = 0 E(x) = 0
Egg Passage Rates and Discharge(San Marcial: 2003–2019)
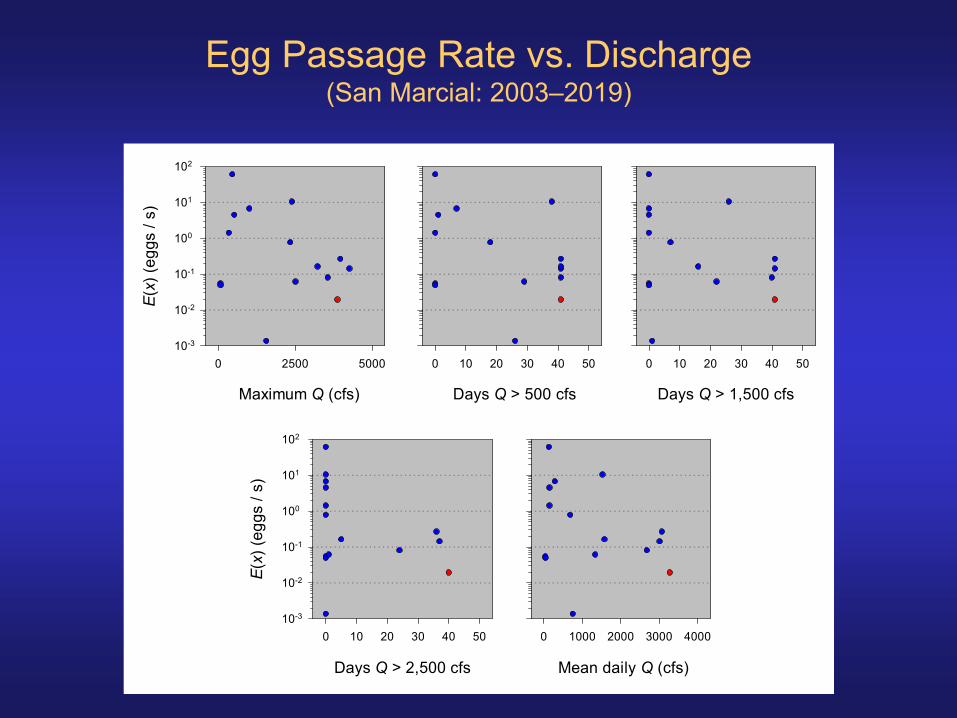
Maximum Q (cfs)
0 2500 5000
E(x
) (e
gg
s /
s)
10-3
10-2
10-1
100
101
102
Days Q > 500 cfs
0 10 20 30 40 50
Days Q > 1,500 cfs
0 10 20 30 40 50
Days Q > 2,500 cfs
0 10 20 30 40 50
E(x
) (e
gg
s /
s)
10-3
10-2
10-1
100
101
102
Mean daily Q (cfs)
0 1000 2000 3000 4000
Egg Passage Rate vs. Discharge(San Marcial: 2003–2019)
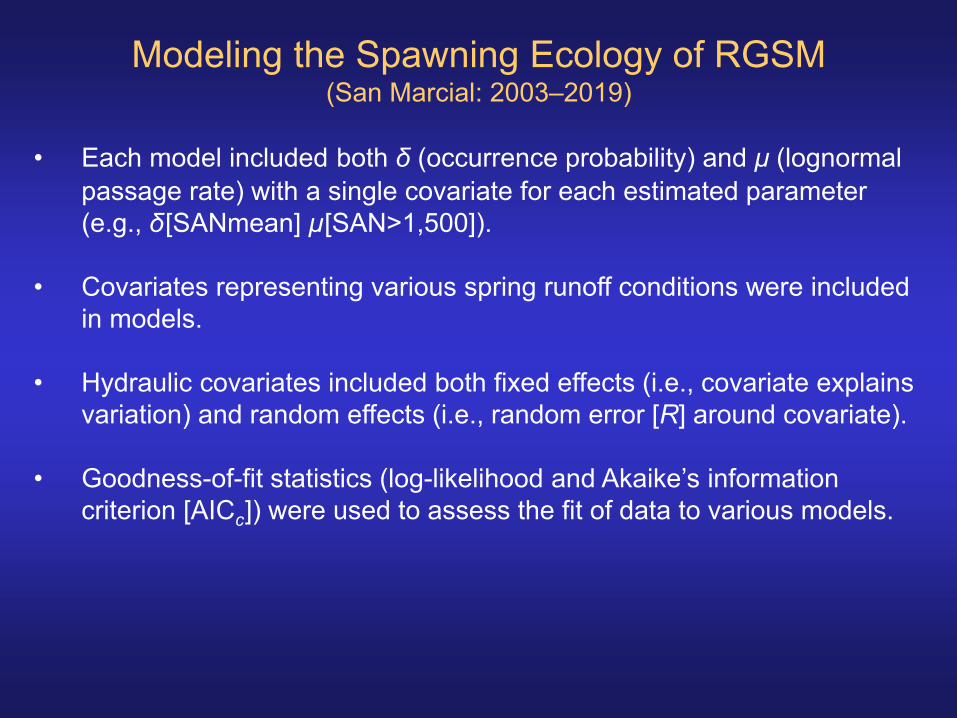
• Each model included both δ (occurrence probability) and μ (lognormal
passage rate) with a single covariate for each estimated parameter
(e.g., δ[SANmean] μ[SAN>1,500]).
• Covariates representing various spring runoff conditions were included
in models.
• Hydraulic covariates included both fixed effects (i.e., covariate explains
variation) and random effects (i.e., random error [R] around covariate).
• Goodness-of-fit statistics (log-likelihood and Akaike’s information
criterion [AICc]) were used to assess the fit of data to various models.
Modeling the Spawning Ecology of RGSM(San Marcial: 2003–2019)

Model Estimates and Discharge(San Marcial: 2003–2019)
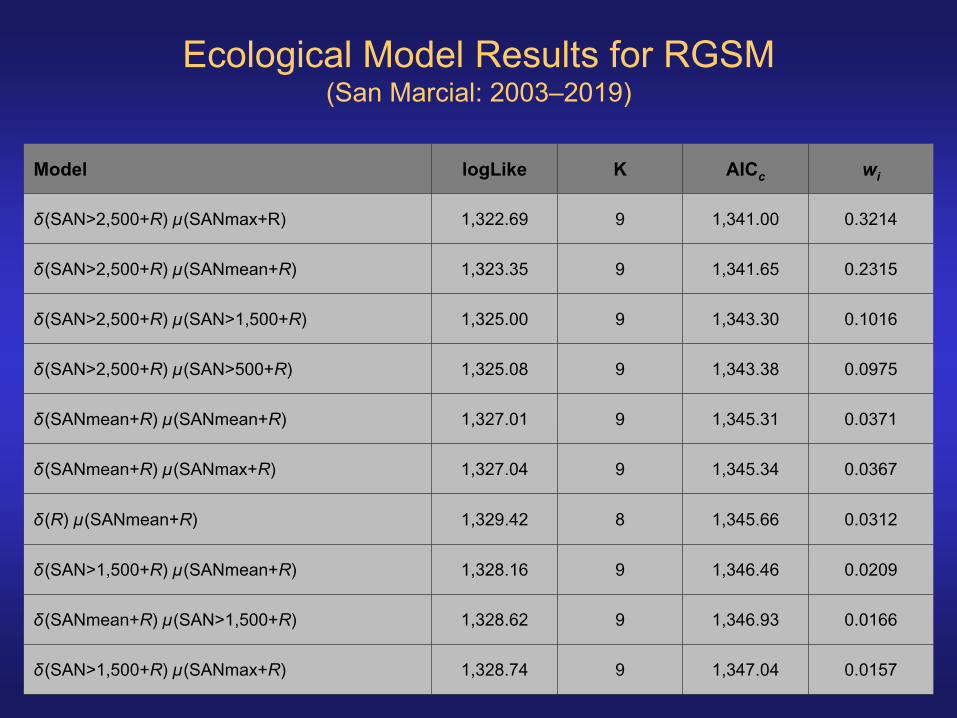
Model logLike K AICc wi
δ(SAN>2,500+R) μ(SANmax+R) 1,322.69 9 1,341.00 0.3214
δ(SAN>2,500+R) μ(SANmean+R) 1,323.35 9 1,341.65 0.2315
δ(SAN>2,500+R) μ(SAN>1,500+R) 1,325.00 9 1,343.30 0.1016
δ(SAN>2,500+R) μ(SAN>500+R) 1,325.08 9 1,343.38 0.0975
δ(SANmean+R) μ(SANmean+R) 1,327.01 9 1,345.31 0.0371
δ(SANmean+R) μ(SANmax+R) 1,327.04 9 1,345.34 0.0367
δ(R) μ(SANmean+R) 1,329.42 8 1,345.66 0.0312
δ(SAN>1,500+R) μ(SANmean+R) 1,328.16 9 1,346.46 0.0209
δ(SANmean+R) μ(SAN>1,500+R) 1,328.62 9 1,346.93 0.0166
δ(SAN>1,500+R) μ(SANmax+R) 1,328.74 9 1,347.04 0.0157
Ecological Model Results for RGSM(San Marcial: 2003–2019)
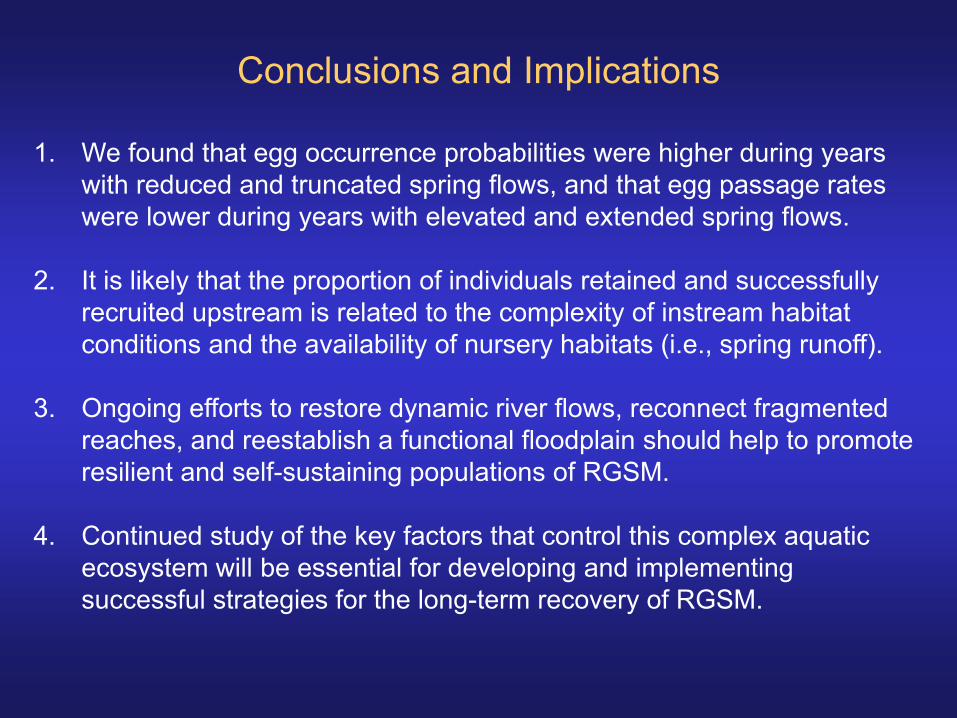
Conclusions and Implications
1. We found that egg occurrence probabilities were higher during years
with reduced and truncated spring flows, and that egg passage rates
were lower during years with elevated and extended spring flows.
2. It is likely that the proportion of individuals retained and successfully
recruited upstream is related to the complexity of instream habitat
conditions and the availability of nursery habitats (i.e., spring runoff).
3. Ongoing efforts to restore dynamic river flows, reconnect fragmented
reaches, and reestablish a functional floodplain should help to promote
resilient and self-sustaining populations of RGSM.
4. Continued study of the key factors that control this complex aquatic
ecosystem will be essential for developing and implementing
successful strategies for the long-term recovery of RGSM.
Acknowledgements
• Field, Data, & Laboratory: Leiah Atchison, Martinique Chavez, Michael Farrington, Tanner Germany,
Alexander Harrison, Jennifer Kennedy, Jacob Mortensen, Alexander Schroeder, Andrea Urioste, and Aaron
Wedemeyer (ASIR & Museum of Southwestern Biology [UNM])
• Curation of Specimens: Alexandra Snyder (Museum of Southwestern Biology [UNM])
• Land Access & Sampling: Dionne Epps (Open Space Division [City of Albuquerque]), Kathy Granillo
and Jon Erz (Sevilleta NWR), and Susan Woods (U.S. Bureau of Reclamation [USBR])
• Technical & Contract Support: Jennifer Bachus and Mary Maestas (USBR)
• Report Review: Eric Gonzales (USBR) and Joel Lusk (USFWS)
• Fish Sampling & Collection Permits: Handling and collection of Rio Grande Silvery Minnow was
authorized by the USFWS (Permit TE001623-4). The N.M. Department of Game and Fish authorized our
handling and collection of all other native and nonnative fishes (Permit 1896).
• Support & Funding: The Middle Rio Grande Endangered Species Collaborative Program has provided
valuable scientific input on this research program since 2001. This study was funded by the USBR, and the
Albuquerque Area Office and Salt Lake City Regional Office administered all funds (Contract R17PC00033:
Requisition 0040426606).