Freshwater fish: passive nets minnow traps Freshwater fish: passive nets—minnow traps v1.0 2...
24
Inventory and monitoring toolbox: freshwater fish DOCDM-997946 Disclaimer This document contains supporting material for the Inventory and Monitoring Toolbox, which contains DOC’s biodiversity inventory and monitoring standards. It is being made available to external groups and organisations to demonstrate current departmental best practice. DOC has used its best endeavours to ensure the accuracy of the information at the date of publication. As these standards have been prepared for the use of DOC staff, other users may require authorisation or caveats may apply. Any use by members of the public is at their own risk and DOC disclaims any liability that may arise from its use. For further information, please email [email protected] This specification was prepared by Michael Lake in 2013. Contents Synopsis .......................................................................................................................................... 2 Assumptions .................................................................................................................................... 3 Advantages...................................................................................................................................... 4 Disadvantages ................................................................................................................................. 4 Suitability for inventory ..................................................................................................................... 5 Suitability for monitoring................................................................................................................... 5 Skills ................................................................................................................................................ 5 Resources ....................................................................................................................................... 6 Minimum attributes .......................................................................................................................... 7 Data storage .................................................................................................................................... 8 Analysis, interpretation and reporting ............................................................................................... 9 Case study A ..................................................................................................................................10 Full details of technique and best practice ......................................................................................14 References and further reading ......................................................................................................19 Appendix A .....................................................................................................................................22 Appendix B .....................................................................................................................................23 Freshwater fish: passive nets— minnow traps Version 1.0
Transcript of Freshwater fish: passive nets minnow traps Freshwater fish: passive nets—minnow traps v1.0 2...

Inventory and monitoring toolbox: freshwater fish
DOCDM-997946
Disclaimer This document contains supporting material for the Inventory and Monitoring Toolbox, which contains DOC’s biodiversity inventory and monitoring standards. It is being made available to external groups and organisations to demonstrate current departmental best practice. DOC has used its best endeavours to ensure the accuracy of the information at the date of publication. As these standards have been prepared for the use of DOC staff, other users may require authorisation or caveats may apply. Any use by members of the public is at their own risk and DOC disclaims any liability that may arise from its use. For further information, please email [email protected]
This specification was prepared by Michael Lake in 2013.
Contents
Synopsis .......................................................................................................................................... 2
Assumptions .................................................................................................................................... 3
Advantages ...................................................................................................................................... 4
Disadvantages ................................................................................................................................. 4
Suitability for inventory ..................................................................................................................... 5
Suitability for monitoring ................................................................................................................... 5
Skills ................................................................................................................................................ 5
Resources ....................................................................................................................................... 6
Minimum attributes .......................................................................................................................... 7
Data storage .................................................................................................................................... 8
Analysis, interpretation and reporting ............................................................................................... 9
Case study A ..................................................................................................................................10
Full details of technique and best practice ......................................................................................14
References and further reading ......................................................................................................19
Appendix A .....................................................................................................................................22
Appendix B .....................................................................................................................................23
Freshwater fish: passive nets—minnow traps
Version 1.0
DOCDM-997946 Freshwater fish: passive nets—minnow traps v1.0 2
Inventory and monitoring toolbox: freshwater fish
Synopsis
Minnow traps are small fish traps that typically consist of two funnel-shaped entrances at either end
of a mesh box or cylinder. The standard minnow trap design used for ecological data collection in
New Zealand is the Gee’s minnow trap. Minnow traps are a type of passive sampling gear because
they rely on fish to willingly encounter and enter the trap (Hubert 1996). They can be used to
sample freshwater fish in a wide range of environments including lakes, wetlands, rivers and
streams.
The efficiency and selectivity of minnow traps is influenced by the probability that fish will
encounter, enter and be retained within the trap until it is retrieved (Portt et al. 2006). The size of
fish captured in minnow traps is limited by the size of the entrances, which are typically very small
(20–30 mm). Minnow traps are considered to be the optimal method for sampling New Zealand
mudfish species (Ling et al. 2009). Minnow traps are known to be highly effective for capturing
small freshwater eels when baited (Chisnall 1996). The species and habitat decision trees in the
‘Introduction to monitoring freshwater fish’ (docdm-1008026) should be used to identify whether
minnow trapping is the appropriate method for sampling your species or communities of interest.
Unlike gill nets, most fish can be released alive after being captured in minnow traps and predation
within the traps is likely to be less than with fyke nets. Because of their small size, minnow traps
can also be set amongst complex habitat and in very small and shallow pools of water.
The capture efficiency of minnow traps is primarily influenced by the diameter of the trap entrances
and mesh size. Standardisation of sampling gear within a survey or monitoring programme is
important for obtaining relative abundance data that can be compared spatially and temporally. It is
recommended that Gee’s minnow traps be used for any minnow trap studies unless there are
compelling reasons to use another type of trap.
Minnow traps can be used for inventory surveys where the objective is to estimate taxa richness or
the presence/absence of fish species at a location. Because minnow traps are very selective for
small fish sizes it is recommended that minnow trapping be carried out in combination with fyke
netting when undertaking inventory surveys. Gill nets may also need to be used to sample habitats
where fyke nets will be less effective, such as extensive areas of deep, open water (see
‘Freshwater fish: passive nets—fyke nets’—docdm-997948).
Minnow traps can also be used to collect relative abundance data based on calculations of catch
per unit effort (CPUE). Minnow trap CPUE, as with other passive netting methods, is usually
expressed as number of fish caught per net per unit of time (e.g. hours or nights). The accuracy of
CPUE as an index of abundance is primarily determined by whether catch efficiency, or
‘catchability’, remains constant and unaffected by other factors (Hubert & Fabrizio 2007). Unvarying
catch efficiency is one of the key assumptions made when assessing differences in relative
abundance. In reality, however, a wide range of factors can influence catch efficiency when using
minnow nets. It is important to take a cautious approach and consider potential differences in catch
efficiency when comparing relative abundance data over time and space.
DOCDM-997946 Freshwater fish: passive nets—minnow traps v1.0 3
Inventory and monitoring toolbox: freshwater fish
Standardising net types and sampling protocols is critical for obtaining reliable relative abundance
data. Standardised national protocols for using a combination of fyke nets and Gee’s minnow traps
in New Zealand wadeable streams have been developed by Joy et al. (2013). It is recommended
that, where appropriate, those protocols be adopted by DOC staff when sampling stream
environments using minnow traps.
If you are targeting pest fish species, further guidance is provided in ‘Protocols for pest fish
inventory and monitoring best practice guidance’ (docdm-756153).
Assumptions
Where the data are used to determine presence/absence:
Methodology is standardised to account for variation in detection probability. It is important to
use a consistent and legitimate spatial sampling framework. That is, that the number of nets
used is large enough to capture the range of fish that are present in the area that is represented
by the sample.
Species of interest are truly absent from the sample area when none are detected. This
assumption will be violated when species are present but inactive or occur at densities that are
undetectable by minnow trap methods. For example, eel activity is very low at temperatures less
than about 10°C so minnow trap samples collected in winter may fail to detect these species.
Similarly, at very low densities fish may fail to encounter any minnow traps during the sampling
period and therefore evade capture and detection. Because of their small size, the height at
which minnow traps are set will also have a significant influence on the species caught. Because
minnow traps are species-selective, only those species known to be susceptible to capture
using this method should be considered as being sampled.
Where the data are used to compare relative abundances:
The relationship between number of individuals collected (index) and number of individuals
present (density) is linear. This is unlikely to be the case in many instances with passive netting
techniques because of their dependence on fish behaviour, which may be highly variable, and
the effects of gear saturation (Hubert & Fabrizio 2007).
Capture efficiency is independent of environmental conditions, fish species, population structure
and operator proficiency. These assumptions should be carefully considered when making
comparisons over time or between sites, as many of these factors are known to strongly
influence catch efficiency (Hubert 1996; Portt et al. 2006).
There is no movement into or out of the sample reach or any sub-reaches during sampling (i.e.
the population is demographically closed). This assumption is less likely to hold when traps are
set for longer periods of time, or when highly mobile species (e.g. īnanga or smelt) are being
sampled. The assumption is more likely to be valid for more sedentary species such as bullies
or mudfish.
DOCDM-997946 Freshwater fish: passive nets—minnow traps v1.0 4
Inventory and monitoring toolbox: freshwater fish
Advantages
Advantages of minnow traps:
They can be set in very small and shallow bodies of water.
They can easily be set in complex habitat types such as dense aquatic vegetation or amongst
coarse woody debris.
They can be set on steeply sloping and uneven substrates.
They are more portable than other passive netting techniques.
There is far less fish mortality and injury compared with gill nets and most fish can be released.
However, fish can become injured through abrasion against the trap entrances and side mesh.
Very small fish can also become wedged in the sides of coarse meshed traps.
Does not require a high level of technical expertise or specialist training (although the
experience of field staff will influence catch efficiency).
Mortality rates for captured fish are low if set properly. Predation may be an issue but large
predators will be excluded.
There is no risk to diving birds or other non-target organisms.
They are the most effective method for sampling adult New Zealand mudfish species, and are
also known to be effective for sampling juvenile eels (Chisnall 1996) and kōura, particularly
when baited.
Advantages of passive netting in general:
Sampling is relatively unaffected by turbidity or electrical conductivity which can limit the use of
methods like spotlighting or electrofishing.
Samples are taken continuously over a long time period. This has the advantage of dampening
the effects of any diurnal variations in fish behaviour (Hayes 1989).
It allows sampling in habitats that are not wadeable because water depth or sediment depth is
too great.
Does not require a high level of technical expertise or specialist training.
It causes less disturbance in shallow habitats than some active methods such as seining or
electrofishing.
Disadvantages
Disadvantages of minnow traps:
Catch variance can be high; however, this may simply reflect high spatial variability in the small
fish species that minnow traps target (Balcombe & Closs 2000).
They are highly selective for small fish, with maximum girth limited by the size of the cone-
shaped openings.
They can be species-selective (Layman & Smith 2001).
DOCDM-997946 Freshwater fish: passive nets—minnow traps v1.0 5
Inventory and monitoring toolbox: freshwater fish
Catches of some species can be affected by the presence of other species (He & Lodge 1990).
Disadvantages of passive netting in general:
It provides a less accurately defined unit of effort compared with active techniques because no
spatial measure is included (Hayes et al. 1996).
It is biased towards more active fish species. The more active a fish is the more likely it is to
encounter the net.
Catch rates and taxa richness can vary with time of day depending on diurnal patterns of fish
behaviour (Portt et al. 2006). This can be overcome by setting gear over a 24-hr period.
It requires a return trip to retrieve gear, which may increase the level of resources required to
collect data, particularly for remote sites.
Suitability for inventory
This method is appropriate for inventory:
In shallow wetland habitats
Where active fishing methods cannot be implemented or resourced (e.g. in non-wadeable,
turbid or structurally complex habitats)
When combined with other sampling methods, which overcome some of the species biases
inherent in Gee’s minnow trap samples. Minnow traps should be combined with fyke nets and
potentially also gill nets and/or boat electrofishing to ensure large-bodied fish species can be
detected.
Suitability for monitoring
This method is appropriate for monitoring:
Small-bodied fish species, especially cover-seeking benthic species
Where active fishing methods cannot be implemented or resourced (e.g. in non-wadeable,
turbid or structurally complex habitats)
Skills
Field operations
The setting of minnow traps does not require any specialist skills or training; however, it is
recommended that at least one team member has some prior experience with setting these types of
traps. A boat may be required to set minnow traps in deeper habitats. Appropriate training and
certification in the operation of boats will therefore be required (refer to the standard operating
procedure: ‘Boat competency SOP’—docdm-346005). Survey teams should contain at least one

DOCDM-997946 Freshwater fish: passive nets—minnow traps v1.0 6
Inventory and monitoring toolbox: freshwater fish
person able to identify freshwater fish to species level and who has experience in handling fish to
minimise any unnecessary injury or mortality and speed up fish processing.
Design and analysis
Staff involved in the development of survey programmes should be familiar with basic principles of
good sampling design. ‘A guideline to monitoring populations’ (docdm-870579) will assist with
understanding these principles. It is important that input from statisticians is obtained during both
the design and analysis stages to ensure that the data collected are scientifically robust. Good
statistical design is especially critical when developing monitoring programmes as they tend to be
complex and have high ongoing running costs. It is much harder to improve design after data
collection has started or been underway for some time than it is to put time into the initial planning.
Putting effort into designing a programme well at the outset ensures that the running costs are
justified and will result in useful information that meets the monitoring objectives.
The ability to use a spreadsheet software package such as Microsoft Excel is a minimum skill
required for data entry, data checking and analyses. The ability to use statistical software packages
is desirable but not mandatory provided support from statisticians is available. Staff involved in data
analysis must be conscious of the underlying assumptions of minnow trapping when undertaking
their analyses and cautious of the level of inference derived from any results.
Resources
Survey team. In most habitats minnow traps can easily be set by one person. Even when a boat
is required it is possible for the boat operator to set minnow traps single-handedly; however, for
safety reasons, a two-person team may be required. If significant numbers of fish are caught
then a second team member can speed up fish processing.
Minnow traps (and clips if using Gee’s minnow traps).
Personal flotation devices and any other boat safety equipment if a boat is being used.
Lengths of rope or cord to secure traps.
Flagging tape to mark the location of traps.
Buckets or fish bins. At least one bucket or bin is required for holding captured fish for
processing.
Aerator if captured fish are to be kept alive for long periods.
Measuring board (if fish are to be measured).
Voucher jars for fish samples / fin clips filled with 70% ethanol.
GPS unit.
Water quality field meter(s). As a minimum, water temperature should be recorded but dissolved
oxygen and pH are also useful parameters to measure.
Rain-proof data sheets with clipboard and pencils, including New Zealand Freshwater Fish
Database forms.
DOCDM-997946 Freshwater fish: passive nets—minnow traps v1.0 7
Inventory and monitoring toolbox: freshwater fish
Freshwater fish identification book, e.g. The Reed Field Guide to New Zealand Freshwater
Fishes (McDowall 2000).
Waders are optional but recommended where water temperatures are cold or where water
quality is poor. If waders are used then staff should be trained in wader safety; see ‘Wading
safely’ (olddm-566603) for guidance.1
No permits are required for survey work for DOC staff. Access permission may be required
depending on the location of the survey reach.
Minimum attributes
Consistent measurement and recording of these attributes is critical for the implementation of the
method. Other attributes may be optional depending on the survey or monitoring objective. For
more information refer to ‘Full details of technique and best practice’.
DOC staff must complete a ‘Standard inventory and monitoring project plan’ (docdm-146272).
The minimum requirements for a fish survey will largely be determined by the objectives of the
study or monitoring programme. Careful consideration of these objectives should be made prior to
collecting data. However, for any study the following minimum attributes should be recorded:
The name of the observers who collected the data.
The date and time of sampling (including time set and time retrieved).
The location of each sampling site using a GPS.
Trap type (including physical dimensions and mesh sizes).
Number of traps set at the site.
Water depth at the site.
Position of traps (i.e. surface, mid-water or benthic sets).
All fish collected should be identified to species level. If this cannot be done in the field then a
voucher sample may be collected and preserved, or a series of detailed photographs taken for
further assessment by a qualified expert. A fin clip preserved in ethanol may be taken for
mitochondrial analysis.
The number of each fish species captured.
Measurement of fish length is optional depending on whether information about population structure
is part of the survey objectives.
It is important to collect habitat data to describe factors that may influence catch efficiency and
therefore the key underlying assumptions of the method. There are a number of guidelines and
1 http://www.doc.govt.nz/Documents/parks-and-recreation/places-to-visit/tongariro-taupo/wade-safely-
brochure.pdf

DOCDM-997946 Freshwater fish: passive nets—minnow traps v1.0 8
Inventory and monitoring toolbox: freshwater fish
protocols available for collecting habitat data. A set of standard national guidelines has been
developed by Harding et al. (2009).2
Data storage
Data should be recorded on rain-proof field data sheets to ensure that they remain intact and
legible. Forward copies of completed survey sheets to the survey administrator, or enter data into
an appropriate spreadsheet as soon as possible. Collate, consolidate and securely store survey
information as soon as possible, and preferably immediately on return from the field. The key steps
here are data entry, storage and maintenance for later analysis, followed by copying and data
backup for security.
Summarise the results in a spreadsheet or equivalent. Arrange data as ‘column variables’, i.e.
arrange data from each field on the data sheet (date, time, location, net type, number caught,
identity, etc.) in columns, with each row representing the occasion on which a given survey site was
sampled. An example of a data entry template for fish data collected using passive netting methods
is provided in Appendix B.
If data storage is designed well at the outset, it will make the job of analysis and interpretation much
easier. Before storing data, check for missing information and errors, and ensure metadata are
recorded.
Summaries of all fish survey data should also be entered into the New Zealand Freshwater Fish
Database (NZFFD) administered by the National Institute of Water and Atmospheric Research
(NIWA). The NZFFD is an important national repository for presence/absence data and represents
a valuable resource for a range of different applications including research, impact assessments
and threatened species monitoring. As a minimum, site location, fishing method and species
collected should be recorded in the database forms. Data can be entered electronically using the
Freshwater Fish Database Assistant software, which is freely available from the NIWA website3.
Storage tools can be either manual or electronic systems (or both, preferably). They will usually be
summary sheets, other physical filing systems, or electronic spreadsheets and databases. Use
appropriate file formats such as .xls, .txt, .dbf or specific analysis software formats. Copy and/or
backup all data, whether electronic, data sheets, metadata or site access descriptions, preferably
offline if the primary storage location is part of a networked system. Store the copy at a separate
location for security purposes.
2 http://www.cawthron.org.nz/coastal-freshwater-resources/downloads/stream-habitat-assessment-
protocols.pdf 3 http://www.niwa.co.nz/our-services/databases/freshwater-fish-database
DOCDM-997946 Freshwater fish: passive nets—minnow traps v1.0 9
Inventory and monitoring toolbox: freshwater fish
Analysis, interpretation and reporting
Seek statistical advice from a biometrician or suitably experienced person prior to undertaking any
analysis. Statistical advice should preferably be sought during the design stage of any proposed
monitoring programme.
There are several texts available to assist with the analysis of fisheries data. Murphy & Willis (1996)
provides a useful introduction into most types of analyses but a more in-depth and up to date text is
provided by Guy & Brown (2007).
Datasets obtained from minnow trapping can be used to provide estimates of species diversity and
relative abundances. Species diversity can be easily expressed as the total number of species, or
taxa richness, recorded at a site. Because minnow trap catches are biased towards small fish
species, additional sampling methods capable of targeting larger species (e.g. fyke nets) should
also be used when undertaking inventory surveys.
The key variable that will be used to assess relative abundances is catch per unit effort (CPUE),
which provides an index of abundance rather than a measure of density. As with all passive netting
methods, fishing effort is measured in terms of soak time—the time period over which traps are set.
Catch per unit effort for minnow traps is usually expressed as the number of fish caught per trap per
night but different time periods can be used (e.g. hours).
When calculating CPUE the catch obtained from each trap should be recorded as individual sub-
samples. The mean (or median) CPUE and associated variance can then be calculated for each
sampling site. CPUE data tend not to be normally distributed so care should be taken with applying
parametric tests (Hubert & Fabrizio 2007). Some researchers recommend using the median rather
than the mean as a measure of central tendency for CPUE data (Hubert 1996; Hubert & Fabrizio
2007).
When calculating CPUE for passive capture gear it is important to be aware that soak time is not a
proportional measure of fishing effort. This is because catch efficiency is known to decline as more
and more fish are caught in a trap through a process called gear saturation. For entrapment type
nets, including minnow traps, escapement can also be an issue which affects capture efficiency
over time. Some fish species are better at escaping than others and trap saturation can also affect
rates of escapement (Portt et al. 2006; Hubert & Fabrizio 2007). This means that setting a net over
48 hours may produce a different catch rate to the same net set over two 24-hr periods. Direct
comparisons of CPUE data obtained using different soak times are therefore not recommended
unless the relationship between catch efficiency and soak time is well understood.
To use CPUE as an index of abundance it is assumed that there is a positive linear relationship
between CPUE and density. This relationship is known to be different for different species and
influenced by a wide range of factors including the diameter of the entrance and the mesh size of
the trap. All of these variables can influence the ability of CPUE to reflect the relative abundance of
species present at a site. It is therefore critical that minnow trap sampling be standardised by using
the same sampling design, sampling gear (e.g. trap types) and deployment procedures across the
DOCDM-997946 Freshwater fish: passive nets—minnow traps v1.0 10
Inventory and monitoring toolbox: freshwater fish
sites and time periods of interest. Traps tend to produce highly variable catch data and large
numbers of trap sets are often required to detect statistically significant differences (Portt et al.
2006).
When interpreting data obtained from minnow trap catches it is necessary to consider the method-
specific biases outlined in the ‘Disadvantages’ section. When using CPUE data as an index of
relative abundance the variables that can affect the relationship between CPUE and actual fish
density should always be considered. For example, care should be taken when comparing the
CPUE of two species caught at a site if one of those species is known to be more susceptible than
the other to capture in minnow traps. Ideally, the ability of CPUE to reflect actual fish density should
be validated before reaching any firm conclusions about observed differences in CPUE. Validation
would require fish density estimates to be made using mark-recapture or depletion model
approaches.
Depending on the objectives of the survey it may be useful to assess population structure using any
fish length data that has been collected. Length data is typically used to generate length-frequency
histograms, which allow the structure of a fish population to be assessed. Length-frequency
histograms can provide an insight into factors that may be affecting fish population dynamics, such
as high mortality or recruitment failure (Anderson & Neumann 1996). When interpreting length-
frequency histograms it is important to consider potential size biases in sampling and whether
sample size is adequate. Many statisticians now recommend density plots as an alternative to
histograms because the selection of length category boundaries (i.e. minimum and maximum
values) can have a large influence on the appearance of histograms.
Survey results should be reported on in a timely manner to ensure that they are available for future
users. Extending the time between data collection and reporting increases the potential for useful
information gathered during sampling to be forgotten and lost. A description of the trap types and
number of traps used should be included in the report so the survey can be replicated at a future
date.
Case study A
Case study A: monitoring Northland mudfish
Synopsis
Ngāwhā Wetland is a small peat bog wetland located near Kerikeri in Northland. Ngāwhā is one of
only a handful of wetlands that support Northland mudfish (Neochanna heleios), which has a
conservation status of ‘Nationally Vulnerable’ (Allibone et al. 2010). The population of Northland
mudfish in Ngāwhā has been monitored annually since 2000 (Macdonald 2008). In late November,
2008, a fire swept through part of Ngāwhā Wetland. The fire affected three of the annual monitoring
sites and provided an opportunity to study the response of a mudfish population to the effects of fire
events.
DOCDM-997946 Freshwater fish: passive nets—minnow traps v1.0 11
Inventory and monitoring toolbox: freshwater fish
Objectives
Undertake annual monitoring of key mudfish populations under Action 2.2 of the New Zealand
Mudfish Recovery Plan 2003–2013 (DOC 2003).
Assess the effects of the 2008 fire on mudfish populations in Ngāwhā Wetland.
Sampling design and methods
Eight monitoring sites were established in 2000 along a transect that crossed the DOC-
administered portion of the wetland. Within each site 10–15 permanent trap locations were
established.
Data collection
Each year a single Gee’s minnow trap (3 mm) was set at each of the trap locations during the
month of August. Traps were set overnight and retrieved the next day. Each trap was processed
individually (as a sub-sample) and all Northland mudfish collected were counted and had their
length measured.
Results
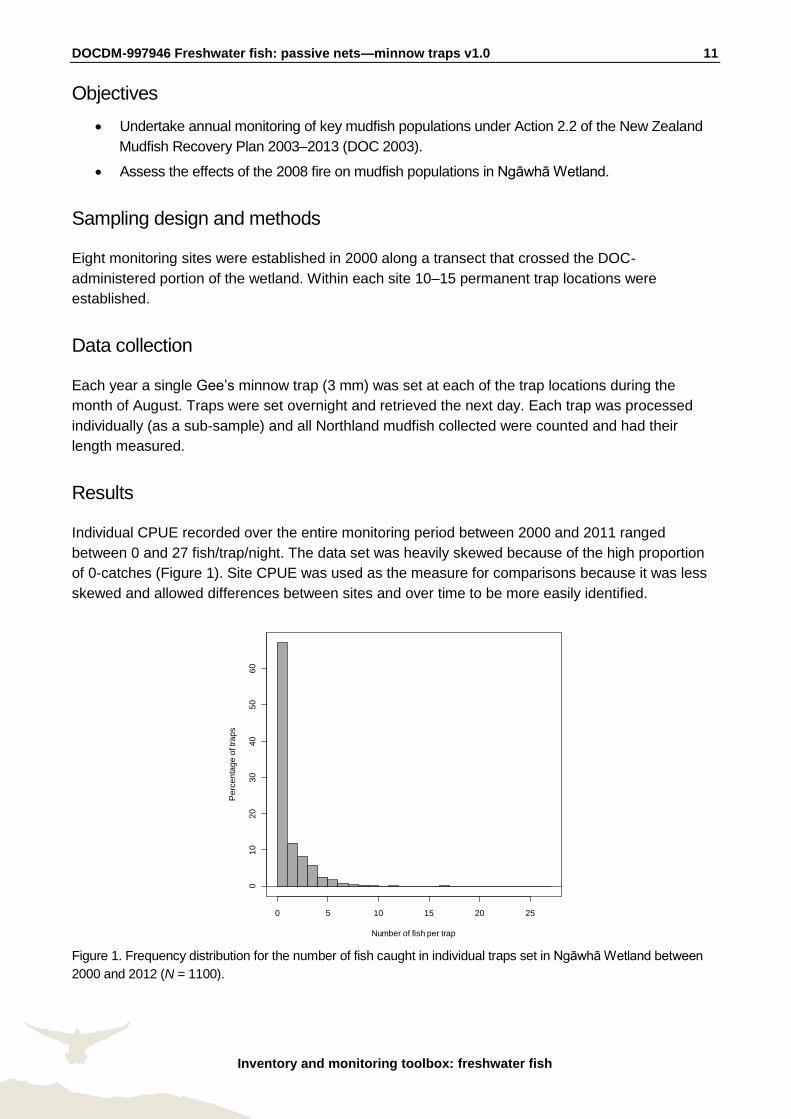
Individual CPUE recorded over the entire monitoring period between 2000 and 2011 ranged
between 0 and 27 fish/trap/night. The data set was heavily skewed because of the high proportion
of 0-catches (Figure 1). Site CPUE was used as the measure for comparisons because it was less
skewed and allowed differences between sites and over time to be more easily identified.
Number of fish per trap
Pe
rce
nta
ge
of tr
ap
s
0 5 10 15 20 25
01
02
03
04
05
06
0
Figure 1. Frequency distribution for the number of fish caught in individual traps set in Ngāwhā Wetland between
2000 and 2012 (N = 1100).
DOCDM-997946 Freshwater fish: passive nets—minnow traps v1.0 12
Inventory and monitoring toolbox: freshwater fish
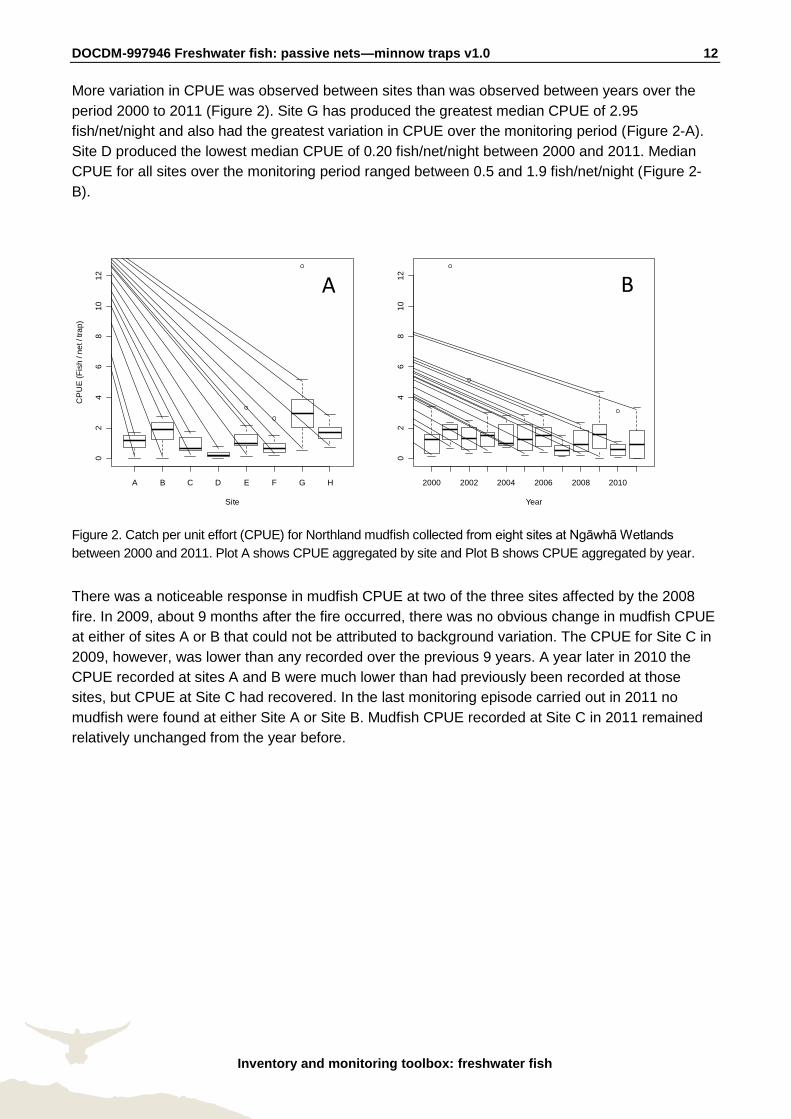
More variation in CPUE was observed between sites than was observed between years over the
period 2000 to 2011 (Figure 2). Site G has produced the greatest median CPUE of 2.95
fish/net/night and also had the greatest variation in CPUE over the monitoring period (Figure 2-A).
Site D produced the lowest median CPUE of 0.20 fish/net/night between 2000 and 2011. Median
CPUE for all sites over the monitoring period ranged between 0.5 and 1.9 fish/net/night (Figure 2-
B).
Figure 2. Catch per unit effort (CPUE) for Northland mudfish collected from eight sites at Ngāwhā Wetlands
between 2000 and 2011. Plot A shows CPUE aggregated by site and Plot B shows CPUE aggregated by year.
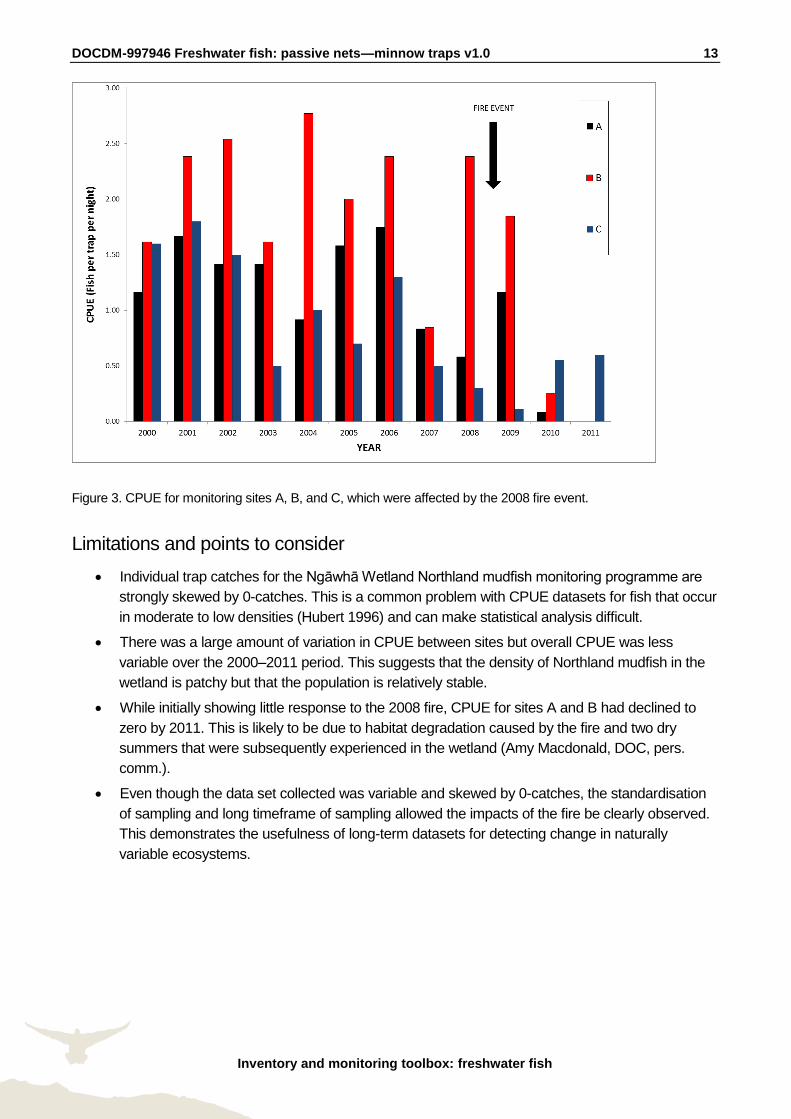
There was a noticeable response in mudfish CPUE at two of the three sites affected by the 2008
fire. In 2009, about 9 months after the fire occurred, there was no obvious change in mudfish CPUE
at either of sites A or B that could not be attributed to background variation. The CPUE for Site C in
2009, however, was lower than any recorded over the previous 9 years. A year later in 2010 the
CPUE recorded at sites A and B were much lower than had previously been recorded at those
sites, but CPUE at Site C had recovered. In the last monitoring episode carried out in 2011 no
mudfish were found at either Site A or Site B. Mudfish CPUE recorded at Site C in 2011 remained
relatively unchanged from the year before.
A B C D E F G H
02
46
81
01
2
Site
CP
UE
(F
ish
/ n
et / tr
ap
)
2000 2002 2004 2006 2008 2010
02
46
81
01
2
Year
A B
DOCDM-997946 Freshwater fish: passive nets—minnow traps v1.0 13
Inventory and monitoring toolbox: freshwater fish
Figure 3. CPUE for monitoring sites A, B, and C, which were affected by the 2008 fire event.
Limitations and points to consider
Individual trap catches for the Ngāwhā Wetland Northland mudfish monitoring programme are
strongly skewed by 0-catches. This is a common problem with CPUE datasets for fish that occur
in moderate to low densities (Hubert 1996) and can make statistical analysis difficult.
There was a large amount of variation in CPUE between sites but overall CPUE was less
variable over the 2000–2011 period. This suggests that the density of Northland mudfish in the
wetland is patchy but that the population is relatively stable.
While initially showing little response to the 2008 fire, CPUE for sites A and B had declined to
zero by 2011. This is likely to be due to habitat degradation caused by the fire and two dry
summers that were subsequently experienced in the wetland (Amy Macdonald, DOC, pers.
comm.).
Even though the data set collected was variable and skewed by 0-catches, the standardisation
of sampling and long timeframe of sampling allowed the impacts of the fire be clearly observed.
This demonstrates the usefulness of long-term datasets for detecting change in naturally
variable ecosystems.
DOCDM-997946 Freshwater fish: passive nets—minnow traps v1.0 14
Inventory and monitoring toolbox: freshwater fish
References for case study A
Allibone, R.M.; David, B.; Hitchmough, R.; Jellyman, D.; Ling, N.; Ravenscroft, P.; Waters, J. 2010:
Conservation status of New Zealand freshwater fish, 2009. New Zealand Journal of Marine and
Freshwater Research 44: 271–287.
DOC (Department of Conservation). 2003: New Zealand mudfish (Neochanna spp.) recovery plan
2003–13. Biodiversity Recovery Unit, Department of Conservation, Wellington.
Hubert, W.A. 1996: Passive capture techniques. In Murphy, B.R.; Willis, D.W. (Eds): Fisheries
techniques. 2nd edition. American Fisheries Society, Bethesda, Maryland.
Macdonald, A. 2008. Northland mudfish monitoring at Ngawha Wetlands, 2008. Northland
Conservancy, Department of Conservation (docdm-400292).
Acknowledgements
This case study is based on monitoring data collected by a number of staff and contractors working
for DOC Northland Conservancy. The author would specifically like to acknowledge the work of
Amy Macdonald, Bruno David, Mike McGlynn, Michael Pingram, Steve McManus, and Fiona
Watson.
Full details of technique and best practice
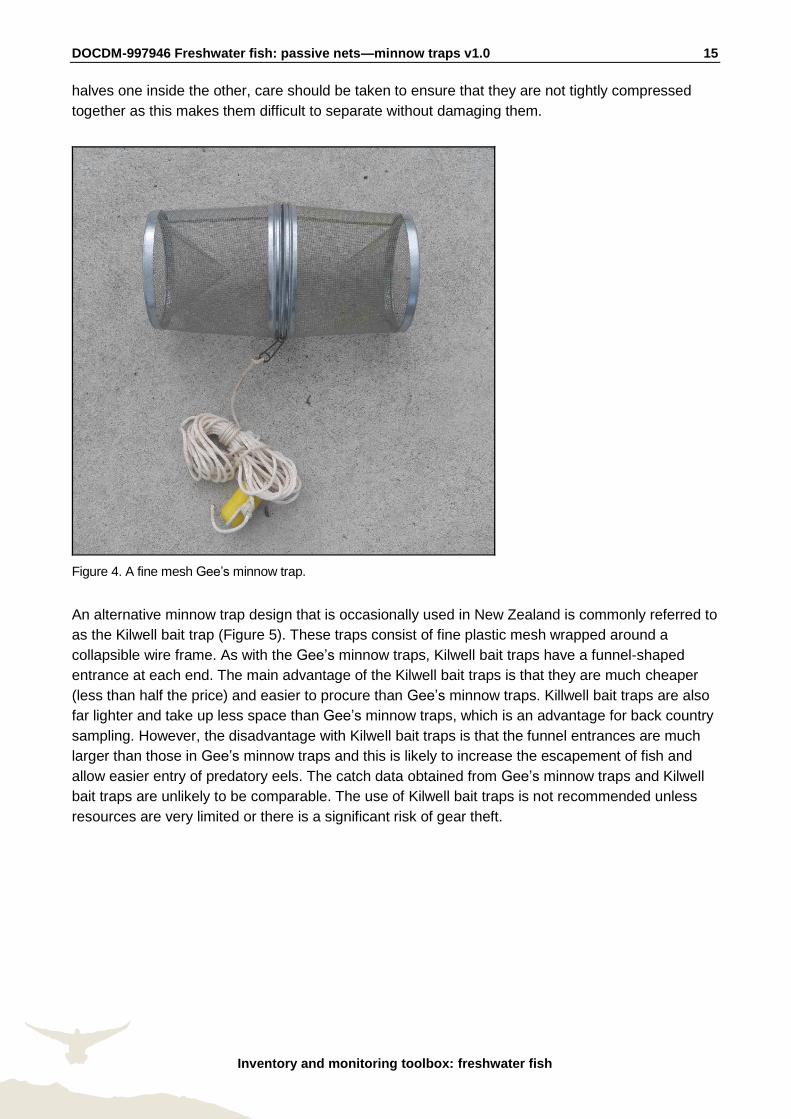
Minnow traps typically consist of a small cylindrical or rectangular box with inward facing funnel
shaped entrances at each end (Figure 4). The shape of the entrances allow the small fish to easily
enter the trap but make it more difficult for them to exit through the same hole. Whilst fish can, and
do, escape these traps, the higher rate of fish entering them tends to result in a net accumulation of
fish within the trap. Fish entering Gee’s minnow traps sometimes scrape themselves on the steel
wire entrances; some surveyors bend back the steel mesh ends and/or add silicon to reduce injury.
Gee’s minnow traps are the standard type of minnow trap used for freshwater ecological studies in
New Zealand (Figure 4). They are constructed out of galvanised steel and consist of two halves that
are joined together using a special clip. The standard Gee’s minnow trap is made from a 6 mm
mesh but 3 mm mesh Gee’s minnow traps are used to sample New Zealand mudfish species
because they can capture smaller and more fish (Ling et al. 2009). It is recommended that 3 mm
Gee’s minnow traps be used for all freshwater fish surveys for this same reason.
While Gee’s minnow traps appear relatively robust they will corrode out over time, particularly if set
in saline or low pH habitats. The mesh is also prone to separating from the end rings—a process
that will eventually cause the traps to lose their rigidity. The 3 mm mesh traps have to be imported
into New Zealand which means that they are relatively expensive to procure. It is therefore
important that these traps are treated carefully when being used, and cleaned and dried properly on
the completion of sampling. While Gee’s minnow traps are designed to be stored by stacking trap
DOCDM-997946 Freshwater fish: passive nets—minnow traps v1.0 15
Inventory and monitoring toolbox: freshwater fish
halves one inside the other, care should be taken to ensure that they are not tightly compressed
together as this makes them difficult to separate without damaging them.
Figure 4. A fine mesh Gee’s minnow trap.
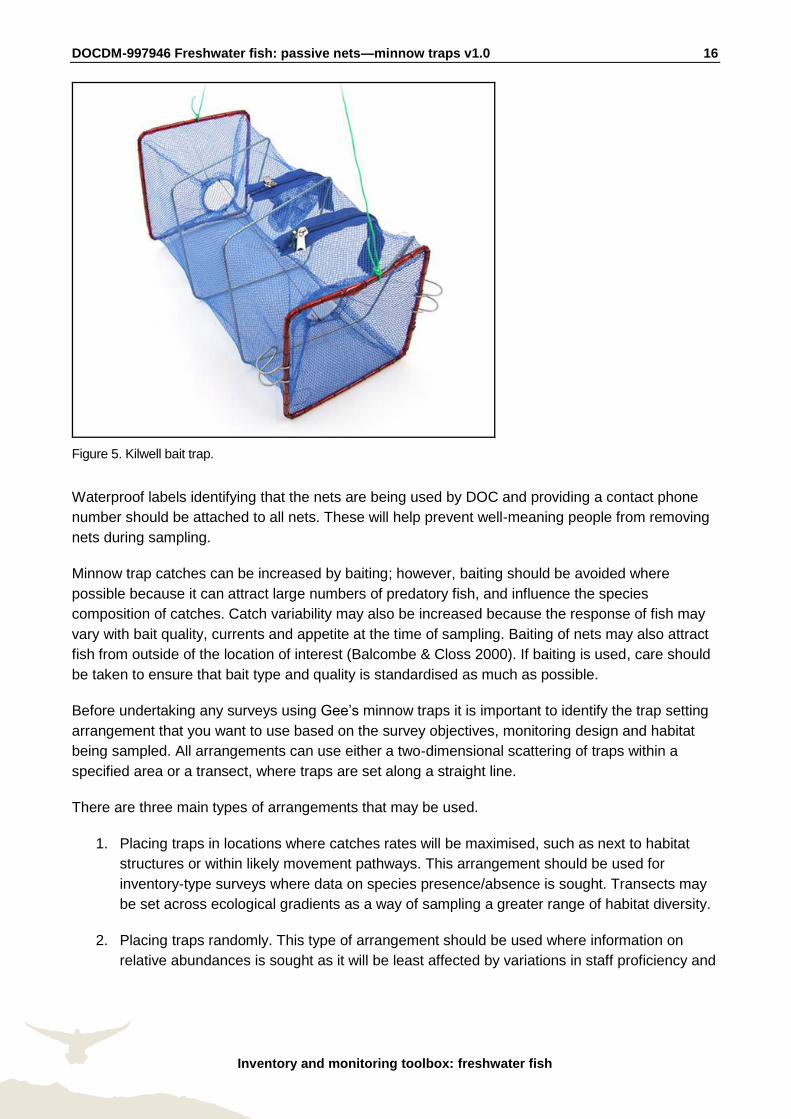
An alternative minnow trap design that is occasionally used in New Zealand is commonly referred to
as the Kilwell bait trap (Figure 5). These traps consist of fine plastic mesh wrapped around a
collapsible wire frame. As with the Gee’s minnow traps, Kilwell bait traps have a funnel-shaped
entrance at each end. The main advantage of the Kilwell bait traps is that they are much cheaper
(less than half the price) and easier to procure than Gee’s minnow traps. Killwell bait traps are also
far lighter and take up less space than Gee’s minnow traps, which is an advantage for back country
sampling. However, the disadvantage with Kilwell bait traps is that the funnel entrances are much
larger than those in Gee’s minnow traps and this is likely to increase the escapement of fish and
allow easier entry of predatory eels. The catch data obtained from Gee’s minnow traps and Kilwell
bait traps are unlikely to be comparable. The use of Kilwell bait traps is not recommended unless
resources are very limited or there is a significant risk of gear theft.
DOCDM-997946 Freshwater fish: passive nets—minnow traps v1.0 16
Inventory and monitoring toolbox: freshwater fish
Figure 5. Kilwell bait trap.
Waterproof labels identifying that the nets are being used by DOC and providing a contact phone
number should be attached to all nets. These will help prevent well-meaning people from removing
nets during sampling.
Minnow trap catches can be increased by baiting; however, baiting should be avoided where
possible because it can attract large numbers of predatory fish, and influence the species
composition of catches. Catch variability may also be increased because the response of fish may
vary with bait quality, currents and appetite at the time of sampling. Baiting of nets may also attract
fish from outside of the location of interest (Balcombe & Closs 2000). If baiting is used, care should
be taken to ensure that bait type and quality is standardised as much as possible.
Before undertaking any surveys using Gee’s minnow traps it is important to identify the trap setting
arrangement that you want to use based on the survey objectives, monitoring design and habitat
being sampled. All arrangements can use either a two-dimensional scattering of traps within a
specified area or a transect, where traps are set along a straight line.
There are three main types of arrangements that may be used.
1. Placing traps in locations where catches rates will be maximised, such as next to habitat
structures or within likely movement pathways. This arrangement should be used for
inventory-type surveys where data on species presence/absence is sought. Transects may
be set across ecological gradients as a way of sampling a greater range of habitat diversity.
2. Placing traps randomly. This type of arrangement should be used where information on
relative abundances is sought as it will be least affected by variations in staff proficiency and
DOCDM-997946 Freshwater fish: passive nets—minnow traps v1.0 17
Inventory and monitoring toolbox: freshwater fish
habitat. If set along transects, these should not cross ecological gradients (e.g. hydrological
gradients in wetlands) as this will increase trap catch variance.
3. Placing traps in exactly the same locations as previous surveys. This has been done for
mudfish surveys where there is a concern about damage to fragile wetland habitats or
where there is a desire to keep catch efficiencies as constant as possible over time. Trap
locations will need to be permanently marked when using this arrangement.
For all of these arrangements, thought should also be given to whether minnow traps will be set at
the surface (surface-set) or on the bottom (benthic-set). The depth at which traps are set can have
a large influence on the catch rates observed for different species. Black mudfish catch rates, for
example, are greatest when traps are set at the surface (McDonald 2006).
The recommended steps for deploying minnow traps are as follows:
1. Assemble the traps and attach the anchor ropes.
2. Place the minnow traps around the sampling site according to the trap setting arrangement
selected prior to undertaking the surveys. A minimum of ten traps should be deployed at
each site unless habitat is limiting. Have a minimum trap spacing of at least 3 metres to
maintain a level of sample independence.
3. Ensure that traps are placed in water that is at least deep enough to cover the trap
entrances. It is usually possible to bury minnow traps into the substrate to achieve this in
very shallow habitats. In low-oxygen habitats (e.g. wetlands and macrophyte-dominated
streams), ensure that traps are set with an air gap at the top.
4. Attach the anchor ropes to a stake, anchor weight, peg or stout marginal vegetation if
available. Mark the locations of traps using flagging tape unless they are clearly visible or
there is a significant theft risk. Any lost traps will continue to fish until they eventually break
down and will therefore potentially result in the death of large numbers of fish.
5. Leave the traps in place over the duration of the required sampling period. Capture rates will
be maximised by setting traps overnight to include both the dusk and dawn periods when
fish movement is greatest. Setting traps for longer will not necessarily increase catch rates
due to gear saturation, predation and escapement effects but may increase injury and
mortality rates.
6. Retrieve the traps and process the catch by recording the number of species and any other
variables of interest (e.g. length) separately for each trap. Recording these data separately
allows more flexibility at the data analysis stage.
7. Measure and record all of the habitat parameters that are relevant to the survey. The
minimum parameters that should be recorded are outlined in ‘Minimum attributes’.
Recommended parameters are outlined in more detail in the sections below.
8. Double-check that all traps have been retrieved.

DOCDM-997946 Freshwater fish: passive nets—minnow traps v1.0 18
Inventory and monitoring toolbox: freshwater fish
9. Decontaminate all sampling gear to prevent the spread of pest species. Useful guidance can
be found in ‘Freshwater fishing net decontamination protocol’ (docdm-428359), ‘Review of
weed transfer risk associated with mudfish sampling and mitigation strategies’ (docdm-
645392), and on the Ministry for Primary Industries website4.
Considerations when setting minnow traps in lakes:
If traps are being set off-shore then long anchor ropes and large visible floats will need to be
used. One option may be to attach individual traps at intervals along a single rope; however, this
is not recommended for uneven lake beds with many potential snags.
Water depth and distance from shore will be the two key ecological gradients to consider when
selecting sampling sites and transect orientation.
Habitat variables that should be recorded in conjunction with minnow trap catches include:
— Water depth
— Water temperature
— Dissolved oxygen concentrations (preferably at surface and 1 m off bottom)
— Habitat description including presence of any macrophytes or other structure and type of
substrate nets were set on
Considerations when setting minnow traps in rivers and streams:
Standardised protocols for sampling using a combination of Gee’s minnow traps and fyke nets
are currently being developed for New Zealand wadeable streams (Joy et al. 2013). It is
recommended that these protocols be adopted for any future stream surveys carried out by
DOC staff. The advantage of using standardised protocols is that they will provide data that can
be more directly compared regionally and nationally. This in turn allows the development of
large, long-term datasets with a much greater ability to detect patterns against the high
background variability normally associated with fisheries data (Bonar et al. 2009). Finally,
standardisation encourages data sharing between organisations and creates synergies between
different monitoring programmes (Bonar et al. 2009).
It can be difficult to effectively set minnow traps in high-velocity habitats because of issues
around securing them in place and deformation of the traps (Portt et al. 2006). Traps will
therefore need to be set in slow to medium velocities and this will need to be considered when
interpreting catch data.
National protocols for assessing habitat in wadeable streams have been developed by Harding
et al. (2009) and most regional councils will have appropriate standardised methods that could
be adopted. Note that many of these methods won’t be applicable to large non-wadeable
streams and rivers. Habitat variables that should be recorded as part of minnow trap surveys in
rivers and streams are:
— Temperature, dissolved oxygen and pH (including time of day measurement was made)
— Average stream width and depth
— Substrate composition
4 http://www.biosecurity.govt.nz/pests/didymo/cleaning

DOCDM-997946 Freshwater fish: passive nets—minnow traps v1.0 19
Inventory and monitoring toolbox: freshwater fish
— Meso-habitat composition
— Riparian cover and condition.
— Aquatic macrophyte cover (a useful method has been developed by Collier et al. 2006).
— Qualitative habitat assessments (e.g. P1 and P2d field sheets from Harding et al. 2009).
Considerations when setting minnow traps in wetlands:
Minnow traps have been used extensively for sampling New Zealand mudfish species in
wetland habitats. Specific protocols for the survey and monitoring of New Zealand mudfish have
already been developed by Ling et al. (2009) and should be adopted by DOC staff for use in
wetland fish surveys for these species (see ‘A revised methodology to survey and monitor New
Zealand mudfish’—docdm-1203418).
Habitat variables that should be recorded in conjunction with minnow trap catches include:
— Water depth
— Water temperature
— pH
— Dissolved oxygen concentrations (preferably at surface and 1 m off bottom)
— Habitat description including presence of any macrophytes or other structure and type of
substrate nets were set on
References and further reading
Allibone, R.M.; David, B.; Hitchmough, R.; Jellyman, D.; Ling, N.; Ravenscroft, P.; Waters, J. 2010:
Conservation status of New Zealand freshwater fish, 2009. New Zealand Journal of Marine and
Freshwater Research 44: 271–287.
Anderson, R.O.; Neumann, R.M. 1996: Length, weight, and associated structural indices. In Murphy,
B.R.; Willis, D.W. (Eds): Fisheries techniques. 2nd edition. American Fisheries Society,
Bethesda, Maryland.
Balcombe, S.R.; Closs, G.P. 2000: Variation in carp gudgeon (Hypseleotris spp.)—catch rate in dense
macrophytes. Journal of Freshwater Ecology 15: 389–395.
Bonar, S.A.; Contreras-Balderas, S.; Iles, A.C. 2009: Chapter 1: An introduction to standardized
sampling. In: Bonar, S.A.; Hubert, W.A.; Willis, D.W. (Eds): Standard methods for sampling
North American freshwater fishes. American Fisheries Society, Bethesda, Maryland, USA.
Chisnall, B.L. 1996: Habitat associations of juvenile shortfinned eels (Anguilla australis) in shallow Lake
Waahi, New Zealand. New Zealand Journal of Marine and Freshwater Research 30: 233–237.
Collier, K.J.; Kelly, J.; Champion, P. 2006: Regional guidelines for ecological assessments of freshwater
environments: aquatic plant cover in wadeable streams. Environment Waikato Technical Report
2006/47.

DOCDM-997946 Freshwater fish: passive nets—minnow traps v1.0 20
Inventory and monitoring toolbox: freshwater fish
de Winton, M.D.; Bodmin, K.; Champion, P. 2010: Review of weed transfer risk associated with mudfish
sampling and mitigation strategies. Report prepared for the Department of Conservation by the
National Institute of Water and Atmospheric Research.
DOC (Department of Conservation). 2003: New Zealand mudfish (Neochanna spp.) recovery plan
2003–13. Biodiversity Recovery Unit, Department of Conservation, Wellington.
Guy, C.S.; Brown, M.L. (Eds). 2007: Analysis and interpretation of freshwater fisheries data. American
Fisheries Society, Bethesda, Maryland.
Harding, J.S.; Clapcott, J.E.; Quinn, J.M.; Hayes, J.W.; Joy, M.K.; Storey, R.G.; Greig, H.S.; Hay, J.;
James, T.; Beech, M.A.; Ozane, R.; Meredith, A.S.; Boothroyd, I.K.G. 2009: Stream habitat
assessment protocols for wadeable rivers and streams of New Zealand. School of Biological
Sciences, University of Canterbury, Christchurch. http://www.cawthron.org.nz/coastal-
freshwater-resources/downloads/stream-habitat-assessment-protocols.pdf
Hayes, D.B.; Ferreri, C.P.; Taylor, W.W. 1996: Active fish capture methods. In Murphy, B.R.; Willis,
D.W. (Eds): Fisheries techniques. 2nd edition. American Fisheries Society, Bethesda, Maryland.
Hayes, J.W. 1989: Comparison between a fine mesh trap net and five other fishing gears for sampling
shallow-lake fish communities. New Zealand Journal of Marine and Freshwater Research 23:
321–324.
He, X.; Lodge, D.M. 1990: Using minnow traps to estimate fish population size: the importance of spatial
distribution and relative species abundance. Hydrobiologia 190: 9–14.
Hubert, W.A. 1996: Passive capture techniques. In Murphy, B.R.; Willis, D.W (Eds): Fisheries
techniques. 2nd edition. American Fisheries Society, Bethesda, Maryland.
Hubert, W.A.; Fabrizio, M.C. 2007: Relative abundance and catch per unit effort. In Guy, C.S.; Brown,
M.L. (Eds): Analysis and interpretation of freshwater fisheries data. American Fisheries Society,
Bethesda, Maryland.
Joy, M.; David, B; Lake, M. 2013: New Zealand freshwater fish sampling protocols: part 1—wadeable
rivers and streams. Massey University, Palmerston North..
Layman, C.; Smith, D. 2001: Sampling bias of minnow traps in shallow aquatic habitats on the Eastern
Shore of Virginia. Wetlands 21, 145–154.
Ling, N.; O’Brien, L.; Miller, R.; Lake, M. 2009: Methodology to survey and monitor New Zealand
mudfish species. Report prepared for the Department of Conservation (docdm-452382).
Macdonald, A. 2008: Northland mudfish monitoring at Ngawha Wetlands, 2008. Northland
Conservancy, Department of Conservation (docdm-400292).
McDonald, A. 2006: Improving the success of a translocation of black mudfish (Neochanna diversus).
University of Waikato, Hamilton, New Zealand.

DOCDM-997946 Freshwater fish: passive nets—minnow traps v1.0 21
Inventory and monitoring toolbox: freshwater fish
McDowall, R.M. 2000: The Reed field guide to New Zealand freshwater fishes. Reed Books, Auckland.
Murphy, B.R.; Willis, D.W. (Eds). 1996: Fisheries techniques. 2nd edition. American Fisheries Society,
Bethesda, Maryland.
Portt, C.B.; Coker, G.A.; Ming, D.L.; Randall, R.G. 2006: A review of fish sampling methods commonly
used in Canadian freshwater habitats. Canadian Technical Report of Fisheries and Aquatic
Sciences 2604.

DOCDM-997946 Freshwater fish: passive nets—minnow traps v1.0 22
Inventory and monitoring toolbox: freshwater fish
Appendix A
The following Department of Conservation documents are referred to in this method:
docdm-346005 Boat competency SOP
docdm-997948 Freshwater fish: passive nets—fyke nets
docdm-428359 Freshwater fishing net decontamination protocol
docdm-870579 A guideline to monitoring populations
docdm-1008026 Introduction to monitoring freshwater fish
docdm-756153 Protocols for pest fish inventory and monitoring best practice guidance
docdm-645392 Review of weed transfer risk associated with mudfish sampling and
mitigation strategies
docdm-1203418 A revised methodology to survey and monitor New Zealand mudfish
docdm-146272 Standard inventory and monitoring project plan
olddm-566603 Wading safely

DOCDM-997946 Freshwater fish: passive nets—minnow traps v1.0 23
Inventory and monitoring toolbox: freshwater fish
Appendix B
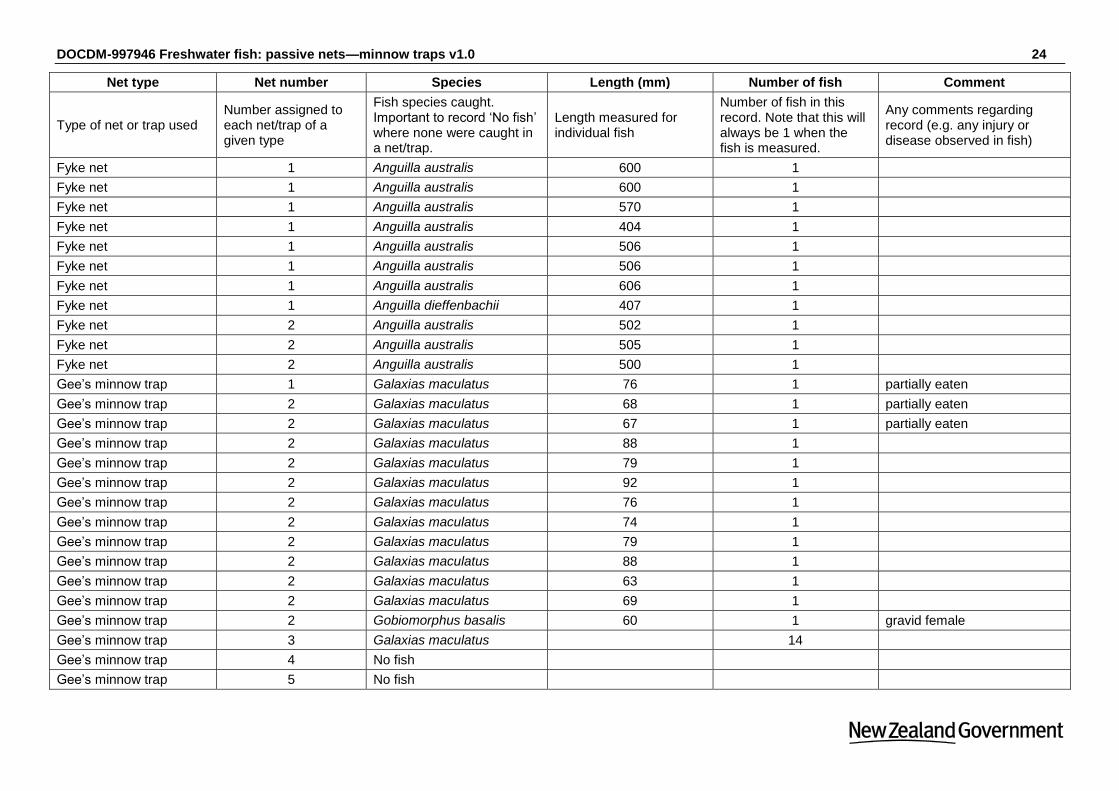
Data entry template for passive netting methods
This is an example of how to enter fish data collected using passive netting methods. This data
entry template uses a ‘long format’ where individual records are entered in rows and variables are
entered in columns. While this format can be more time consuming than other formats when
entering data, it will save a lot of time and effort when it comes to data analysis. Multiple analyses
can be quickly carried out using this one dataset thereby avoiding the need to re-enter the same
data. This dataset format can be readily manipulated and summarised using filter, sort and pivot
table tools found in Microsoft Excel. Most statistical software packages require that data be entered
in ‘long format’.
DOCDM-997946 Freshwater fish: passive nets—minnow traps v1.0 24
Net type Net number Species Length (mm) Number of fish Comment
Type of net or trap used Number assigned to each net/trap of a given type
Fish species caught. Important to record ‘No fish’ where none were caught in a net/trap.
Length measured for individual fish
Number of fish in this record. Note that this will always be 1 when the fish is measured.
Any comments regarding record (e.g. any injury or disease observed in fish)
Fyke net 1 Anguilla australis 600 1
Fyke net 1 Anguilla australis 600 1
Fyke net 1 Anguilla australis 570 1
Fyke net 1 Anguilla australis 404 1
Fyke net 1 Anguilla australis 506 1
Fyke net 1 Anguilla australis 506 1
Fyke net 1 Anguilla australis 606 1
Fyke net 1 Anguilla dieffenbachii 407 1
Fyke net 2 Anguilla australis 502 1
Fyke net 2 Anguilla australis 505 1
Fyke net 2 Anguilla australis 500 1
Gee’s minnow trap 1 Galaxias maculatus 76 1 partially eaten
Gee’s minnow trap 2 Galaxias maculatus 68 1 partially eaten
Gee’s minnow trap 2 Galaxias maculatus 67 1 partially eaten
Gee’s minnow trap 2 Galaxias maculatus 88 1
Gee’s minnow trap 2 Galaxias maculatus 79 1
Gee’s minnow trap 2 Galaxias maculatus 92 1
Gee’s minnow trap 2 Galaxias maculatus 76 1
Gee’s minnow trap 2 Galaxias maculatus 74 1
Gee’s minnow trap 2 Galaxias maculatus 79 1
Gee’s minnow trap 2 Galaxias maculatus 88 1
Gee’s minnow trap 2 Galaxias maculatus 63 1
Gee’s minnow trap 2 Galaxias maculatus 69 1
Gee’s minnow trap 2 Gobiomorphus basalis 60 1 gravid female
Gee’s minnow trap 3 Galaxias maculatus 14
Gee’s minnow trap 4 No fish
Gee’s minnow trap 5 No fish