Riding against the wind: a review of competition cycling aerodynamics · INVITED PAPER Riding...
30
INVITED PAPER Riding against the wind: a review of competition cycling aerodynamics Timothy N. Crouch 1 • David Burton 1 • Zach A. LaBry 2 • Kim B. Blair 3 Published online: 4 May 2017 Ó The Author(s) 2017. This article is an open access publication Abstract Aerodynamics has such a profound impact on cycling performance at the elite level that it has infiltrated almost every aspect of the sport from riding position and styles, equipment design and selection, race tactics and training regimes, governing rules and regulations to even the design of new velodromes. This paper presents a review of the aspects of aerodynamics that are critical to under- standing flows around cyclists under racing conditions, and the methods used to evaluate and improve aerodynamic performance at the elite level. The fundamental flow phy- sics of bluff body aerodynamics and the mechanisms by which the aerodynamic forces are imparted on cyclists are described. Both experimental and numerical techniques used to investigate cycling aerodynamic performance and the constraints on implementing aerodynamic saving measures at the elite level are also discussed. The review reveals that the nature of cycling flow fields are complex and multi-faceted as a result of the highly three-dimen- sional and variable geometry of the human form, the unsteady racing environment flow field, and the non-linear interactions that are inherent to all cycling flows. Current findings in this field have and will continue to evolve the sport of elite cycling while also posing a multitude of potentially fruitful areas of research for further gains in cycling performance. Keywords Aerodynamics Bluff body Sports Cycling Wind tunnel CFD 1 Introduction This year, elite cyclists from all around the world will have gathered to compete in one of cycling’s greatest road races, the Tour de France. In a quiet moment, these athletes may reflect on their journey to Paris. For all, this journey will have required years of intense coaching, training and sac- rifice, and for many cyclists this will have included hours in a wind tunnel searching for the optimal aerodynamic position and racing strategy. The clothes that the athletes will wear, the equipment the teams select, and the bicycles they ride will all have been developed with aerodynamics front of mind. The athletes will know that the difference between a podium and a respectable finish may be holding their form and position through the pain barrier, as to break form will increase the aerodynamic loads they must fight to overcome—at which point they will be riding against the wind. In this review paper, we aim to explain the current understanding of the aerodynamics of competitive track and road cycling and identify areas where further research is required. It is clear that aerodynamic performance can be as fundamental to success as power production. However, the application of the aerodynamics principles presented is not limited to competition. Today, cycling is an important & Timothy N. Crouch [email protected] David Burton [email protected] Zach A. LaBry [email protected] Kim B. Blair [email protected] 1 Department of Mechanical Engineering, Monash University, Clayton, VIC 3800, Australia 2 ATA Engineering, Inc., El Segundo, CA 90245, USA 3 Massachusetts Institute of Technology and STI&E Consulting, Cambridge, MA, USA Sports Eng (2017) 20:81–110 DOI 10.1007/s12283-017-0234-1
Transcript of Riding against the wind: a review of competition cycling aerodynamics · INVITED PAPER Riding...
INVITED PAPER
Riding against the wind: a review of competition cyclingaerodynamics
Timothy N. Crouch1 • David Burton1 • Zach A. LaBry2 • Kim B. Blair3
Published online: 4 May 2017
� The Author(s) 2017. This article is an open access publication
Abstract Aerodynamics has such a profound impact on
cycling performance at the elite level that it has infiltrated
almost every aspect of the sport from riding position and
styles, equipment design and selection, race tactics and
training regimes, governing rules and regulations to even
the design of new velodromes. This paper presents a review
of the aspects of aerodynamics that are critical to under-
standing flows around cyclists under racing conditions, and
the methods used to evaluate and improve aerodynamic
performance at the elite level. The fundamental flow phy-
sics of bluff body aerodynamics and the mechanisms by
which the aerodynamic forces are imparted on cyclists are
described. Both experimental and numerical techniques
used to investigate cycling aerodynamic performance and
the constraints on implementing aerodynamic saving
measures at the elite level are also discussed. The review
reveals that the nature of cycling flow fields are complex
and multi-faceted as a result of the highly three-dimen-
sional and variable geometry of the human form, the
unsteady racing environment flow field, and the non-linear
interactions that are inherent to all cycling flows. Current
findings in this field have and will continue to evolve the
sport of elite cycling while also posing a multitude of
potentially fruitful areas of research for further gains in
cycling performance.
Keywords Aerodynamics � Bluff body � Sports � Cycling �Wind tunnel � CFD
1 Introduction
This year, elite cyclists from all around the world will have
gathered to compete in one of cycling’s greatest road races,
the Tour de France. In a quiet moment, these athletes may
reflect on their journey to Paris. For all, this journey will
have required years of intense coaching, training and sac-
rifice, and for many cyclists this will have included hours
in a wind tunnel searching for the optimal aerodynamic
position and racing strategy. The clothes that the athletes
will wear, the equipment the teams select, and the bicycles
they ride will all have been developed with aerodynamics
front of mind. The athletes will know that the difference
between a podium and a respectable finish may be holding
their form and position through the pain barrier, as to break
form will increase the aerodynamic loads they must fight to
overcome—at which point they will be riding against the
wind.
In this review paper, we aim to explain the current
understanding of the aerodynamics of competitive track
and road cycling and identify areas where further research
is required. It is clear that aerodynamic performance can be
as fundamental to success as power production. However,
the application of the aerodynamics principles presented is
not limited to competition. Today, cycling is an important
& Timothy N. Crouch
David Burton
Zach A. LaBry
Kim B. Blair
1 Department of Mechanical Engineering, Monash University,
Clayton, VIC 3800, Australia
2 ATA Engineering, Inc., El Segundo, CA 90245, USA
3 Massachusetts Institute of Technology and STI&E
Consulting, Cambridge, MA, USA
Sports Eng (2017) 20:81–110
DOI 10.1007/s12283-017-0234-1
and sustainable means of transport, a fitness and recre-
ational activity, a competitive sporting pursuit, a spectator
sport with a huge fan base, and an industry of growing
economic significance. Aerodynamics is a factor in all
these: whether it is the time taken for a cyclist to commute
to work, the effort required to overcome a head-wind, time-
trial success at the Tour de France, or product performance
and differentiation.
1.1 Aerodynamics and the evolution of the 1-h
record
No other human-powered transport mechanism has had as
wide an uptake and impact on our society as the bicycle.
Perhaps surprisingly, the modern bicycle has existed in
similar form since the mid- to late 19th century, with
recent technological advances driven mostly by uptake
from other industries (e.g. materials such as carbon fibre,
manufacturing techniques, and numerical modelling) and
competitive innovators. The bicycle likely developed
from a merging of technologies from earlier sit astride
push along velocipedes and treadled tri- and quadra-cy-
cles. By the 1870s, cyclists were attempting to set
records, both Englishman James Moore and American
Frank Dodds are separately rumoured to have claimed the
first hour record. Almost 150 years later, the 1-h time-trial
remains a landmark record of human performance. The
competition has recently been re-invigorated by the Union
Cycliste Internationale (UCI) that is the international
governing body of cycling relaxing the aerodynamic rules
that previously restricted its advancement. In fact, the
evolution of this record is explanatory of the critical role
that aerodynamics plays in the performance of any com-
petitive cyclist.
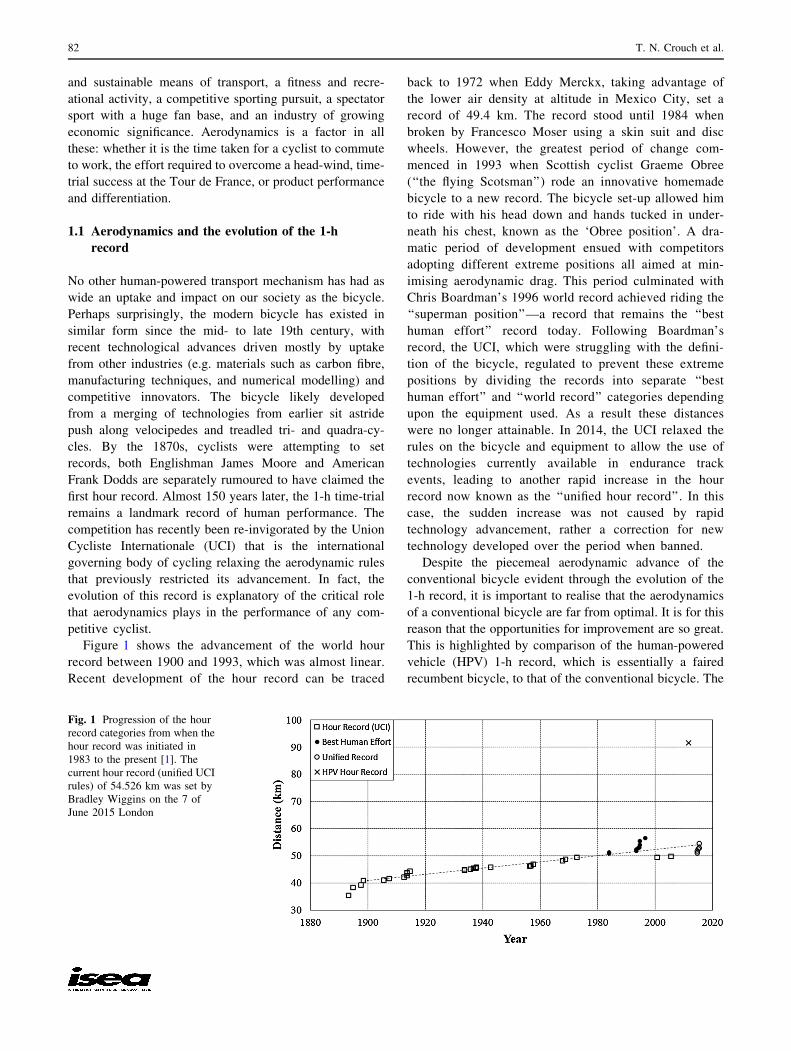
Figure 1 shows the advancement of the world hour
record between 1900 and 1993, which was almost linear.
Recent development of the hour record can be traced
back to 1972 when Eddy Merckx, taking advantage of
the lower air density at altitude in Mexico City, set a
record of 49.4 km. The record stood until 1984 when
broken by Francesco Moser using a skin suit and disc
wheels. However, the greatest period of change com-
menced in 1993 when Scottish cyclist Graeme Obree
(‘‘the flying Scotsman’’) rode an innovative homemade
bicycle to a new record. The bicycle set-up allowed him
to ride with his head down and hands tucked in under-
neath his chest, known as the ‘Obree position’. A dra-
matic period of development ensued with competitors
adopting different extreme positions all aimed at min-
imising aerodynamic drag. This period culminated with
Chris Boardman’s 1996 world record achieved riding the
‘‘superman position’’—a record that remains the ‘‘best
human effort’’ record today. Following Boardman’s
record, the UCI, which were struggling with the defini-
tion of the bicycle, regulated to prevent these extreme
positions by dividing the records into separate ‘‘best
human effort’’ and ‘‘world record’’ categories depending
upon the equipment used. As a result these distances
were no longer attainable. In 2014, the UCI relaxed the
rules on the bicycle and equipment to allow the use of
technologies currently available in endurance track
events, leading to another rapid increase in the hour
record now known as the ‘‘unified hour record’’. In this
case, the sudden increase was not caused by rapid
technology advancement, rather a correction for new
technology developed over the period when banned.
Despite the piecemeal aerodynamic advance of the
conventional bicycle evident through the evolution of the
1-h record, it is important to realise that the aerodynamics
of a conventional bicycle are far from optimal. It is for this
reason that the opportunities for improvement are so great.
This is highlighted by comparison of the human-powered
vehicle (HPV) 1-h record, which is essentially a faired
recumbent bicycle, to that of the conventional bicycle. The
Fig. 1 Progression of the hour
record categories from when the
hour record was initiated in
1983 to the present [1]. The
current hour record (unified UCI
rules) of 54.526 km was set by
Bradley Wiggins on the 7 of
June 2015 London
82 T. N. Crouch et al.
current HPV record is over 90 km, nearly double that of
Boardman’s best human effort record (56.375 km) and
Wiggins’ one-hour record (54.526 km).
1.2 Aerodynamics and cyclist performance
The fundamental physics governing the motion of a cyclist
are well known and have been modelled in the literature.
Martin et al. [2] validated a mathematical model for
cycling power. The power input from the rider ‘PTotal’ is
transferred from the crank to the wheels by the chain with
an efficiency, ‘E’. The model accounts for aerodynamic
resistance ‘PAT’, rolling resistance ‘PRR’ from the resistive
force between tyre and road, wheel bearing friction losses
‘PWB’, potential energy ‘PPE’ changes due to riding up or
down hill, and inertial/kinetic energy ‘PKE’ changes arising
from linear (cyclist forward speed) and rotational
acceleration:
PTotal ¼PAT þ PRR þ PWB þ PPE þ PKE
E: ð1Þ
Aerodynamic power can be attributed to two main com-
ponents: the resistive force acting against the direction of
motion of the cyclist (aerodynamic drag) and the aerody-
namic forces (or more correctly moments) that resist the
rotation of the wheels:
PAT ¼ PA þ PAR; ð2Þ
where ‘PA’ is the linear component and ‘PAR’ is the rota-
tional component. The aerodynamic drag force ‘FD’
experienced by a cyclist:
FD ¼ CD � A 1
2qU2; ð3Þ
is a function of the drag coefficient ‘CD’ and the frontal
area of the cyclist ‘A’. It increases linearly with air density
‘q’; low air density and consequently lower aerodynamic
drag are the reasons that so many world records have been
set at high altitude. Air density of dry air varies as a
function of pressure ‘p’, temperature ‘T’, and a specific gas
constant ‘RS’:
q ¼ p
RST: ð4Þ
The drag force also increases with the square of the relative
wind speed ‘U’, as a corollary the power required to
overcome these forces increases with the cube of the wind
speed:
PA ¼ FD � U ¼ CD � A 1
2qU3: ð5Þ
Aerodynamics becomes increasingly dominant over other
forces as speed increases. To increase performance,
especially in events where inertial changes (acceleration)
are not significant, a cyclist must either increase the power
they produce or decrease their resistance. Kyle and Burke
[3] found that aerodynamic resistance accounts for over
90% of resistance a cyclist encounters on a flat surface, and
Martin et al. [2] found that aerodynamic resistance
accounted for between 56 and 96% of power depending on
road gradient. This creates an exciting circumstance where
smaller, less powerful athletes can compete against larger
stronger cyclists by optimising their interaction with the
fluid medium (i.e. the air).
1.3 Aerodynamic forces and moments
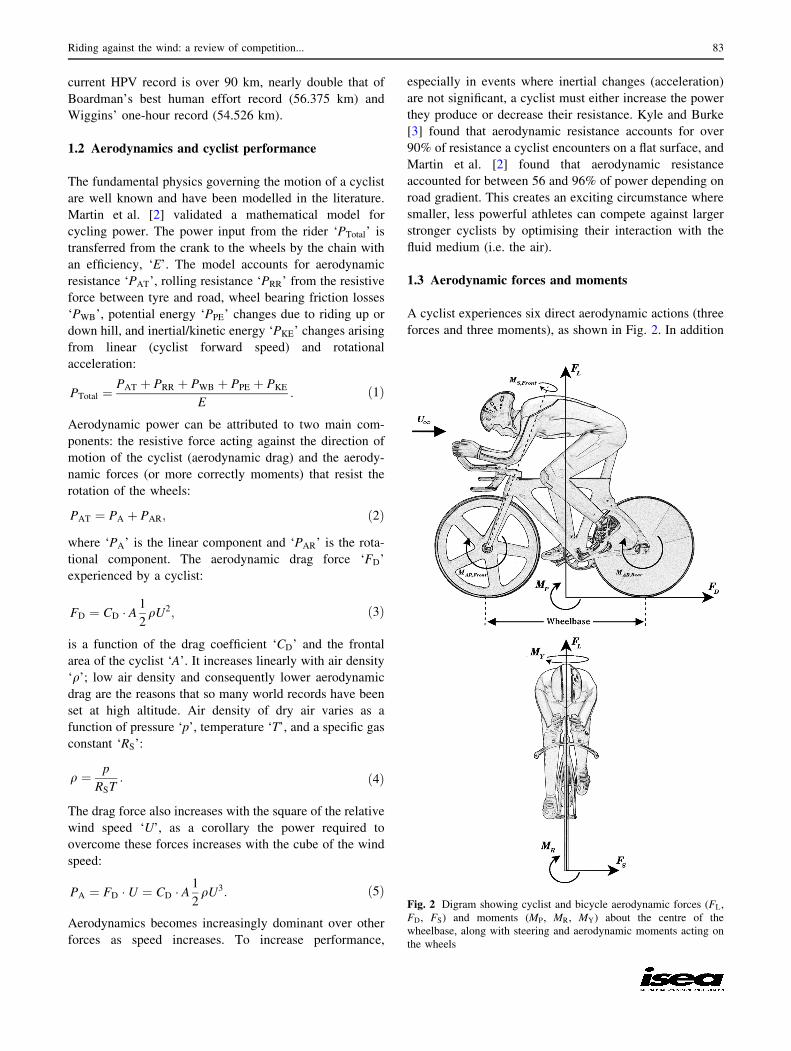
A cyclist experiences six direct aerodynamic actions (three
forces and three moments), as shown in Fig. 2. In addition
Fig. 2 Digram showing cyclist and bicycle aerodynamic forces (FL,
FD, FS) and moments (MP, MR, MY) about the centre of the
wheelbase, along with steering and aerodynamic moments acting on
the wheels
Riding against the wind: a review of competition... 83
to the drag force that acts in the opposite direction to
cyclist’s motion, the other aerodynamic force components
consist of a side force ‘FS’, and the vertical lift force ‘FL’.
The moments are defined about the centre of the wheelbase
as a pitching moment that acts to lift the front wheel ‘MP’,
roll moment ‘MR’, and yaw moment ‘MY’. All these forces
and moments can be described as force ‘CF’ and moment
‘CM’ coefficients, normalised by the frontal area and
dynamic pressure, and in the case of moment coefficients
by the frontal area and the wheelbase of length ‘l’:
CF:D;S;L ¼ FD;S;L
12qU2
1A; ð6Þ
CM:P;R;Y ¼ MD;S;L
12qU2
1Al: ð7Þ
In addition, the bicycle and cyclist experience indirect
resistance to rolling and pedalling motion, through aero-
dynamic resistance to wheel (and leg) rotation ‘MAR;Front’
and ‘MAR;Rear’. Finally, a steering moment ‘MS;Front’ is
experienced on the front wheel that acts about the front
fork axis and thereby can affect steering and stability in
cross-wind, especially in the case of a front disc wheel.
2 Fluid dynamics of cycling
2.1 Bluff body aerodynamics
Flows around a cyclist exhibit large regions of separation
and, therefore, fall into the category of bluff bodies. In
contrast to streamlined bodies such as aerofoils, which
have rounded leading edges and a gradual reduction in
body width and cross-sectional area from the widest point
of the body to the trailing edge, a bluff body has sharp
edges or a much more dramatic reduction in body width
towards the trailing surfaces [6]. This type of geometry
results in large adverse pressure gradients imposed on the
boundary layer that are too large to sustain attached flow.
As a result, bluff body flows are characterised by large
regions of separated flow that may or may not reattach to
the surface.
Unlike streamlined bodies, where the viscous tangential
wall shear stress forces contribute the largest proportion to
aerodynamic drag, the aerodynamic resistance in cycling is
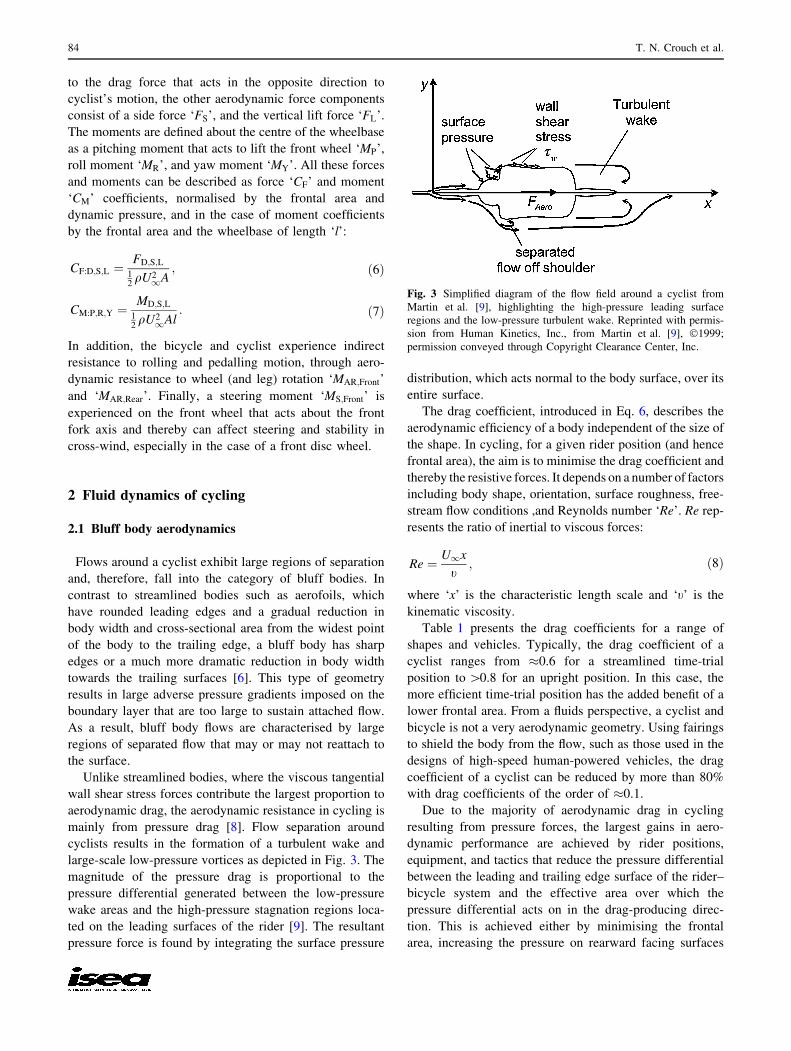
mainly from pressure drag [8]. Flow separation around
cyclists results in the formation of a turbulent wake and
large-scale low-pressure vortices as depicted in Fig. 3. The
magnitude of the pressure drag is proportional to the
pressure differential generated between the low-pressure
wake areas and the high-pressure stagnation regions loca-
ted on the leading surfaces of the rider [9]. The resultant
pressure force is found by integrating the surface pressure
distribution, which acts normal to the body surface, over its
entire surface.
The drag coefficient, introduced in Eq. 6, describes the
aerodynamic efficiency of a body independent of the size of
the shape. In cycling, for a given rider position (and hence
frontal area), the aim is to minimise the drag coefficient and
thereby the resistive forces. It depends on a number of factors
including body shape, orientation, surface roughness, free-
stream flow conditions ,and Reynolds number ‘Re’. Re rep-
resents the ratio of inertial to viscous forces:
Re ¼ U1x
t; ð8Þ
where ‘x’ is the characteristic length scale and ‘t’ is the
kinematic viscosity.
Table 1 presents the drag coefficients for a range of
shapes and vehicles. Typically, the drag coefficient of a
cyclist ranges from �0.6 for a streamlined time-trial
position to[0.8 for an upright position. In this case, the
more efficient time-trial position has the added benefit of a
lower frontal area. From a fluids perspective, a cyclist and
bicycle is not a very aerodynamic geometry. Using fairings
to shield the body from the flow, such as those used in the
designs of high-speed human-powered vehicles, the drag
coefficient of a cyclist can be reduced by more than 80%
with drag coefficients of the order of �0.1.
Due to the majority of aerodynamic drag in cycling
resulting from pressure forces, the largest gains in aero-
dynamic performance are achieved by rider positions,
equipment, and tactics that reduce the pressure differential
between the leading and trailing edge surface of the rider–
bicycle system and the effective area over which the
pressure differential acts on in the drag-producing direc-
tion. This is achieved either by minimising the frontal
area, increasing the pressure on rearward facing surfaces
Fig. 3 Simplified diagram of the flow field around a cyclist from
Martin et al. [9], highlighting the high-pressure leading surface
regions and the low-pressure turbulent wake. Reprinted with permis-
sion from Human Kinetics, Inc., from Martin et al. [9], �1999;
permission conveyed through Copyright Clearance Center, Inc.
84 T. N. Crouch et al.

and in the wake, or by reducing the magnitude of the
high-pressure stagnation regions on the leading surfaces
of the body.
Prior to separation, the surface pressure is well
approximated using potential flow theory. For steady irro-
tational flows, ignoring gravity effects, the local static
pressure ‘PS’ around a body can be approximated using
Bernoulli’s equation:
PT ¼ PS þ1
2qU2; ð9Þ
where ‘PT’ represents the total pressure (equal to pressure
at stagnation points on the body) and U is the local fluid
Table 1 Drag coefficients of simple 2D, 3D, and more complex 3D geometries for a range of Reynolds numbers [4–7]
yrtemoeGD-3yrtemoeGD-2 Complex 3-D Geometry
Airfoilx = chord (c)A = c(b)Re ≈ 1 × 10⁵
CD ≈ 0.1
Elipsoidx = diameter (d)A = π
4 d2
Re ≈ 1 × 10⁵
CD ≈ 0.05
Faired − HPVx =
√A
A = frontalRe ≈ 1.5 × 10⁶
CD ≈ 0.07
Cirular Cylinder
120◦ x = diameter (d)A = d(b)Re ≈ 5 × 10⁵
CD ≈ 0.4
Sphere
x = diameter(d)A = π
4 d2
Re ≈ 5 × 10⁵
CD ≈ 0.1
Fast − Back Car
x =√A
A = frontalRe ≈ 4 × 10⁶
CD ≈ 0.28
Cirular Cylinder
82◦ x = diameter (d)A = d(b)Re ≈ 1 × 10⁴
CD ≈ 1.2
Sphere
x = diameter (d)A = π
4 d2
Re ≈ 1 × 10⁴
CD ≈ 0.5
Small Bus
x =√A
A = frontalRe ≈ 3.5 × 10⁶
CD ≈ 0.42
60◦ Wedge
x = width (w)A = w(b)Re ≈ 1 × 10⁵
CD ≈ 1.4
60◦ Cone
x = diameter (d)A = π
4 d2
Re > 1 × 10⁴
CD ≈ 0.8
Cyclist − T ime Trial
x =√A
A = frontalRe ≈ 7 × 10⁵
CD ≈ 0.60
90◦ Wedge
x = width (w)A = w(b)Re ≈ 1 × 10⁵
CD ≈ 1.6
90◦ Cone
x = diameter (d)A = π
4 d2
Re > 1 × 10⁴
CD ≈ 1.15
Semi − Trailer
x =√A
A = frontalRe ≈ 6 × 10⁶
CD ≈ 0.70
Flat P late
x = width (w)A = w(b)Re ≈ 1 × 10⁵
CD ≈ 2.0
Disk
x = diameter (d)A = π
4 d2
Re > 1 × 10³
CD ≈ 1.1
Cyclist − Upright
x =√A
A = frontalRe ≈ 7 × 10⁵
CD > 0.80
Geometries are depicted from streamlined to increasing bluffness working down the table from top to bottom. The aerodynamic efficiency and the
degree to which a geometry is streamlined are strongly dependent on body shape. The wake width is depicted for 2D bodies demonstrating the
trend that the degree of ‘bluffness’ increases with increasing wake width (relative to the characteristic length scale x). We also note that for
geometries exhibiting smooth curves (such as cylinders and spheres) the drag coefficient is dependent on the Reynolds number. Note ‘(b)’
represents the span of the body
Riding against the wind: a review of competition... 85

velocity. From this equation, it can be seen that the regions
of high velocity correspond to low static pressure and
regions of low velocity correspond to high static pressure.
Near forward-facing surfaces, large regions of flow stag-
nation/low velocity are to be avoided and hence curved
surfaces are favoured. On rearward surfaces, the aim is to
decrease the flow speed, increasing pressure, without
causing separation. Unfortunately, the flow is inclined to
separate under positive (adverse) pressure gradients
meaning that any expansion to reduce flow velocity must
be gradual, which is one reason low drag shapes tend to
have long tails. It follows that maintaining attached flow
and minimising the size of the wake or controlling the
location at which flow separation occurs is one of the
primary objectives in the design of cycling equipment or
optimising riding position for aerodynamic performance.
The prediction of the location at which flow separation will
occur is often difficult as it depends on both the charac-
teristics of the upstream boundary layer and flow structures
in the near wake [10].
The nature of the boundary layer describing the velocity
profile of the fluid near the surface of a moving body is
dependent on the body geometry and surface texture as
well as the freestream air properties. Compared to laminar
boundary layers, which have only diffusive intermixing,
turbulent boundary layers are characterised by intense
small-scale eddies that transfer momentum from the free-
stream to the viscous interface at the body’s wall [11]. The
increased momentum at the body’s surface gives turbulent
boundary layers a greater ability to overcome adverse
pressure gradients compared to laminar boundary layers.
As a result, turbulent boundary layers are less susceptible
to flow separation over curved surfaces leading to reduc-
tions in the pressure drag acting on bluff bodies.
2.2 Cyclist wake structure and major flow regimes
The approach to minimising aerodynamic drag is greatly
complicated when separation occurs and even more so in
the case of complex three-dimensional geometries (e.g., a
cyclist). The flow over a cyclist is further complicated
when the unsteady aerodynamics associated with the
motion of the legs around the crank cycle is considered.
Recently, there has been a considerable amount of work
using both experimental and numerical techniques to locate
where the flow separates from the body of the rider over the
course of the pedal stroke and how the three-dimensional
aspects of the flow relate to the aerodynamic forces acting
on cyclists.
Experimental studies by Crouch et al. [12, 13] and
numerical investigations by Griffith et al. [14] have
recently provided insight into the nature of the flow and the
origin of the aerodynamic forces at play for cyclists. These
studies utilised a full-scale mannequin in a time-trial
position, and a numerical cyclist model of a similar
geometry to visualise and quantify the development of the
large-scale flow structures that develop in the wake over
the course of a pedal stroke. A quasi-steady analysis,
whereby the flow was analysed for a series of static leg
positions around a full 360� pedal stroke, revealed that the
aerodynamic drag of a cyclist varies significantly (�20%)
as a function of crank angle. The dependence of aerody-
namic drag on crank angle was first reported on by Kyle
et al. [15], who observed similar variations in the aerody-
namic drag force between a horizontal and a vertical crank
position. Measurements of the frontal area of the man-
nequin and the bike varied by less than 2% over a full pedal
cycle and led the authors to conclude that the majority of
the variation in drag with leg position must arise from
variations in the drag coefficient, which depends on the
structure of the wake.
The link between the large variation in the aerodynamic
drag force and the state of the flow in the wake was made
from detailed wind tunnel wake velocity field surveys,
surface pressure measurements, and flow visualisation
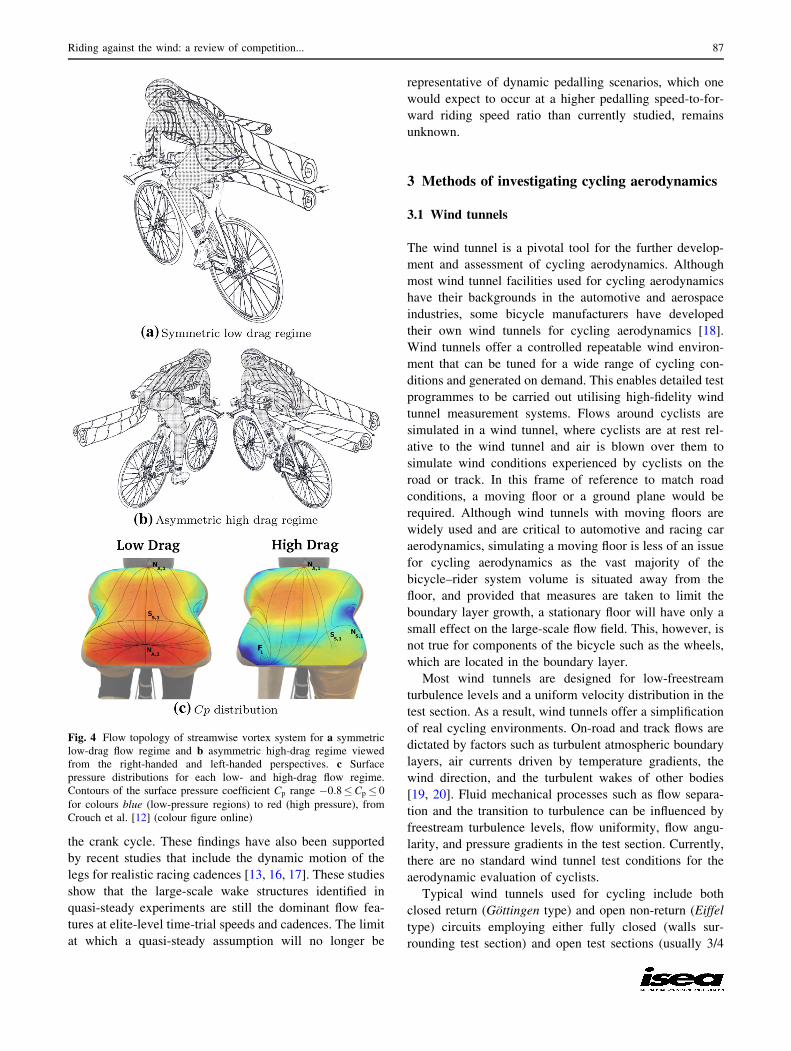
studies. From velocity fields measured for various cross-
sections in the wake, two major flow regimes were iden-
tified along with the large-scale flow structure variants as
the legs progressed around the crank cycle. These are
shown in Fig. 4 and consist of a symmetrical low-drag flow
regime for crank angles close to the horizontal and an
asymmetrical high-drag flow regime which occurred when
one leg was raised and the other in an extended position.
The symmetrical regime consisted of streamwise vortices
(vortex cores aligned with the freestream direction) that
originate from the upper and inner thighs when the cranks
were close to the horizontal position. The asymmetrical
high-drag regime consisted of a pair of intense counter-
rotating streamwise vortices that persist far into the
downstream wake. These originate when the flow separates
from the upper hip of the extended leg and the rear of the
hip of the raised leg for leg positions closer to a vertical
crank angle.
The variation in the aerodynamic drag force that occurs
throughout the crank cycle was found to be correlated with
changes to the size and strength of the large-scale flow
structures. Time-averaged surface pressure measurements
and skin friction flow visualisations performed on the back
and base of the mannequin showed that the primary flow
structures were responsible for the large low-pressure
regions that develop on a cyclist’s back. These low-pres-
sure regions, shown in Fig. 4c, were found to account for
12–20% of the total aerodynamic drag force throughout the
crank cycle. Over 60% of the variation in drag with leg
position could be accounted for solely by the large change
in the pressure distribution on the back and hips throughout
86 T. N. Crouch et al.
the crank cycle. These findings have also been supported
by recent studies that include the dynamic motion of the
legs for realistic racing cadences [13, 16, 17]. These studies
show that the large-scale wake structures identified in
quasi-steady experiments are still the dominant flow fea-
tures at elite-level time-trial speeds and cadences. The limit
at which a quasi-steady assumption will no longer be
representative of dynamic pedalling scenarios, which one
would expect to occur at a higher pedalling speed-to-for-
ward riding speed ratio than currently studied, remains
unknown.
3 Methods of investigating cycling aerodynamics
3.1 Wind tunnels
The wind tunnel is a pivotal tool for the further develop-
ment and assessment of cycling aerodynamics. Although
most wind tunnel facilities used for cycling aerodynamics
have their backgrounds in the automotive and aerospace
industries, some bicycle manufacturers have developed
their own wind tunnels for cycling aerodynamics [18].
Wind tunnels offer a controlled repeatable wind environ-
ment that can be tuned for a wide range of cycling con-
ditions and generated on demand. This enables detailed test
programmes to be carried out utilising high-fidelity wind
tunnel measurement systems. Flows around cyclists are
simulated in a wind tunnel, where cyclists are at rest rel-
ative to the wind tunnel and air is blown over them to
simulate wind conditions experienced by cyclists on the
road or track. In this frame of reference to match road
conditions, a moving floor or a ground plane would be
required. Although wind tunnels with moving floors are
widely used and are critical to automotive and racing car
aerodynamics, simulating a moving floor is less of an issue
for cycling aerodynamics as the vast majority of the
bicycle–rider system volume is situated away from the
floor, and provided that measures are taken to limit the
boundary layer growth, a stationary floor will have only a
small effect on the large-scale flow field. This, however, is
not true for components of the bicycle such as the wheels,
which are located in the boundary layer.
Most wind tunnels are designed for low-freestream
turbulence levels and a uniform velocity distribution in the
test section. As a result, wind tunnels offer a simplification
of real cycling environments. On-road and track flows are
dictated by factors such as turbulent atmospheric boundary
layers, air currents driven by temperature gradients, the
wind direction, and the turbulent wakes of other bodies
[19, 20]. Fluid mechanical processes such as flow separa-
tion and the transition to turbulence can be influenced by
freestream turbulence levels, flow uniformity, flow angu-
larity, and pressure gradients in the test section. Currently,
there are no standard wind tunnel test conditions for the
aerodynamic evaluation of cyclists.
Typical wind tunnels used for cycling include both
closed return (Gottingen type) and open non-return (Eiffel
type) circuits employing either fully closed (walls sur-
rounding test section) and open test sections (usually 3/4
Fig. 4 Flow topology of streamwise vortex system for a symmetric
low-drag flow regime and b asymmetric high-drag regime viewed
from the right-handed and left-handed perspectives. c Surface
pressure distributions for each low- and high-drag flow regime.
Contours of the surface pressure coefficient Cp range �0:8�Cp � 0
for colours blue (low-pressure regions) to red (high pressure), from
Crouch et al. [12] (colour figure online)
Riding against the wind: a review of competition... 87

open variety, whereby a jet of air is generated by a nozzle
blowing over a ground plane as shown in Fig. 5). Both
types of test sections offer advantages and disadvantages
when simulating flows around cyclists referenced to an
infinite flow or ‘free-air’ case (riding in an open environ-
ment with still air). One of the main differences between
the two designs is how the flow in the test section is altered
compared to free-air conditions. In fully closed test sec-
tions, the wind tunnel walls restrict the displacement of the
streamlines around the cyclists. One effect of this is that the
local air velocity around the cyclist is increased and can
have a significant effect on aerodynamic force and pressure
coefficients.
In open-jet facilities, the blockage effects tend to be less;
however, the correction methods are more complex. For
example, the curvature of the jet boundary is increased or
over-expanded, resulting in a lower velocity profile around
the cyclist. Blockage corrections have been developed for
both closed and open-jet test sections that take into account
the solid blockage and wake blockage effects [21–24]. One
of the key parameters to the corrections is the blockage
ratio given as the ratio of the frontal area to the area of the
wind tunnel cross-section. It is recommended that blockage
ratios be\5%; however, this is only a guideline and open-
jet facilities are much less susceptible to solid blockage
effects. Open-jet facilities are more prone to additional
influences however known as jet/collector blockage and
horizontal buoyancy forces that result from static pressure
gradients that develop across the test section. Particularly,
when testing high blockage, long models, or large cycling
arrangements (drafting cyclists in a pace-line formation for
example), blockage effects and the type of wind tunnel
facility must be considered and taken into account when
interpreting findings.
3.2 Wind tunnel measurement techniques
The most common measurement performed with cyclists in
the wind tunnel is the time-averaged aerodynamic force
measurements. The purpose is usually to measure the effect
of different rider positions and cycling equipment config-
urations (see Table 4 which is discussed in Sect. 4.1 and
presents a range of cycling wind tunnel investigations).
Typically, this involves positioning the bicycle on a force
balance that is housed underneath the wind tunnel floor via
struts connected to the wheel axles. The force balance is
typically mounted on a turntable that facilitates the yawing
of the rider and system relative to the wind to understand
changes in aerodynamic forces associated with cross-wind.
The bicycle is sometimes installed on a raised platform that
incorporates a splitter plane extending forward of the bal-
ance to limit the impact of the wind tunnel floor boundary
layer on force measurements. Early wind tunnel testing of
cyclists involved force measurements of cyclists holding
stationary, non-pedalling positions. Nowadays, it is more
common to measure aerodynamic forces with the cyclists
pedalling and the wheels rotating, which provides a better
representation of road/track cycling conditions. The rota-
tion of the wheels has been achieved using mechanical
roller/belt drives [8] and systems utilising electric motors
[2]. The same approach can be taken to measure the forces
on a bicycle, in the absence of a cyclist. Care needs to be
Fig. 5 Cutaway of a 3/4 open-jet wind tunnel (Monash University Clayton Campus) which is ideal for full-scale testing of athletes (note: there
are many configurations and designs of open-jet wind tunnels; this is just one example)
88 T. N. Crouch et al.

taken in comparing results from wind tunnel measurement
of bicycle drag. In the authors’ experience, small effects
such as pedal type and position, seat treatment, and small
misalignments can all affect drag measurements of a
bicycle alone but are unlikely to be significant to the
combined drag of bicycle and cyclist. This is important
when comparing the relative performance of different
bicycles.
Often aerodynamic forces measured in a wind tunnel are
not reported as coefficients, which require measurements of
the projected frontal area, but as drag area measurements
‘CDA’. The drag area given by
CDA ¼ D12qU2
1ð10Þ
provides a means of eliminating the uncertainty associated
with measuring the frontal surface area [2, 4], while still
providing a way of standardising force measurements for
variations in fluid properties and velocity between wind
tunnel tests. As aerodynamic drag is dependent on both the
drag coefficient and the frontal area, the drag area also
dictates the aerodynamic power requirements of riders to
maintain a given speed and serves as a performance mea-
sure. When force coefficients are reported, the frontal area
has been determined using a number of techniques that
have been summarised by Debraux et al. [28]. These
methods usually involve photographs recorded from the
frontal views of rider position that are analysed using
digital image processing techniques or the weighing of
photographs technique [29–31].
One of the major problems with athlete wind tunnel
measurements is the repeatability of rider position. The
validity of assigning forces and any aerodynamic quantity
associated to a particular rider shape and position depends
upon the ability of the rider to maintain their position
throughout the testing period. Further, many testing sce-
narios require the rider to dismount from the bicycle in the
wind tunnel and re-mount the bicycle in the same position.
Small variances in rider position also result in a change in
the physical geometry of the rider, making it difficult to
isolate exactly what variables are influencing aerodynamic
force measurements of rider position. In an effort to control
for rider positioning, some wind tunnels have implemented
camera and motion tracking systems to monitor and record
the position of athletes throughout testing.
By performing wind tunnel experiments on a man-
nequin, rider positions can be accurately repeated and
maintained for extended periods of time and tested on
demand. Testing with mannequins also allows for the
geometry and position to be decoupled. Cycling man-
nequins are increasingly being used both in fundamental
research and industry for detailed wind tunnel investiga-
tions. Testing with cycling mannequins opens up additional
wind tunnel testing methods that are impractical or simply
cannot be performed with athletes. Velocity field, surface
pressure, and flow visualisation measurement techniques
provide additional information on the nature of the aero-
dynamic forces acting on cyclists. Detailed knowledge of
the link between the flow field, surface pressure distribu-
tions, and the aerodynamic forces is critical to our under-
standing of these flows, the further development and design
of cycling equipment, and the validation of numerical
codes. Figure 6 shows a small sample of some of these
methods applied to cycling that utilise point velocity
measurements with probes and particle image velocimetry
(PIV), surface pressure systems, and flow visualisation
techniques. For a detailed description of these methods and
many more wind tunnel testing techniques, see Tropea
et al. [6] and Barlow et al. [32].
3.3 Computational fluid dynamics
With improvements in meshing methods, increases in
computing power, and advances in turbulence modelling
and prediction of flow separation, computational fluid
dynamics (CFD) is now capable of being practically uti-
lised as another tool for investigating viscous flows around
complex three-dimensional geometries such as a cyclist. As
outlined in a review of the impact of CFD in sport by
Hanna [33], CFD is being increasingly used to solve
aerodynamics problems in sports ranging from car racing
such as formula one, yacht racing, swimming, soccer,
cricket, and cycling. In recent years, numerical codes have
been used to simulate flows around bicycle components
such as wheels [34, 35] and investigate the aerodynamics
of different rider positions [27, 36].
There are many benefits to using CFD to investigate rider
aerodynamics as it enables information about the flow field
around a cyclist system to be obtained which would other-
wise be extremely difficult or prohibitively time-consuming
process to obtain experimentally. CFD has the potential to
solve for the entire flowfield that is resolved not only in space
but in the time domain as well. Figure 7 shows the example
numerical simulations of the flow field around cyclist
geometries and bicycle components. Numerical simulations
allow for the aerodynamic forces acting on a cyclist system to
be decomposed into the viscous and pressure force compo-
nents, which can be evaluated independently. In addition to
the aerodynamic forces, information about body heat trans-
fer rates and cooling can be gained from CFD [36]. Large
parametric studies of the effect of position, equipment, and
cross-winds to name a few can be performed by running
multiple simulations in parallel. Using CFD, researchers can
calculate the relative contribution to the overall drag of
aerodynamic forces acting on specific parts of the cyclist
system, such as the helmet, arms, torso, legs, and bicycle.
Riding against the wind: a review of competition... 89
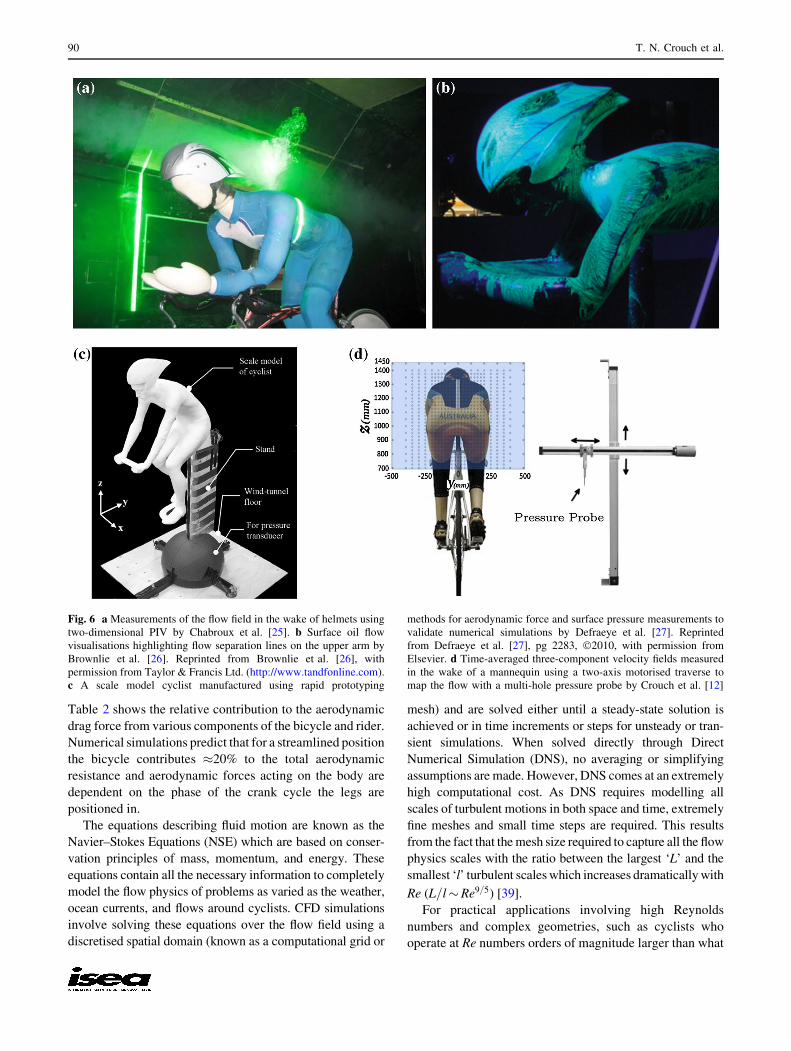
Table 2 shows the relative contribution to the aerodynamic
drag force from various components of the bicycle and rider.
Numerical simulations predict that for a streamlined position
the bicycle contributes �20% to the total aerodynamic
resistance and aerodynamic forces acting on the body are
dependent on the phase of the crank cycle the legs are
positioned in.
The equations describing fluid motion are known as the
Navier–Stokes Equations (NSE) which are based on conser-
vation principles of mass, momentum, and energy. These
equations contain all the necessary information to completely
model the flow physics of problems as varied as the weather,
ocean currents, and flows around cyclists. CFD simulations
involve solving these equations over the flow field using a
discretised spatial domain (known as a computational grid or
mesh) and are solved either until a steady-state solution is
achieved or in time increments or steps for unsteady or tran-
sient simulations. When solved directly through Direct
Numerical Simulation (DNS), no averaging or simplifying
assumptions are made. However, DNS comes at an extremely
high computational cost. As DNS requires modelling all
scales of turbulent motions in both space and time, extremely
fine meshes and small time steps are required. This results
from the fact that themesh size required to capture all the flow
physics scales with the ratio between the largest ‘L’ and the
smallest ‘l’ turbulent scaleswhich increases dramaticallywith
Re (L=l�Re9=5) [39].
For practical applications involving high Reynolds
numbers and complex geometries, such as cyclists who
operate at Re numbers orders of magnitude larger than what
Fig. 6 a Measurements of the flow field in the wake of helmets using
two-dimensional PIV by Chabroux et al. [25]. b Surface oil flow
visualisations highlighting flow separation lines on the upper arm by
Brownlie et al. [26]. Reprinted from Brownlie et al. [26], with
permission from Taylor & Francis Ltd. (http://www.tandfonline.com).
c A scale model cyclist manufactured using rapid prototyping
methods for aerodynamic force and surface pressure measurements to
validate numerical simulations by Defraeye et al. [27]. Reprinted
from Defraeye et al. [27], pg 2283, �2010, with permission from
Elsevier. d Time-averaged three-component velocity fields measured
in the wake of a mannequin using a two-axis motorised traverse to
map the flow with a multi-hole pressure probe by Crouch et al. [12]
90 T. N. Crouch et al.
can currently be solved using DNS, various averaging and
turbulencemodelling techniques must be utilised. One of the
most common is various applications of the Reynolds
Averaged Navier–Stokes equations (RANS). Instead of
solving the NSE equations directly they are averaged and the
time-averaged flow field is resolved. This averaging process
requires the use of turbulence models to close the equations
so that they can be solved. Various other modelling tech-
niques also exist which blend solving the flow directly and
using models such as Large Eddy Simulations (LES) and
Detached Eddy Simulations (DES) where only the large
turbulent motions are resolved in space and time and the
influence of the small scales ismodelled. As the outputs from
CFD are sensitive to the initial input conditions, mesh size,
time step size, turbulence models, and whether steady or
transient simulations have been computed, the best out-
comes, both in research and industry, arise whenCFD is used
in combination with an experimental test programme.
3.4 Combining computational and experimental
methods
Paramount to the successful application of CFD in cycling
is the means to ensure that numerical codes accurately
capture the fundamental flow physics that determines the
aerodynamics of the system being modelled. In order for
computational fluid dynamics to progress in cycling,
researchers and sports scientists must have confidence in
results obtained from CFD simulations. The selection of
appropriate turbulence models and numerical methods used
must be considered when evaluating CFD outputs for the
given application. Typically, the accuracy of numerical
simulations, once they are shown to be independent of
mesh and time step, is assessed by comparison with
detailed experimental results including flow field data.
A number of turbulence models and numerical mod-
elling techniques have been applied to model flows around
bicycles and cyclists holding a static leg position. Table 3
presents the numerical work completed on flows around
cyclists and the various modelling and validation tech-
niques used. Defraeye et al. [27] compared a range of
RANS steady-state simulations utilising various turbulence
models and also transient large eddy simulations with
experimental wind tunnel studies of a scale model of a
cyclist. Of all the models tested, the strongest correlations
with the wind tunnel data were obtained with the RANS
Shear Stress Transport k � x model. This model has also
been used by others to model the flow around bicycle
components [44]. Good comparisons with experiments
were also reported with the standard sk � � model utilising
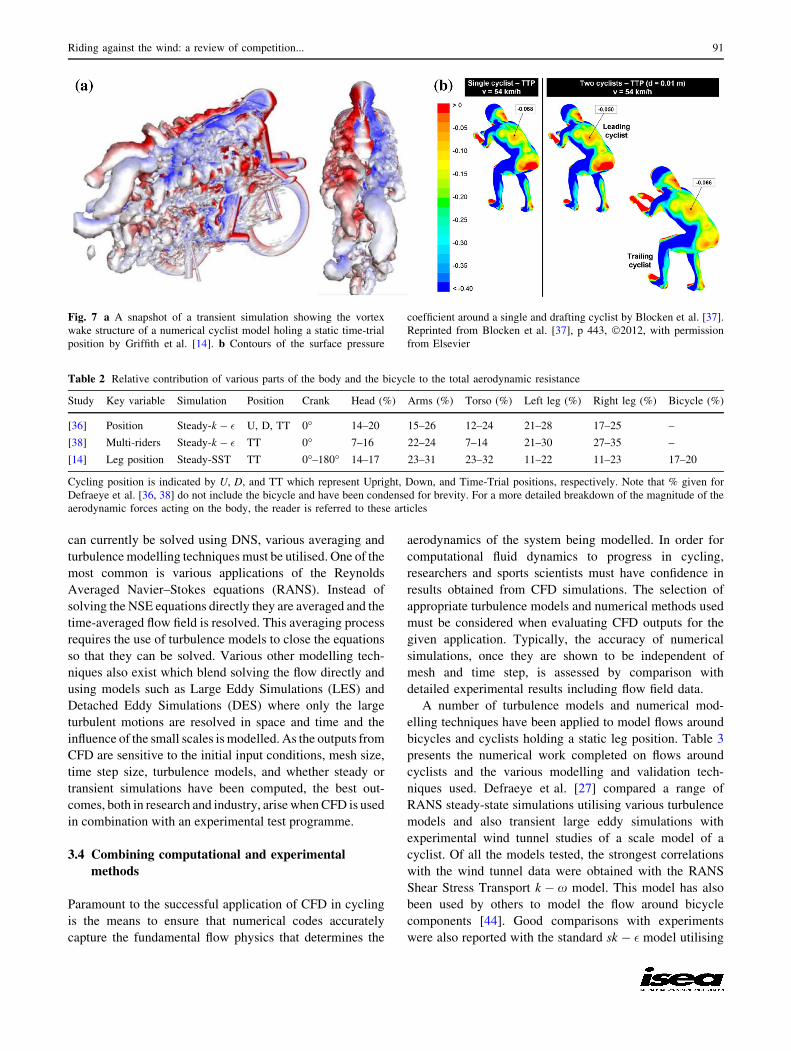
Fig. 7 a A snapshot of a transient simulation showing the vortex
wake structure of a numerical cyclist model holing a static time-trial
position by Griffith et al. [14]. b Contours of the surface pressure
coefficient around a single and drafting cyclist by Blocken et al. [37].
Reprinted from Blocken et al. [37], p 443, �2012, with permission
from Elsevier
Table 2 Relative contribution of various parts of the body and the bicycle to the total aerodynamic resistance
Study Key variable Simulation Position Crank Head (%) Arms (%) Torso (%) Left leg (%) Right leg (%) Bicycle (%)
[36] Position Steady-k � � U, D, TT 0� 14–20 15–26 12–24 21–28 17–25 –
[38] Multi-riders Steady-k � � TT 0� 7–16 22–24 7–14 21–30 27–35 –
[14] Leg position Steady-SST TT 0�–180� 14–17 23–31 23–32 11–22 11–23 17–20
Cycling position is indicated by U, D, and TT which represent Upright, Down, and Time-Trial positions, respectively. Note that % given for
Defraeye et al. [36, 38] do not include the bicycle and have been condensed for brevity. For a more detailed breakdown of the magnitude of the
aerodynamic forces acting on the body, the reader is referred to these articles
Riding against the wind: a review of competition... 91
low-Reynolds number modelling treatment of the viscos-
ity-affected near-wall regions.
Griffith et al. [14] have found strong correlations with
the experimentally obtained flow fields using a transient
(Scale-Adaptive) SST simulation of various static leg
positions around the pedal stroke. Although steady-state
simulations modelled asymmetrical leg positions rea-
sonably well, they did not accurately model the flow
field when the cranks were close to a horizontal position.
This was due to the limited ability of a steady-state
numerical simulation to accurately model flows that
exhibit significant time dependence, as observed around
the more ‘symmetrical’ leg positions. In these phases of
the crank cycle, time-averaged transient simulation
results provided the best comparison with time-averaged
velocity fields obtained from wind tunnel experiments.
The improved accuracy came at a significant cost, but
with the computing time required for the transient sim-
ulation compared the steady state increasing by up to a
factor of 40.
3.5 Track and road testing
While wind tunnel testing and, more recently, CFD have
taken over as the primary analysis techniques for studying
cycling aerodynamics due largely to their accuracy,
reproducibility, and the insight that they can provide into
the basic mechanisms that create drag over a cyclist, field
testing methods have played and will continue to play a
major role in the development of this field of research. It is
very important that expected aerodynamic improvements
within a wind tunnel are compared to the measured per-
formance in the field, as ultimately performance in the field
is the true metric of success for any aerodynamic optimi-
sation. Finally, field testing methods, while prone to larger
uncertainties, may be more readily performed if wind
tunnels or high-end workstations for CFD analysis are not
available.
With the introduction of on-bike power meters such as
the Schoberer Rad Meßtechnik meter (SRM) in the mid-
1990s, it became possible to directly measure the amount
of power required to power a bike at a given speed. In
preparation for the 1996 Olympics, the United States pur-
suit team underwent on-track pacing sessions, in order to
investigate rider positions and equipment [45]. The bicy-
cles were instrumented with power meters, from which
average power data in each of the team pursuit positions
1–4 for each team member were analysed (corrected to a
constant speed of 60 km/h). This investigation yielded
relative quantitative results, and as the authors noted, it was
strongly influenced by the cyclist’s ability to execute even
pacing and maintain a consistent draft (both laterally and
fore-aft). Furthermore, while this procedure did ascertain
the total resistive force on the cyclist (which was most
relevant for the purpose of the US Olympic Team), it did
not distinguish between aerodynamic drag and other
Table 3 Numerical simulations of the flow around various cycling-based applications
Study Application Simulation Cell count, Dt Position Crank Validation Variation
[37] Drafting Steady, sk � � 12:0� 106 U,D,TT 0� Athlete-CDA 0.7–10.5
[40] Rider ? vehicle Steady, sk � � 27:9� 106 TT 0� 1:4 model-CDA Other
[41] Rider ? vehicle Steady, sk � � 34� 106 TT 0� 1:4 model-CDA \3
[42] Rider Steady, k � � 4:6� 106 U,D,TT 0� Athlete-CDA 7–13
Transient, LES 4:3� 10�4s U,D,TT 0� Athlete-CDA 3–13
[27] Rider Steady, k � �; k � x 7:7� 106 U 0� 1:2 model-CDA -36 to 72
Transient, LES 4:3� 10�4s U 0� 1:2 model-CDA -6
[36] Rider Steady, sk � � 7:7� 106 U,D,TT 0� Athlete-CDA Other
[38] Team pursuit Steady, sk � � 21:2� 106 TT 0� Other –
[43] Rider ? bicycle Steady, k � �; k � x 17:9� 106 D 0� 1:1 model-CD -12 to -7
Transient, LES;DES 1� 10�5s D 0� 1:1 model-CD -17 to -5
[35] Wheels Steady, SA 6–11 9 106 – – Other –
Transient, DES 6–11 9 106 – – Other –
[14] Rider ? bicycle Steady, SST 33� 106 TT 0�–180� 1:1 model-CDA -13 to -17
Transient, SAS 4� 10�4s TT 15�, 75� 1:1 model-CDA -13 to -15
For brevity, the exact details of the simulations, such as the use of wall functions, standard/realisable models, or additional modelling techniques
utilised, are notshown. Only the variation between numerical and experimental drag area/coefficients is shown for investigations in which
theexperimentally obtained data were directly apart of the study in question. The superscript * symbol refers to when additionalcoefficients have
been compared with the experimentally obtained values
92 T. N. Crouch et al.
sources of resistance such as wheel rolling and bearing
resistance.
Debraux et al. [28] reviewed several field testing
methods, targeted specifically at separating aerodynamic
drag from rolling resistance. Several methods rely on
measuring the deceleration of a free-wheeling cyclist at
preset intervals and then fitting the data to a simple one-
dimensional dynamic model of the motion (coast downs).
A free-wheeling cyclist travelling in a straight line will be
subject to aerodynamic drag and rolling friction ‘FRR’ that
will decelerate the cyclist. Additionally, some protocols
prescribe that the test be performed while coasting uphill,
meaning that a component of the gravitational force ‘FG’
will directly oppose the motion. Therefore, the basic
equations of motion can be written as
ma ¼ FD þ FRR þ FG ¼ � qU2CdA
2þmg0ðCrr þ sin hÞ;
ð11Þ
where ‘m’ represents the mass of the cyclist–bike system, ‘a’
the cyclist’s acceleration, ‘U’ their velocity, ‘Crr’ the coef-
ficient of rolling resistance, and ‘g0 sin h’ is the gravitationalacceleration due to an uphill slope at angle h. As the drag of
a cyclist varies considerably over the course of a pedal
stroke [12, 15, 46], the most representative coast down tests
require riders to spin their legs without applying power to
effectively average the CdA over the pedal revolution cycle.
In addition to deceleration methods, the final noteworthy
method is another curve fitting technique that uses power data
directly from an on-bike power meter, known as the linear
regression method. In this method, a rider aims to maintain
constantpower and speedover aflat course.The test is repeated
at several different speeds (alternately, the power may be
chosen as the independent parameter). At a constant speed on
flat terrain, the total resistive force is simply the sum of the
aerodynamic and rolling resistance. Themeasured power ‘Pm’
is then related to these forces by the following expression:
Pm=v ¼qCdA
2U2 þmg0Crr: ð12Þ
By measuring the power at several fixed speeds, the values
of CdA and Crr can be extracted using linear regression,
assuming that q is known from the local weather condi-
tions. It should be noted that this method cannot be used
without modification in a track due to the normal forces
induced by the turns.
4 Optimising single-rider aerodynamics
Minimising aerodynamic resistance through rider position is
one of the most effective ways to improve performance
among well-trained athletes. Recent studies utilising modern
aerodynamic bicycle geometries suggest that the rider con-
tributes �80% to the total aerodynamic resistance acting on
the bicycle–rider system [14]. As the rider contributes the
largest proportion to the aerodynamic forces, optimising the
aerodynamics of the body will likely see the largest gains in
cycling performance. The greatest influence one can have on
the aerodynamics of the rider is through the adjustment of
cycling position. This was identified in an early wind tunnel
study conducted by Kyle and Burke [3] which led them to
propose a three-tier hierarchy for reducing cycling resis-
tance: (1) the position of the rider, (2) the geometry of the
bicycle (or more generally cycling equipment), and (3) the
methods for minimising the rolling resistance and drive-train
friction losses. Although the biomechanics and physiological
efficiency of cycling are outside the scope of this review,
when optimising cycling performance, the power output and
fatigue characteristics of cyclists must also be weighed up
against any apparent gains in the aerodynamic performance
through adjustment to position [47–49]. Any changes to
rider posture must also be considered along with current
UCI rulings on legal rider positions.
4.1 Wind tunnel testing of rider position
The importance of position has prompted many wind tun-
nel investigations into the main positions used by elite
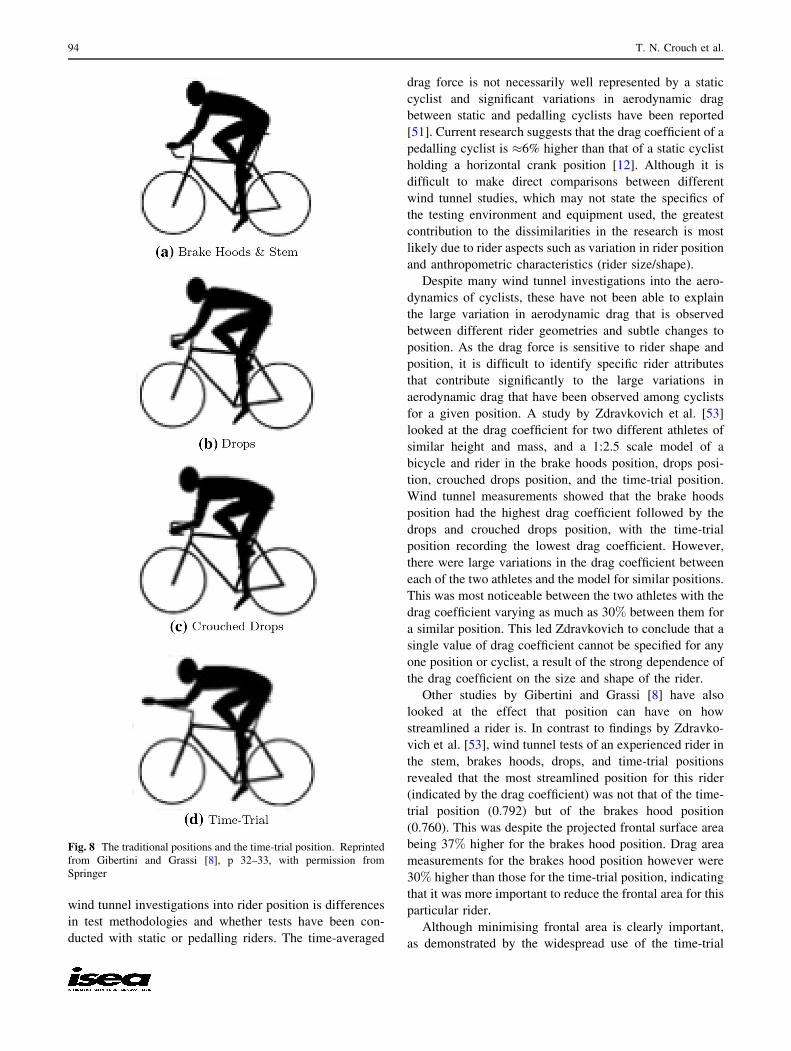
cyclists, which are depicted in Fig. 8. Table 4 shows the
reported drag area and drag coefficients from the wind
tunnel testing of cyclists in various positions. Overall wind
tunnel investigations are largely consistent in the relative
ranking of these postures in terms of aerodynamic perfor-
mance. The time-trial position has the lowest aerodynamic
drag followed by the drops position and the upright break
hoods and stem positions exhibiting the highest aerody-
namic drag. Average wind tunnel data suggest that the
reduction in drag between an upright sitting position with
straight arms (such as the stem and hoods positions) and a
drops position can be as much as 15–20%, and for the time-
trial position as much as 30–35%. However, these are only
average results and drag area and coefficient measurements
for the time-trial position widely used today vary by as
much as 40% between separate wind tunnel studies, and as
much as 60% between wind tunnel studies and other
indirect methods of determining drag [50].
There are a number of reasons why reported aerody-
namic forces and coefficients vary significantly for each of
the main positions between separate wind tunnel investi-
gations. Differences in atmospheric conditions, drag mea-
surement devices, wind tunnel type, blockage effects, Re
effects, and freestream flow quality are all specific char-
acteristics of wind tunnels and all affect aerodynamic force
measurements [32]. Another source of variation between
Riding against the wind: a review of competition... 93
wind tunnel investigations into rider position is differences
in test methodologies and whether tests have been con-
ducted with static or pedalling riders. The time-averaged
drag force is not necessarily well represented by a static
cyclist and significant variations in aerodynamic drag
between static and pedalling cyclists have been reported
[51]. Current research suggests that the drag coefficient of a
pedalling cyclist is �6% higher than that of a static cyclist
holding a horizontal crank position [12]. Although it is
difficult to make direct comparisons between different
wind tunnel studies, which may not state the specifics of
the testing environment and equipment used, the greatest
contribution to the dissimilarities in the research is most
likely due to rider aspects such as variation in rider position
and anthropometric characteristics (rider size/shape).
Despite many wind tunnel investigations into the aero-
dynamics of cyclists, these have not been able to explain
the large variation in aerodynamic drag that is observed
between different rider geometries and subtle changes to
position. As the drag force is sensitive to rider shape and
position, it is difficult to identify specific rider attributes
that contribute significantly to the large variations in
aerodynamic drag that have been observed among cyclists
for a given position. A study by Zdravkovich et al. [53]
looked at the drag coefficient for two different athletes of
similar height and mass, and a 1:2.5 scale model of a
bicycle and rider in the brake hoods position, drops posi-
tion, crouched drops position, and the time-trial position.
Wind tunnel measurements showed that the brake hoods
position had the highest drag coefficient followed by the
drops and crouched drops position, with the time-trial
position recording the lowest drag coefficient. However,
there were large variations in the drag coefficient between
each of the two athletes and the model for similar positions.
This was most noticeable between the two athletes with the
drag coefficient varying as much as 30% between them for
a similar position. This led Zdravkovich to conclude that a
single value of drag coefficient cannot be specified for any
one position or cyclist, a result of the strong dependence of
the drag coefficient on the size and shape of the rider.
Other studies by Gibertini and Grassi [8] have also
looked at the effect that position can have on how
streamlined a rider is. In contrast to findings by Zdravko-
vich et al. [53], wind tunnel tests of an experienced rider in
the stem, brakes hoods, drops, and time-trial positions
revealed that the most streamlined position for this rider
(indicated by the drag coefficient) was not that of the time-
trial position (0.792) but of the brakes hood position
(0.760). This was despite the projected frontal surface area
being 37% higher for the brakes hood position. Drag area
measurements for the brakes hood position however were
30% higher than those for the time-trial position, indicating
that it was more important to reduce the frontal area for this
particular rider.
Although minimising frontal area is clearly important,
as demonstrated by the widespread use of the time-trial
Fig. 8 The traditional positions and the time-trial position. Reprinted
from Gibertini and Grassi [8], p 32–33, with permission from
Springer
94 T. N. Crouch et al.
position, frontal area is not always the dominant factor
when comparing the aerodynamic drag of different riders
in similar positions. It is a common misconception that the
most aerodynamic riders and positions are the ones that
also exhibit the smallest possible frontal area. As the drag
coefficient will vary with frontal area (due to change in
rider position), minimising one will not necessarily result
in a minimum in the drag area. The degree to which the
drag coefficient can affect the performance of a cyclist is
highlighted in two separate studies reported on by Bassett
et al. [59]. Both investigations involved measurements of
aerodynamic drag and frontal surface area of cyclists in a
wind tunnel at 13.3 m/s. The findings demonstrated a weak
correlation between measured aerodynamic drag and
frontal area, of which the frontal area only accounted for
�50% of the variation in drag between the different ath-
letes and their positions.
There have been many ‘rules of thumb’ developed
regarding optimal positioning of a cyclist’s arms, legs,
torso, and head [57, 60–62]. Even relatively minor alter-
ations to one’s time-trial position can have a large effect on
aerodynamic drag. Broker [61] and Kyle [62] note that
rider positions that result in a flat back, a low tucked head
and forearms positioned parallel to the bicycle frame
generally have low aerodynamic drag. Wind tunnel
investigations into a wide range of modifications to stan-
dard road cycling positions by Barry et al. [55] showed that
that lowering the head and torso and bringing the arms
inside the silhouette of the hips reduced the aerodynamic
drag. Positions that resulted in reductions in aerodynamic
drag were also related to a lower velocity deficit and tur-
bulence levels in the wake. Studies by Garcıa-Lopez et al.
[51] and Underwood et al. [49] have shown that reducing
the torso angle generally results in a reduction in aerody-
namic drag. However, these studies also showed that
minimising torso angle did not always lead to the lowest
aerodynamic drag readings.
The effectiveness of rider equipment, such as bicycles
and helmets, is also dependent on the position and type of
rider [51, 63–65]. For these reasons, the most effective
method to optimise a cyclist’s aerodynamic performance to
date has largely been through a trial-and-error approach to
force measurements in a wind tunnel. The position of the
cyclist, usually defined by the set-up of the bicycle (handle
bar and seat positions), and cycling equipment are con-
tinually refined until rider position and equipment config-
urations are identified which result in a lower drag
compared to baseline force measurements. Current studies
into cycling position have primarily focused on the varia-
tion in aerodynamic drag with posture as this directly
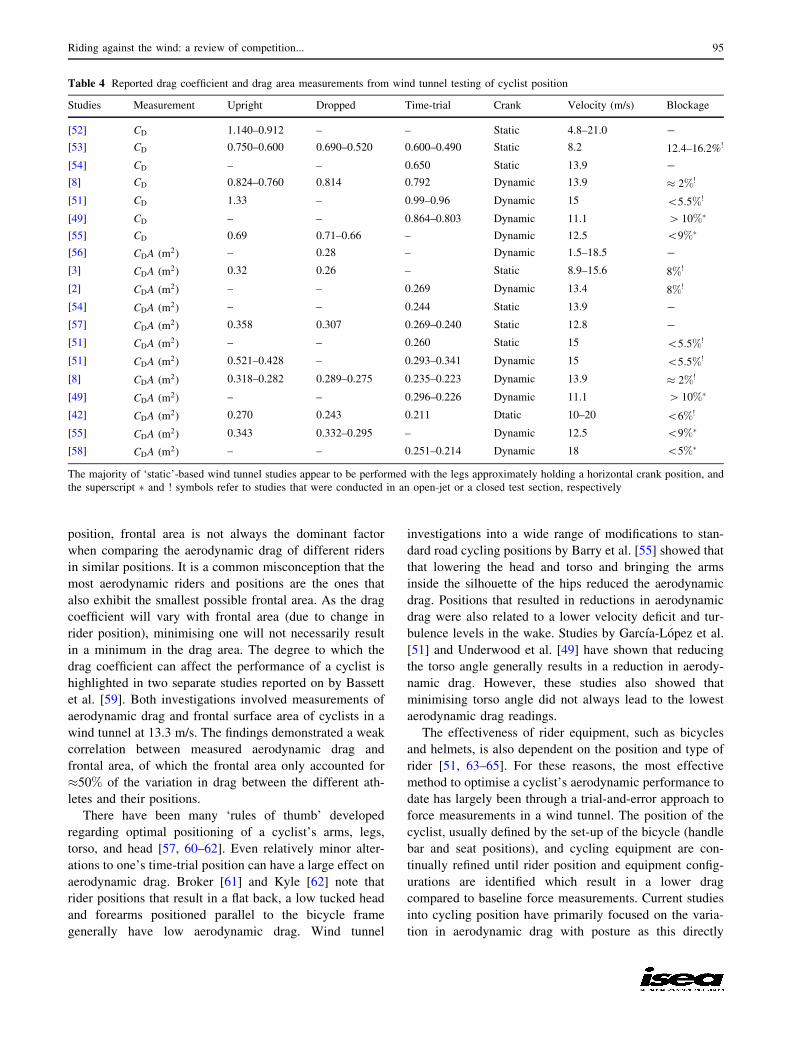
Table 4 Reported drag coefficient and drag area measurements from wind tunnel testing of cyclist position
Studies Measurement Upright Dropped Time-trial Crank Velocity (m/s) Blockage
[52] CD 1.140–0.912 – – Static 4.8–21.0 -
[53] CD 0.750–0.600 0.690–0.520 0.600–0.490 Static 8.2 12.4–16.2%!
[54] CD – – 0.650 Static 13.9 -
[8] CD 0.824–0.760 0.814 0.792 Dynamic 13.9 � 2%!
[51] CD 1.33 – 0.99–0.96 Dynamic 15 \5:5%!
[49] CD – – 0.864–0.803 Dynamic 11.1 [ 10%
[55] CD 0.69 0.71–0.66 – Dynamic 12.5 \9%
[56] CDA (m2) – 0.28 – Dynamic 1.5–18.5 -
[3] CDA (m2) 0.32 0.26 – Static 8.9–15.6 8%!
[2] CDA (m2) – – 0.269 Dynamic 13.4 8%!
[54] CDA (m2) – – 0.244 Static 13.9 -
[57] CDA (m2) 0.358 0.307 0.269–0.240 Static 12.8 -
[51] CDA (m2) – – 0.260 Static 15 \5:5%!
[51] CDA (m2) 0.521–0.428 – 0.293–0.341 Dynamic 15 \5:5%!
[8] CDA (m2) 0.318–0.282 0.289–0.275 0.235–0.223 Dynamic 13.9 � 2%!
[49] CDA (m2) – – 0.296–0.226 Dynamic 11.1 [ 10%
[42] CDA (m2) 0.270 0.243 0.211 Dtatic 10–20 \6%!
[55] CDA (m2) 0.343 0.332–0.295 – Dynamic 12.5 \9%
[58] CDA (m2) – – 0.251–0.214 Dynamic 18 \5%
The majority of ‘static’-based wind tunnel studies appear to be performed with the legs approximately holding a horizontal crank position, and
the superscript and ! symbols refer to studies that were conducted in an open-jet or a closed test section, respectively
Riding against the wind: a review of competition... 95
relates to cycling performance. The direct link between the
measured variations in the aerodynamic drag force and the
flow field around different cyclist geometries is currently
not well understood.
4.2 Cycling equipment—design for aerodynamic
performance
Despite tight UCI regulations on streamlining equipment,
aerodynamics is a major design criterion of elite-level
cycling equipment. The footprints of aerodynamic styling
are embedded all over the designs of bicycle frames, wheels,
helmets, and skin suits. In addition to reducing weight,
improving power transmission, and bicycle stability and
bicycle control, enhanced aerodynamics offers equipment
manufacturers a direct link to increasing rider speed and
improving cycling performance. Savings in aerodynamic
drag due to superior equipment that does not involve altering
rider position are often referred to as ‘free energy’ as per-
formance gains do not require lengthy training programmes
or changes to cycling technique. Although aerodynamic
styling targeting drag reduction is often the most visual and
recognised aspect of streamlined equipment design, aero-
dynamics is also critical to other equipment design criteria.
These include maintaining stability and control during
windy on-road conditions and improving athlete cooling and
heat transfer, which is important for endurance events.
To effectively improve aerodynamic performance,
cycling equipment must be designed for the local flow field
in which it is operating. The true measure of the aerody-
namic performance of equipment is not how well it per-
forms in isolation, but how well it is integrated with the
complete bicycle–rider flow field. Much of the early work
on improving the aerodynamic performance of cycling
equipment was done separately from the rider. There are
many examples where measured aerodynamic savings
resulting from new equipment designs have been signifi-
cantly reduced or are non-existent when the rider is added
to the system [61]. Clearly, the dominant impact of the
rider on the global flow field and flow interactions occur-
ring between equipment and rider must be considered to
effectively optimise equipment and rider aerodynamics.
Performance parameters resulting from studies and equip-
ment designed in isolation of a complete bicycle/rider
system should be treated with caution.
The other main consideration when optimising the aero-
dynamic performance of equipment is the environmental
conditions that will likely be encountered on the road or track.
Road cyclists compete within a turbulent atmospheric
boundary layer that exhibits gusty wind profiles that are rarely
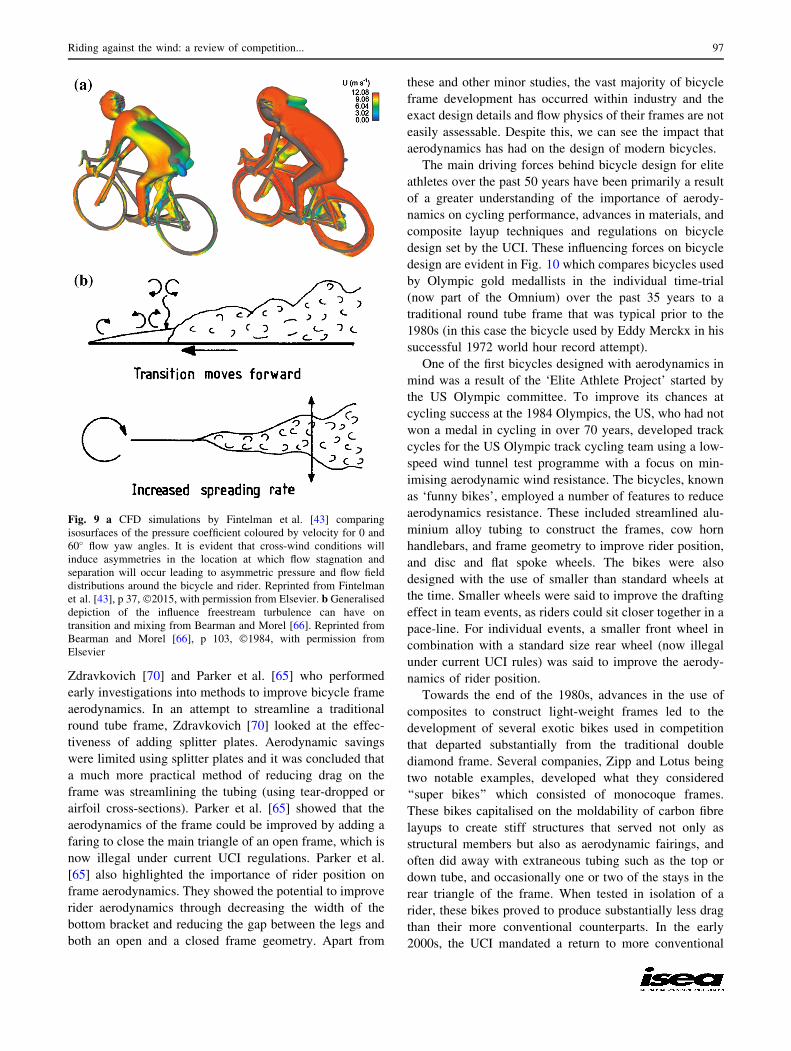
aligned with the direction of travel. Cross-winds result in flow
asymmetries being generated around the bicycle and rider, as
demonstrated in Fig. 9a,which not only affects themagnitude
of the aerodynamic drag force but also generates additional
side forces, rolling, and yaw moments. These forces and
moments can result in a cyclist being unable to maintain
control of their bicycle. Typically, aerodynamic styling to
minimise drag is at odds with reducing aerodynamic side
loads, rolling, and yaw moments and is why aerodynamic
design to minimise these forces and moments is particularly
important at the elite level. Gusty cross-wind conditions have
resulted in a number of elite cyclists losing control during
windy road racing events [67, 68]. Although not as severe as
on the road, cyclists in a velodrome also experience asym-
metric flow conditions when in close proximity to another
athlete orwhile negotiating corners of the track. Recently, this
has led to the development of bicycle frames and wheels by
equipment manufacturers specifically for asymmetric flow
conditions experienced while circling the velodrome [69].
Atmospheric and freestream turbulence characteristics
are another critical aspect of environmental flow field
conditions that can have a significant impact on aerody-
namics performance. Effective design for turbulent ‘on-
road and on-track’ conditions is an area that is not well
understood for complex three-dimensional geometries,
even in much more advanced fields of bluff body aerody-
namics such as road vehicles. In the relatively controlled
environment of the velodrome, cyclists are still embedded
in a turbulent flow field resulting from wind currents
generated by natural or forced convection and also the
decaying remnants of turbulent eddies left in the wakes of
team members and other competitors. The exact mecha-
nisms by which freestream turbulence influences flows
around bluff body aerodynamics are complex and often
difficult to predict. For simple geometries, the effects of
freestream turbulence are known to induce transition to
turbulent boundary layers sooner (effectively reducing the
critical Reynolds number) and increase mixing and
spreading rate characteristics of turbulent wakes, both of
which can have significant implications on the magnitude
of aerodynamic forces. A simplified schematic of these
processes from Bearman and Morel [66] is depicted in
Fig. 9b. Given that current standard practice is to set rider
position and optimise equipment designs in low-speed,
low-turbulence wind tunnels, that in many scenarios will
not be representative of track conditions, techniques and
methods for tailoring equipment aerodynamic performance
for turbulent flow fields are currently not well developed.
4.2.1 Bicycle frames
Surprisingly, little has been published in peer-reviewed
articles that focus specifically on the aerodynamics of
bicycle frames. The most notable exceptions are that of
96 T. N. Crouch et al.
Zdravkovich [70] and Parker et al. [65] who performed
early investigations into methods to improve bicycle frame
aerodynamics. In an attempt to streamline a traditional
round tube frame, Zdravkovich [70] looked at the effec-
tiveness of adding splitter plates. Aerodynamic savings
were limited using splitter plates and it was concluded that
a much more practical method of reducing drag on the
frame was streamlining the tubing (using tear-dropped or
airfoil cross-sections). Parker et al. [65] showed that the
aerodynamics of the frame could be improved by adding a
faring to close the main triangle of an open frame, which is
now illegal under current UCI regulations. Parker et al.
[65] also highlighted the importance of rider position on
frame aerodynamics. They showed the potential to improve
rider aerodynamics through decreasing the width of the
bottom bracket and reducing the gap between the legs and
both an open and a closed frame geometry. Apart from
these and other minor studies, the vast majority of bicycle
frame development has occurred within industry and the
exact design details and flow physics of their frames are not
easily assessable. Despite this, we can see the impact that
aerodynamics has had on the design of modern bicycles.
The main driving forces behind bicycle design for elite
athletes over the past 50 years have been primarily a result
of a greater understanding of the importance of aerody-
namics on cycling performance, advances in materials, and
composite layup techniques and regulations on bicycle
design set by the UCI. These influencing forces on bicycle
design are evident in Fig. 10 which compares bicycles used
by Olympic gold medallists in the individual time-trial
(now part of the Omnium) over the past 35 years to a
traditional round tube frame that was typical prior to the
1980s (in this case the bicycle used by Eddy Merckx in his
successful 1972 world hour record attempt).
One of the first bicycles designed with aerodynamics in
mind was a result of the ‘Elite Athlete Project’ started by
the US Olympic committee. To improve its chances at
cycling success at the 1984 Olympics, the US, who had not
won a medal in cycling in over 70 years, developed track
cycles for the US Olympic track cycling team using a low-
speed wind tunnel test programme with a focus on min-
imising aerodynamic wind resistance. The bicycles, known
as ‘funny bikes’, employed a number of features to reduce
aerodynamics resistance. These included streamlined alu-
minium alloy tubing to construct the frames, cow horn
handlebars, and frame geometry to improve rider position,
and disc and flat spoke wheels. The bikes were also
designed with the use of smaller than standard wheels at
the time. Smaller wheels were said to improve the drafting
effect in team events, as riders could sit closer together in a
pace-line. For individual events, a smaller front wheel in
combination with a standard size rear wheel (now illegal
under current UCI rules) was said to improve the aerody-
namics of rider position.
Towards the end of the 1980s, advances in the use of
composites to construct light-weight frames led to the
development of several exotic bikes used in competition
that departed substantially from the traditional double
diamond frame. Several companies, Zipp and Lotus being
two notable examples, developed what they considered
‘‘super bikes’’ which consisted of monocoque frames.
These bikes capitalised on the moldability of carbon fibre
layups to create stiff structures that served not only as
structural members but also as aerodynamic fairings, and
often did away with extraneous tubing such as the top or
down tube, and occasionally one or two of the stays in the
rear triangle of the frame. When tested in isolation of a
rider, these bikes proved to produce substantially less drag
than their more conventional counterparts. In the early
2000s, the UCI mandated a return to more conventional
Fig. 9 a CFD simulations by Fintelman et al. [43] comparing
isosurfaces of the pressure coefficient coloured by velocity for 0 and
60� flow yaw angles. It is evident that cross-wind conditions will
induce asymmetries in the location at which flow stagnation and
separation will occur leading to asymmetric pressure and flow field
distributions around the bicycle and rider. Reprinted from Fintelman
et al. [43], p 37,�2015, with permission from Elsevier. b Generalised
depiction of the influence freestream turbulence can have on
transition and mixing from Bearman and Morel [66]. Reprinted from
Bearman and Morel [66], p 103, �1984, with permission from
Elsevier
Riding against the wind: a review of competition... 97
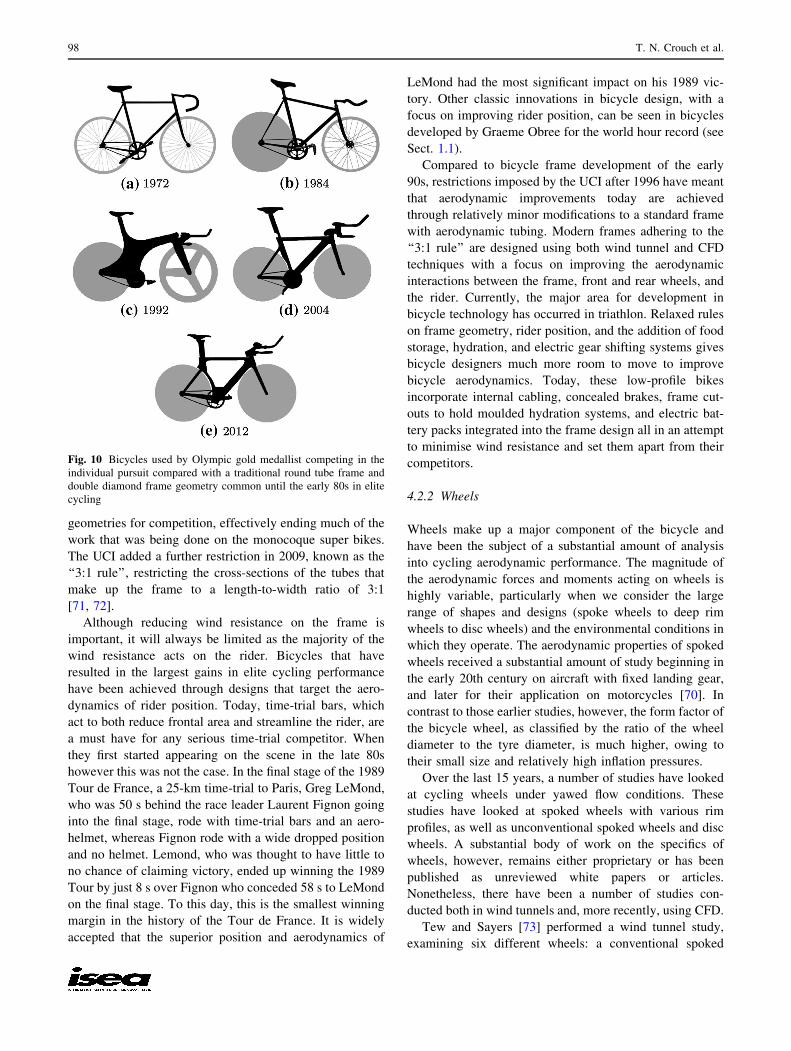
geometries for competition, effectively ending much of the
work that was being done on the monocoque super bikes.
The UCI added a further restriction in 2009, known as the
‘‘3:1 rule’’, restricting the cross-sections of the tubes that
make up the frame to a length-to-width ratio of 3:1
[71, 72].
Although reducing wind resistance on the frame is
important, it will always be limited as the majority of the
wind resistance acts on the rider. Bicycles that have
resulted in the largest gains in elite cycling performance
have been achieved through designs that target the aero-
dynamics of rider position. Today, time-trial bars, which
act to both reduce frontal area and streamline the rider, are
a must have for any serious time-trial competitor. When
they first started appearing on the scene in the late 80s
however this was not the case. In the final stage of the 1989
Tour de France, a 25-km time-trial to Paris, Greg LeMond,
who was 50 s behind the race leader Laurent Fignon going
into the final stage, rode with time-trial bars and an aero-
helmet, whereas Fignon rode with a wide dropped position
and no helmet. Lemond, who was thought to have little to
no chance of claiming victory, ended up winning the 1989
Tour by just 8 s over Fignon who conceded 58 s to LeMond
on the final stage. To this day, this is the smallest winning
margin in the history of the Tour de France. It is widely
accepted that the superior position and aerodynamics of
LeMond had the most significant impact on his 1989 vic-
tory. Other classic innovations in bicycle design, with a
focus on improving rider position, can be seen in bicycles
developed by Graeme Obree for the world hour record (see
Sect. 1.1).
Compared to bicycle frame development of the early
90s, restrictions imposed by the UCI after 1996 have meant
that aerodynamic improvements today are achieved
through relatively minor modifications to a standard frame
with aerodynamic tubing. Modern frames adhering to the
‘‘3:1 rule’’ are designed using both wind tunnel and CFD
techniques with a focus on improving the aerodynamic
interactions between the frame, front and rear wheels, and
the rider. Currently, the major area for development in
bicycle technology has occurred in triathlon. Relaxed rules
on frame geometry, rider position, and the addition of food
storage, hydration, and electric gear shifting systems gives
bicycle designers much more room to move to improve
bicycle aerodynamics. Today, these low-profile bikes
incorporate internal cabling, concealed brakes, frame cut-
outs to hold moulded hydration systems, and electric bat-
tery packs integrated into the frame design all in an attempt
to minimise wind resistance and set them apart from their
competitors.
4.2.2 Wheels
Wheels make up a major component of the bicycle and
have been the subject of a substantial amount of analysis
into cycling aerodynamic performance. The magnitude of
the aerodynamic forces and moments acting on wheels is
highly variable, particularly when we consider the large
range of shapes and designs (spoke wheels to deep rim
wheels to disc wheels) and the environmental conditions in
which they operate. The aerodynamic properties of spoked
wheels received a substantial amount of study beginning in
the early 20th century on aircraft with fixed landing gear,
and later for their application on motorcycles [70]. In
contrast to those earlier studies, however, the form factor of
the bicycle wheel, as classified by the ratio of the wheel
diameter to the tyre diameter, is much higher, owing to
their small size and relatively high inflation pressures.
Over the last 15 years, a number of studies have looked
at cycling wheels under yawed flow conditions. These
studies have looked at spoked wheels with various rim
profiles, as well as unconventional spoked wheels and disc
wheels. A substantial body of work on the specifics of
wheels, however, remains either proprietary or has been
published as unreviewed white papers or articles.
Nonetheless, there have been a number of studies con-
ducted both in wind tunnels and, more recently, using CFD.
Tew and Sayers [73] performed a wind tunnel study,
examining six different wheels: a conventional spoked
Fig. 10 Bicycles used by Olympic gold medallist competing in the
individual pursuit compared with a traditional round tube frame and
double diamond frame geometry common until the early 80s in elite
cycling
98 T. N. Crouch et al.
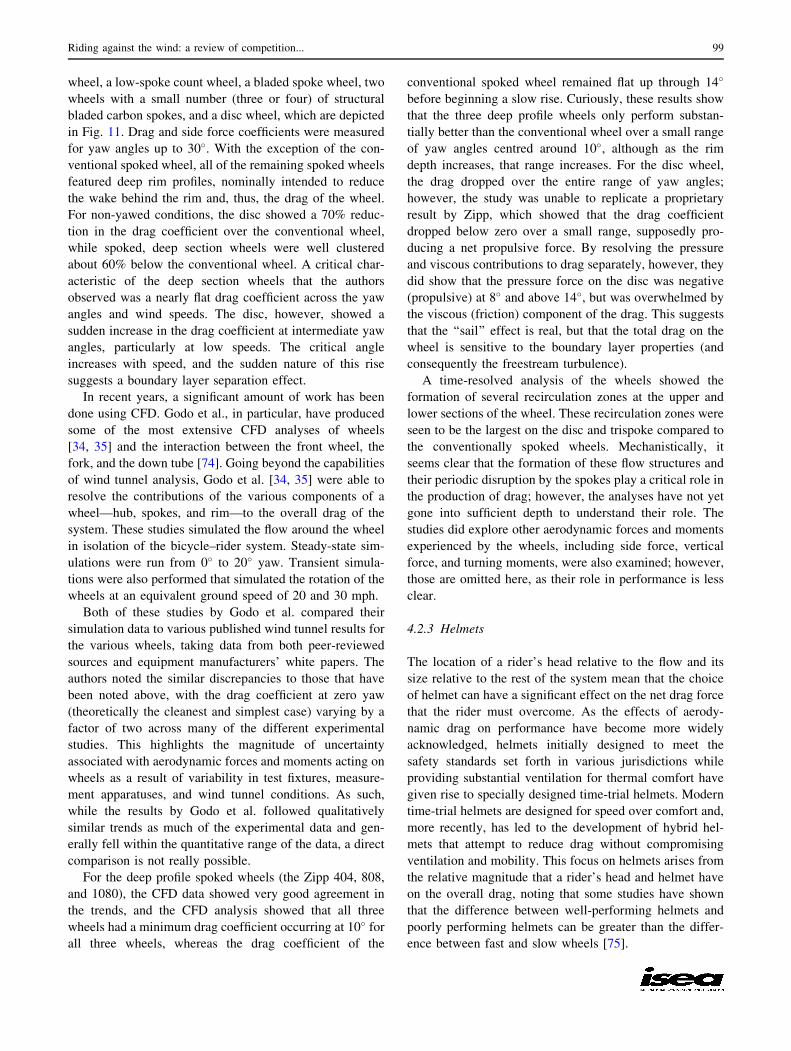
wheel, a low-spoke count wheel, a bladed spoke wheel, two
wheels with a small number (three or four) of structural
bladed carbon spokes, and a disc wheel, which are depicted
in Fig. 11. Drag and side force coefficients were measured
for yaw angles up to 30�. With the exception of the con-
ventional spoked wheel, all of the remaining spoked wheels
featured deep rim profiles, nominally intended to reduce
the wake behind the rim and, thus, the drag of the wheel.
For non-yawed conditions, the disc showed a 70% reduc-
tion in the drag coefficient over the conventional wheel,
while spoked, deep section wheels were well clustered
about 60% below the conventional wheel. A critical char-
acteristic of the deep section wheels that the authors
observed was a nearly flat drag coefficient across the yaw
angles and wind speeds. The disc, however, showed a
sudden increase in the drag coefficient at intermediate yaw
angles, particularly at low speeds. The critical angle
increases with speed, and the sudden nature of this rise
suggests a boundary layer separation effect.
In recent years, a significant amount of work has been
done using CFD. Godo et al., in particular, have produced
some of the most extensive CFD analyses of wheels
[34, 35] and the interaction between the front wheel, the
fork, and the down tube [74]. Going beyond the capabilities
of wind tunnel analysis, Godo et al. [34, 35] were able to
resolve the contributions of the various components of a
wheel—hub, spokes, and rim—to the overall drag of the
system. These studies simulated the flow around the wheel
in isolation of the bicycle–rider system. Steady-state sim-
ulations were run from 0� to 20� yaw. Transient simula-
tions were also performed that simulated the rotation of the
wheels at an equivalent ground speed of 20 and 30 mph.
Both of these studies by Godo et al. compared their
simulation data to various published wind tunnel results for
the various wheels, taking data from both peer-reviewed
sources and equipment manufacturers’ white papers. The
authors noted the similar discrepancies to those that have
been noted above, with the drag coefficient at zero yaw
(theoretically the cleanest and simplest case) varying by a
factor of two across many of the different experimental
studies. This highlights the magnitude of uncertainty
associated with aerodynamic forces and moments acting on
wheels as a result of variability in test fixtures, measure-
ment apparatuses, and wind tunnel conditions. As such,
while the results by Godo et al. followed qualitatively
similar trends as much of the experimental data and gen-
erally fell within the quantitative range of the data, a direct
comparison is not really possible.
For the deep profile spoked wheels (the Zipp 404, 808,
and 1080), the CFD data showed very good agreement in
the trends, and the CFD analysis showed that all three
wheels had a minimum drag coefficient occurring at 10� forall three wheels, whereas the drag coefficient of the
conventional spoked wheel remained flat up through 14�
before beginning a slow rise. Curiously, these results show
that the three deep profile wheels only perform substan-
tially better than the conventional wheel over a small range
of yaw angles centred around 10�, although as the rim
depth increases, that range increases. For the disc wheel,
the drag dropped over the entire range of yaw angles;
however, the study was unable to replicate a proprietary
result by Zipp, which showed that the drag coefficient
dropped below zero over a small range, supposedly pro-
ducing a net propulsive force. By resolving the pressure
and viscous contributions to drag separately, however, they
did show that the pressure force on the disc was negative
(propulsive) at 8� and above 14�, but was overwhelmed by
the viscous (friction) component of the drag. This suggests
that the ‘‘sail’’ effect is real, but that the total drag on the
wheel is sensitive to the boundary layer properties (and
consequently the freestream turbulence).
A time-resolved analysis of the wheels showed the
formation of several recirculation zones at the upper and
lower sections of the wheel. These recirculation zones were
seen to be the largest on the disc and trispoke compared to
the conventionally spoked wheels. Mechanistically, it
seems clear that the formation of these flow structures and
their periodic disruption by the spokes play a critical role in
the production of drag; however, the analyses have not yet
gone into sufficient depth to understand their role. The
studies did explore other aerodynamic forces and moments
experienced by the wheels, including side force, vertical
force, and turning moments, were also examined; however,
those are omitted here, as their role in performance is less
clear.
4.2.3 Helmets
The location of a rider’s head relative to the flow and its
size relative to the rest of the system mean that the choice
of helmet can have a significant effect on the net drag force
that the rider must overcome. As the effects of aerody-
namic drag on performance have become more widely
acknowledged, helmets initially designed to meet the
safety standards set forth in various jurisdictions while
providing substantial ventilation for thermal comfort have
given rise to specially designed time-trial helmets. Modern
time-trial helmets are designed for speed over comfort and,
more recently, has led to the development of hybrid hel-
mets that attempt to reduce drag without compromising
ventilation and mobility. This focus on helmets arises from
the relative magnitude that a rider’s head and helmet have
on the overall drag, noting that some studies have shown
that the difference between well-performing helmets and
poorly performing helmets can be greater than the differ-
ence between fast and slow wheels [75].
Riding against the wind: a review of competition... 99
Long-tailed helmets, which cover the rider’s head in an
elongated fairing, have been the subject of several studies
that have compared different helmets, as well as the
manner in which they are worn as well as their context
(geometry of the rider’s head and back). Blair and Sidelko
[63] conducted an experimental investigation of 14 time-
trial helmets (accounting for helmets that came with a
detachable visor) using a mannequin that represented the
upper body of a cyclist at several different yaw angles
[75]. In addition, the helmets were mounted in three
positions, based on the inclination of the leading edge.
The results showed a global reduction in drag of up to
10% for well-performing helmets compared to poorly
performing helmets. Extremely high inclination angles
resulted in high drag across the board; however, no
mechanistic correlation between helmet design and per-
formance was identified.
Chabroux et al. [64] further showed that there is a strong
interaction between the posture of the rider (comparing a
more upright road posture with a low time-trial posture)
Fig. 11 Various commercially
available wheel designs tested
for aerodynamic properties by
Tew and Sayers [73], including
a traditional 36-spoke, b 16-
spoke, c 12-spoke, d quad-
blade-spoke, e tri-blade-spoke,
and f disc wheel designs.
Reprinted from Tew and Sayers
[73], p 213, �1999, with
permission from Elsevier
100 T. N. Crouch et al.

and the drag force on the helmet. The study further showed
that while a visor has a statistically significant effect,
reducing the drag of the helmet, forward-facing vents do
not tend to result in a drag penalty. Brownlie et al. [76],
however, showed several cases in which the visor (or
sunglasses) resulted in a slight increase in drag. Further-
more, this study showed that while, in general, a time-trial
helmet has superior aerodynamics to a more conventional
helmet, a time-trial helmet also produces less drag than a
bare mannequin head. (With the absence of rough features
and the like, a mannequin’s head can be reasonably
assumed to have a lower drag coefficient than an actual
human head.)
Chabroux et al. [25] conducted a more detailed wind
tunnel investigation using particle image velocimetry to
investigate the wake structure behind three long-tailed
time-trial helmets. The study experimentally showed the
time-averaged velocity deficit behind these three helmets
(all of which produced similar total drag); however, in the
absence of a comparison to other helmets with substantially
different characteristics, the authors were not able to pre-
sent a mechanistic story of the drag characteristics.
The particular geometry of any particular helmet, as
well as the geometry of the riders head and upper back,
limits the ability to make generalisations about helmet
design. While streamlined shapes are a clear advantage,
small geometric effects, as well as visors, can positively or
negatively influence the drag force on the helmet,
depending on the rider’s posture and shape. Careful
placement of vents allows for some measure of cooling in
time-trial helmets without significantly compromising their
performance.
4.2.4 Skin suits
Textured fabrics have been used to improve the aerody-
namic performance of many high-velocity sporting disci-
plines, most notably skiing, speed skating, and cycling. The
fundamental flow mechanism responsible for aerodynamic
performance gains using textured skin suits is the delay or
movement of the separation point towards the back of the
body. This effectively reduces the size of the wake leading
to increases in wake pressures and reductions in the pres-
sure drag component of the aerodynamic resistance.
In one of the first detailed investigations into skin suit
aerodynamics and design, Brownlie et al. [26, 79]
demonstrated the potential to improve cycling performance
using a range of textured fabrics to treat specific areas of
the body. The relative texture of fabrics is dependent on a
number of parameters, such as yarn type and material,
stitch pattern and density, thickness, cover factor, porosity,
seam positioning, coatings, and fabric tension. All of these
variables have been shown to be important when
considering the aerodynamic performance of skin suits
[80–83]. Using a range of textured fabrics ([ 200),
Brownlie et al. [26] performed wind tunnel experiments
with cylinders, full-scale leg models, and pedalling athletes
that revealed a number of aspects of skin suit design critical
to aerodynamic performance. These include the following:
– The arms and legs exhibit transitional type behaviour
for Re relevant to cycling.
– The motion of the legs throughout the pedal stroke
combined with turbulence generated from upstream
components of the bicycle and body reduce the
effectiveness of textured fabrics to induce drag crisis
on any part of the legs.
– In areas of attached flow, smooth fabrics should be used
to target reducing skin friction.
– In areas of completely separated flow, such as the lower
back, surface texture has a negligible effect on
aerodynamic drag and any appropriate fabric may be
utilised.
– Reductions in aerodynamic resistance can be accom-
plished through tight fitting apparel with few wrinkles
and aligning seams with the airflow.
Using these points to guide fabric selection, wind tunnel
testing with a pedalling cyclist holding a time-trial position
showed that aerodynamic drag could be reduced by �4%
using up to five fabrics to construct skin suits, compared to
traditional suits not optimised for aerodynamic perfor-
mance that typically used 1–2 different fabrics.
Critical to understanding the aerodynamic performance
of skin suits is the process by which turbulence can be
induced at lower Reynolds numbers. As the human body
has components that resemble cylindrical cross-sections,
modern skin suit development has its foundations deeply
rooted in early work into the laminar–turbulent transition
process of flows around, and the aerodynamic drag acting
on, circular cylinders. It is noted in Sect. 2 that a turbulent
boundary layer is less susceptible to flow separation over
curved surfaces. Figure 12a reproduces results from
Achenbach [77] who investigated the influence of the
surface texture of circular cylinders in a pure cross flow on
aerodynamic drag as a function of Re (where the cylinder
diameter is the characteristic length scale). Achenbach’s
findings show that not only is the drag coefficient a func-
tion of the Re number but also the surface texture. With
increasing surface roughness, defined by the roughness
parameter k (ratio of the roughness height to the width of
the body), the minimum drag coefficient CD;min or the
critical point at which drag crisis is said to have occurred is
shifted towards lower critical Reynolds numbers Rec. One
also notes that with increasing surface roughness the CD;min
increases and that for Re[Rec the drag coefficient is
higher for cylinders treated with a rougher surface finish.
Riding against the wind: a review of competition... 101

As with cylindrical geometries, the aerodynamic drag
acting on body components (particularly the arms and legs)
also displays similar dependence on Re and surface texture.
When optimising skin suit design, the choice of fabric will
depend on the size of the athlete wearing the suit, cycling
speed, air properties, and UCI regulations governing
allowable fabrics. Modelling the body as a composite of
simple geometries in isolation of one another in a pure
cross flow has a number of limitations when attempting to
minimise aerodynamic drag. This simplification does not
take into account flow interactions between limbs and body
parts and the influence the motion of the legs has on the
flow field around the body.
In addition to this, the relative orientation of limbs, the
wind angle, and freestream turbulence levels have all been
shown to be the relevant factors when reducing aerody-
namic drag [84, 85]. The influence of freestream turbulence
intensity on the critical Re on two-dimensional cylinders is
shown in Fig. 12b, from the work of Fage and Warsap [78].
One finds that for increasing freestream turbulence inten-
sity the transition process which leads to drag crisis occurs
at lower Rec. (Note: Intensity is only one characteristic of
turbulence that is of importance to bluff body flows. The
geometric characteristics and relevant length scales of
turbulence are also important to transition and mixing
processes.) The defining characteristics of turbulence
experienced on the road and track are currently not well
understood. As skin suit aerodynamics is sensitive to the
wind environment, the size, position, and shape of the
rider, there is no one skin suit that will have texture opti-
mised for all cycling conditions, athletes, and cycling
positions.
5 Multi-rider aerodynamics and drafting
The ability of the riders to shelter themselves in the wake
of others (known as drafting), and thereby reduce their
own drag, is one of the defining aspects of most bicycle
racing (with the exception of individual timed events such
as time-trials and individual pursuits). The addition of
other riders, however, has received little prior attention
due to the complexity of the problem, sensitivity of the
results, and difficulty in carrying out experiments and
computations. In other fields of bluff body aerodynamics
ranging from simplified 2D cylinders, surface-mounted
cubes, and more complex bluff body geometries such as
racing cars, interaction effects between flows around
multiple bodies are known to influence the aerodynamic
force on both trailing and upwind bodies [86–92]. Over
the past decade, advances in computing power and
experimental techniques have opened up a line of enquiry
into drafting effects in cycling, and in particular the team
pursuit has provided the motivation to study multi-rider
aerodynamics.
In the team pursuit, two teams of four riders compete by
attempting to cover 4 km on the track in the fastest possible
time. Team time-trials on the road are run in a similar
configuration, often with up to nine riders on a team
competing to complete a course in the fastest time. As both
of these events are cooperative, the riders seek to both
minimise their own drag and provide shelter to the other
riders on the team. This is demonstrated in Fig. 13 which
shows a wind tunnel smoke flow visualisation of a member
Fig. 12 a The drag coefficient of 2D circular cylinder of varying
surface texture as a function of Re, reproduced from Achenbach [77].
The variation in CD is related to changes in the flow regime around
cylinders. The main flow regimes are labelled for the smoothest
cylinder which is highlighted in red. Schematics demonstrate the
relative difference in the wake width between a subcritical regime and
the point at which drag crisis is said to have occurred. The actual flow
topology of each regime is much richer than what has been depicted
here. A summary of the various flow regimes and a more detailed
description of the nature of the flow around cylinders for each regime
can be found in Tropea et al. [6]. b Results reproduced from Fage and
Warsap [78], who conducted some of the earliest studies into the
influence of freestream turbulence on the drag coefficient and critical
Re of 2D circular cylinders (colour figure online)
102 T. N. Crouch et al.
of a team pursuit team drafting in the wake of the lead
rider. Studies focusing on these cooperative race schemes
have sought to primarily answer four questions: how the
aerodynamic drag force varies as a function of spacing
from the lead rider, how much drag reduction do the
multiple trailing riders experience, does the lead rider also
experience a drag reduction, and what are the sensitivities
of these results?
Studies addressing the influence of drafting distance on
the aerodynamics drag of a single trailing rider are sum-
marised in Fig. 14a. For a trailing cyclist positioned
immediately behind the leader, drag reduction has been
reported in the range of 15–50% and reduces to 10–30% as
the gap extends to approximately a bike length. All find-
ings show a relatively linear increase in CDA of the trailing
rider as the drafting gap is extended until the point at which
the drag approaches the isolated rider value. This type of
behaviour has previously been observed with other drafting
bluff bodies such as racing cars [90]. Perhaps surprisingly
recent investigations by Barry et al. [93] show that the
wake of a trailing cyclists remains largely unchanged
compared to the wake of an isolated rider. This is despite
significant differences in upstream flow conditions that
exist for isolated and trailing riders and highlights the
robustness of the formation of the large-scale wake
vortices.
It can be observed from Fig. 14a that although similar
trends exist, large variations in the magnitude of the
aerodynamic savings due to drafting are evident between
the studies. In addition to the variability resulting from the
different analysis techniques that have been utilised (pre-
viously discussed in Sect. 3), current literature suggests a
number of reasons for these variations. The main con-
tributing factors accounting for these variations are dif-
ferences in the relative size, shape, and position between
lead and drafting athletes and drafting skill (ability to
maintain drafting gap and hold in-line position).
Kyle [94] was one of the first to establish a relationship
between aerodynamic drag and in-line drafting distance
using the coast down method. Tests were performed with
a number of athletes over a 200-m coast down track which
resulted in the relationship reproduced in Fig. 14a.
Although no quantitative analysis of the variability of the
coast down test was provided, it was noted that large
variation in the data was present. This was likely due to
the inability of the drafting riders to maintain a constant
separation distance and axial alignment with the lead
rider, an inherent issue with this sort of test technique. As
drafting riders experience lower resistive forces than the
lead rider, they will tend to decelerate at a lower rate.
Despite the uncertainties associated with the coast down
method to investigate drafting effects, the findings of Kyle
[94] agree reasonably well with much more recent studies
conducted in the controlled environment of a wind tunnel
[95].
Edwards and Byrnes [96] attempted to address how
individual rider characteristics influence the drafting effect.
The study found that not only is the drag area of the leader
of critical importance, with a greater drag area (for the lead
cyclist) corresponding to a greater drafting effect, but there
appeared to be some interaction between the particular lead
and trailing cyclists. The authors were unable to strongly
correlate this interaction with anthropometric measure-
ments of either the lead or drafting rider and postulated
that, beyond drag area, drafting skill was the most probably
one of the dominant factors determining the magnitude of
the drafting effect.
In an effort to remove drafting skill from the equation,
both Zdravkovich et al. [53] and Barry et al. [95] investi-
gated the influence of drafting on aerodynamic forces in
controlled wind tunnel experiments (see Fig. 14). Both
studies note the importance of the drafting effect on the
shape, size, and position of the riders. Despite differences
in rider position between studies, the findings of Zdrav-
kovich et al. [53] show a much more rapid decay of the
drafting effect with separation distance compared to Barry
et al. [95] and other relationships established in literature.
It is evident that the findings of Zdravkovich would have
been significantly influenced by wind tunnel blockage
effects ([15%) due to the small closed wind tunnel test
section in which experiments were performed. It is not
reported whether these findings considered the close
proximity of the wind tunnel walls to the test subjects.
In addition to characterising drag savings of in-line
riders, both of these investigations also studied lateral
offset positions of the trailing rider. Although the magni-
tudes differ substantially, both studies show a relative
decrease in aerodynamic drag savings of the order of
30–10% for a 0.2 m lateral offset as axial spacing increases
from �0 to 1 m. For overtaking manoeuvres, or more
generally when riders are positioned alongside one another,
Barry et al.’s [95] quasi-static results also showed that the
relationship between aerodynamic drag and rider position
is more complex compared to when the trailing rider is
positioned aft of a leader’s rear wheel. As a result of
interference effects between riders, at certain positions
throughout a relatively close overtaking manoeuvre, both
riders actually experience an increase in aerodynamic drag
of the order of 6% relative to their isolated drag numbers.
This type of behaviour has also been observed in the
aerodynamics of racing car manoeuvres [90] and also
simpler bluff body geometries such as 2D cylinders [86].
Blocken et al. [37] set out to investigate the effect of
drafting on both trailing and lead riders using a full 3D
CFD simulation of a multi-rider pace-line. The CFD sim-
ulations were performed for a lead and trailing rider in
Riding against the wind: a review of competition... 103
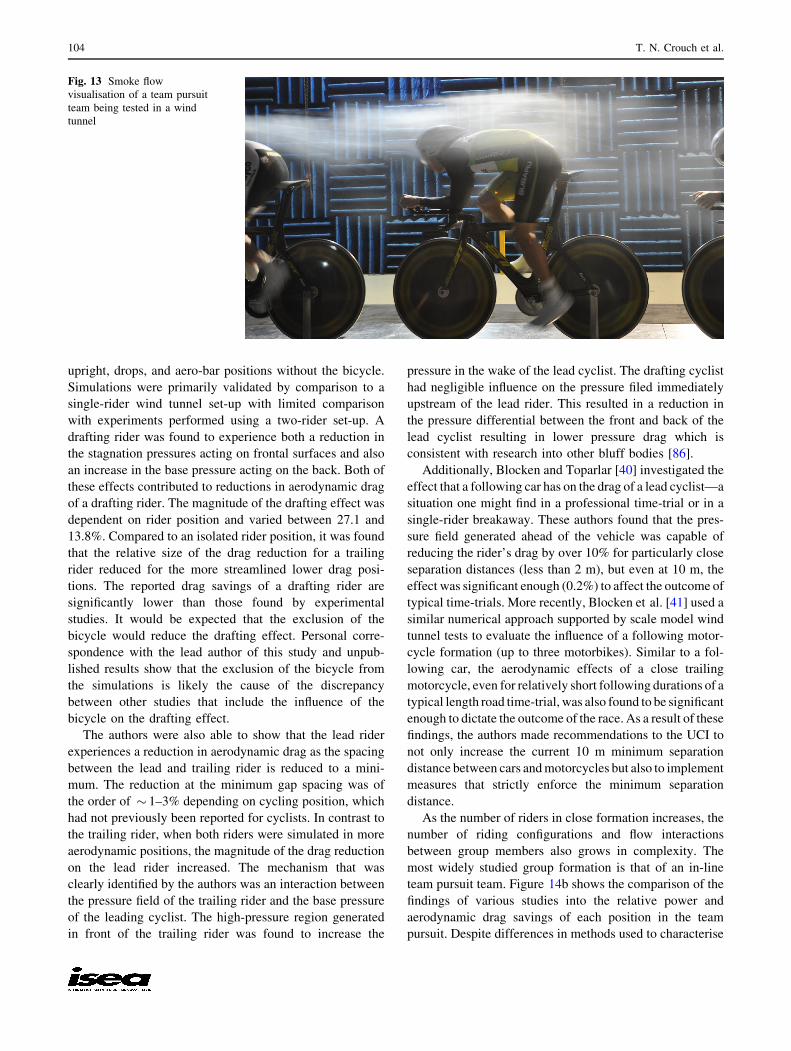
upright, drops, and aero-bar positions without the bicycle.
Simulations were primarily validated by comparison to a
single-rider wind tunnel set-up with limited comparison
with experiments performed using a two-rider set-up. A
drafting rider was found to experience both a reduction in
the stagnation pressures acting on frontal surfaces and also
an increase in the base pressure acting on the back. Both of
these effects contributed to reductions in aerodynamic drag
of a drafting rider. The magnitude of the drafting effect was
dependent on rider position and varied between 27.1 and
13.8%. Compared to an isolated rider position, it was found
that the relative size of the drag reduction for a trailing
rider reduced for the more streamlined lower drag posi-
tions. The reported drag savings of a drafting rider are
significantly lower than those found by experimental
studies. It would be expected that the exclusion of the
bicycle would reduce the drafting effect. Personal corre-
spondence with the lead author of this study and unpub-
lished results show that the exclusion of the bicycle from
the simulations is likely the cause of the discrepancy
between other studies that include the influence of the
bicycle on the drafting effect.
The authors were also able to show that the lead rider
experiences a reduction in aerodynamic drag as the spacing
between the lead and trailing rider is reduced to a mini-
mum. The reduction at the minimum gap spacing was of
the order of � 1–3% depending on cycling position, which
had not previously been reported for cyclists. In contrast to
the trailing rider, when both riders were simulated in more
aerodynamic positions, the magnitude of the drag reduction
on the lead rider increased. The mechanism that was
clearly identified by the authors was an interaction between
the pressure field of the trailing rider and the base pressure
of the leading cyclist. The high-pressure region generated
in front of the trailing rider was found to increase the
pressure in the wake of the lead cyclist. The drafting cyclist
had negligible influence on the pressure filed immediately
upstream of the lead rider. This resulted in a reduction in
the pressure differential between the front and back of the
lead cyclist resulting in lower pressure drag which is
consistent with research into other bluff bodies [86].
Additionally, Blocken and Toparlar [40] investigated the
effect that a following car has on the drag of a lead cyclist—a
situation one might find in a professional time-trial or in a
single-rider breakaway. These authors found that the pres-
sure field generated ahead of the vehicle was capable of
reducing the rider’s drag by over 10% for particularly close
separation distances (less than 2 m), but even at 10 m, the
effect was significant enough (0.2%) to affect the outcome of
typical time-trials. More recently, Blocken et al. [41] used a
similar numerical approach supported by scale model wind
tunnel tests to evaluate the influence of a following motor-
cycle formation (up to three motorbikes). Similar to a fol-
lowing car, the aerodynamic effects of a close trailing
motorcycle, even for relatively short following durations of a
typical length road time-trial, was also found to be significant
enough to dictate the outcome of the race. As a result of these
findings, the authors made recommendations to the UCI to
not only increase the current 10 m minimum separation
distance between cars andmotorcycles but also to implement
measures that strictly enforce the minimum separation
distance.
As the number of riders in close formation increases, the
number of riding configurations and flow interactions
between group members also grows in complexity. The
most widely studied group formation is that of an in-line
team pursuit team. Figure 14b shows the comparison of the
findings of various studies into the relative power and
aerodynamic drag savings of each position in the team
pursuit. Despite differences in methods used to characterise
Fig. 13 Smoke flow
visualisation of a team pursuit
team being tested in a wind
tunnel
104 T. N. Crouch et al.
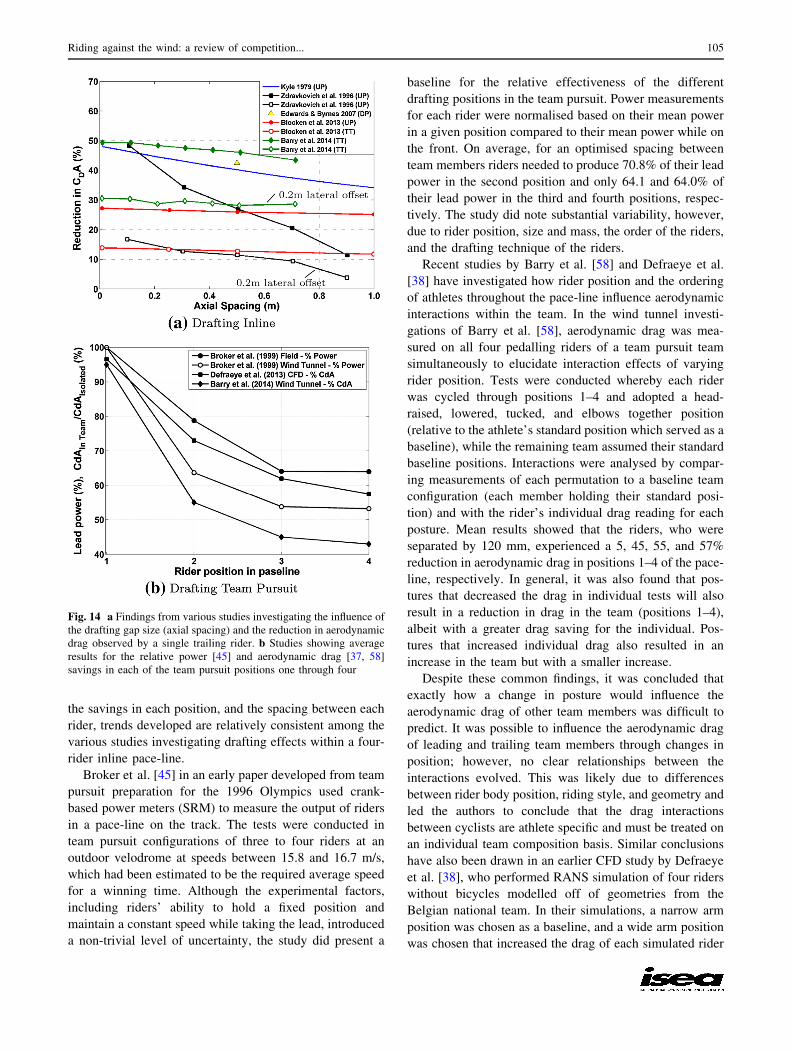
the savings in each position, and the spacing between each
rider, trends developed are relatively consistent among the
various studies investigating drafting effects within a four-
rider inline pace-line.
Broker et al. [45] in an early paper developed from team
pursuit preparation for the 1996 Olympics used crank-
based power meters (SRM) to measure the output of riders
in a pace-line on the track. The tests were conducted in
team pursuit configurations of three to four riders at an
outdoor velodrome at speeds between 15.8 and 16.7 m/s,
which had been estimated to be the required average speed
for a winning time. Although the experimental factors,
including riders’ ability to hold a fixed position and
maintain a constant speed while taking the lead, introduced
a non-trivial level of uncertainty, the study did present a
baseline for the relative effectiveness of the different
drafting positions in the team pursuit. Power measurements
for each rider were normalised based on their mean power
in a given position compared to their mean power while on
the front. On average, for an optimised spacing between
team members riders needed to produce 70.8% of their lead
power in the second position and only 64.1 and 64.0% of
their lead power in the third and fourth positions, respec-
tively. The study did note substantial variability, however,
due to rider position, size and mass, the order of the riders,
and the drafting technique of the riders.
Recent studies by Barry et al. [58] and Defraeye et al.
[38] have investigated how rider position and the ordering
of athletes throughout the pace-line influence aerodynamic
interactions within the team. In the wind tunnel investi-
gations of Barry et al. [58], aerodynamic drag was mea-
sured on all four pedalling riders of a team pursuit team
simultaneously to elucidate interaction effects of varying
rider position. Tests were conducted whereby each rider
was cycled through positions 1–4 and adopted a head-
raised, lowered, tucked, and elbows together position
(relative to the athlete’s standard position which served as a
baseline), while the remaining team assumed their standard
baseline positions. Interactions were analysed by compar-
ing measurements of each permutation to a baseline team
configuration (each member holding their standard posi-
tion) and with the rider’s individual drag reading for each
posture. Mean results showed that the riders, who were
separated by 120 mm, experienced a 5, 45, 55, and 57%
reduction in aerodynamic drag in positions 1–4 of the pace-
line, respectively. In general, it was also found that pos-
tures that decreased the drag in individual tests will also
result in a reduction in drag in the team (positions 1–4),
albeit with a greater drag saving for the individual. Pos-
tures that increased individual drag also resulted in an
increase in the team but with a smaller increase.
Despite these common findings, it was concluded that
exactly how a change in posture would influence the
aerodynamic drag of other team members was difficult to
predict. It was possible to influence the aerodynamic drag
of leading and trailing team members through changes in
position; however, no clear relationships between the
interactions evolved. This was likely due to differences
between rider body position, riding style, and geometry and
led the authors to conclude that the drag interactions
between cyclists are athlete specific and must be treated on
an individual team composition basis. Similar conclusions
have also been drawn in an earlier CFD study by Defraeye
et al. [38], who performed RANS simulation of four riders
without bicycles modelled off of geometries from the
Belgian national team. In their simulations, a narrow arm
position was chosen as a baseline, and a wide arm position
was chosen that increased the drag of each simulated rider
Fig. 14 a Findings from various studies investigating the influence of
the drafting gap size (axial spacing) and the reduction in aerodynamic
drag observed by a single trailing rider. b Studies showing average
results for the relative power [45] and aerodynamic drag [37, 58]
savings in each of the team pursuit positions one through four
Riding against the wind: a review of competition... 105
to assess the effect of a wider wake on the entire pace-line.
It was noted that three of the riders had very similar
measured drag area (within 2%), whereas the fourth rider
had a nearly 25% greater drag area. The authors went on to
show that for each of the three riders with similar drag
areas, the manner in which the drag area was produced
(that is, which parts of their bodies produced the most drag)
varied considerably.
In the wake of reasonably well-established trends in the
drafting effect on the riders in a pace-line, including the
lead rider, the influence of individual rider variability is
only slowly being elucidated. Despite the difficulty of
developing generally applicable quantitative correlations,
several robust heuristics have emerged from the last decade
of multi-rider aerodynamics research:
1. The lead rider in a pace-line does experience a small
reduction in drag, of the order of 5% or less compared
to their baseline solo performance. This effect is a
result of the high-pressure region in the front of the
first trailing rider increasing the pressure in the wake of
the lead rider, thereby reducing pressure drag on the
lead rider [37, 38, 58].
2. The drafting effect is greater for the third rider than the
second rider in a pace-line, but often remains nearly
constant for subsequent riders (subject to well-matched
posture and anthropometric variables). Second riders
typically experience a 30–45% reduction in drag below
their baseline, while subsequent riders typically expe-
rience a 35–55% reduction compared to their base-
lines. For riders behind the leader, not only does the
wake of the rider that they are following reduce the
pressure ahead of them, but the high-pressure region in
front of the rider following them also reduces the
pressure differential, further contributing to the total
reduction in pressure drag [37, 38, 45, 53, 58, 93, 95].
6 Final remarks and areas for future research
This review presents a wide range of applied research that
is important to understanding flows around cyclist
geometries under racing conditions. Particularly over the
past 5–10 years, advances in both experimental data
acquisition and numerical modelling techniques have
enabled sports aerodynamicists and researchers to develop
high spatial and temporal resolution datasets of aerody-
namic-related quantities. This has not only led to a greater
understanding of the unsteady flow physics and aerody-
namic forces in cycling but has also had a significant
impact on how a practitioner in the field would approach
finding solutions to cycling aerodynamic performance
criteria.
Cycling is a complex aerodynamic problem and only
recently have investigations focused on developing a
complete picture of the flow field surrounding a cyclist.
This picture has evolved, first through stationary rider
investigations, then time-averaged analyses of pedalling
cyclists, and more recently phase-averaged studies. Look-
ing forward, a clearer image of the aerodynamics associ-
ated with a wider range of cycling conditions can be
developed through further studies into the unsteady aero-
dynamics of rider position, geometry, and the motion of
riders. Although the large-scale flow motions appear to be a
generic feature of a wide variety of cyclist wakes, clear
trends in how changes in rider position, size, shape, ped-
alling style, and high cadence cycling influence both the
rider flow field and the aerodynamic forces are only just
starting to develop.
The development and understanding of the aerody-
namics of multiple riders has progressed significantly over
the past decade. Current literature has focused on the
aerodynamics relating to the behaviour of cooperative
pace-lines, which has implications not only for team pur-
suits and team time-trials, but also for certain mass start
situations and sprint leadout trains. In particular for the
team pursuit, the teams’ speed can be increased by min-
imising the resistance on the lead rider through interference
effects which can be optimised through carefully tailoring
the trailing rider’s separation distance and riding position.
Nonetheless, with the known importance of aerodynamics
to the relative strength of both team and individual strategy
within the peloton, there are still many open questions
related to aerodynamics in a large amorphous pack, as well
as non-steady-state aerodynamics of large groups.
At its core, cycling speed is a maximum optimisation
problem between aerodynamic and biomechanical effi-
ciency (for relatively flat terrain). Few published studies
have attempted to bridge the gap between aerodynamic and
biomechanical efficiency. Rider position and cycling styles
are known to influence power outputs, fatigue rates, and
how susceptible athletes are to injury. The influence of
different riding techniques and leg kinematics throughout
the stroke on both the physiology and aerodynamics of
cyclists is an interesting area that warrants further research.
Little is also known about the influence of the oscillatory
motion of the upper body, which tends to increase with
rider fatigue, on aerodynamic drag. How well the human
body can adapt to aerodynamic riding positions and the
best methods for achieving this in the shortest amount of
time is also unclear. A greater understanding of the cou-
pling between rider aerodynamics and biomechanics will
surely lead to improved racing tactics and rider-specific
training programmes with the goal of maximising both
aerodynamic and physiological performance.
106 T. N. Crouch et al.
Just as rider position is evolving to suit the various
shapes, sizes, and riding styles of athletes, so too is the
development of cycling equipment. As our understanding
of flows around cyclists evolves, this will impact the way
cycling equipment is shaped, textured, and orientated to
complement the aerodynamics of the rider. Already we are
starting to see skin suits that are designed to target drag
reduction on specific parts of the body based on local
Reynolds numbers and helmets contoured to fit the profile
of a rider’s back. In industry, much of the design work of
cycling equipment is initiated through numerical simula-
tions of rider geometries holding limited static leg posi-
tions. However, we now know that the flow field changes
significantly over the course of the pedal stroke. Optimised
solutions for one leg position may not necessarily correlate
to low time-averaged drag solutions over the course of a
complete pedal stroke. Further insight into exactly how the
unsteady aerodynamics associated with the movement of
the legs is coupled with the aerodynamics of the bicycle
frame (and vice versa) could lead to new bicycle tech-
nologies and improve the outputs of numerical and wind
tunnel validation-based programmes.
To date, the vast majority of the body of literature into
cycling aerodynamics has been performed in low-turbu-
lence wind tunnels for non-yawed flow conditions with a
single rider. Future aerodynamic equipment and racing
postures will not only be optimised for a particular type of
athlete but also for the environment in which cycling
events take place. In order to achieve this, the wind envi-
ronment that a cyclist and teams of riders experience on the
track and road needs to be better characterised and
understood. This will inform ways in which wind tunnel
test methods can be improved with the goal of providing a
more accurate representation of flow conditions on the race
course. As wind tunnel test methods continue to evolve, the
need for improved field-based measurement systems to
compare with controlled wind tunnel-based findings will
become even more pertinent. An improved understanding
of the cycling environment under race conditions also has
the potential to further inform racing rules and regulations
(as has been suggested by recent publications into car and
motorbike spacing between riders in road races) and the
design of new indoor velodromes for increased racing
speeds and spectator experience and comfort.
Numerical modelling of the flow around cyclists will
continue to be an active area both in industry as a devel-
opment tool and in research. Rapid growth in computing
power, 3D-modelling, and scanning technologies (which
also goes hand in hand with CNC and 3D printing model
making for wind tunnel experiments) over the last decade
has aided in simulating detailed flow fields around rider
geometries for a range of cycling conditions. The wider use
of CFD for research and development purposes must be
accompanied with improved confidence in CFD models
and also a better understanding of the limitations of
numerical simulations. Accurate modelling of the transition
between laminar and turbulent flow regimes, flow separa-
tion, and unsteady wakes is critical to a valid numerical
simulation of flows around cyclists. If the flow physics is
not being simulated, then the geometry being modelled is
rendered irrelevant and so too are any numerically derived
outputs. As with all CFD solutions for relatively high
Reynolds numbers, errors resulting from inaccuracies in
modelling the flow physics mean that validation through
experiment will continue to be an integral part of any
detailed CFD investigation.
One current issue with modelling separated flows
around complex geometries is that simulations often
involve removing certain components or significantly
simplifying and smoothing the geometry to simplify the
calculations. This can make it difficult to track if differ-
ences in numerical and experimental findings are a result of
the different geometry, meshing characteristics, or the
equations modelling the flow physics. Currently, the only
way to truly determine if the flow physics have been
simulated to a certain degree of accuracy is to directly
compare with experimentally obtained flow fields. Vali-
dation via both experimentally obtained flow field and
force datasets, and not just aerodynamic force numbers
alone, will contribute to the further development of
numerical simulations to better model the flow physics for
a wider variety of cycling applications and the means to
validate these codes. In terms of cycling CFD modelling
capabilities, the next step will be to model the full dynamic
motion on the legs. Due to the high computational cost of
running such a simulation, it will likely be some time
before full dynamic CFD solutions will be a practical
method used in the optimisation of cycling aerodynamic
performance.
As a final note, with many countries striving to reduce
carbon emissions and traffic congestion in major cities,
alternative and efficient means of commuter travel are
increasingly in the spotlight. Bicycles and human-powered
vehicles have been identified as an effective means to
reduce the negative effects associated with fossil fuel
consumption while also supporting a positive healthy and
active lifestyle. As more and more people start taking up
cycling-based methods of transport as a means of com-
muting, the effects of aerodynamics will become more
important to the general population. Although this review
has mainly focused on elite cycling, much of the research
in this area is also applicable to commuter cycling and also
more efficient means of human-powered travel such as
recumbent bicycles. Findings learned from elite cycling
will inevitably filter down to commuter cycling; however,
since the commuter market is not dictated by racing rules
Riding against the wind: a review of competition... 107
and regulations, there is far more room to move in terms of
methods for aerodynamic enhancement. Aerodynamics
will also be a consideration in the safe design of riding
paths and rules and regulations for shared roads with
cyclists and other road vehicles. The potential to improve
rider performance and more generally bluff body perfor-
mance through both advanced passive and active flow
technologies will continue to keep aerodynamics at the
forefront of cutting edge technology, research, and inno-
vation in cycling.
Open Access This article is distributed under the terms of the
Creative Commons Attribution 4.0 International License (http://crea
tivecommons.org/licenses/by/4.0/), which permits unrestricted use,
distribution, and reproduction in any medium, provided you give
appropriate credit to the original author(s) and the source, provide a
link to the Creative Commons license, and indicate if changes were
made.
References
1. Kyle CR, Bassett DR Jr (2003) The cycling world hour record. In:
Burke ER (ed) High-tech cycling: the science of riding faster.
Human Kinetics, Colorado, pp 175–196
2. Martin JC, Milliken DL, Cobb JE, McFadden KL, Coggan AR
(1998) Validation of a mathematical model for road cycling
power. J Appl Biomech 14:276–291
3. Kyle CR, Burke ER (1984) Improving the racing bicycle. Mech
Eng 106(9):34–45
4. Hoerner SF (1965) Fluid-dynamic drag: practical information on
aerodynamic drag and hydrodynamic resistance. Hoerner Fluid
Dynamics, Midland Park, NJ
5. Munson BR, Young DF, Okiishi TH (1990) Fundamentals of
fluid mechanics. New York 3:4
6. Tropea C, Yarin AL, Foss JF (2007) Springer handbook of
experimental fluid mechanics. Springer, Heidelberg
7. Hucho WH (2013) Aerodynamics of road vehicles: from fluid
mechanics to vehicle engineering. Elsevier, Cambridge
8. Gibertini G, Grassi D (2008) Cycling aerodynamics. In: Nørstrud
H (ed) Sport aerodynamics, vol 506. Springer, Vienna, pp 23–47
9. Martin JC, Davidson CJ, Pardyjak ER (2007) Understanding
sprint-cycling performance: the integration of muscle power,
resistance, and modeling. Int J Sports Physiol Perform 2(1):5
10. Bearman PW (1997) Near wake flows behind two-and three-di-
mensional bluff bodies. J Wind Eng Ind Aerodynam 69:33–54
11. Schlichting H (1968) Boundary-layer theory. McGraw-Hill, New
York
12. Crouch TN, Burton D, Brown NAT, Thompson MC, Sheridan J
(2014a) Flow topology in the wake of a cyclist and its effect on
aerodynamic drag. J Fluid Mech 748:5–35
13. Crouch TN, Burton D, Thompson MC, Brown NAT, Sheridan J
(2016) Dynamic leg-motion and its effect on the aerodynamic
performance of cyclists. J Fluids Struct 65:121–137
14. Griffith MD, Crouch TN, Thompson MC, Burton D, Sheridan J,
Brown NAT (2014) Computational fluid dynamics study of the
effect of leg position on cyclist aerodynamic drag. J Fluids Eng
136(10):101105
15. Kyle CR, Brownlie LW, Harber E, MacDonald R, Norstrom M
(2004) The nike swift spin cycling project: reducing the aero-
dynamic drag of bicycle racing clothing by using zoned fabrics.
Eng Sport 5:1
16. Crouch TN, Burton D, Thompson MC, Martin DT, Brown
NAT, Sheridan J (2014) A phase-averaged analysis of the ped-
alling cyclist wake. In: 19th Australasian Fluid Mechanics Con-
ference (Melbourne, Australia 8-11 December 2014). RMIT
University, pp 1–4
17. Baidya R, Monty JP, Hutchins N (2010) Aerodynamics of high
cadence cycling. In: 17th Australasian Fluid Mechanics Confer-
ence (Auckland, New Zealand 5–9 December 2010). Melbourne
University, pp 1–4
18. Andrew JB (2013) Specialized builds its own wind tunnel. http://
www.bicycling.com/bikes-gear/reviews/specialized-builds-its-
own-wind-tunnel. Accessed 2 Mar 2016
19. Wordley S, Saunders JW (2008) On-road turbulence. SAE Int J
Passenger Cars Mech Syst 1(2008-01-0475):341–360
20. Wordley S, Saunders JW (2009) On-road turbulence: Part 2. SAE
Int J Passenger Cars Mech Syst 2(2009-01-0002):111–137
21. Maskell EC (1963) A theory of the blockage effects on bluff
bodies and stalled wings in a closed wind tunnel. Technical
report, DTIC Document
22. Awbi HB (1978) Wind-tunnel-wall constraint on two-dimen-
sional rectangular-section prisms. J Wind Eng Ind Aerodynam
3(4):285–306
23. Mercker E, Wiedemann J (1996) On the correction of interfer-
ence effects in open jet wind tunnels. SAE Paper 105(6):795–809
24. Cooper K (1998) Bluff-body blockage correction in closed and
open test section wind tunnels. AGARD, AG-336, NTIS,
Springfield, VA, p 6
25. Chabroux V, Mba MN, Sainton P, Favier D (2010) Wake char-
acteristics of time trial helmets using piv-3c technique. In: 15th
Int. Symp. on Applications of Laser Techniques to Fluid
Mechanics, Lisbon, Portugal, vol 58
26. Brownlie L, Kyle C, Carbo J, Demarest N, Harber E, MacDonald
R, Nordstrom M (2009) Streamlining the time trial apparel of
cyclists: the nike swift spin project. Sports Technol 2(1–2):53–60
27. Defraeye T, Blocken B, Koninckx E, Hespel P, Carmeliet J
(2010a) Computational fluid dynamics analysis of cyclist aero-
dynamics: performance of different turbulence-modelling and
boundary-layer modelling approaches. J Biomech
43(12):2281–2287
28. Debraux P, Grappe F, Manolova AV, Bertucci W (2011) Aero-
dynamic drag in cycling: methods of assessment. Sports Biomech
10(3):197–218
29. Heil D (2001) Body mass scaling of projected frontal area in
competitive cyclists. Eur J Appl Physiol 85(3–4):358–366
30. Heil DP (2002) Body mass scaling of frontal area in competitive
cyclists not using aero-handlebars. Eur J Appl Physiol
87(6):520–528
31. Dorel S, Hautier CA, Rambaud O, Rouffet D, Van Praagh E,
Lacour JR, Bourdin M (2005) Torque and power-velocity rela-
tionships in cycling: relevance to track sprint performance in
world-class cyclists. Int J Sports Med 26(9):739–746
32. Barlow JB, Rae WH, Pope A (1999) Low-speed wind tunnel
testing, 3rd edn. Wiley, New York
33. Hanna RK (2002) Can CFD make a performance difference in
sport. Eng Sport 4:17–30
34. Godo MN, Corson D, Legensky SM (2009) An aerodynamic
study of bicycle wheel performance using CFD. In: 47th AIAA
Aerospace Sciences Annual Meeting, Orlando, FL, USA, pp 5–8
35. Godo MN, Corson D, Legensky SM (2010) A comparative
aerodynamic study of commercial bicycle wheels using CFD.
AIAA Paper, pp 2010–1431
36. Defraeye T, Blocken B, Koninckx E, Hespel P, Carmeliet J
(2011) Computational fluid dynamics analysis of drag and con-
vective heat transfer of individual body segments for different
cyclist positions. J Biomech 44(9):1695–1701
108 T. N. Crouch et al.
37. Blocken B, Defraeye T, Koninckx E, Carmeliet J, Hespel P
(2013) CFD simulations of the aerodynamic drag of two drafting
cyclists. Comput Fluids 71:435–445
38. Defraeye T, Blocken B, Koninckx E, Hespel P, Verboven P,
Nicolai B, Carmeliet J (2014) Cyclist drag in team pursuit:
influence of cyclist sequence, stature, and arm spacing.
J Biomech Eng 136(1):011005
39. Tu J, Yeoh GH, Liu C (2012) Computational fluid dynamics: a
practical approach. Butterworth-Heinemann, Oxford
40. Blocken B, Toparlar Y (2015) A following car influences cyclist
drag: CFD simulations and wind tunnel measurements. J Wind
Eng Ind Aerodyn 145:178–186
41. Blocken B, Toparlar Y, Andrianne T (2016) Aerodynamic benefit
for a cyclist by a following motorcycle. J Wind Eng Ind Aerodyn
155:1–10
42. Defraeye T, Blocken B, Koninckx E, Hespel P, Carmeliet J
(2010b) Aerodynamic study of different cyclist positions: CFD
analysis and full-scale wind-tunnel tests. J Biomech
43(7):1262–1268
43. Fintelman DM, Hemida H, Sterling M, Li F-X (2015a) CFD
simulations of the flow around a cyclist subjected to crosswinds.
J Wind Eng Ind Aerodyn 144:31–41
44. Lukes RA, Hart JH, Chin SB, Haake SJ (2005) The role and
validation of CFD applied to cycling. In: Fluent user group
meeting. Fluent, pp 65–75
45. Broker JP, Kyle CR, Burke ER (1999) Racing cyclist power
requirements in the 4000-m individual and team pursuits. Med
Sci Sports Exerc 31(11):1677–1688
46. Blair K, Chew GL, Cote M (2007) The effect of static leg posi-
tion and cadence on the drag of a cyclist. Hum Power eJ 4:1–3
47. Fintelman DM, Sterling M, Hemida H, Li F-X (2015b) The effect
of time trial cycling position on physiological and aerodynamic
variables. J Sports Sci 33(16):1730–1737
48. Fintelman DM, Sterling M, Hemida H, Li FX (2015) Effect of
different aerodynamic time trial cycling positions on muscle
activation and crank torque. Scand J Med Sci Sports
49. Underwood L, Schumacher J, Burette-Pommay J, Jermy M
(2011) Aerodynamic drag and biomechanical power of a track
cyclist as a function of shoulder and torso angles. Sports Eng
14(2–4):147–154
50. Candau RB, Grappe F, Menard M, Barbier B, Millet GY, Hoff-
man MD, Belli AR, Rouillon JD (1999) Simplified deceleration
method for assessment of resistive forces in cycling. Med Sci
Sports Exerc 31(10):1441–1447
51. Garcıa-Lopez J, Rodrıguez-Marroyo JA, Juneau CE, Peleteiro J,
Martınez AC, Villa JG (2008) Reference values and improvement
of aerodynamic drag in professional cyclists. J Sports Sci
26(3):277–286
52. Kawamura TM (1953) Wind drag of bicycles. Tokyo University,
Tokyo
53. Zdravkovich MM, Ashcroft MW, Chisholm SJ, Hicks N (1996)
Effect of cyclists’ posture and vicinity of another cyclists on
aerodynamic drag. Eng Sport 1:21–28
54. Padilla S, Mujika I, Angulo F, Goiriena JJ (2000) Scientific
approach to the 1-h cycling world record: a case study. J Appl
Physiol 89(4):1522–1527
55. Barry N, Burton D, Sheridan J, Thompson MC, Brown NAT
(2014) Aerodynamic performance and riding posture in road
cycling and triathlon. In: Proceedings of the Institution of
Mechanical Engineers, Part P: Journal of Sports Engineering and
Technology, pp 1–11
56. Davies CTM (1980) Effect of air resistance on the metabolic cost
and performance of cycling. Eur J Appl Physiol Occup Physiol
45(2–3):245–254
57. Jeukendrup AE, Martin J (2001) Improving cycling performance:
how should we spend our time and money. Sports Med
31(7):559–569
58. Barry N, Burton D, Sheridan J, Thompson MC, Brown NAT
(2015) Aerodynamic drag interactions between cyclists in a team
pursuit. Sports Eng 18(2):93–103
59. Jr Bassett DR, Kyle CR, Passfield L, Broker JP, Burke ER, Burke
ER (1999) Comparing cycling world hour records, 1967–1996:
modeling with empirical data. Med Sci Sports Exerc
31(11):1665–1676
60. McLean BD, Danaher R, Thompson L, Forbes A, Coco G (1994)
Aerodynamic characteristics of cycle wheels and racing cyclists.
J Biomech 27(6):675–675
61. Broker JP (2003) Cycling power: road and mountain. In: Burke
ER (ed) High-tech cycling: the science of riding faster. Human
Kinetics, Colorado, pp 147–174
62. Kyle CR (2003) Selecting cycling equipment. In: Burke ER (ed)
High-tech cycling: the science of riding faster. Human Kinetics,
Colorado, pp 1–48
63. Blair KB, Sidelko S (2008) Aerodynamic performance of cycling
time trial helmets. Eng Sport 7:371–377
64. Chabroux V, Barelle C, Favier D (2008) Aerodynamics of time
trial bicycle helmets. Eng Sport 7:401–410
65. Parker BA, Franke ME, Elledge AW (1996) Bicycle aerody-
namics and recent testing. In: 34th AIAA aerospace sciences
meeting, Reno, NV, 15–18 Jan 1996
66. Bearman PW, Morel T (1983) Effect of free stream turbulence on
the flow around bluff bodies. Prog Aerospace Sci 20(2):97–123
67. ABC (2012) Bobridge blown off his bike. http://www.abc.net.au/
news/2012-01-11/bobridge-blown-off-his-bike/3767346. Acces-
sed 10 May 2016
68. Birnie L (2010) Giro analysis: Crosswinds and crashes cause
chaos in holland. http://www.cyclingweekly.co.uk/news/racing/
giro-ditalia/giro-analysis-crosswinds-and-crashes-cause-chaos-in-
holland-61064. Accessed 25 Mar 2016
69. Cyclingtips Marino M (2016) Project 2016: The story behind usa
cyclings revolutionary new track bikes. http://cyclingtips.com/
2016/05/project-2016-the-story-behind-usa-cyclings-revolu
tionary-new-track-bikes/. Accessed 17 June 2016
70. Zdravkovich MM (1992) Aerodynamics of bicycle wheel and
frame. J Wind Eng Ind Aerodyn 40:55–70
71. Approval protocol for frames and forks (2016) Union Cycliste
Internationale
72. Clarification guide of the uci technical regulation, 15.01.2016
version (2016). Union Cycliste Internationale
73. Tew GS, Sayers AT (1999) Aerodynamics of yawed racing cycle
wheels. J Wind Eng Ind Aerodyn 82:209–222
74. Godo MN, Corson D, Legensky SM (2011) A practical analysis
of unsteady flow around a bicycle wheel, fork and partial frame
using CFD. In: 49th AIAA Aerospace Sciences Meeting includ-
ing the New Horizons Forum and Aerospace Exposition, pp 1237
75. Sidelko S (2007) Benchmark of aerodynamic cycling helmets
using a refined wind tunnel test protocol for helmet drag research.
PhD thesis, Massachusetts Institute of Technology
76. Brownlie L, Ostafichuk P, Tews E, Muller H, Briggs E, Franks K
(2010) The wind-averaged aerodynamic drag of competitive time
trial cycling helmets. Procedia Eng 2(2):2419–2424
77. Achenbach E (1971) Influence of surface roughness on the cross-
flow around a circular cylinder. J Fluid Mech 46(02):321–335
78. Fage A, Warsap JH (1930) The effects of turbulence and surface
roughness on the drag of a circular cylinder. HM Stationery
Office, London
79. Brownlie LW (1992) Aerodynamic characteristics of sports apparel.
PhD thesis,Theses (School ofKinesiology)/SimonFraserUniversity
Riding against the wind: a review of competition... 109
80. Oggiano L, Troynikov O, Konopov I, Subic A, Alam F (2009)
Aerodynamic behaviour of single sport jersey fabrics with dif-
ferent roughness and cover factors. Sports Eng 12(1):1–12
81. Oggiano L, Brownlie L, Troynikov O, Bardal LM, Sæter C,
Sætran L (2013) A review on skin suits and sport garment
aerodynamics: guidelines and state of the art. Proced Eng
60:91–98
82. Bardal LM, Oggiano L, Sætran L, Konopov I, Troynikov O
(2011) Comparison of aerodynamic properties of wool and
polyester knitted textiles. Proced Eng 13:363–369
83. Underwood L, Jermy MC (2011) Fabric testing for cycling
skinsuits. Proced Eng 13:350–356
84. DAuteuil A, Larose GL, Zan SJ (2010) Relevance of similitude
parameters for drag reduction in sport aerodynamics. Proced Eng
2(2):2393–2398
85. Chowdhury H, Alam F, Subic A (2010) Aerodynamic perfor-
mance evaluation of sports textile. Proced Eng 2(2):2517–2522
86. Biermann D, Herrnstein WH Jr (1934) The interference between
struts in various combinations. National Advisory Committee for
Aeronautics, Technical Report 468
87. Zdravkovich MM (1977) Review of flow interference between
two circular cylinders in various arrangements. J Fluids Eng
99(4):618–633
88. Kim MK, Kim DK, Yoon SH, Lee DH (2008) Measurements of
the flow fields around two square cylinders in a tandem
arrangement. J Mech Sci Technol 22(2):397–407
89. Martinuzzi RJ, Havel B (2004) Vortex shedding from two sur-
face-mounted cubes in tandem. Int J Heat Fluid Flow
25(3):364–372
90. Romberg GF, Chianese F, Lajoie RG (1971) Aerodynamics of
race cars in drafting and passing situations. Technical report, SAE
Technical Paper
91. Zabat M, Frascaroli S, Browand FK (1994) Drag measurements
on 2, 3 and 4 car platoons. Technical report, SAE Technical Paper
92. Watkins S, Vino G (2008) The effect of vehicle spacing on the
aerodynamics of a representative car shape. J Wind Eng Ind
Aerodyn 96(6):1232–1239
93. Barry N, Burton D, Sheridan J, Thompson M, Brown NAT (2016)
Flow field interactions between two tandem cyclists. Exp Fluids
57(12):181
94. Kyle CR (1979) Reduction of wind resistance and power output
of racing cyclists and runners travelling in groups. Ergonomics
22(4):387–397
95. Barry N, Sheridan J, Burton D, Brown NAT (2014) The effect of
spatial position on the aerodynamic interactions between cyclists.
Proced Eng 72:774–779
96. Edwards AG, Byrnes WC (2007) Aerodynamic characteristics as
determinants of the drafting effect in cycling. Med Sci Sports
Exerc 39(1):170–176. doi:10.1249/01.mss.0000239400.85955.12
110 T. N. Crouch et al.