RideRs digest 2016 - RLBassets.rlb.com/production/2016/04/05123707/RLB-Riders-Digest... · Riders...
100
2016 RIDERS DIGEST SYDNEY, AUSTRALIA EDITION
Transcript of RideRs digest 2016 - RLBassets.rlb.com/production/2016/04/05123707/RLB-Riders-Digest... · Riders...

2016
RideRs digest
Sydney,AuStrAliAEdition

Instant cost data on the spotRider Levett Bucknall smartphone appThe fastest way to get the latest construction cost information right at your fingertips
www.rlb.com/app

A yearly publication from RLB’s Research & Development department.
Riders Digest is a compendium of cost information and related data specifically prepared by RLB for the Australian construction industry.
RIDERS DIGEST44th Edition
For further information and feedback contact:
Rider Levett Bucknall13th Floor, 380 St Kilda Road, Melbourne Vic. 3004
Telephone: (03) 9690 6111Facsimile: (03) 9690 6577
A.B.N. 28 006 699 476Website: www.rlb.com
Contact: John Cross Oceania Research & Development Manager
Email: [email protected]
While the information in this publication is believed to be correct, no responsibility is accepted for its accuracy. Persons desiring to utilise any information appearing in this publication should verify its applicability to their specific circumstances. Cost information in this publication is indicative and for general guidance only and is based on rates ruling at Fourth Quarter 2015 (unless stated differently). All figures are rounded and exclude GST.
© Rider Levett Bucknall 2015
Reproduction in whole or part forbidden

Rider Levett Bucknall | Riders Digest 20162
ProfEssional sErvicEs
Introduction 6
Cost Consultancy Services 7
Advisory and Research 8
intErnational constrUction
Building Costs 10
Escalation 14
aUstralian constrUction
Building Costs 16
Building Services Costs 20
Tender Price Index 24
Tender Price Index Trends 26
Relativities Matrix 27
2016 RDO Calendar 28
Regional Indices 30
Definitions 31
constrUction
Building Services Costs 34
Unit Costs 38
Office Fitout Costs 39
Hotel Furniture, Fittings & Equipment Costs 40
Recreational Facilities Costs 41
Demolition Costs 43
Siteworks Costs 44
dEvEloPMEnt
Land Values 46
Rents & Yields 47
Rental Rates 48
Stamp Duties 49
Land Tax 50
Planning - Car Parking 51
Vertical Transportation 52
Construction Work Done 55
Office Sector Data 59
Retail Sector Data 62
Industrial Sector Data 64
contEnts

Rider Levett Bucknall | Riders Digest 2016 3
BEnchMarKs
Office Building Efficiencies 66
Labour and Materials Trade Ratios 67
Reinforcement Ratios 68
Progress Payment Claims 69
Kitchen Equipment 70
Common Industry Acronyms 72
Method of Measurement of Building Areas 73
assEts & facilitiEs
Sustainability and Quality 78
Management Standards 79
Useful Life Analysis 80
Outgoings 81
Essential Safety Measures 82
Capital Allowances (Tax Depreciation) 83
officEs
Oceania 86
Africa 87
Middle East 87
United Kingdom 88
Asia 88
Americas 91
calEndars
Public Holidays in Australia 94
Calendars 2015 - 2018 95

Rider Levett Bucknall | Riders Digest 20164
acKnoWlEdGEMEntsRider Levett Bucknall wish to express their appreciation for advice received from the following organisations in the preparation of this compendium –
Property council of australiaMeasurement of Net Lettable Area.
savills researchLand Values, Rent and Yields, Rental Growth, Sector Data.
colliers international – ntNorthern Territory land values and yields.
Mccartney taylor dimitroff Pty ltdKitchen Equipment.
WsP structuresReinforcement Ratios.
RIDERS DIGEST44th Edition

PROFESSIONAL SERVICES
6 Introduction
7 Cost Consultancy Services
8 Advisory
8 Research

Rider Levett Bucknall | Riders Digest 20166
introdUction ridEr lEvEtt BUcKnall
Rider Levett Bucknall (RLB) is an independent global consultancy practice with a commitment to delivering high quality outcomes through advice focused on cost, quality and sustainability within property, infrastructure, construction and facilities.
RLB offers a comprehensive range of complementary cost consultancy, project management and advisory services from conception, through the design and construction and operational performance of facilities to their eventual disposal or reuse. Our clients have rapid access to the latest industry intelligence and innovations, which serve to enhance value and mitigate risk. We provide expert time management of the relationship between value, time and cost from inception to completion.
RLB can trace their origins in Australasia back to the United Kingdom in 1785, when Henry Cooper, the son of a master carpenter, founded a firm of Quantity Surveyors in Reading, England. Rider Hunt commenced practice as Quantity Surveyors in the early 1900s when J. Rider Hunt purchased Henry Cooper & Son practices in London.
Tracing its roots, the firm has a long and proud history of offering an extensive range of cost consultancy and advisory services and delivering award-winning landmark projects.
For over 230 years, RLB has been at the forefront of innovation by embracing global best practice and using local knowledge to deliver full property solutions for clients across a number of sectors.
In Australia, RLB was first established as Rider Hunt in 1949 in Melbourne with a second office in Sydney in 1954. The strength of these offices continued with the post war boom and expanded as new offices and partnerships were established throughout Australia and New Zealand.
Now with over 3,600 professionals in more than 120 offices across Asia, Europe, the Middle East, Africa, the Americas and Oceania, RLB offers clients access to the highest quality expertise supported by a depth of knowledge and experience few firms can rival.
RLB conducts research and publishes its findings across a wide range of key issues that impact the economics of the built environment.
One such publication is the Riders Digest. First issued in 1973, the Riders Digest is an annual compendium of regional and international industry information.

Rider Levett Bucknall | Riders Digest 2016 7
RLB specialises in all aspects of cost consultancy and quantity surveying services throughout the lifecycle of a project. Our expertise includes construction cost estimating and cost management, production of bills of quantities, tender and contract documents and financial administration of building contracts.
Services offered by RLB include:
cost Planning and Estimating services• Preliminary construction cost estimates
• Estimates of building services cost
• Preparation of feasibility studies
• Evaluation of design concepts and specifications
• Procurement methods and forms of contract
• Project escalation factors
• Detailed estimates of construction cost
• Value engineering
tendering and documentation• Strategic advice on methods of project procurement
and tendering
• Pre-qualification of contractors for tendering
• Bills of Quantities
• Pre tender estimates
• Calling of tenders and/or negotiation of prices
• Tender evaluation reports
Post-contract services• Preparation of valuations for progress claims
• Contract cost management and administration
• Schedules of forecasted cash flow
• Valuation of project variations
• Valuation and resolution of financial (time and cost) claims
• Defect management and resolution
• Resolution of final variations and contractor claims
• Preparation of final accounts
other services • Independent certifier role
• Financier certification
• Escalation forecasting
• Project risk management
• Construction market research
cost consUltancy sErvicEs

Rider Levett Bucknall | Riders Digest 20168
advisory
asset advisory• Total asset management planning
• Whole of life planning and cost benefit analysis
• RElifing and repositioning of existing assets
• Sustainability and environmental issues
facilities consultancy• Capital expenditure forecasts and life cycle costs
• Facilities audit and operational performance review
• Building Quality Assessment and benchmarking
Building surveying• Condition / dilapidation surveys
• Tenancy ”make good” reinstatements
• Building conservation and heritage
Property taxation• Capital allowances / tax depreciation schedules
• Inventories / asset registers
• Advice on tax legislation impact assessment
risk Mitigation and due diligence• Acquisition, disposal and outsourcing issues
• Insurance building replacement cost
• Project risk assessment and analysis
Procurement strategies• Needs analysis and brief defunction
• PPP’s and own vs lease options
• Contractual arrangement
litigation support• Arbitration & mediation
• Claims negotiation
• Expert witness
rEsEarch
• Industry and sectoral workload
• Cost escalation
• Cost benchmarking by sector
• Industry trend analysis
advisory and rEsEarch
INTERNATIONAL CONSTRUCTION
10 Building Costs
14 Escalation

Rider Levett Bucknall | Riders Digest 201610
location /citylocal
cUrrEncy
cost PEr M2 cost PEr M2
officE BUildinG rEtail rEsidEntial MUlti storEyPrEMiUM officEs GradE a Mall striP shoPPinG
loW hiGh loW hiGh loW hiGh loW hiGh loW hiGh
aMEricas
BAHAMAS USD 2,495 4,455 2,335 3,270 1,635 2,830 1,520 2,390 1,410 4,565
BOSTON USD 2,155 3,015 1,885 2,635 1,290 2,260 970 1,560 1,455 3,500
DENVER USD 1,505 2,420 1,075 1,615 860 1,400 700 1,345 645 3,765
HONOLULU USD 2,745 5,060 2,315 3,820 1,990 4,735 1,670 4,145 1,830 7,320
LAS VEGAS USD 1,505 3,070 1,130 2,045 1,240 5,165 700 1,560 755 4,305
LOS ANGELES USD 2,155 3,230 1,505 2,260 1,345 3,015 1,075 1,720 1,615 3,335
NEW YORK USD 2,205 3,765 1,940 2,905 1,505 2,690 1,240 1,720 1,505 3,765
PHOENIx USD 1,505 2,585 1,075 1,720 1,130 1,775 755 1,345 970 4,305
SEATTLE USD 1,775 2,205 1,240 1,720 1,240 2,155 1,025 1,455 1,075 2,530
asia
BEIJING RMB 7,650 12,600 7,150 10,800 8,400 12,850 7,400 11,550 4,050 6,150
GUANGZHOU RMB 7,200 11,500 6,650 10,050 8,200 11,700 7,100 10,650 3,800 5,700
HO CHI MINH CITY VND ('000) 23,392 33,646 19,950 24,971 18,877 25,131 N/P N/P 14,985 22,719
HONG KONG $HKD 22,500 33,500 19,200 26,000 22,600 28,700 19,300 25,000 21,100 36,500
JAKARTA RP ('000) 9,648 13,200 6,670 10,620 6,520 8,515 N/P N/P 6,430 9,986
SHANGHAI RMB 7,400 11,650 6,600 10,050 7,950 12,300 6,900 11,050 3,650 5,800
SINGAPORE SGD 2,700 4,000 2,100 3,000 2,200 3,400 N/P N/P 2,000 3,200
EUroPE
AMSTERDAM EUR 1,300 1,650 950 1,400 750 950 600 800 850 1,350
BRISTOL GBP 1,960 2,580 1,580 2,370 2,700 3,800 860 1,625 1,700 2,400
DUBLIN EUR 1,800 2,000 1,600 1,800 1,900 2,100 1,000 1,200 1,400 1,600
LONDON GBP 2,396 3,120 1,975 3,077 3,195 4,491 1,026 1,922 2,008 2,785
MANCHESTER GBP 1,907 2,501 1,646 2,470 2,678 3,762 854 1,615 1,636 2,292
PARIS EUR 1,295 1,306 2,434 2,745 1,538 2,314 1,198 1,538 2,338 2,466
MiddlE East
ABU DHABI AED 5,800 7,000 4,700 6,600 4,100 6,500 N/P N/P 4,500 6,500
DUBAI AED 5,800 7,000 4,700 6,600 4,100 6,500 N/P N/P 4,500 6,500
DOHA QAR 6,500 8,500 6,100 8,200 5,300 6,500 N/P N/P 6,500 7,800
ocEania
ADELAIDE AUD 2,600 3,850 2,100 3,250 1,550 2,850 1,300 1,825 2,250 3,550
AUCKLAND NZD 3,000 4,200 2,500 3,800 1,900 2,600 1,100 1,600 2,600 3,800
BRISBANE AUD 2,600 4,000 2,000 3,000 2,300 3,100 1,100 1,600 2,000 3,200
CANBERRA AUD 3,194 4,141 2,590 3,267 2,195 3,080 1,175 1,936 2,653 3,850
CHRISTCHURCH NZD 3,700 4,800 3,150 4,200 1,650 2,200 N/P N/P N/P N/P
DARWIN AUD 3,000 4,100 2,350 3,750 1,700 2,550 1,200 2,050 2,010 2,650
GOLD COAST AUD 2,450 4,000 1,900 3,000 2,150 3,100 1,050 1,600 1,758 3,200
MELBOURNE AUD 3,000 3,750 2,325 2,900 2,025 3,000 1,060 1,550 2,200 3,500
PERTH AUD 3,150 4,770 2,575 3,740 2,300 2,800 1,025 2,565 2,230 3,830
SYDNEY AUD 3,250 4,600 2,400 3,450 1,800 3,750 1,400 1,800 2,350 4,350
WELLINGTON NZD 2,940 3,360 2,310 2,625 1,300 1,800 N/P N/P 2,625 3,360
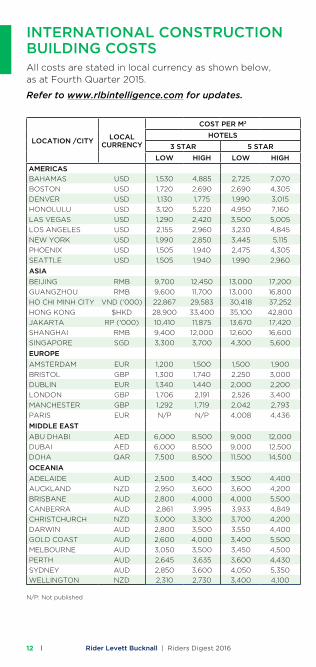
All costs are stated in local currency as shown below, as at Fourth Quarter 2015.
Refer to www.rlbintelligence.com for updates.
intErnational constrUction BUildinG costs
N/P: Not published

Rider Levett Bucknall | Riders Digest 2016 11
location /citylocal
cUrrEncy
cost PEr M2 cost PEr M2
officE BUildinG rEtail rEsidEntial MUlti storEyPrEMiUM officEs GradE a Mall striP shoPPinG
loW hiGh loW hiGh loW hiGh loW hiGh loW hiGh
aMEricas
BAHAMAS USD 2,495 4,455 2,335 3,270 1,635 2,830 1,520 2,390 1,410 4,565
BOSTON USD 2,155 3,015 1,885 2,635 1,290 2,260 970 1,560 1,455 3,500
DENVER USD 1,505 2,420 1,075 1,615 860 1,400 700 1,345 645 3,765
HONOLULU USD 2,745 5,060 2,315 3,820 1,990 4,735 1,670 4,145 1,830 7,320
LAS VEGAS USD 1,505 3,070 1,130 2,045 1,240 5,165 700 1,560 755 4,305
LOS ANGELES USD 2,155 3,230 1,505 2,260 1,345 3,015 1,075 1,720 1,615 3,335
NEW YORK USD 2,205 3,765 1,940 2,905 1,505 2,690 1,240 1,720 1,505 3,765
PHOENIx USD 1,505 2,585 1,075 1,720 1,130 1,775 755 1,345 970 4,305
SEATTLE USD 1,775 2,205 1,240 1,720 1,240 2,155 1,025 1,455 1,075 2,530
asia
BEIJING RMB 7,650 12,600 7,150 10,800 8,400 12,850 7,400 11,550 4,050 6,150
GUANGZHOU RMB 7,200 11,500 6,650 10,050 8,200 11,700 7,100 10,650 3,800 5,700
HO CHI MINH CITY VND ('000) 23,392 33,646 19,950 24,971 18,877 25,131 N/P N/P 14,985 22,719
HONG KONG $HKD 22,500 33,500 19,200 26,000 22,600 28,700 19,300 25,000 21,100 36,500
JAKARTA RP ('000) 9,648 13,200 6,670 10,620 6,520 8,515 N/P N/P 6,430 9,986
SHANGHAI RMB 7,400 11,650 6,600 10,050 7,950 12,300 6,900 11,050 3,650 5,800
SINGAPORE SGD 2,700 4,000 2,100 3,000 2,200 3,400 N/P N/P 2,000 3,200
EUroPE
AMSTERDAM EUR 1,300 1,650 950 1,400 750 950 600 800 850 1,350
BRISTOL GBP 1,960 2,580 1,580 2,370 2,700 3,800 860 1,625 1,700 2,400
DUBLIN EUR 1,800 2,000 1,600 1,800 1,900 2,100 1,000 1,200 1,400 1,600
LONDON GBP 2,396 3,120 1,975 3,077 3,195 4,491 1,026 1,922 2,008 2,785
MANCHESTER GBP 1,907 2,501 1,646 2,470 2,678 3,762 854 1,615 1,636 2,292
PARIS EUR 1,295 1,306 2,434 2,745 1,538 2,314 1,198 1,538 2,338 2,466
MiddlE East
ABU DHABI AED 5,800 7,000 4,700 6,600 4,100 6,500 N/P N/P 4,500 6,500
DUBAI AED 5,800 7,000 4,700 6,600 4,100 6,500 N/P N/P 4,500 6,500
DOHA QAR 6,500 8,500 6,100 8,200 5,300 6,500 N/P N/P 6,500 7,800
ocEania
ADELAIDE AUD 2,600 3,850 2,100 3,250 1,550 2,850 1,300 1,825 2,250 3,550
AUCKLAND NZD 3,000 4,200 2,500 3,800 1,900 2,600 1,100 1,600 2,600 3,800
BRISBANE AUD 2,600 4,000 2,000 3,000 2,300 3,100 1,100 1,600 2,000 3,200
CANBERRA AUD 3,194 4,141 2,590 3,267 2,195 3,080 1,175 1,936 2,653 3,850
CHRISTCHURCH NZD 3,700 4,800 3,150 4,200 1,650 2,200 N/P N/P N/P N/P
DARWIN AUD 3,000 4,100 2,350 3,750 1,700 2,550 1,200 2,050 2,010 2,650
GOLD COAST AUD 2,450 4,000 1,900 3,000 2,150 3,100 1,050 1,600 1,758 3,200
MELBOURNE AUD 3,000 3,750 2,325 2,900 2,025 3,000 1,060 1,550 2,200 3,500
PERTH AUD 3,150 4,770 2,575 3,740 2,300 2,800 1,025 2,565 2,230 3,830
SYDNEY AUD 3,250 4,600 2,400 3,450 1,800 3,750 1,400 1,800 2,350 4,350
WELLINGTON NZD 2,940 3,360 2,310 2,625 1,300 1,800 N/P N/P 2,625 3,360
The following data represents estimates of current building costs in the respective market. Costs may vary as a consequence of factors such as site conditions, climatic conditions, standards of specification, market conditions etc.
Rates are in national currency per square metre of Gross Floor Area except as follows:
chinese cities, hong Kong and Macau: Rates are per square metre of Construction Floor Area, measured to outer face of external walls.
singapore, ho chi Minh city, Jakarta and Kuala lumpur: Rates are per square metre of Construction Floor Area, measured to outer face of external walls and inclusive of covered basement and above ground parking areas.
chinese cities, hong Kong, Macau and singapore: All hotel rates are inclusive of Furniture Fittings and Equipment (FF&E).
Rider Levett Bucknall | Riders Digest 201612
location /citylocal
cUrrEncy
cost PEr M2 cost PEr M2
hotEls car ParKinG indUstrial WarEhoUsE3 star 5 star MUlti storEy BasEMEnt
loW hiGh loW hiGh loW hiGh loW hiGh loW hiGh
aMEricas
BAHAMAS USD 1,530 4,885 2,725 7,070 N/P N/P N/P N/P 1,530 4,885
BOSTON USD 1,720 2,690 2,690 4,305 645 970 860 1,185 755 1,075
DENVER USD 1,130 1,775 1,990 3,015 430 755 645 1,025 700 1,185
HONOLULU USD 3,120 5,220 4,950 7,160 915 1,345 1,290 2,530 1,345 2,155
LAS VEGAS USD 1,290 2,420 3,500 5,005 540 915 645 1,615 540 1,075
LOS ANGELES USD 2,155 2,960 3,230 4,845 1,025 1,240 1,185 1,670 1,025 1,720
NEW YORK USD 1,990 2,850 3,445 5,115 700 1,130 915 1,345 970 1,400
PHOENIx USD 1,505 1,940 2,475 4,305 430 700 645 1,075 590 1,075
SEATTLE USD 1,505 1,940 1,990 2,960 700 915 915 1,345 805 1,185
asia
BEIJING RMB 9,700 12,450 13,000 17,200 2,250 3,050 3,750 6,550 4,350 5,500
GUANGZHOU RMB 9,600 11,700 13,000 16,800 2,100 3,000 3,700 6,400 4,150 5,150
HO CHI MINH CITY VND ('000) 22,867 29,583 30,418 37,252 8,528 12,742 17,537 23,963 5,845 8,849
HONG KONG $HKD 28,900 33,400 35,100 42,800 8,800 10,400 17,100 23,800 14,800 18,700
JAKARTA RP ('000) 10,410 11,875 13,670 17,420 3,460 4,450 4,450 6,190 4,650 5,680
SHANGHAI RMB 9,400 12,000 12,600 16,600 2,050 3,000 3,900 6,450 4,000 5,150
SINGAPORE SGD 3,300 3,700 4,300 5,600 700 1,400 1,500 2,250 1,100 1,600
EUroPE
AMSTERDAM EUR 1,200 1,500 1,500 1,900 400 600 650 1,000 375 525
BRISTOL GBP 1,300 1,740 2,250 3,000 400 800 925 1,440 360 650
DUBLIN EUR 1,340 1,440 2,000 2,200 400 500 600 1,000 400 560
LONDON GBP 1,706 2,191 2,526 3,400 410 820 1,090 1,760 443 799
MANCHESTER GBP 1,292 1,719 2,042 2,793 323 646 875 1,396 354 646
PARIS EUR N/P N/P 4,008 4,436 N/P N/P 880 N/P N/P 2,105
MiddlE East
ABU DHABI AED 6,000 8,500 9,000 12,000 1,800 3,600 2,850 4,500 1,500 2,700
DUBAI AED 6,000 8,500 9,000 12,500 2,300 3,600 3,100 4,500 1,850 2,900
DOHA QAR 7,500 8,500 11,500 14,500 N/P N/P 2,750 4,500 N/P N/P
ocEania
ADELAIDE AUD 2,500 3,400 3,500 4,400 600 900 1,300 1,900 625 1,100
AUCKLAND NZD 2,950 3,600 3,600 4,200 550 800 1,200 1,800 475 800
BRISBANE AUD 2,800 4,000 4,000 5,500 700 1,100 1,600 2,100 600 1,100
CANBERRA AUD 2,861 3,995 3,933 4,849 729 1,009 978 1,395 676 1,051
CHRISTCHURCH NZD 3,000 3,300 3,700 4,200 850 1,350 1,750 2,200 720 1,100
DARWIN AUD 2,800 3,500 3,550 4,400 750 1,250 1,170 1,530 780 1,400
GOLD COAST AUD 2,600 4,000 3,400 5,500 700 1,100 1,500 2,050 600 1,100
MELBOURNE AUD 3,050 3,500 3,450 4,500 655 1,060 1,110 1,365 555 1,100
PERTH AUD 2,645 3,635 3,600 4,430 750 1,000 1,850 3,100 550 1,020
SYDNEY AUD 2,850 3,600 4,050 5,350 700 1,050 1,000 1,600 670 1,050
WELLINGTON NZD 2,310 2,730 3,400 4,100 500 900 1,890 2,730 900 1,400
All costs are stated in local currency as shown below, as at Fourth Quarter 2015.
Refer to www.rlbintelligence.com for updates.
intErnational constrUction BUildinG costs
N/P: Not published

Rider Levett Bucknall | Riders Digest 2016 13
location /citylocal
cUrrEncy
cost PEr M2 cost PEr M2
hotEls car ParKinG indUstrial WarEhoUsE3 star 5 star MUlti storEy BasEMEnt
loW hiGh loW hiGh loW hiGh loW hiGh loW hiGh
aMEricas
BAHAMAS USD 1,530 4,885 2,725 7,070 N/P N/P N/P N/P 1,530 4,885
BOSTON USD 1,720 2,690 2,690 4,305 645 970 860 1,185 755 1,075
DENVER USD 1,130 1,775 1,990 3,015 430 755 645 1,025 700 1,185
HONOLULU USD 3,120 5,220 4,950 7,160 915 1,345 1,290 2,530 1,345 2,155
LAS VEGAS USD 1,290 2,420 3,500 5,005 540 915 645 1,615 540 1,075
LOS ANGELES USD 2,155 2,960 3,230 4,845 1,025 1,240 1,185 1,670 1,025 1,720
NEW YORK USD 1,990 2,850 3,445 5,115 700 1,130 915 1,345 970 1,400
PHOENIx USD 1,505 1,940 2,475 4,305 430 700 645 1,075 590 1,075
SEATTLE USD 1,505 1,940 1,990 2,960 700 915 915 1,345 805 1,185
asia
BEIJING RMB 9,700 12,450 13,000 17,200 2,250 3,050 3,750 6,550 4,350 5,500
GUANGZHOU RMB 9,600 11,700 13,000 16,800 2,100 3,000 3,700 6,400 4,150 5,150
HO CHI MINH CITY VND ('000) 22,867 29,583 30,418 37,252 8,528 12,742 17,537 23,963 5,845 8,849
HONG KONG $HKD 28,900 33,400 35,100 42,800 8,800 10,400 17,100 23,800 14,800 18,700
JAKARTA RP ('000) 10,410 11,875 13,670 17,420 3,460 4,450 4,450 6,190 4,650 5,680
SHANGHAI RMB 9,400 12,000 12,600 16,600 2,050 3,000 3,900 6,450 4,000 5,150
SINGAPORE SGD 3,300 3,700 4,300 5,600 700 1,400 1,500 2,250 1,100 1,600
EUroPE
AMSTERDAM EUR 1,200 1,500 1,500 1,900 400 600 650 1,000 375 525
BRISTOL GBP 1,300 1,740 2,250 3,000 400 800 925 1,440 360 650
DUBLIN EUR 1,340 1,440 2,000 2,200 400 500 600 1,000 400 560
LONDON GBP 1,706 2,191 2,526 3,400 410 820 1,090 1,760 443 799
MANCHESTER GBP 1,292 1,719 2,042 2,793 323 646 875 1,396 354 646
PARIS EUR N/P N/P 4,008 4,436 N/P N/P 880 N/P N/P 2,105
MiddlE East
ABU DHABI AED 6,000 8,500 9,000 12,000 1,800 3,600 2,850 4,500 1,500 2,700
DUBAI AED 6,000 8,500 9,000 12,500 2,300 3,600 3,100 4,500 1,850 2,900
DOHA QAR 7,500 8,500 11,500 14,500 N/P N/P 2,750 4,500 N/P N/P
ocEania
ADELAIDE AUD 2,500 3,400 3,500 4,400 600 900 1,300 1,900 625 1,100
AUCKLAND NZD 2,950 3,600 3,600 4,200 550 800 1,200 1,800 475 800
BRISBANE AUD 2,800 4,000 4,000 5,500 700 1,100 1,600 2,100 600 1,100
CANBERRA AUD 2,861 3,995 3,933 4,849 729 1,009 978 1,395 676 1,051
CHRISTCHURCH NZD 3,000 3,300 3,700 4,200 850 1,350 1,750 2,200 720 1,100
DARWIN AUD 2,800 3,500 3,550 4,400 750 1,250 1,170 1,530 780 1,400
GOLD COAST AUD 2,600 4,000 3,400 5,500 700 1,100 1,500 2,050 600 1,100
MELBOURNE AUD 3,050 3,500 3,450 4,500 655 1,060 1,110 1,365 555 1,100
PERTH AUD 2,645 3,635 3,600 4,430 750 1,000 1,850 3,100 550 1,020
SYDNEY AUD 2,850 3,600 4,050 5,350 700 1,050 1,000 1,600 670 1,050
WELLINGTON NZD 2,310 2,730 3,400 4,100 500 900 1,890 2,730 900 1,400
The following data represents estimates of current building costs in the respective market. Costs may vary as a consequence of factors such as site conditions, climatic conditions, standards of specification, market conditions etc.
Rates are in national currency per square metre of Gross Floor Area except as follows:
chinese cities, hong Kong and Macau: Rates are per square metre of Construction Floor Area, measured to outer face of external walls.
singapore, ho chi Minh city, Jakarta and Kuala lumpur: Rates are per square metre of Construction Floor Area, measured to outer face of external walls and inclusive of covered basement and above ground parking areas.
chinese cities, hong Kong, Macau and singapore: All hotel rates are inclusive of Furniture Fittings and Equipment (FF&E).

Rider Levett Bucknall | Riders Digest 201614
2013 2014 2015 (f)
2016 (f)
2017 (f)
2018 (f)
africa CAPE TOWN N/P 5.0 6.0 7.0 8.0 4.8JOHANNESBURG N/P 8.3 7.2 7.5 8.0 4.8PRETORIA N/P 8.3 7.2 7.5 8.0 4.8aMEricas BOSTON 5.2 4.7 4.1 4.8 4.1 4.1CHICAGO 4.7 4.9 4.9 4.6 4.1 4.1HONOLULU 7.7 13.3 11.2 7.2 5.1 4.1LAS VEGAS 0.9 3.6 4.4 5.9 4.6 4.1LOS ANGELES 1.8 4.9 4.6 5.4 4.1 4.1NEW YORK 5.9 4.4 3.6 4.6 4.1 4.1PHOENIx 2.5 3.7 4.2 5.4 4.3 4.1SEATTLE 3.5 4.5 5.0 4.6 4.1 4.1WASHINGTON 5.4 5.5 4.7 4.3 4.1 4.1asia BEIJING 1.0 2.0 (0.0) 2.0 2.0 2.0GUANGZHOU 4.1 3.0 (2.0) 2.0 2.0 2.0HONG KONG 9.0 8.2 7.2 6.1 3.0 3.0MACAU 9.3 10.4 7.2 4.1 3.0 3.0SEOUL 2.4 1.1 0.4 1.5 1.7 1.8SHANGHAI 2.0 (1.0) (2.5) 3.0 2.0 2.0SINGAPORE 4.5 1.5 1.5 N/P N/P N/PEUroPE BERLIN N/P 1.8 2.2 2.0 2.0 2.0BIRMINGHAM 8.0 7.1 4.0 5.0 5.0 5.5BRISTOL 6.3 7.1 4.5 5.0 5.0 5.5DUBLIN 4.0 5.0 8.0 9.0 9.0 9.0LONDON 3.4 5.0 5.9 5.0 4.5 4.0WOKINGHAM 5.9 6.4 5.1 4.1 3.8 3.0MADRID N/P 0.0 (0.0) 0.1 0.8 0.1MANCHESTER 6.3 7.1 4.0 5.0 5.0 5.5MOSCOW N/P 0.0 (5.0) 0.0 1.0 1.5MiddlE East ABU DHABI 3.2 3.3 4.7 5.7 6.1 7.3DOHA 3.2 4.5 5.0 5.5 6.0 7.0DUBAI 3.2 3.7 4.6 3.1 2.5 2.9RIYADH 4.4 5.0 4.8 5.0 5.0 5.0ocEania ADELAIDE 0.9 0.6 0.8 2.5 3.0 3.0AUCKLAND 0.8 4.1 5.6 6.0 4.1 3.0BRISBANE (0.9) 5.1 5.9 5.1 4.1 4.1CANBERRA 2.2 1.6 2.0 2.2 3.0 3.0CHRISTCHURCH 5.1 6.0 6.0 6.0 5.0 5.0DARWIN 3.0 1.8 1.0 1.5 1.8 2.3GOLD COAST 0.0 4.1 5.9 6.0 5.0 4.0MELBOURNE 0.2 1.5 2.0 2.0 3.0 3.0PERTH 1.1 0.8 0.8 2.1 3.0 3.0SYDNEY 2.0 3.0 4.5 4.8 4.0 3.5TOWNSVILLE 1.3 2.0 3.0 3.0 4.0 4.0WELLINGTON 2.0 3.4 3.0 3.0 3.0 3.0
N/P: Not published
intErnational constrUction Escalation
All indices are stated as annual percentage changes, as at Fourth Quarter 2015.
Refer to www.rlbintelligence.com for updates.
rlB tEndEr PricE indEX

AUSTRALIAN CONSTRUCTION
16 Building Costs
20 Building Services Costs
24 Tender Price Index
26 Tender Price Index Trends
27 Relativities Matrix
28 2015 RDO Calendar
30 Regional Indices
31 Definitions

Rider Levett Bucknall | Riders Digest 201616
constrUction ratEs
The following range of current building costs could be expected should tenders be called in the respective city. Items specifically included are those normally contained in a Building Contract.
Specific exclusions:
• Goods & Services Tax (GST)
• Land
• Legal and professional fees
• Loose furniture and fittings
• Site works and drainage
• Subdivisional partitions in office buildings
• Telstra and private telephone systems (PABx)
• Tenancy works
aUstralian constrUctionBUildinG costs
city adElaidE BrisBanE canBErra darWin MElBoUrnE PErth sydnEy
cost ranGE PEr Gross floor arEa
$/M2 $/M2 $/M2 $/M2 $/M2 $/M2 $/M2
loW hiGh loW hiGh loW hiGh loW hiGh loW hiGh loW hiGh loW hiGh
officE BUildinGs
Prestige, cBd
10 TO 25 STOREYS (75-80% EFFICIENCY) 2,600 3,500 2,600 3,500 3,194 3,880 3,000 3,900 3,000 3,385 3,150 4,080 3,250 3,700
25 TO 40 STOREYS (70-75% EFFICIENCY) 3,000 3,850 2,700 3,700 3,434 4,141 3,200 4,100 3,200 3,600 3,445 4,470 3,750 4,250
40 TO 55 STOREYS (68-73% EFFICIENCY) - - 2,900 4,000 - - - - 3,335 3,750 3,735 4,770 4,150 4,600
investment, cBd
UP TO 10 STOREYS (81-85% EFFICIENCY) 2,100 2,650 2,000 2,400 2,590 3,028 2,350 3,400 2,325 2,750 2,575 3,315 2,400 2,800
10 TO 25 STOREYS (76-81% EFFICIENCY) 2,350 2,950 2,200 2,800 2,705 3,131 2,500 3,750 2,450 2,850 2,670 3,485 2,850 3,150
25 TO 40 STOREYS (71-76% EFFICIENCY) 2,550 3,250 2,400 3,000 2,757 3,267 - - 2,500 2,900 2,775 3,740 3,000 3,450
investment, other than cBd
WALK UP (83-87% EFFICIENCY) 1,750 2,250 1,400 1,900 1,383 1,894 2,180 2,790 1,225 1,700 2,300 3,100 1,900 2,250
UP TO 10 STOREYS (82-86% EFFICIENCY) 2,000 2,600 1,800 2,300 1,966 2,247 2,270 3,330 1,725 2,300 2,500 3,300 2,100 2,700
10 TO 25 STOREYS (77-82% EFFICIENCY) - - 2,000 2,600 2,081 2,653 2,500 3,400 1,900 2,500 2,900 3,600 2,400 3,050
hotEls
Multi-storey
FIVE STAR 3,500 4,400 4,000 5,500 3,933 4,849 3,550 4,400 3,450 4,500 3,600 4,430 4,050 5,350
FOUR STAR 3,000 4,100 3,400 4,500 3,381 4,599 3,300 4,000 3,250 4,200 3,105 4,035 3,400 4,700
THREE STAR 2,500 3,400 2,800 4,000 2,861 3,995 2,800 3,500 3,050 3,500 2,645 3,635 2,850 3,600
car ParK
OPEN DECK MULTI-STOREY 600 900 700 1,100 729 1,009 750 1,250 655 1,060 750 1,000 700 1,050
BASEMENT: CBD 1,300 1,900 1,600 2,100 978 1,395 1,170 1,530 1,110 1,365 1,850 3,100 1,000 1,600
BASEMENT: OTHER THAN CBD 900 1,750 1,100 1,800 957 1,395 1,040 1,520 1,060 1,450 1,400 2,800 1,000 1,500
UNDERCROFT: OTHER THAN CBD 575 875 500 750 729 905 720 1,020 710 860 900 1,350 - -
indUstrial BUildinGs
6.00m to underside of truss and 4,500 M2 Gross floor area with:
ZINCALUME METAL CLADDING 625 1,000 600 900 676 697 780 1,370 555 960 625 815 670 820
PRECAST CONCRETE CLADDING 725 1,100 800 1,100 781 1,051 820 1,400 655 1,100 705 1,020 730 1,050
attached air conditioned offices
200 M2 1,550 2,100 1,600 2,000 1,613 2,071 1,670 2,380 1,475 1,900 1,450 2,110 1,800 2,350
400 M2 1,550 2,100 1,600 1,900 1,540 1,998 1,670 2,380 1,425 1,850 1,405 1,995 1,850 2,500

Rider Levett Bucknall | Riders Digest 2016 17
notEsi Car Parking costs have been excluded to arrive at the various building rates.
ii Refer to Page 31 for definitions.
ii The percentages shown against each building may be used to calculate the rate per Net Lettable Area.
Example: the NLA rate for a Premium Office CBD 10 to 25 Storeys would be calculated NLA rate = $/m2 ÷ the efficiency percentage.
Refer to www.rlbintelligence.com for updates.
city adElaidE BrisBanE canBErra darWin MElBoUrnE PErth sydnEy
cost ranGE PEr Gross floor arEa
$/M2 $/M2 $/M2 $/M2 $/M2 $/M2 $/M2
loW hiGh loW hiGh loW hiGh loW hiGh loW hiGh loW hiGh loW hiGh
officE BUildinGs
Prestige, cBd
10 TO 25 STOREYS (75-80% EFFICIENCY) 2,600 3,500 2,600 3,500 3,194 3,880 3,000 3,900 3,000 3,385 3,150 4,080 3,250 3,700
25 TO 40 STOREYS (70-75% EFFICIENCY) 3,000 3,850 2,700 3,700 3,434 4,141 3,200 4,100 3,200 3,600 3,445 4,470 3,750 4,250
40 TO 55 STOREYS (68-73% EFFICIENCY) - - 2,900 4,000 - - - - 3,335 3,750 3,735 4,770 4,150 4,600
investment, cBd
UP TO 10 STOREYS (81-85% EFFICIENCY) 2,100 2,650 2,000 2,400 2,590 3,028 2,350 3,400 2,325 2,750 2,575 3,315 2,400 2,800
10 TO 25 STOREYS (76-81% EFFICIENCY) 2,350 2,950 2,200 2,800 2,705 3,131 2,500 3,750 2,450 2,850 2,670 3,485 2,850 3,150
25 TO 40 STOREYS (71-76% EFFICIENCY) 2,550 3,250 2,400 3,000 2,757 3,267 - - 2,500 2,900 2,775 3,740 3,000 3,450
investment, other than cBd
WALK UP (83-87% EFFICIENCY) 1,750 2,250 1,400 1,900 1,383 1,894 2,180 2,790 1,225 1,700 2,300 3,100 1,900 2,250
UP TO 10 STOREYS (82-86% EFFICIENCY) 2,000 2,600 1,800 2,300 1,966 2,247 2,270 3,330 1,725 2,300 2,500 3,300 2,100 2,700
10 TO 25 STOREYS (77-82% EFFICIENCY) - - 2,000 2,600 2,081 2,653 2,500 3,400 1,900 2,500 2,900 3,600 2,400 3,050
hotEls
Multi-storey
FIVE STAR 3,500 4,400 4,000 5,500 3,933 4,849 3,550 4,400 3,450 4,500 3,600 4,430 4,050 5,350
FOUR STAR 3,000 4,100 3,400 4,500 3,381 4,599 3,300 4,000 3,250 4,200 3,105 4,035 3,400 4,700
THREE STAR 2,500 3,400 2,800 4,000 2,861 3,995 2,800 3,500 3,050 3,500 2,645 3,635 2,850 3,600
car ParK
OPEN DECK MULTI-STOREY 600 900 700 1,100 729 1,009 750 1,250 655 1,060 750 1,000 700 1,050
BASEMENT: CBD 1,300 1,900 1,600 2,100 978 1,395 1,170 1,530 1,110 1,365 1,850 3,100 1,000 1,600
BASEMENT: OTHER THAN CBD 900 1,750 1,100 1,800 957 1,395 1,040 1,520 1,060 1,450 1,400 2,800 1,000 1,500
UNDERCROFT: OTHER THAN CBD 575 875 500 750 729 905 720 1,020 710 860 900 1,350 - -
indUstrial BUildinGs
6.00m to underside of truss and 4,500 M2 Gross floor area with:
ZINCALUME METAL CLADDING 625 1,000 600 900 676 697 780 1,370 555 960 625 815 670 820
PRECAST CONCRETE CLADDING 725 1,100 800 1,100 781 1,051 820 1,400 655 1,100 705 1,020 730 1,050
attached air conditioned offices
200 M2 1,550 2,100 1,600 2,000 1,613 2,071 1,670 2,380 1,475 1,900 1,450 2,110 1,800 2,350
400 M2 1,550 2,100 1,600 1,900 1,540 1,998 1,670 2,380 1,425 1,850 1,405 1,995 1,850 2,500

Rider Levett Bucknall | Riders Digest 201618
aUstralian constrUctionBUildinG costsN.B. All costs current as at Fourth Quarter 2015.
city adElaidE BrisBanE canBErra darWin MElBoUrnE PErth sydnEy
cost ranGE PEr Gross floor arEa
$/M2 $/M2 $/M2 $/M2 $/M2 $/M2 $/M2
loW hiGh loW hiGh loW hiGh loW hiGh loW hiGh loW hiGh loW hiGh
aGEd carE
SINGLE STOREY FACILITY 2,075 2,650 2,100 2,800 1,946 2,632 2,350 3,450 1,750 2,375 2,200 2,625 2,400 3,100
PrivatE hosPitals
low rise hospital
45-60 M2 GFA/BED 3,550 5,500 3,800 4,800 4,055 5,486 3,800 4,400 2,600 3,050 2,780 3,425 2,600 3,250
55-80 M2 GFA/BED WITH MAJOR OPERATING THEATRE
3,850 5,800 4,700 6,300 4,461 6,035 4,300 5,300 2,900 3,500 3,145 4,220 3,300 4,300
cinEMas
GROUP COMPLEx, 2,000 - 4,000 SEATS. (WARM SHELL)
2,700 3,650 2,400 3,400 2,840 3,173 2,680 3,400 2,325 2,600 2,535 2,995 3,000 4,100
rEGional shoPPinG cEntrEs
DEPARTMENT STORE 1,350 2,250 1,600 2,100 2,237 2,455 1,680 2,350 1,925 2,325 1,195 1,655 1,400 1,950
SUPERMARKET/VARIETY STORE 1,300 1,750 1,500 1,900 1,363 1,852 1,750 2,400 1,215 1,800 1,355 1,700 1,350 2,600
DISCOUNT DEPARTMENT STORE 1,100 1,350 1,300 1,700 1,238 1,457 1,600 2,200 1,150 1,600 1,995 2,870 1,200 1,450
MALLS 1,550 2,850 2,300 3,100 2,195 3,080 1,700 2,550 2,025 3,000 2,300 2,800 1,800 3,750
SPECIALITY SHOPS 975 1,650 1,100 1,500 1,145 1,540 1,400 2,000 1,060 1,500 1,010 1,445 1,550 2,300
sMall shoPs and shoWrooMs 1,300 1,825 1,100 1,600 1,175 1,936 1,200 2,050 1,060 1,550 1,025 2,565 1,400 1,800
rEsidEntial
SINGLE AND DOUBLE STOREY DWELLINGS. (CUSTOM BUILT)
1,550 3,400 1,700 3,400 1,530 2,507 1,750 2,750 1,365 2,700 1,420 2,263 1,550 4,350
rEsidEntial Units
WALK-UP 85 TO 120 M2/UNIT 1,650 2,750 1,500 3,200 1,633 3,277 1,970 2,370 1,465 3,050 1,745 2,803 - -
TOWNHOUSES 90 TO 120 M2/UNIT 1,700 2,600 1,500 2,700 1,633 3,194 1,970 2,370 1,415 2,650 1,585 2,613 - -
MUlti-storEy Units
Up to 10 storeys with lift
UNITS 60-70 M2 2,350 3,450 2,100 2,900 2,705 3,319 2,030 2,430 2,225 2,850 2,280 2,975 2,600 3,300
UNITS 90-120 M2 2,250 3,350 2,000 2,700 2,653 3,267 2,010 2,400 2,200 2,900 2,230 2,880 2,350 3,050
over 10 and up to 20 storey
UNITS 60-70 M2 2,450 3,550 2,400 2,900 2,923 3,537 2,100 2,520 2,530 3,235 2,725 3,375 2,750 3,600
UNITS 90-120 M2 2,400 3,450 2,400 2,800 2,861 3,537 2,050 2,480 2,500 3,250 2,655 3,275 2,600 3,400
over 20 and up to 40 storey
UNITS 60-70 M2 2,750 3,500 2,400 3,200 3,371 3,850 2,340 2,650 3,000 3,500 3,405 3,830 3,550 4,350
UNITS 90-120 M2 2,700 3,450 2,300 3,000 3,267 3,642 2,280 2,580 2,800 3,400 3,335 3,780 3,400 4,000
over 40 and up to 80 storey
UNITS 60-70 M2 - - 2,900 3,700 - - - - 3,350 4,000 3,810 4,475 4,100 4,950
UNITS 90-120 M2 - - 2,800 3,500 - - - - 3,200 3,900 3,665 4,395 4,000 4,850

Rider Levett Bucknall | Riders Digest 2016 19
Building Costs include Building Works and Building Services
Refer to www.rlbintelligence.com for updates.
city adElaidE BrisBanE canBErra darWin MElBoUrnE PErth sydnEy
cost ranGE PEr Gross floor arEa
$/M2 $/M2 $/M2 $/M2 $/M2 $/M2 $/M2
loW hiGh loW hiGh loW hiGh loW hiGh loW hiGh loW hiGh loW hiGh
aGEd carE
SINGLE STOREY FACILITY 2,075 2,650 2,100 2,800 1,946 2,632 2,350 3,450 1,750 2,375 2,200 2,625 2,400 3,100
PrivatE hosPitals
low rise hospital
45-60 M2 GFA/BED 3,550 5,500 3,800 4,800 4,055 5,486 3,800 4,400 2,600 3,050 2,780 3,425 2,600 3,250
55-80 M2 GFA/BED WITH MAJOR OPERATING THEATRE
3,850 5,800 4,700 6,300 4,461 6,035 4,300 5,300 2,900 3,500 3,145 4,220 3,300 4,300
cinEMas
GROUP COMPLEx, 2,000 - 4,000 SEATS. (WARM SHELL)
2,700 3,650 2,400 3,400 2,840 3,173 2,680 3,400 2,325 2,600 2,535 2,995 3,000 4,100
rEGional shoPPinG cEntrEs
DEPARTMENT STORE 1,350 2,250 1,600 2,100 2,237 2,455 1,680 2,350 1,925 2,325 1,195 1,655 1,400 1,950
SUPERMARKET/VARIETY STORE 1,300 1,750 1,500 1,900 1,363 1,852 1,750 2,400 1,215 1,800 1,355 1,700 1,350 2,600
DISCOUNT DEPARTMENT STORE 1,100 1,350 1,300 1,700 1,238 1,457 1,600 2,200 1,150 1,600 1,995 2,870 1,200 1,450
MALLS 1,550 2,850 2,300 3,100 2,195 3,080 1,700 2,550 2,025 3,000 2,300 2,800 1,800 3,750
SPECIALITY SHOPS 975 1,650 1,100 1,500 1,145 1,540 1,400 2,000 1,060 1,500 1,010 1,445 1,550 2,300
sMall shoPs and shoWrooMs 1,300 1,825 1,100 1,600 1,175 1,936 1,200 2,050 1,060 1,550 1,025 2,565 1,400 1,800
rEsidEntial
SINGLE AND DOUBLE STOREY DWELLINGS. (CUSTOM BUILT)
1,550 3,400 1,700 3,400 1,530 2,507 1,750 2,750 1,365 2,700 1,420 2,263 1,550 4,350
rEsidEntial Units
WALK-UP 85 TO 120 M2/UNIT 1,650 2,750 1,500 3,200 1,633 3,277 1,970 2,370 1,465 3,050 1,745 2,803 - -
TOWNHOUSES 90 TO 120 M2/UNIT 1,700 2,600 1,500 2,700 1,633 3,194 1,970 2,370 1,415 2,650 1,585 2,613 - -
MUlti-storEy Units
Up to 10 storeys with lift
UNITS 60-70 M2 2,350 3,450 2,100 2,900 2,705 3,319 2,030 2,430 2,225 2,850 2,280 2,975 2,600 3,300
UNITS 90-120 M2 2,250 3,350 2,000 2,700 2,653 3,267 2,010 2,400 2,200 2,900 2,230 2,880 2,350 3,050
over 10 and up to 20 storey
UNITS 60-70 M2 2,450 3,550 2,400 2,900 2,923 3,537 2,100 2,520 2,530 3,235 2,725 3,375 2,750 3,600
UNITS 90-120 M2 2,400 3,450 2,400 2,800 2,861 3,537 2,050 2,480 2,500 3,250 2,655 3,275 2,600 3,400
over 20 and up to 40 storey
UNITS 60-70 M2 2,750 3,500 2,400 3,200 3,371 3,850 2,340 2,650 3,000 3,500 3,405 3,830 3,550 4,350
UNITS 90-120 M2 2,700 3,450 2,300 3,000 3,267 3,642 2,280 2,580 2,800 3,400 3,335 3,780 3,400 4,000
over 40 and up to 80 storey
UNITS 60-70 M2 - - 2,900 3,700 - - - - 3,350 4,000 3,810 4,475 4,100 4,950
UNITS 90-120 M2 - - 2,800 3,500 - - - - 3,200 3,900 3,665 4,395 4,000 4,850

Rider Levett Bucknall | Riders Digest 201620
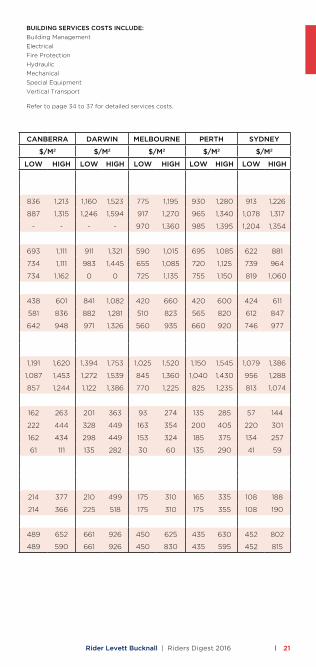
aUstralian constrUctionBUildinG sErvicEs cost
N.B. All costs current as at Fourth Quarter 2015.
cost ranGE PEr Gross floor arEa
adElaidE BrisBanE canBErra darWin MElBoUrnE PErth sydnEy
$/M2 $/M2 $/M2 $/M2 $/M2 $/M2 $/M2
loW hiGh loW hiGh loW hiGh loW hiGh loW hiGh loW hiGh loW hiGh
officE BUildinGs
Prestige, cBd
10 TO 25 STOREYS (75-80% EFFICIENCY) 726 1,083 793 1,203 836 1,213 1,160 1,523 775 1,195 930 1,280 913 1,226
25 TO 40 STOREYS (70-75% EFFICIENCY) 778 1,186 883 1,320 887 1,315 1,246 1,594 917 1,270 965 1,340 1,078 1,317
40 TO 55 STOREYS (68-73% EFFICIENCY) - - 1,034 1,515 - - - - 970 1,360 985 1,395 1,204 1,354
investment, cBd
UP TO 10 STOREYS (81-85% EFFICIENCY) 710 967 710 935 693 1,111 911 1,321 590 1,015 695 1,085 622 881
10 TO 25 STOREYS (76-81% EFFICIENCY) 713 1,019 761 1,029 734 1,111 983 1,445 655 1,085 720 1,125 739 964
25 TO 40 STOREYS (71-76% EFFICIENCY) 733 1,066 805 1,173 734 1,162 0 0 725 1,135 755 1,150 819 1,060
invEstMEnt, othEr than cBd
WALK UP (83-87% EFFICIENCY) 383 559 488 601 438 601 841 1,082 420 660 420 600 424 611
UP TO 10 STOREYS (82-86% EFFICIENCY) 529 755 649 906 581 836 882 1,281 510 823 565 820 612 847
10 TO 25 STOREYS (77-82% EFFICIENCY) - - 721 1,038 642 948 971 1,326 560 935 660 920 746 977
hotEls
Multi-storey
FIVE STAR 1,008 1,416 1,057 1,471 1,191 1,620 1,394 1,753 1,025 1,520 1,150 1,545 1,079 1,386
FOUR STAR 905 1,241 1,040 1,436 1,087 1,453 1,272 1,539 845 1,360 1,040 1,430 956 1,288
THREE STAR 853 1,040 912 1,298 857 1,244 1,122 1,386 770 1,225 825 1,235 813 1,074
car ParK
OPEN DECK MULTI-STOREY 127 259 114 251 162 263 201 363 93 274 135 285 57 144
BASEMENT: CBD 206 408 194 434 222 444 328 449 163 354 200 405 220 301
BASEMENT: OTHER THAN CBD 206 408 194 434 162 434 298 449 153 324 185 375 134 257
UNDERCROFT: OTHER THAN CBD 100 111 44 69 61 111 135 282 30 60 135 290 41 59
indUstrial BUildinGs
6.00m to underside of truss and 4,500 M2 Gross floor area with:
ZINCALUME METAL CLADDING 204 289 187 360 214 377 210 499 175 310 165 335 108 188
PRECAST CONCRETE CLADDING 204 330 187 360 214 366 225 518 175 310 175 355 108 190
attached air conditioned offices
200 M2 464 608 456 612 489 652 661 926 450 625 435 630 452 802
400 M2 457 601 456 612 489 590 661 926 450 830 435 595 452 815
Rider Levett Bucknall | Riders Digest 2016 21
cost ranGE PEr Gross floor arEa
adElaidE BrisBanE canBErra darWin MElBoUrnE PErth sydnEy
$/M2 $/M2 $/M2 $/M2 $/M2 $/M2 $/M2
loW hiGh loW hiGh loW hiGh loW hiGh loW hiGh loW hiGh loW hiGh
officE BUildinGs
Prestige, cBd
10 TO 25 STOREYS (75-80% EFFICIENCY) 726 1,083 793 1,203 836 1,213 1,160 1,523 775 1,195 930 1,280 913 1,226
25 TO 40 STOREYS (70-75% EFFICIENCY) 778 1,186 883 1,320 887 1,315 1,246 1,594 917 1,270 965 1,340 1,078 1,317
40 TO 55 STOREYS (68-73% EFFICIENCY) - - 1,034 1,515 - - - - 970 1,360 985 1,395 1,204 1,354
investment, cBd
UP TO 10 STOREYS (81-85% EFFICIENCY) 710 967 710 935 693 1,111 911 1,321 590 1,015 695 1,085 622 881
10 TO 25 STOREYS (76-81% EFFICIENCY) 713 1,019 761 1,029 734 1,111 983 1,445 655 1,085 720 1,125 739 964
25 TO 40 STOREYS (71-76% EFFICIENCY) 733 1,066 805 1,173 734 1,162 0 0 725 1,135 755 1,150 819 1,060
invEstMEnt, othEr than cBd
WALK UP (83-87% EFFICIENCY) 383 559 488 601 438 601 841 1,082 420 660 420 600 424 611
UP TO 10 STOREYS (82-86% EFFICIENCY) 529 755 649 906 581 836 882 1,281 510 823 565 820 612 847
10 TO 25 STOREYS (77-82% EFFICIENCY) - - 721 1,038 642 948 971 1,326 560 935 660 920 746 977
hotEls
Multi-storey
FIVE STAR 1,008 1,416 1,057 1,471 1,191 1,620 1,394 1,753 1,025 1,520 1,150 1,545 1,079 1,386
FOUR STAR 905 1,241 1,040 1,436 1,087 1,453 1,272 1,539 845 1,360 1,040 1,430 956 1,288
THREE STAR 853 1,040 912 1,298 857 1,244 1,122 1,386 770 1,225 825 1,235 813 1,074
car ParK
OPEN DECK MULTI-STOREY 127 259 114 251 162 263 201 363 93 274 135 285 57 144
BASEMENT: CBD 206 408 194 434 222 444 328 449 163 354 200 405 220 301
BASEMENT: OTHER THAN CBD 206 408 194 434 162 434 298 449 153 324 185 375 134 257
UNDERCROFT: OTHER THAN CBD 100 111 44 69 61 111 135 282 30 60 135 290 41 59
indUstrial BUildinGs
6.00m to underside of truss and 4,500 M2 Gross floor area with:
ZINCALUME METAL CLADDING 204 289 187 360 214 377 210 499 175 310 165 335 108 188
PRECAST CONCRETE CLADDING 204 330 187 360 214 366 225 518 175 310 175 355 108 190
attached air conditioned offices
200 M2 464 608 456 612 489 652 661 926 450 625 435 630 452 802
400 M2 457 601 456 612 489 590 661 926 450 830 435 595 452 815
BUildinG sErvicEs costs inclUdE:
Building Management
Electrical
Fire Protection
Hydraulic
Mechanical
Special Equipment
Vertical Transport
Refer to page 34 to 37 for detailed services costs.

Rider Levett Bucknall | Riders Digest 201622
cost ranGE PEr Gross floor arEa
adElaidE BrisBanE canBErra darWin MElBoUrnE PErth sydnEy
$/M2 $/M2 $/M2 $/M2 $/M2 $/M2 $/M2
loW hiGh loW hiGh loW hiGh loW hiGh loW hiGh loW hiGh loW hiGh
aGEd carE
SINGLE STOREY FACILITY 415 677 488 794 396 739 883 1,322 450 1,055 680 1,180 356 668
PrivatE hosPitals
low rise hospital
45-60 M2 GFA/BED 1,197 1,459 901 1,600 1,035 1,366 1,433 1,680 954 1,433 1,080 1,410 920 1,212
55-80 M2 GFA/BED WITH MAJOR OPERATING THEATRE
1,404 1,870 1,385 2,060 1,259 1,803 1,580 1,981 1,157 1,925 1,335 1,825 1,235 1,767
cinEMas
GROUP COMPLEx, 2,000 - 4,000 SEATS. (WARM SHELL)
768 1,037 575 935 752 905 1,013 1,278 600 880 680 910 896 1,329
rEGional shoPPinG cEntrEs
DEPARTMENT STORE 402 697 507 796 706 812 642 877 510 787 600 825 448 624
SUPERMARKET/VARIETY STORE 417 652 512 787 443 664 662 920 405 750 480 655 450 627
DISCOUNT DEPARTMENT STORE 424 595 487 652 443 601 602 840 355 650 495 625 423 565
MALLS 508 773 577 857 548 812 577 918 470 875 - - 480 774
SPECIALITY SHOPS 292 558 460 655 390 611 519 762 325 655 350 590 463 698
sMall shoPs and shoWrooMs 396 620 315 595 233 634 417 760 211 626 225 570 312 509
rEsidEntial
SINGLE AND DOUBLE STOREY DWELLINGS. (CUSTOM BUILT)
243 536 243 569 224 499 336 649 200 610 190 463 174 661
rEsidEntial Units
WALK-UP 85 TO 120 M2/UNIT 204 463 229 454 223 627 400 574 200 550 195 483 196 621
TOWNHOUSES 90 TO 120 M2/UNIT 207 471 229 445 117 627 400 574 200 530 195 483 168 588
MUlti-storEy Units
Up to 10 storeys with lift
UNITS 60-70 M2 460 726 432 823 521 846 654 851 475 842 495 860 568 823
UNITS 90-120 M2 439 681 417 792 521 792 620 809 470 812 485 830 535 799
over 10 and up to 20 storey
UNITS 60-70 M2 465 786 522 822 564 846 648 846 505 866 560 855 650 890
UNITS 90-120 M2 452 772 498 784 564 933 636 829 500 836 550 825 620 816
over 20 and up to 40 storey
UNITS 60-70 M2 510 886 593 937 674 957 712 875 580 949 655 945 693 1,017
UNITS 90-120 M2 496 858 572 898 630 957 696 855 565 861 635 925 682 957
over 40 and up to 80 storey
UNITS 60-70 M2 - - 786 1,051 - - - - 750 1,167 865 1,100 914 1,218
UNITS 90-120 M2 - - 731 1,000 - - - - 700 1,117 845 1,085 891 1,208
aUstralian constrUctionBUildinG sErvicEs cost
N.B. All costs current as at Fourth Quarter 2015.

Rider Levett Bucknall | Riders Digest 2016 23
cost ranGE PEr Gross floor arEa
adElaidE BrisBanE canBErra darWin MElBoUrnE PErth sydnEy
$/M2 $/M2 $/M2 $/M2 $/M2 $/M2 $/M2
loW hiGh loW hiGh loW hiGh loW hiGh loW hiGh loW hiGh loW hiGh
aGEd carE
SINGLE STOREY FACILITY 415 677 488 794 396 739 883 1,322 450 1,055 680 1,180 356 668
PrivatE hosPitals
low rise hospital
45-60 M2 GFA/BED 1,197 1,459 901 1,600 1,035 1,366 1,433 1,680 954 1,433 1,080 1,410 920 1,212
55-80 M2 GFA/BED WITH MAJOR OPERATING THEATRE
1,404 1,870 1,385 2,060 1,259 1,803 1,580 1,981 1,157 1,925 1,335 1,825 1,235 1,767
cinEMas
GROUP COMPLEx, 2,000 - 4,000 SEATS. (WARM SHELL)
768 1,037 575 935 752 905 1,013 1,278 600 880 680 910 896 1,329
rEGional shoPPinG cEntrEs
DEPARTMENT STORE 402 697 507 796 706 812 642 877 510 787 600 825 448 624
SUPERMARKET/VARIETY STORE 417 652 512 787 443 664 662 920 405 750 480 655 450 627
DISCOUNT DEPARTMENT STORE 424 595 487 652 443 601 602 840 355 650 495 625 423 565
MALLS 508 773 577 857 548 812 577 918 470 875 - - 480 774
SPECIALITY SHOPS 292 558 460 655 390 611 519 762 325 655 350 590 463 698
sMall shoPs and shoWrooMs 396 620 315 595 233 634 417 760 211 626 225 570 312 509
rEsidEntial
SINGLE AND DOUBLE STOREY DWELLINGS. (CUSTOM BUILT)
243 536 243 569 224 499 336 649 200 610 190 463 174 661
rEsidEntial Units
WALK-UP 85 TO 120 M2/UNIT 204 463 229 454 223 627 400 574 200 550 195 483 196 621
TOWNHOUSES 90 TO 120 M2/UNIT 207 471 229 445 117 627 400 574 200 530 195 483 168 588
MUlti-storEy Units
Up to 10 storeys with lift
UNITS 60-70 M2 460 726 432 823 521 846 654 851 475 842 495 860 568 823
UNITS 90-120 M2 439 681 417 792 521 792 620 809 470 812 485 830 535 799
over 10 and up to 20 storey
UNITS 60-70 M2 465 786 522 822 564 846 648 846 505 866 560 855 650 890
UNITS 90-120 M2 452 772 498 784 564 933 636 829 500 836 550 825 620 816
over 20 and up to 40 storey
UNITS 60-70 M2 510 886 593 937 674 957 712 875 580 949 655 945 693 1,017
UNITS 90-120 M2 496 858 572 898 630 957 696 855 565 861 635 925 682 957
over 40 and up to 80 storey
UNITS 60-70 M2 - - 786 1,051 - - - - 750 1,167 865 1,100 914 1,218
UNITS 90-120 M2 - - 731 1,000 - - - - 700 1,117 845 1,085 891 1,208

Rider Levett Bucknall | Riders Digest 201624
aUstralian constrUctionrlB tEndEr PricE indEX
datE adElaidE BrisBanE canBErra darWin MElBoUrnE PErth sydnEy
tPi cPi tPi cPi tPi cPi tPi cPi tPi cPi tPi cPi tPi cPi
DEC. 72 11.7 11.7 12.7 12.7 13.8 13.8 14.8 14.8 14.5 14.5
DEC. 73 14.7 13.3 15.6 14.5 15.3 15.7 17.0 16.4 16.2 16.4
DEC. 74 19.3 15.6 19.8 16.7 19.4 18.2 21.6 19.2 21.4 19.1
DEC. 75 22.6 17.7 20.6 19.1 22.6 20.9 26.3 22.0 24.6 21.7
DEC. 76 26.6 20.7 21.8 21.8 25.4 23.9 30.5 25.7 25.7 24.5
DEC. 77 28.9 22.7 23.6 23.7 27.7 26.2 34.2 28.6 27.7 26.5
DEC. 78 30.6 24.2 24.4 25.8 24.4 24.4 29.4 28.2 35.7 30.6 29.3 28.7
DEC. 79 32.6 26.7 26.9 28.1 26.7 26.9 32.3 31.0 36.0 33.5 32.5 31.7
DEC. 80 35.8 29.0 36.2 30.6 30.2 29.6 35.5 33.9 38.4 36.3 37.3 34.7
DEC. 81 40.5 32.3 41.0 34.2 34.9 32.9 39.6 37.8 43.9 40.8 43.6 38.6
DEC. 82 45.7 35.8 46.2 37.8 40.7 36.9 44.4 41.7 51.3 44.8 46.9 43.2
DEC. 83 48.5 39.1 49.5 40.9 45.2 39.8 47.3 45.7 53.4 48.6 49.7 46.4
DEC. 84 51.1 40.4 51.6 42.4 47.9 41.1 52.0 46.8 56.0 49.5 52.6 47.5
DEC. 85 55.6 43.8 54.3 45.7 53.9 44.7 58.5 50.7 65.8 53.6 60.6 51.5
DEC. 86 59.7 47.9 56.5 49.8 59.3 48.6 63.4 55.9 72.6 59.1 67.2 56.5
DEC. 87 65.0 51.1 60.4 53.3 63.3 51.8 69.3 59.8 76.5 63.2 74.1 60.5
DEC. 88 70.1 54.6 65.4 57.0 68.5 55.4 74.9 63.9 81.7 68.0 80.6 66.1
DEC. 89 75.4 58.6 60.5 61.4 70.9 59.5 81.9 69.2 89.5 73.3 86.8 71.0
DEC. 90 79.6 63.1 55.2 65.2 73.7 63.5 82.6 74.4 92.1 78.8 84.1 75.5
DEC. 91 79.7 64.3 53.3 66.3 65.8 64.6 76.7 75.6 91.2 78.6 75.1 76.6
DEC. 92 78.7 65.4 55.2 66.9 62.6 65.3 74.8 75.5 91.2 78.6 71.4 76.9
DEC. 93 81.2 66.6 57.5 68.1 76.0 66.7 77.0 77.4 91.2 80.5 72.5 77.9
DEC. 94 83.5 68.6 62.3 70.3 78.1 68.2 78.3 79.0 92.1 82.2 75.4 80.0
DEC. 95 84.7 71.6 65.5 73.4 82.6 71.9 79.8 82.7 93.0 86.2 79.1 84.7
DEC. 96 86.1 72.5 68.4 74.6 84.1 72.7 82.0 83.7 95.0 87.8 83.8 86.1
DEC. 97 86.8 71.6 71.7 75.1 83.9 71.8 84.1 83.7 97.2 87.1 89.7 86.0
DEC. 98 87.1 73.0 75.6 76.0 85.5 72.8 86.8 84.4 99.3 89.1 96.1 87.6
DEC. 99 87.0 74.3 78.2 76.7 87.1 74.0 88.0 89.4 86.1 101.9 90.9 100.0 89.3
DEC. 00 88.2 78.3 78.3 81.4 92.5 78.6 89.8 93.8 91.3 102.6 95.5 99.9 94.6
DEC. 01 90.1 80.7 79.7 84.0 93.1 80.8 91.8 96.7 94.1 100.6 98.3 100.9 97.8
DEC. 02 94.6 83.7 87.5 86.5 97.5 83.4 93.7 93.7 104.6 97.0 103.8 101.1 103.9 100.5
DEC. 03 102.9 86.4 95.0 89.2 103.0 85.6 101.1 95.2 110.1 99.2 112.1 103.1 110.1 102.8
DEC. 04 112.4 88.6 106.8 91.4 110.4 87.6 113.2 97.1 114.7 101.5 124.5 106.2 117.8 105.5
DEC. 05 119.4 91.0 118.9 94.1 117.8 90.3 121.8 100.0 118.4 104.2 135.0 110.4 123.1 108.0
DEC. 06 126.2 93.9 129.3 97.3 125.0 93.2 132.7 105.0 122.2 107.2 147.2 115.2 128.7 111.5
DEC. 07 134.0 96.5 137.5 101.0 130.8 96.3 144.7 108.0 128.0 110.6 163.4 118.8 133.2 114.2
DEC. 08 142.5 100.0 127.1 105.4 134.9 99.9 159.1 112.0 129.6 114.1 159.9 123.2 139.2 118.4
DEC. 09 138.6 102.1 119.8 108.0 136.5 102.2 164.7 115.4 131.8 116.2 150.0 125.7 139.2 121.0
DEC. 10 142.5 104.7 119.0 111.3 141.0 104.4 168.0 118.1 137.4 119.8 147.6 129.0 140.6 123.9
DEC. 11 137.9 108.5 119.3 114.0 143.0 108.0 148.8 121.0 141.4 123.5 149.5 132.8 143.7 127.9
DEC. 12 138.1 110.8 119.3 116.5 142.1 109.9 151.8 124.1 141.4 126.1 146.1 135.6 145.4 131.1
DEC. 13 139.3 113.3 118.2 118.9 145.3 112.3 156.4 129.5 141.8 129.5 147.7 139.6 148.3 134.6
MAR. 14 140.0 114.0 118.8 119.8 146.0 112.9 157.5 130.6 142.3 130.1 148.5 140.5 149.4 135.3
JUN. 14 140.0 114.5 119.4 120.4 146.0 113.1 158.7 131.5 142.9 130.9 149.2 141.5 150.5 135.8
SEP. 14 140.1 114.9 120.6 121.1 146.9 113.5 159.9 131.7 143.4 131.1 149.9 142.2 151.6 136.6
DEC. 14 140.1 115.2 122.4 122.0 147.5 113.6 161.1 132.0 143.9 131.4 150.7 142.3 152.8 136.9
MAR. 15 140.5 115.3 125.8 122.0 148.2 113.5 159.5 131.7 144.6 131.5 148.9 142.5 154.5 137.5
JUN. 15 140.6 115.9 127.7 122.8 149.3 114.0 159.9 131.7 145.2 132.4 148.9 143.3 156.2 138.8
SEP. 15 140.9 116.2 129.6 123.6 149.9 114.2 160.3 132.2 146.0 133.0 149.6 143.8 157.9 139.2
DEC. 15 141.2 131.6 150.5 160.7 146.8 150.0 159.7

Rider Levett Bucknall | Riders Digest 2016 25
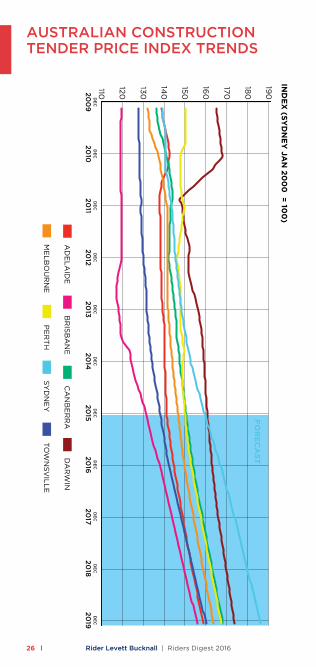
The following indices reflect the change in tender levels for buildings, other than housing, as compared with the consumer price index. The Tender Price Index figures take into account labour and material cost changes and market conditions.
datE adElaidE BrisBanE canBErra darWin MElBoUrnE PErth sydnEy
tPi cPi tPi cPi tPi cPi tPi cPi tPi cPi tPi cPi tPi cPi
DEC. 72 11.7 11.7 12.7 12.7 13.8 13.8 14.8 14.8 14.5 14.5
DEC. 73 14.7 13.3 15.6 14.5 15.3 15.7 17.0 16.4 16.2 16.4
DEC. 74 19.3 15.6 19.8 16.7 19.4 18.2 21.6 19.2 21.4 19.1
DEC. 75 22.6 17.7 20.6 19.1 22.6 20.9 26.3 22.0 24.6 21.7
DEC. 76 26.6 20.7 21.8 21.8 25.4 23.9 30.5 25.7 25.7 24.5
DEC. 77 28.9 22.7 23.6 23.7 27.7 26.2 34.2 28.6 27.7 26.5
DEC. 78 30.6 24.2 24.4 25.8 24.4 24.4 29.4 28.2 35.7 30.6 29.3 28.7
DEC. 79 32.6 26.7 26.9 28.1 26.7 26.9 32.3 31.0 36.0 33.5 32.5 31.7
DEC. 80 35.8 29.0 36.2 30.6 30.2 29.6 35.5 33.9 38.4 36.3 37.3 34.7
DEC. 81 40.5 32.3 41.0 34.2 34.9 32.9 39.6 37.8 43.9 40.8 43.6 38.6
DEC. 82 45.7 35.8 46.2 37.8 40.7 36.9 44.4 41.7 51.3 44.8 46.9 43.2
DEC. 83 48.5 39.1 49.5 40.9 45.2 39.8 47.3 45.7 53.4 48.6 49.7 46.4
DEC. 84 51.1 40.4 51.6 42.4 47.9 41.1 52.0 46.8 56.0 49.5 52.6 47.5
DEC. 85 55.6 43.8 54.3 45.7 53.9 44.7 58.5 50.7 65.8 53.6 60.6 51.5
DEC. 86 59.7 47.9 56.5 49.8 59.3 48.6 63.4 55.9 72.6 59.1 67.2 56.5
DEC. 87 65.0 51.1 60.4 53.3 63.3 51.8 69.3 59.8 76.5 63.2 74.1 60.5
DEC. 88 70.1 54.6 65.4 57.0 68.5 55.4 74.9 63.9 81.7 68.0 80.6 66.1
DEC. 89 75.4 58.6 60.5 61.4 70.9 59.5 81.9 69.2 89.5 73.3 86.8 71.0
DEC. 90 79.6 63.1 55.2 65.2 73.7 63.5 82.6 74.4 92.1 78.8 84.1 75.5
DEC. 91 79.7 64.3 53.3 66.3 65.8 64.6 76.7 75.6 91.2 78.6 75.1 76.6
DEC. 92 78.7 65.4 55.2 66.9 62.6 65.3 74.8 75.5 91.2 78.6 71.4 76.9
DEC. 93 81.2 66.6 57.5 68.1 76.0 66.7 77.0 77.4 91.2 80.5 72.5 77.9
DEC. 94 83.5 68.6 62.3 70.3 78.1 68.2 78.3 79.0 92.1 82.2 75.4 80.0
DEC. 95 84.7 71.6 65.5 73.4 82.6 71.9 79.8 82.7 93.0 86.2 79.1 84.7
DEC. 96 86.1 72.5 68.4 74.6 84.1 72.7 82.0 83.7 95.0 87.8 83.8 86.1
DEC. 97 86.8 71.6 71.7 75.1 83.9 71.8 84.1 83.7 97.2 87.1 89.7 86.0
DEC. 98 87.1 73.0 75.6 76.0 85.5 72.8 86.8 84.4 99.3 89.1 96.1 87.6
DEC. 99 87.0 74.3 78.2 76.7 87.1 74.0 88.0 89.4 86.1 101.9 90.9 100.0 89.3
DEC. 00 88.2 78.3 78.3 81.4 92.5 78.6 89.8 93.8 91.3 102.6 95.5 99.9 94.6
DEC. 01 90.1 80.7 79.7 84.0 93.1 80.8 91.8 96.7 94.1 100.6 98.3 100.9 97.8
DEC. 02 94.6 83.7 87.5 86.5 97.5 83.4 93.7 93.7 104.6 97.0 103.8 101.1 103.9 100.5
DEC. 03 102.9 86.4 95.0 89.2 103.0 85.6 101.1 95.2 110.1 99.2 112.1 103.1 110.1 102.8
DEC. 04 112.4 88.6 106.8 91.4 110.4 87.6 113.2 97.1 114.7 101.5 124.5 106.2 117.8 105.5
DEC. 05 119.4 91.0 118.9 94.1 117.8 90.3 121.8 100.0 118.4 104.2 135.0 110.4 123.1 108.0
DEC. 06 126.2 93.9 129.3 97.3 125.0 93.2 132.7 105.0 122.2 107.2 147.2 115.2 128.7 111.5
DEC. 07 134.0 96.5 137.5 101.0 130.8 96.3 144.7 108.0 128.0 110.6 163.4 118.8 133.2 114.2
DEC. 08 142.5 100.0 127.1 105.4 134.9 99.9 159.1 112.0 129.6 114.1 159.9 123.2 139.2 118.4
DEC. 09 138.6 102.1 119.8 108.0 136.5 102.2 164.7 115.4 131.8 116.2 150.0 125.7 139.2 121.0
DEC. 10 142.5 104.7 119.0 111.3 141.0 104.4 168.0 118.1 137.4 119.8 147.6 129.0 140.6 123.9
DEC. 11 137.9 108.5 119.3 114.0 143.0 108.0 148.8 121.0 141.4 123.5 149.5 132.8 143.7 127.9
DEC. 12 138.1 110.8 119.3 116.5 142.1 109.9 151.8 124.1 141.4 126.1 146.1 135.6 145.4 131.1
DEC. 13 139.3 113.3 118.2 118.9 145.3 112.3 156.4 129.5 141.8 129.5 147.7 139.6 148.3 134.6
MAR. 14 140.0 114.0 118.8 119.8 146.0 112.9 157.5 130.6 142.3 130.1 148.5 140.5 149.4 135.3
JUN. 14 140.0 114.5 119.4 120.4 146.0 113.1 158.7 131.5 142.9 130.9 149.2 141.5 150.5 135.8
SEP. 14 140.1 114.9 120.6 121.1 146.9 113.5 159.9 131.7 143.4 131.1 149.9 142.2 151.6 136.6
DEC. 14 140.1 115.2 122.4 122.0 147.5 113.6 161.1 132.0 143.9 131.4 150.7 142.3 152.8 136.9
MAR. 15 140.5 115.3 125.8 122.0 148.2 113.5 159.5 131.7 144.6 131.5 148.9 142.5 154.5 137.5
JUN. 15 140.6 115.9 127.7 122.8 149.3 114.0 159.9 131.7 145.2 132.4 148.9 143.3 156.2 138.8
SEP. 15 140.9 116.2 129.6 123.6 149.9 114.2 160.3 132.2 146.0 133.0 149.6 143.8 157.9 139.2
DEC. 15 141.2 131.6 150.5 160.7 146.8 150.0 159.7
Rider Levett Bucknall | Riders Digest 201626
aUstralian constrUctiontEndEr PricE indEX trEnds
AD
EL
AID
EB
RIS
BA
NE
CA
NB
ER
RA
DA
RW
IN
ME
LB
OU
RN
EP
ER
TH
SY
DN
EY
TO
WN
SV
ILL
E
150
160
140
120
130
110
170
180
190
IND
EX
(SY
DN
EY
JAN
20
00
= 10
0)
FO
RE
CA
ST
20
09
DE
C
20
10D
EC
20
11D
EC
20
12D
EC
20
13D
EC
20
14D
EC
20
15D
EC
20
16D
EC
20
17D
EC
20
18D
EC
20
19D
EC

Rider Levett Bucknall | Riders Digest 2016 27
rElativitiEs MatriX foUrth QUartEr 2015
ad
El
aid
E10
0B
ris
Ba
nE
100
ca
nB
Er
ra
100
da
rW
in
100
Go
ld
co
as
t
100
ME
lB
oU
rn
E10
0P
Er
th
100
sy
dn
Ey
100
to
Wn
sv
ill
E10
0
BN
E8
9A
DE
112
AD
E9
5A
DE
88
AD
E11
8A
DE
118
AD
E9
4A
DE
91
AD
E10
4
CA
N10
5C
AN
118
BN
E8
5B
NE
79
BN
E10
6B
NE
106
BN
E8
4B
NE
81
BN
E9
3
DA
R11
3D
AR
127
DA
R10
8C
AN
93
CA
N12
5C
AN
125
CA
N10
0C
AN
96
CA
N11
0
GC
85
GC
95
GC
80
GC
75
DA
R13
4D
AR
134
GC
80
GC
77
GC
88
ME
L10
3M
EL
115
ME
L9
8M
EL
91
ME
L12
2M
EL
122
DA
R10
7D
AR
103
DA
R11
8
PE
R10
6P
ER
118
PE
R10
0P
ER
93
PE
R12
5P
ER
125
ME
L9
7M
EL
94
ME
L10
7
SY
D11
0S
YD
123
SY
D10
4S
YD
97
SY
D13
0S
YD
130
SY
D10
4P
ER
96
PE
R11
0
TV
E9
6T
VE
107
TV
E9
1T
VE
85
TV
E11
4T
VE
114
TV
E9
1T
VE
88
SY
D11
4
Rider Levett Bucknall | Riders Digest 201628
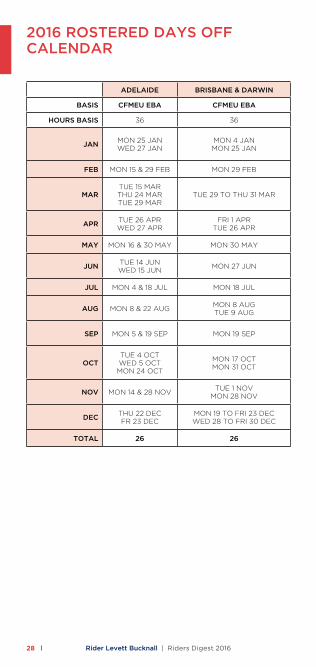
2016 rostErEd days off calEndar
adElaidE BrisBanE & darWin canBErra MElBoUrnE PErth sydnEy
Basis cfMEU EBa cfMEU EBa cfMEU EBa cfMEU EBa aWard cfMEU EBa
hoUrs Basis 36 36 36 36 38 38
JanMON 25 JANWED 27 JAN
MON 4 JANMON 25 JAN
MON 4 JANFRI 22 JAN
MON 25 JAN
WED 6 TO FRI 8 JAN
MON 25 JANMON 25 JAN MON 25 JAN
fEB MON 15 & 29 FEB MON 29 FEB MON 8 & 22 FEB MON 8 & 22 FEB MON 15 FEB MON 29 FEB
MarTUE 15 MARTHU 24 MARTUE 29 MAR
TUE 29 TO THU 31 MARTUE 15 MARTHU 24 MARTUE 29 MAR
TUE 15 MARTUE 29 MAR
TUE 8 MAR TUE 29 MAR
aPrTUE 26 APRWED 27 APR
FRI 1 APR TUE 26 APR
MON 18 APRTUE 26 APR
MON 11 APRTUE 26 APR
TUE 26 APR TUE 26 APR
May MON 16 & 30 MAY MON 30 MAY MON 9 & 16 MAY MON 9 & 23 MAY MON 16 MAY MON 23 MAY
JUnTUE 14 JUNWED 15 JUN
MON 27 JUNFRI 10 JUNTUE 14 JUN
TUE 14 JUNMON 27 JUN
TUE 7 JUN TUE 14 JUN
JUl MON 4 & 18 JUL MON 18 JUL MON 11 & 18 JUL MON 11 & 25 JUL MON 4 JUL MON 18 JUL
aUG MON 8 & 22 AUGMON 8 AUGTUE 9 AUG
MON 8 & 22 AUG MON 8 & 22 AUGMON 1 AUG
MON 29 AUGMON 15 AUG
sEP MON 5 & 19 SEP MON 19 SEPMON 5 SEPFRI 23 SEP
MON 5 SEPMON 19 SEP
TUE 27 SEP MON 12 SEP
octTUE 4 OCTWED 5 OCTMON 24 OCT
MON 17 OCT MON 31 OCT
TUE 4 OCTMON 24 OCT
MON 3, 17 & 31 OCT MON 31 OCT TUE 4 OCT
nov MON 14 & 28 NOVTUE 1 NOV
MON 28 NOVMON 14 NOV MON 28 NOV
WED 2 NOVMON 21 NOV
MON 28 NOV MON 7 NOV
dEcTHU 22 DECFR 23 DEC
MON 19 TO FRI 23 DECWED 28 TO FRI 30 DEC
MON 12 DECWED 28 DEC
FRI 23 DEC FRI 23 DECTUE 6 DEC
WED 28 DEC
total 26 26 26 26 13 13

Rider Levett Bucknall | Riders Digest 2016 29
adElaidE BrisBanE & darWin canBErra MElBoUrnE PErth sydnEy
Basis cfMEU EBa cfMEU EBa cfMEU EBa cfMEU EBa aWard cfMEU EBa
hoUrs Basis 36 36 36 36 38 38
JanMON 25 JANWED 27 JAN
MON 4 JANMON 25 JAN
MON 4 JANFRI 22 JAN
MON 25 JAN
WED 6 TO FRI 8 JAN
MON 25 JANMON 25 JAN MON 25 JAN
fEB MON 15 & 29 FEB MON 29 FEB MON 8 & 22 FEB MON 8 & 22 FEB MON 15 FEB MON 29 FEB
MarTUE 15 MARTHU 24 MARTUE 29 MAR
TUE 29 TO THU 31 MARTUE 15 MARTHU 24 MARTUE 29 MAR
TUE 15 MARTUE 29 MAR
TUE 8 MAR TUE 29 MAR
aPrTUE 26 APRWED 27 APR
FRI 1 APR TUE 26 APR
MON 18 APRTUE 26 APR
MON 11 APRTUE 26 APR
TUE 26 APR TUE 26 APR
May MON 16 & 30 MAY MON 30 MAY MON 9 & 16 MAY MON 9 & 23 MAY MON 16 MAY MON 23 MAY
JUnTUE 14 JUNWED 15 JUN
MON 27 JUNFRI 10 JUNTUE 14 JUN
TUE 14 JUNMON 27 JUN
TUE 7 JUN TUE 14 JUN
JUl MON 4 & 18 JUL MON 18 JUL MON 11 & 18 JUL MON 11 & 25 JUL MON 4 JUL MON 18 JUL
aUG MON 8 & 22 AUGMON 8 AUGTUE 9 AUG
MON 8 & 22 AUG MON 8 & 22 AUGMON 1 AUG
MON 29 AUGMON 15 AUG
sEP MON 5 & 19 SEP MON 19 SEPMON 5 SEPFRI 23 SEP
MON 5 SEPMON 19 SEP
TUE 27 SEP MON 12 SEP
octTUE 4 OCTWED 5 OCTMON 24 OCT
MON 17 OCT MON 31 OCT
TUE 4 OCTMON 24 OCT
MON 3, 17 & 31 OCT MON 31 OCT TUE 4 OCT
nov MON 14 & 28 NOVTUE 1 NOV
MON 28 NOVMON 14 NOV MON 28 NOV
WED 2 NOVMON 21 NOV
MON 28 NOV MON 7 NOV
dEcTHU 22 DECFR 23 DEC
MON 19 TO FRI 23 DECWED 28 TO FRI 30 DEC
MON 12 DECWED 28 DEC
FRI 23 DEC FRI 23 DECTUE 6 DEC
WED 28 DEC
total 26 26 26 26 13 13

Rider Levett Bucknall | Riders Digest 201630
aUstralian constrUctionrEGional indicEs
The construction cost information in this publication is based upon rates for capital city construction projects and are current for the Fourth Quarter 2015. For towns or cities outside capital cities, costs can be expected to vary in accordance with the following table of indices:
The above table should be used only as a comparative guide, and is only appropriate for the urban precincts nominated and for the larger commercial projects.
Care must be taken to review specific local market conditions within the anticipated time frame of a project development period before establishing and committing viable budgets for projects.
In the event that projects are required to be constructed in remote locations or in areas without urban infrastructure, then special consideration must be given to the budget structure of these projects. Each project must be considered in detail and its specific resource requirements assessed and sourced to establish budget costs.
RLB recommend that advice on local market conditions be sought from our regional offices when initial project budgets and feasibility studies are in the process of establishment. (Our regional offices are identified on page 86.)
nEW soUth WalEs QUEEnslandWEstErn
aUstralia
SYDNEY 100 BRISBANE 100 PERTH 100
ARMIDALE 105 CAIRNS 105 ALBANY 108
COFFS HARBOUR
100 GLADSTONE 125 BROOME 155
NEWCASTLE 98 GOLD COAST 95 BUNBURY 103
ORANGE 106 MACKAY 114 CARNARVON 155
TAMWORTH 102SUNSHINE COAST
95 ESPERANCE 125
WAGGA WAGGA 106 TOWNSVILLE 107 GERALDTON 105
WOLLONGONG 100 KALGOORLIE 120
KUNUNURRA 175
PORT HEDLAND
160
TOM PRICE 170

Rider Levett Bucknall | Riders Digest 2016 31
cBd
Central Business District
BUildinG WorKs
Building works include substructure, structure, finishings, fittings, preliminary items, attendance and builder’s work in connection with services.
BUildinG sErvicEs
Building services include special equipment, hydraulics, fire protection, mechanical, vertical transport, building management and electrical services.
officE BUildinGs
Prestige offices are based on landmark office buildings located in major CBD Office Markets, which are pacesetters in establishing rents.
investment offices are based on high quality buildings which are built for the middle range of the rental market.
hotEls
ratinGGfa PEr rooM
total accoMModation. PUBlic sPacE
FIVE STAR 85-110 M2 45-55 M2 40-55 M2
FOUR STAR 65-85 M2 40-45 M2 25-40 M2
THREE STAR 40-65 M2 30-40 M2 10-25 M2
Note: Public space includes service areas.
car ParKs
Open Deck Multi-storey – minimal external walling.
Basement – CBD locations incur higher penalties for restricted sites and perimeter conditions.
indUstrial BUildinGs
Quality reflects a simplified type of construction suitable for light industry.
Exclusions: Hardstandings, Roadworks and Special Equipment.
aGEd carE
Single storey domestic construction with no operating theatre capacity, minimal specialist and service areas. 35-45 m2 G.F.A./bed (150 beds).
aUstralian constrUctiondEfinitions

Rider Levett Bucknall | Riders Digest 201632
hosPital
Low rise hospital (45 - 60 m2 G.F.A./Bed) - Minimal operating theatre capacity, specialist and service areas.
Low rise hospital (55 - 80 m2 G.F.A./Bed) - Major operating theatre capacity including extensive specialist and service areas.
Exclusions: Loose furniture, special medical equipment.
cinEMas
Multiplex Group Complex (warm shell). 2,000 – 4,000 seats.
Exclusions: Projection equipment, seating.
shoPPinG cEntrEs
department storePartially finished suspended ceilings and painted walls.
Exclusions: Floor finishes, shop fittings etc.
supermarket/variety storeFully finished and serviced space.
Exclusions: Cool rooms, shop fittings, refrigeration equipment etc.
MallsFully finished and serviced space.
specialty shopsPartially finished with ceilings, unpainted walls and power to perimeter point.
Exclusions: Floor finishes and shop fittings.
sMall shoPs and shoWrooMs
Exclusions: Floor finishes, plumbing (other than hot and cold water to sink fittings in each shop) and shop fittings.
rEsidEntial
single storey or 1-3 storeyUnits reflect medium quality accommodation.
Multi-storeyUnits reflect medium to luxury quality and air conditioned accommodation up to 80 storeys in height.
Note: the ratio of kitchen, laundry and bathroom areas to living areas considerably affects the cost range. Range given is significantly affected by the height and configuration of the building.
Exclusions: Loose furniture, special fittings, washing machines, dryers and refrigerators.

SydneyCOnSTRUCTIOn
34 BuildingServicesCosts
38 UnitCosts
39 OfficeFitoutCosts
40 HotelFurniture,Fittings&equipmentCosts
41 RecreationalFacilitiesCosts
43 demolitionCosts
44 SiteworksCosts
Rider Levett Bucknall | Riders Digest – Sydney 201634S
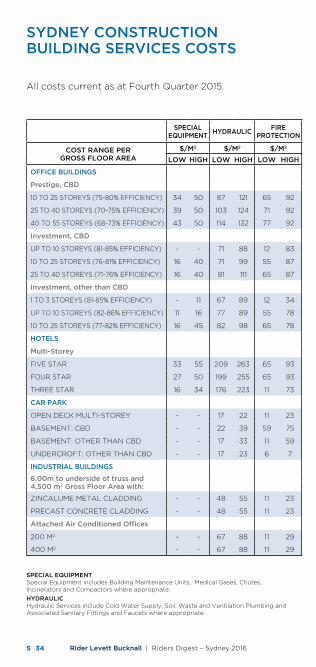
Sydney COnSTRUCTIOnBUILdInG SeRVICeS COSTS
AllcostscurrentasatFourthQuarter2015.
SPeCIAL eQUIPMenTSpecialequipmentincludesBuildingMaintenanceUnits,MedicalGases,Chutes,IncineratorsandCompactorswhereappropriate.
HydRAULICHydraulicServicesincludeColdWaterSupply,Soil,WasteandVentilationPlumbingandAssociatedSanitaryFittingsandFaucetswhereappropriate.
SPeCIAL eQUIPMenT
HydRAULICFIRe
PROTeCTIOnMeCHAnICAL
VeRTICAL TRAnSPORT
BUILdInG MAnAGeMenT
eLeCTRICAL TOTAL
COST RAnGe PeR GROSS FLOOR AReA
$/M2 $/M2 $/M2 $/M2 $/M2 $/M2 $/M2 $/M2
LOw HIGH LOw HIGH LOw HIGH LOw HIGH LOw HIGH LOw HIGH LOw HIGH LOw HIGH
OFFICe BUILdInGS
Prestige, CBd
10TO25STOReyS(75-80%eFFICIenCy) 34 50 87 121 65 92 333 392 179 242 35 85 180 244 913 1,226
25TO40STOReyS(70-75%eFFICIenCy) 39 50 103 124 71 92 343 402 246 296 51 85 225 268 1,078 1,317
40TO55STOReyS(68-73%eFFICIenCy) 43 50 114 132 77 92 387 413 268 306 68 85 247 276 1,204 1,354
Investment, CBd
UPTO10STOReyS(81-85%eFFICIenCy) - - 71 88 12 83 261 329 135 166 12 30 131 185 622 881
10TO25STOReyS(76-81%eFFICIenCy) 16 40 71 99 55 87 281 339 158 177 23 42 135 180 739 964
25TO40STOReyS(71-76%eFFICIenCy) 16 40 81 111 65 87 291 339 189 232 18 47 159 204 819 1,060
Investment, other than CBd
1TO3STOReyS(81-85%eFFICIenCy) - 11 67 89 12 34 230 263 - 50 11 30 104 134 424 611
UPTO10STOReyS(82-86%eFFICIenCy) 11 16 77 89 55 78 240 299 102 155 11 30 116 180 612 847
10TO25STOReyS(77-82%eFFICIenCy) 16 45 82 98 65 78 271 331 158 200 18 35 136 190 746 977
HOTeLS
Multi-Storey
FIVeSTAR 33 55 209 263 65 93 366 407 168 234 34 69 204 265 1,079 1,386
FOURSTAR 27 50 199 255 65 93 293 385 168 202 34 59 170 244 956 1,288
THReeSTAR 16 34 176 223 11 73 281 344 134 159 24 30 171 211 813 1,074
CAR PARK
OPendeCkMUlTI-STORey - - 17 22 11 23 - 17 - 27 - 11 29 44 57 144
BASeMenT:CBd - - 22 39 59 75 49 65 34 49 11 18 45 55 220 301
BASeMenT:OTHeRTHAnCBd - - 17 33 11 59 38 59 23 33 - 18 45 55 134 257
UndeRCROFT:OTHeRTHAnCBd - - 17 23 6 7 - - - - - 6 18 23 41 59
IndUSTRIAL BUILdInGS
6.00m to underside of truss and 4,500 m2 Gross Floor Area with:
ZInCAlUMeMeTAlClAddInG - - 48 55 11 23 - 11 - - - 5 49 94 108 188
PReCASTCOnCReTeClAddInG - - 48 55 11 23 - 11 - - - 5 49 96 108 190
Attached Air Conditioned Offices
200M2 - - 67 88 11 29 230 300 - 169 18 47 126 169 452 802
400M2 - - 67 88 11 29 230 304 - 167 18 47 126 180 452 815

Rider Levett Bucknall | Riders Digest – Sydney 2016 35S
FIRe PROTeCTIOnFireServicesincludedetectors,WardenCommunication,Sprinklers,Hydrants,HoseReelsandextinguishers.
MeCHAnICALMechanicalServicesincludeAirConditioning,Ventilation,HeatinganddomesticHotWaterwhereappropriate.
SPeCIAL eQUIPMenT
HydRAULICFIRe
PROTeCTIOnMeCHAnICAL
VeRTICAL TRAnSPORT
BUILdInG MAnAGeMenT
eLeCTRICAL TOTAL
COST RAnGe PeR GROSS FLOOR AReA
$/M2 $/M2 $/M2 $/M2 $/M2 $/M2 $/M2 $/M2
LOw HIGH LOw HIGH LOw HIGH LOw HIGH LOw HIGH LOw HIGH LOw HIGH LOw HIGH
OFFICe BUILdInGS
Prestige, CBd
10TO25STOReyS(75-80%eFFICIenCy) 34 50 87 121 65 92 333 392 179 242 35 85 180 244 913 1,226
25TO40STOReyS(70-75%eFFICIenCy) 39 50 103 124 71 92 343 402 246 296 51 85 225 268 1,078 1,317
40TO55STOReyS(68-73%eFFICIenCy) 43 50 114 132 77 92 387 413 268 306 68 85 247 276 1,204 1,354
Investment, CBd
UPTO10STOReyS(81-85%eFFICIenCy) - - 71 88 12 83 261 329 135 166 12 30 131 185 622 881
10TO25STOReyS(76-81%eFFICIenCy) 16 40 71 99 55 87 281 339 158 177 23 42 135 180 739 964
25TO40STOReyS(71-76%eFFICIenCy) 16 40 81 111 65 87 291 339 189 232 18 47 159 204 819 1,060
Investment, other than CBd
1TO3STOReyS(81-85%eFFICIenCy) - 11 67 89 12 34 230 263 - 50 11 30 104 134 424 611
UPTO10STOReyS(82-86%eFFICIenCy) 11 16 77 89 55 78 240 299 102 155 11 30 116 180 612 847
10TO25STOReyS(77-82%eFFICIenCy) 16 45 82 98 65 78 271 331 158 200 18 35 136 190 746 977
HOTeLS
Multi-Storey
FIVeSTAR 33 55 209 263 65 93 366 407 168 234 34 69 204 265 1,079 1,386
FOURSTAR 27 50 199 255 65 93 293 385 168 202 34 59 170 244 956 1,288
THReeSTAR 16 34 176 223 11 73 281 344 134 159 24 30 171 211 813 1,074
CAR PARK
OPendeCkMUlTI-STORey - - 17 22 11 23 - 17 - 27 - 11 29 44 57 144
BASeMenT:CBd - - 22 39 59 75 49 65 34 49 11 18 45 55 220 301
BASeMenT:OTHeRTHAnCBd - - 17 33 11 59 38 59 23 33 - 18 45 55 134 257
UndeRCROFT:OTHeRTHAnCBd - - 17 23 6 7 - - - - - 6 18 23 41 59
IndUSTRIAL BUILdInGS
6.00m to underside of truss and 4,500 m2 Gross Floor Area with:
ZInCAlUMeMeTAlClAddInG - - 48 55 11 23 - 11 - - - 5 49 94 108 188
PReCASTCOnCReTeClAddInG - - 48 55 11 23 - 11 - - - 5 49 96 108 190
Attached Air Conditioned Offices
200M2 - - 67 88 11 29 230 300 - 169 18 47 126 169 452 802
400M2 - - 67 88 11 29 230 304 - 167 18 47 126 180 452 815

Rider Levett Bucknall | Riders Digest – Sydney 201636S
Sydney COnSTRUCTIOnBUILdInG SeRVICeS COSTS
VeRTICAL TRAnSPORTTransportServicesincludelifts,escalators,Travelators,dumbwaiters,etc.whereappropriate.
BUILdInG MAnAGeMenTBuildingManagementServicesincludeCommunications,SecurityandBuildingAutomationSystemswhereappropriate.
SPeCIAL eQUIPMenT
HydRAULICFIRe
PROTeCTIOnMeCHAnICAL
VeRTICAL TRAnSPORT
BUILdInG MAnAGeMenT
eLeCTRICAL TOTAL
COST RAnGe PeR GROSS FLOOR AReA
$/M2 $/M2 $/M2 $/M2 $/M2 $/M2 $/M2 $/M2
LOw HIGH LOw HIGH LOw HIGH LOw HIGH LOw HIGH LOw HIGH LOw HIGH LOw HIGH
AGed CARe
SInGleSTOReyFACIlITy - 11 144 222 11 55 93 211 - - 5 16 103 153 356 668
PRIVATe HOSPITALS
Low Rise Hospital
45-60M2GFA/Bed 22 45 155 199 34 72 417 485 45 78 30 41 217 292 920 1,212
55-80M2GFA/BedWITHMAjOROPeRATInGTHeATRe
39 135 175 201 49 88 577 800 66 92 79 90 250 361 1,235 1,767
CIneMAS
GROUPCOMPlex,2,000-4,000SeATS.(WARMSHell)
11 23 89 143 66 88 370 535 168 220 11 52 181 268 896 1,329
ReGIOnAL SHOPPInG CenTReS
dePARTMenTSTORe - 17 67 79 61 68 180 245 - - - 11 140 204 448 624
SUPeRMARkeT/VARIeTySTORe - - 70 79 49 66 173 255 - - - 11 158 216 450 627
dISCOUnTdePARTMenTSTORe - 17 54 72 43 71 151 194 - - 29 46 146 165 423 565
MAllS - 30 64 82 49 74 173 290 - - - 25 194 273 480 774
SPeCIAlITySHOPS - - 66 84 51 78 211 301 - - - 18 135 217 463 698
SMALL SHOPS And SHOwROOMS - - 54 77 11 28 151 281 - - - 11 96 112 312 509
ReSIdenTIAL
SInGleAnddOUBleSTOReydWellInGS.(CUSTOMBUIlT)
- 11 82 163 6 28 11 250 - - - 18 75 191 174 661
ReSIdenTIAL UnITS
WAlk-UP85TO120M2/UnIT - - 99 209 6 22 11 189 - - 5 23 75 178 196 621
TOWnHOUSeS90TO120M2/UnIT - - 77 209 6 28 11 173 - - 5 23 69 155 168 588
MULTI-STORey UnITS
Up to 10 storeys with lift
UnITS60-70M2 - 11 166 211 11 50 144 199 112 143 10 28 125 181 568 823
UnITS90-120M2 - 11 156 192 11 50 142 204 101 133 10 28 115 181 535 799
Over 10 and up to 20 storey
UnITS60-70M2 - 11 165 222 49 66 176 219 112 153 10 28 138 191 650 890
UnITS90-120M2 - 11 155 200 44 55 166 209 107 143 10 28 138 170 620 816
Over 20 and up to 40 storey
UnITS60-70M2 6 39 208 253 61 78 199 306 61 82 20 34 138 225 693 1,017
UnITS90-120M2 6 40 208 242 61 78 188 286 61 67 20 34 138 210 682 957
Over 40 and up to 80 storey
UnITS60-70M2 6 40 222 257 66 84 274 362 156 212 20 36 170 227 914 1,218
UnITS90-120M2 6 40 210 247 66 84 263 352 156 212 20 36 170 237 891 1,208

Rider Levett Bucknall | Riders Digest – Sydney 2016 37S
eLeCTRICALelectricalServicesincludetheprovisionoflightingandPowertooccupiedareaswhereappropriate.
SPeCIAL eQUIPMenT
HydRAULICFIRe
PROTeCTIOnMeCHAnICAL
VeRTICAL TRAnSPORT
BUILdInG MAnAGeMenT
eLeCTRICAL TOTAL
COST RAnGe PeR GROSS FLOOR AReA
$/M2 $/M2 $/M2 $/M2 $/M2 $/M2 $/M2 $/M2
LOw HIGH LOw HIGH LOw HIGH LOw HIGH LOw HIGH LOw HIGH LOw HIGH LOw HIGH
AGed CARe
SInGleSTOReyFACIlITy - 11 144 222 11 55 93 211 - - 5 16 103 153 356 668
PRIVATe HOSPITALS
Low Rise Hospital
45-60M2GFA/Bed 22 45 155 199 34 72 417 485 45 78 30 41 217 292 920 1,212
55-80M2GFA/BedWITHMAjOROPeRATInGTHeATRe
39 135 175 201 49 88 577 800 66 92 79 90 250 361 1,235 1,767
CIneMAS
GROUPCOMPlex,2,000-4,000SeATS.(WARMSHell)
11 23 89 143 66 88 370 535 168 220 11 52 181 268 896 1,329
ReGIOnAL SHOPPInG CenTReS
dePARTMenTSTORe - 17 67 79 61 68 180 245 - - - 11 140 204 448 624
SUPeRMARkeT/VARIeTySTORe - - 70 79 49 66 173 255 - - - 11 158 216 450 627
dISCOUnTdePARTMenTSTORe - 17 54 72 43 71 151 194 - - 29 46 146 165 423 565
MAllS - 30 64 82 49 74 173 290 - - - 25 194 273 480 774
SPeCIAlITySHOPS - - 66 84 51 78 211 301 - - - 18 135 217 463 698
SMALL SHOPS And SHOwROOMS - - 54 77 11 28 151 281 - - - 11 96 112 312 509
ReSIdenTIAL
SInGleAnddOUBleSTOReydWellInGS.(CUSTOMBUIlT)
- 11 82 163 6 28 11 250 - - - 18 75 191 174 661
ReSIdenTIAL UnITS
WAlk-UP85TO120M2/UnIT - - 99 209 6 22 11 189 - - 5 23 75 178 196 621
TOWnHOUSeS90TO120M2/UnIT - - 77 209 6 28 11 173 - - 5 23 69 155 168 588
MULTI-STORey UnITS
Up to 10 storeys with lift
UnITS60-70M2 - 11 166 211 11 50 144 199 112 143 10 28 125 181 568 823
UnITS90-120M2 - 11 156 192 11 50 142 204 101 133 10 28 115 181 535 799
Over 10 and up to 20 storey
UnITS60-70M2 - 11 165 222 49 66 176 219 112 153 10 28 138 191 650 890
UnITS90-120M2 - 11 155 200 44 55 166 209 107 143 10 28 138 170 620 816
Over 20 and up to 40 storey
UnITS60-70M2 6 39 208 253 61 78 199 306 61 82 20 34 138 225 693 1,017
UnITS90-120M2 6 40 208 242 61 78 188 286 61 67 20 34 138 210 682 957
Over 40 and up to 80 storey
UnITS60-70M2 6 40 222 257 66 84 274 362 156 212 20 36 170 227 914 1,218
UnITS90-120M2 6 40 210 247 66 84 263 352 156 212 20 36 170 237 891 1,208

Rider Levett Bucknall | Riders Digest – Sydney 201638S
Sydney COnSTRUCTIOnUnIT COSTS
ITeM
COnSTRUCTIOn RAnGe PeR
LOw HIGH
HOTeLS
Multi-Storey (excluding basements)
FIVeSTAR 450,700 537,400 BedROOM
FOURSTAR 340,600 470,700 BedROOM
THReeSTAR 213,900 271,600 BedROOM
CAR PARKS
Based on 30 m2 per car
OPendeCkMUlTI-STORey 23,400 37,300 CAR
BASeMenT-CBd 36,600 56,100 CAR
BASeMenT-OTHeRTHAnCBd 36,400 51,500 CAR
UndeRCROFT-OTHeRTHAnCBd 17,700 30,500 CAR
AGed CARe
FACIlITy 157,800 203,700 BedROOM
PRIVATe HOSPITALS
Low Rise Hospital
45-60M2GFA/Bed 156,000 198,000 Bed
55-80M2GFA/Bed 262,000 343,600 Bed
CIneMAS
GROUPCOMPlex,2,000-4,000SeATS(WARMSHell)
8,950 12,400 SeAT
HOUSInG
SInGleAnddOUBleSTOReydWellInGS.(CUSTOMBUIlT)-325M2 504,000 1,421,000 HOUSe
ReSIdenTIAL UnITS (exCL CARPARK/SITe wORKS)
TOWnHOUSeS(90-120M2) 173,600 432,500 UnIT
1TO3STOReyUnITS(85-120M2) 193,500 417,500 UnIT
MULTI STORey ReSIdenTIAL UnITS
Up to 10 storeys with lift
UnITS60-70M2 179,900 227,100 UnIT
UnITS90-120M2 212,200 362,300 UnIT
Over 10 and up to 20 storeys
UnITS60-70M2 193,400 250,400 UnIT
UnITS90-120M2 232,500 409,400 UnIT
Over 20 and up to 40 storeys
UnITS60-70M2 250,000 304,000 UnIT
UnITS90-120M2 293,000 450,000 UnIT
Over 40 and up to 80 storeys
UnITS60-70M2 287,000 344,000 UnIT
UnITS90-120M2 358,300 580,500 UnIT

Rider Levett Bucknall | Riders Digest – Sydney 2016 39S
Sydney COnSTRUCTIOnOFFICe FITOUT COSTS
Thefollowingcosts,whichincludeworkstations,areanindicationofthosecurrentlyachievableforgoodqualityofficeaccommodation,inclusiveofalllooseandfixedfurniture.
TyPe OF TenAnCyOPen
PLAnnedFULLy
PARTITIOnedPeR
LOw HIGH LOw HIGH
InSURAnCeOFFICeS,GOVeRnMenTdePARTMenT
830 1,230 1,100 1,550 M2
MAjORCOMPAnyHeAdQUARTeRS
1,100 1,600 1,150 2,000 M2
SOlICITORS,FInAnCIeRS 1,300 2,100 1,750 3,250 M2
exeCUTIVeAReASAndFROnTOFHOUSe
5,450 10,200 M2
COMPUTeRAReAS 2,400 3,100 M2
Computerareasincludeaccessflooringandadditionalservicescostsbutexcludecomputerequipment.
wORKSTATIOnS
Fullyself-containedworkstationmodulesize1,800x1,800mmincludingscreensgenerally1,220mmhigh(managerial1,620mmhigh),desks,storagecupboards,shelving.
TyPe OF wORKSTATIOn LOw HIGH PeR
CAllCenTRe 1,850 3,100 eACH
SeCReTARIAl 2,600 7,000 eACH
TeCHnICAlSTAFF 3,350 8,900 eACH
exeCUTIVe 8,550 30,850 eACH
ReFURBISHMenT
OfficeThefollowingrefurbishmentcostsincludefordemolitionandremovalofpartitionsandinternalfinishes,providenewfloor,ceilingandwallfinishes,butexcludingfittingoutandremovalofasbestosandupgradingofbuildingforGreenStarratings.Thelowerendoftherangeindicatesre-useandmodificationofexistingspecialistbuildingservices,whiletheupperendoftherangeindicatescompletereplacementofequipmentandaccessories.
LOw HIGH PeR
CBdOFFICeSTyPICAlFlOOR 900 2,400 M2
CBdOFFICeSCOReUPGRAde(exClUdInGlIFTSMOdeRnISATIOn)
650 1,600 M2

Rider Levett Bucknall | Riders Digest – Sydney 201640S
Thecostofhotelfurniture,fittingsandequipment(FF&e)varieswithinawiderangeandisdependentonthequalityofitemsprovided.Thefollowinggivestheexpectedcostrangesfordifferentratinghotels.Thesecostsincludefittingoutpublicareas.
LOw HIGH PeR
THReeSTARRATInG 24,000 44,000 BedROOM
FOURSTARRATInG 31,000 51,000 BedROOM
FIVeSTARRATInG 49,000 94,000 BedROOM
Sydney COnSTRUCTIOn HOTeL FURnITURe, FITTInGS & eQUIPMenT COSTS

Rider Levett Bucknall | Riders Digest – Sydney 2016 41S
BASKeTBALL CenTRe
LOw HIGH PeR
COnSISTInGOFBRICkWAllS,STeelPORTAlFRAMeAndPURlInSWITHMeTAlROOF,TIMBeRFlOORTOPlAyInGAReA,PUBlICSeATInG,PUBlICTOIleTSAndCHAnGeROOMS.
1,100 1,450 M2
SwIMMInG POOL CenTReS
LOw HIGH PeR
InClUdInGFOyeR,kIOSk,OFFICe,lOCkeRS,AdMInISTRATIOnOFFICeS,CHAnGeROOMS.
1,800 2,750 M2
SwIMMInG POOLS
Highqualityfullytiledincludingdrainageandfiltrationbutexcludingsurroundingpavingandenclosures.
LOw HIGH PeR
HAlFOlyMPIC(25.0x12.5M) 400,000 567,000 eACH
•exTRAFORHeATInG 21,000 39,000 eACH
• exTRAOVeRFIlTRATIOnAnddOSInGPlAnTFOROZOneBASeddOSInGSySTeM
142,000 234,000 eACH
• exTRAFORWeTdeCk 55,000 84,000 eACH
OlyMPIC(50.0x21.5M) 1,570,000 2,205,000 eACH
• exTRAFORHeATInG 41,000 70,000 eACH
• exTRAFORFIlTRATIOnAnddOSInGPlAnT
288,000 494,000 eACH
• exTRAOVeRFIlTRATIOnAnddOSInGPlAnTFOROZOneBASeddOSInGSySTeM
94,000 167,000 eACH
SMALL BOAT And yACHT MARInA BeRTHS
Floatingpontoonwalkwaysservicedwithpowerandwater.
LOw HIGH PeR
dOUBlelOAdedBeRTHS 23,000 33,000 BeRTH
SInGlelOAdedBeRTHS 29,000 37,000 BeRTH
SUPeRyACHTS 233,000 308,000 BeRTH
Sydney COnSTRUCTIOn ReCReATIOnAL FACILITIeS COSTS

Rider Levett Bucknall | Riders Digest – Sydney 201642S
TennIS COURTS
Sixcourtswithminimalsiteformationandincludingsubbaseplayingsurface,chainwirefence3.60mhighandspoondrains.
LOw HIGH PeR
SynTHeTICGRASS 60,300 74,200 COURT
RedPOROUS(en-TOUT-CAS) 25,000 33,500 COURT
SynTHeTICACRylIC(FlexIPAVe) 42,700 49,700 COURT
ASPHAlT(5MM) 34,300 95,100 COURT
ReBOUndACe 98,800 109,700 COURT
COnCReTe 40,550 47,100 COURT
FlOOdlIGHTInG - - COURT
GOLF COURSeS
18holechampionshipcourseincludingsiteworks,finishingworks,irrigation,grassing,landscaping,greenkeeping,plant&equipment,coursefurnitureandgroundstafftopracticalcompletionbutexcludingmainswatersupplytocourse,roads,carparksandclubhouse.Thefollowingareindicativecostsonly.
LOw HIGH PeR
SAnd/SOIlSITe,ReQUIRInGMInIMAlexCAVATIOnAndSITePRePARATIOn
7,906,000 14,218,000 COURSe
SITeReQUIRInGROCkexCAVATIOn
13,585,000 17,847,000 COURSe
SWAMPySITeReQUIRInGdRedGInGFORlAkeS,eTC.AndexTenSIVeFIll
15,960,000 36,550,000 COURSe
PLAyInG FIeLdS
Soccer,Rugby,AustralianRules,Hockeyorsimilarturfedareaswithminimalsiteformationandincludingsubbase,drainageandturfing.
LOw HIGH PeR
exClUdeSSPRInkleRS 40 50 M2
GRAndSTAndS
Prestigemetropolitangrandstandwithahighstandardoffinishesandfacilitiesincludingbars,stores,meeting/changerooms,diningandkitchenarea.
LOw HIGH PeR
GRAndSTAnd 6,000 12,650 SeAT
Sydney COnSTRUCTIOn ReCReATIOnAL FACILITIeS COSTS

Rider Levett Bucknall | Riders Digest – Sydney 2016 43S
demolitioncostsincludegrubbingupfootings,sealingservices,temporaryshoring,supportsetc.removalofdemolishedmaterials,rubbishandsitedebris.
exclusions:workcarriedoutoutsidenormalworkinghours,creditvalueofdemolishedmaterialsandrestrictedsiteconditions.
BUILdInG TyPe LOw HIGH PeR
SInGleSTOReyTIMBeRFRAMedHOUSeWITHTIMBeRClAddInGAndTIledROOF
95 140 M2
SInGle/dOUBleSTOReyBRICkHOUSeWITHTIledROOF
105 160 M2
SInGleSTOReyFACTORy/WAReHOUSeWITHReInFORCedCOnCReTeGROUndSlAB,TIMBeRORSTeelFRAMedWAllS
•MeTAlClAd 105 120 M2
•BRICkClAd 120 130 M2
TWOSTOReyOFFICeBUIldInGWITHReInFORCedCOnCReTeFRAMeMASOnRyClAddInGAndMeTAlROOF
130 165 M2
MUlTISTOReyOFFICeBUIldInGUPTO15FlOORSWITHMASOnRyClAddInG
•ReInFORCedCOnCReTe 195 265 M2
•STRUCTURAlSTeel 230 300 M2
MUlTI-STOReyOFFICeBUIldInGUPTO25STOReyS,COnSTRUCTedOFSTeelFRAMeWITHMASOnRyClAddInG
230 330 M2
Sydney COnSTRUCTIOn deMOLITIOn COSTS

Rider Levett Bucknall | Riders Digest – Sydney 201644S
LAndSCAPInG
LOw HIGH PeR
lIGHTlAndSCAPInGTOlARGeAReASWITHMInIMAlPlAnTInGAndSITeFORMATIOnBUTexClUdInGTOPSOIlAndGRASSInG.
55,100 75,800 HeCTARe
denSelAndSCAPInGAROUndBUIldInGSInClUdInGSHRUBS,PlAnTS,TOPSOIlAndGRASSInG.
120 160 M2
GRASSInGOnlyTOlARGeAReASInClUdInGTOPSOIl,SOWInGAndTReATInG.
26 35 M2
CAR PARKS – On GROUnd
Basedon30m2overallareapercarwithasphaltpavingincludingsub-baseandsealing.
LOw HIGH PeR
lIGHTdUTyPAVInG. 1,600 3,600 CARSPACe
HeAVydUTyPAVInGTOFACTORyTyPeCOMPlex,lARGeAReAWITHMInIMAlSITeFORMATIOn,dRAInAGeAndkeRBTReATMenT.
3,700 4,400 CARSPACe
lIGHTdUTyPAVInGTOSHOPPInGCenTReCOMPlex,lARGeAReAWITHMInIMAlSITeFORMATIOn,AndInClUdInGdRAInAGeAndkeRBTReATMenT.
4,200 5,700 CARSPACe
ROAdS
Asphaltfinishincludingkerb,channelanddrainage.
LOw HIGH PeR
ReSIdenTIAleSTATe6.80MeTReSWIdeInClUdInGFOOT-PATHAndnATUReSTRIP.
1,150 1,800 M
IndUSTRIAleSTATe10.4MeTReSWIdeInClUdInGMInIMAlTOexTenSIVeFORMATIOn
1,750 2,700 M
Sydney COnSTRUCTIOnSITewORKS COSTS
SydneydeVelOPMenT
46 landValues
47 Rents&yields
48 RentalRates
49 Stampduties
50 landTax
51 Planning-CarParking
52 VerticalTransportation
55 ConstructionWorkdone
59 OfficeSectordata
62 RetailSectordata
64 IndustrialSectordata

Rider Levett Bucknall | Riders Digest – Sydney 201646S
ThevaluesshownareindicativeofcurrentlandvaluesinnewSouthWalesandmayvaryaccordingtoposition,planningrequirementsetc.
LOCATIOn (COSTS PeR M2) $/M2
LOw HIGH
OFFICeS
CBdHIGHRISePReMIUM 20,000 40,000
nORTHSydneyMIdRISeAGRAde 10,000 20,000
PARAMMATTAMIdRISeAGRAde 8,000 12,000
ReTAIL (eG 120 M2)
PITTSTReeTMAll 10,000 30,000
SeCOndARyCBd 5,000 20,000
neIGHBOURHOOdSHOPPInGCenTRe 300 400
SUBURBAnSTRIPSHOPPInG 500 5,000
IndUSTRIAL
WeST(3,000-5,000M2) 275 350
nORTHSHORe(3,000-5,000M2) 600 700
SOUTHeRn(5,000-10,000M2) 500 700
PreparedinassociationwithSavills
Sydney deVeLOPMenTLAnd VALUeS

Rider Levett Bucknall | Riders Digest – Sydney 2016 47S
Therentsandyieldsareindicativeofmodernaveragequalityexistingaccommodationineachlocation.Factorscausingvariationstotheseratesandyieldsare:location–age–quality–sizeofbuilding.Unlessotherwisestated,netrentalsaregivenbelow,ie.thetenantpaysalloutgoings.Allowancehasbeenmadefortheeffectsofrentalincentives,rentfreeperiods,etc.ie.theratesareneteffectiverents.
RenT $/M2 % yIeLd
LOw HIGH LOw HIGH
OFFICeS
CdB-HIGHRISePReMIUM 513 802 5.00 5.50
CBd-HIGHRISeGRAdeA 393 493 5.50 6.75
CBd-MedIUMRISe 313 366 6.50 8.00
nORTHSydney-HIGHRISe 379 527 6.25 7.00
nORTHSydney-MedIUMRISe 300 335 7.50 8.50
PARAMMATTA-MedIUMRISe 322 367 6.25 7.25
ReTAIL
PITTSTReeTMAll 5,000 10,000 5.00 6.50
MAjORReGIOnAlSHOPPInGCenTRe
1,000 2,600 5.25 7.00
OTHeRCBd 1,000 4,500 5.50 8.00
IndUSTRIAL
WeST 100 120 6.50 7.25
nORTHWeST 135 190 7.75 9.00
SOUTHeRn 130 190 6.50 7.00
PreparedinassociationwithSavills
Sydney deVeLOPMenT RenTS & yIeLdS

Rider Levett Bucknall | Riders Digest – Sydney 201648S
Thenetrentsindicatedbelowshowthechangeinlevelssince1988.Allowancehasbeenmadefortheeffectsofrentalincentives,rentfreeperiodsetc.
Sydney deVeLOPMenT RenTAL RATeS
OFFICeS IndUSTRIAL
CBdnORTH Sydney
SUBURBAn OFFICeS
weST PRIMe
1988 366 280 185 100
1989 394 300 230 103
1990 353 300 252 110
1991 282 290 261 105
1992 214 260 270 98
1993 175 220 263 98
1994 182 210 252 100
1995 235 220 247 105
1996 293 225 242 110
1997 326 240 243 120
1998 355 275 247 120
1999 366 300 252 118
2000 428 350 254 113
2001 439 390 260 112
2002 440 193 212 117
2003 428 195 174 113
2004 418 186 174 113
2005 366 164 202 115
2006 383 194 194 118
2007 399 257 192 118
2008 578 338 233 115
2009 457 321 219 105
2010 449 296 221 105
2011 468 372 221 108
2012 474 406 235 110
2013 462 419 289 110
2014 466 424 293 110
2015 462 428 295 110

Rider Levett Bucknall | Riders Digest – Sydney 2016 49S
StampdutyinnSWisliableforasaleortransferofland(includingimprovements)orabusiness.
Itisimmaterialwhetherornotthetransactioniseffectedbyawritteninstrumentorbyothermeans,includingelectronicmeans.Aliabilityfordutyariseswhenthesaleortransferoccurs.However,ifthesaleortransferiseffectedbyawrittenInstrument,liabilityfordutyariseswhentheinstrumentisfirstexecuted.
dutyispayablewithin3monthsofthedateliabilityarises.Thepurchaserortransfereeisliabletopaytheduty.
VALUe OF TRAnSACTIOn RATe OF dUTy
$0-$14,000$1.25FOReVeRy$100ORPARTOFTHeVAlUe
$14,001-$30,000$175PlUS$1.50FOReVeRy$100,THATTHeVAlUe>$14,000
$30,001-$80,000$415PlUS$1.75FOReVeRy$100,THATTHeVAlUe>$30,000
$80,001-$300,000$1,290PlUS$3.50FOReVeRy$100,THATTHeVAlUe>$80,000
$300,001-$1M$8,990PlUS$4.50FOReVeRy$100,THATTHeVAlUe>$300,000
OVeR$1M$40,490PlUS$5.50FOReVeRy$100,THATTHeVAlUe>$1M
PReMIUM PROPeRTy dUTy OVeR$3M
$150,490PlUS$7.00FOReVeRy$100,THATTHeVAlUe>$3M
Forfurtherdetailsrefertowww.osr.nsw.gov.au
Premium Property dutyisonlypayableonresidentialland(includingimprovements)fortransactionsover$3m.
Sydney deVeLOPMenTSTAMP dUTIeS

Rider Levett Bucknall | Riders Digest – Sydney 201650S
landtaxisappliedtothevalueofanypropertyyouownorjointlyownthatisabovethelandtaxthresholdasatmidnighton31decemberthepreviousyear.
Forlandtax,anownerisdefinedasanyofthefollowing:
• soleowner
• jointowners
• acompany
• ownersofcompanytitleunits
• trusteeofanytrust
• beneficiaryofatrustwhichisnotaspecialtrust
• societyororganisationwhoselandisnotexempt
• unitholderswithinterestinaunittrustwhichisentitledtothelandtaxthreshold
• trusteesofsuperannuationfunds
• certainlesseesofcrownorlocalcouncilland.
TOTAL UnIMPROVed VALUe OF LAnd
2016 TAx RATeS(LAnd Owned @ 31/12/15)
BelOW$432,000 nIl
$432,000-$2,640,999$100PlUS1.6%OFlAndVAlUeBeTWeen$432,000And$2,640,999
ABOVe$2,641,000$35,444PlUS2%OnVAlUeInexCeSSOF$2,641,000
TOTAL UnIMPROVed VALUe OF LAnd
2015 TAx RATeS(LAnd Owned @ 31/12/14)
BelOW$412,000 nIl
BeTWeen$412,001-$2,518,999
$100PlUS1.6%OFlAndVAlUeBeTWeen$412,000And$2,518,999
ABOVe$2,519,00033,812PlUS2%OnVAlUeInexCeSSOF$2,519,000
Forfurtherdetailsrefertowww.osr.nsw.gov.au
Sydney deVeLOPMenT LAnd TAx

Rider Levett Bucknall | Riders Digest – Sydney 2016 51S
ThefollowingcarparkinginformationisderivedfromtheSydneylocalenvironmentPlan2012,Part7-localprovisions–general,division1,whichdetailsthemaximumcarparkingspacestobeprovidedtoserviceparticularusesofland.landcategoriesA,B&CareidentifiedinthelandUseandTransportIntegrationmapandlandCategoriesd,e&FareidentifiedinthePublicTransportAccessibilitylevelmap,bothformingpartofthePlan.
TyPe OF PROPOSed USe MAxIMUM PARKInG SPACeS PeRMITTed
dWellInG-HOUSeS
lAndCATeGORyA-1SPACeFOReACHdWellInGlAndCATeGORyB-2SPACeSFOReACHdWellInGHAVInGMOReTHAn2BedROOMSAnd1SPACeFOReACHOTHeRdWellInGlAndCATeGORyC-2SPACeSFOReACHdWellInG
ReSIdenTIAlBUIldInGS(InClUdInGHOUSInGFORAGedPeRSOnS):
LAnd CATeGORynO. OF CAR SPACeS (CUMULATIVe) A B C
dweLLInGS
STUdIO 0.1 0.2 0.4
1BedROOM 0.3 0.4 0.5
2BedROOMS 0.7 0.8 1.0
3+BedROOMS 1.0 1.1 1.2
VISITORS
FIRST30dWellInGS n/A 0.167 0.2
FROM30–70dWellInGS n/A 0.1 0.125
FROM+70dWellInGS n/A 0.05 0.067
OFFICeAndBUSIneSSPReMISeS
LAnd CATeGORy
nO. OF CAR SPACeS d e F
MAx.FlOORSPACeRATIO 3.5:1 2.5:1 1.5:1
GFAPeRCARSPACe 175 125 75
IFTHeBUIldInGISOnlAndInCATeGORyd,eORFAndHASAFlOORRATIOGReATeRTHAnTHATSPeCIFIedABOVe,THeFOllOWInGFORMUlAISTOBeUSed
M= (G x A) ÷ (50 x T)WHeRe:MISTHeMAxIMUMnOOFPARkInGSPACeSG ISTHeG.F.AOFAllOFFICePReMISeSAnd
BUSIneSSPReMISeSInTHeBUIldInGInM2
A ISTHeSITeAReAInM2
T ISTHeTOTAlG.F.AOFAllBUIldInGSOnTHeSITeInM2
ReTAIlPReMISeS(dOeSnOTAPPlyTOBUIldInGSWITH>2,000M2
ReTAIlGFA)
LAnd CATeGORy
nO. OF CAR SPACeS d e F
MAx.FlOORSPACeRATIO 3.5:1
GFAPeRCARSPACe 90 60 50
IFTHeBUIldInGISOnlAndInCATeGORydHASAFlOORRATIOGReATeR3.5:1THeFOllOWInGFORMUlAISTOBeUSed
M= (G x A) ÷ (50 x T)WHeRe:MISTHeMAxIMUMnOOFPARkInGSPACeSG ISTHeG.F.AOFAllReTAIlPReMISeSInTHe
BUIldInGInM2
A ISTHeSITeAReAInM2
T ISTHeTOTAlG.F.AOFAllBUIldInGSOnTHeSITeInM2
PlACeSOFPUBlICWORSHIPAndenTeRTAInMenTFACIlITIeS
(A) 1SPACeFOReVeRy10SeATS,OR(B) 1SPACeFOReVeRy30M2OFTHeGROSS
FlOORAReAOFTHeBUIldInGUSedFORTHOSePURPOSeS
SeRVICedAPARTMenTS,HOTelORMOTel
1SPACeFOReVeRy4BedROOMSUPTO100BedROOMS,And1SPACeFOReVeRy5BedROOMSMOReTHAn100BedROOMS
OTHeRUSeS ReFeRTOSPeCIFICPROVISIOnSWITHInenVIROnMenTAlPlAn
Sydney deVeLOPMenT PLAnnInG – CAR PARKInG

Rider Levett Bucknall | Riders Digest – Sydney 201652S
LIFT SeLeCTIOn CHART
Tocalculatethenumberandtypeoflifts–
• locateapointonthegraphbyusingtheGFAinm2shownonthebottomaxisandnumberoflevelsontheleftaxis.
• Thecolourattheintersectionpointindicatestheliftcapacity,thehorizontallinestheliftspeedandtheangledlinesthenumberofliftsandthenumberofbanks.
• Byextendingthehorizontallinetothefarrighthandside,thetypeofliftrequiredcanbeobtained.
destinationcontrolisanoptionalliftcontrolsysteminwhichpassengerskey-inthenumberoftheirdestinationflooratabuttonpanellocatedintheircurrentliftlobbyarea.eachfloorlobbyhasabuttonpanel.Theliftscarsthemselvesdonothavedestinationbuttonsandaredesignatedtoservethefloorsasrequired.destinationcontrolwillgenerallyboostthe“Uppeak”ormorningperformanceoftheliftsystemandwillprovideadditionalsecurityprovisions.Theperformanceoftheliftsystemduringlunchtimesandattheendofthedayisgenerallynotimprovedwiththiscontrolsystem.lobbyareamayneedtobeincreased.
Sydney deVeLOPMenT VeRTICAL TRAnSPORTATIOn

Rider Levett Bucknall | Riders Digest – Sydney 2016 53S
70
,00
06
0,0
00
50
,00
04
0,0
00
30
,00
020
,00
010
,00
0
50
45
40
35
30
25
20
15 10
5 0
GF
A
LEVELS
GEARLESS
GEARLESS MACHINEROOMLESS (MRL)
24
20
18
14
12
8
65
4
3
3.5
m/s
5.0
m/s
3.0
m/s
2.5
m/s
160
0kg
. 23
pers
on
135
0kg
. 20
pers
on
113
0kg
. 16
pers
on
90
0kg
. 13
pers
on
1.6
m/s
2.5
m/s
7.0
m/s
SIN
GL
EB
AN
K
DO
UB
LE
BA
NK

Rider Levett Bucknall | Riders Digest – Sydney 201654S
Sydney deVeLOPMenT VeRTICAL TRAnSPORTATIOn
APPLICATIOn LIFT TyPeSPeed
M/S
nO. OF FLOORS SeRVed
BASe COST$
AddITIOnAL FLOOR
exPReSS FLOOR
LOw HIGH RATe RATe
OFFICe & ReSIdenTIAL
eleCTRO-HydRAUlICPASSenGeR
0.5 2 97,000 115,000 12,100 7,600
GeARleSSTO17PASSenGeR
1 5 124,000 143,000 10,400 6,600
GeARleSSUPTO17PASSenGeR
1.6 8 159,000 184,000 10,400 6,600
GeARleSS 2.5 10 425,000 485,000 13,000 8,200
GeARleSS 3.5 10 470,000 505,000 13,000 8,200
GeARleSS 4 10 505,000 530,000 13,000 8,200
GeARleSS 5 10 520,000 560,000 13,000 8,200
GeARleSS 6 10 560,000 580,000 13,000 8,200
GeARleSS 7 10 605,000 643,000 13,000 8,200
GeARleSS 8 10 675,000 730,000 13,500 8,700
HOSPITAL GeARedUPTO40PASSenGeR
2 5 395,000 470,000 15,000 9,700
GeARleSS 2.5 10 493,000 525,000 14,000 9,700
LARGe GOOdS
GeARleSSMRlTO2,000kG
1.6 10 335,000 367,000 14,000 9,700
eleCTRO-HydRAUlICTO5,000kG
0.5 2 273,000 321,000 14,500 9,700
GeARleSS2,500kG 2.5 10 525,000 565,000 13,900 8,100
eSCALATORSRISe2,600TO5,000MM
0.5 - 170,000 255,000 - -
MOVInG wALKS
2,500TO5,000MM 0.5 - 325,000 398,000 - -
SeRVICe LIFT BenCHHeIGHTUnIT 0.2 3 30,000 35,000 4,500 1,300
lARGeRUnIT 0.2 3 46,000 53,000 5,000 1,500
dISABLed PLATFORM LIFT
TO1,000MM 0.1 2 31,000 36,000 - -
1,000TO4,000MM 0.1 2 36,000 49,000 - -
note:destinationControlliftSystemoptioncostsarenotincludedintheaboverates.
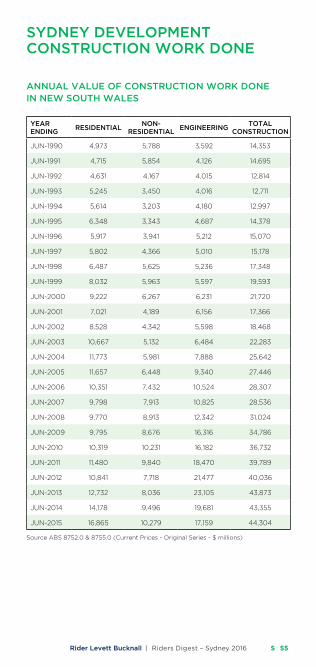
Rider Levett Bucknall | Riders Digest – Sydney 2016 55S
Sydney deVeLOPMenT COnSTRUCTIOn wORK dOne
AnnUAL VALUe OF COnSTRUCTIOn wORK dOne In new SOUTH wALeS
yeAR endInG
ReSIdenTIALnOn-
ReSIdenTIALenGIneeRInG
TOTAL COnSTRUCTIOn
jUn-1990 4,973 5,788 3,592 14,353
jUn-1991 4,715 5,854 4,126 14,695
jUn-1992 4,631 4,167 4,015 12,814
jUn-1993 5,245 3,450 4,016 12,711
jUn-1994 5,614 3,203 4,180 12,997
jUn-1995 6,348 3,343 4,687 14,378
jUn-1996 5,917 3,941 5,212 15,070
jUn-1997 5,802 4,366 5,010 15,178
jUn-1998 6,487 5,625 5,236 17,348
jUn-1999 8,032 5,963 5,597 19,593
jUn-2000 9,222 6,267 6,231 21,720
jUn-2001 7,021 4,189 6,156 17,366
jUn-2002 8,528 4,342 5,598 18,468
jUn-2003 10,667 5,132 6,484 22,283
jUn-2004 11,773 5,981 7,888 25,642
jUn-2005 11,657 6,448 9,340 27,446
jUn-2006 10,351 7,432 10,524 28,307
jUn-2007 9,798 7,913 10,825 28,536
jUn-2008 9,770 8,913 12,342 31,024
jUn-2009 9,795 8,676 16,316 34,786
jUn-2010 10,319 10,231 16,182 36,732
jUn-2011 11,480 9,840 18,470 39,789
jUn-2012 10,841 7,718 21,477 40,036
jUn-2013 12,732 8,036 23,105 43,873
jUn-2014 14,178 9,496 19,681 43,355
jUn-2015 16,865 10,279 17,159 44,304
SourceABS8752.0&8755.0(CurrentPrices-OriginalSeries-$millions)

Rider Levett Bucknall | Riders Digest – Sydney 201656S
12 MOnTHS endInG
COMMeRCIAL IndUSTRIAL edUCATIOnAGed CARe
HeALTH HOTeLS OTHeRTOTAL
nOn-ReSIdenTIAL
jUn-2002 1,916 674 550 149 380 134 539 4,342
jUn-2003 2,282 761 626 151 376 263 674 5,132
jUn-2004 2,738 981 576 324 273 411 679 5,981
jUn-2005 2,914 1,126 637 343 255 472 702 6,448
jUn-2006 3,497 1,287 811 318 231 547 741 7,432
jUn-2007 3,588 1,245 794 374 525 369 1,018 7,913
jUn-2008 4,093 1,316 805 500 505 310 1,384 8,913
jUn-2009 4,179 1,331 868 429 624 272 973 8,676
jUn-2010 3,549 761 3,547 383 787 210 994 10,231
jUn-2011 3,677 912 2,843 286 717 245 1,159 9,840
jUn-2012 3,156 1,171 1,203 247 538 364 1,038 7,718
jUn-2013 3,194 1,131 1,221 301 728 276 1,184 8,036
jUn-2014 3,948 1,143 1,445 342 1,037 368 1,213 9,496
jUn-2015 4,389 1,121 1,199 520 1,068 758 1,226 10,279
SourceABS8752.0(OriginalCost-$millions)
AnnUAL VALUe OF nOn- ReSIdenTIAL BUILdInG wORK dOne In new SOUTH wALeS
Sydney deVeLOPMenT COnSTRUCTIOn wORK dOne

Rider Levett Bucknall | Riders Digest – Sydney 2016 57S
12 MOnTHS endInG
COMMeRCIAL IndUSTRIAL edUCATIOnAGed CARe
HeALTH HOTeLS OTHeRTOTAL
nOn-ReSIdenTIAL
jUn-2002 1,916 674 550 149 380 134 539 4,342
jUn-2003 2,282 761 626 151 376 263 674 5,132
jUn-2004 2,738 981 576 324 273 411 679 5,981
jUn-2005 2,914 1,126 637 343 255 472 702 6,448
jUn-2006 3,497 1,287 811 318 231 547 741 7,432
jUn-2007 3,588 1,245 794 374 525 369 1,018 7,913
jUn-2008 4,093 1,316 805 500 505 310 1,384 8,913
jUn-2009 4,179 1,331 868 429 624 272 973 8,676
jUn-2010 3,549 761 3,547 383 787 210 994 10,231
jUn-2011 3,677 912 2,843 286 717 245 1,159 9,840
jUn-2012 3,156 1,171 1,203 247 538 364 1,038 7,718
jUn-2013 3,194 1,131 1,221 301 728 276 1,184 8,036
jUn-2014 3,948 1,143 1,445 342 1,037 368 1,213 9,496
jUn-2015 4,389 1,121 1,199 520 1,068 758 1,226 10,279
SourceABS8752.0(OriginalCost-$millions)
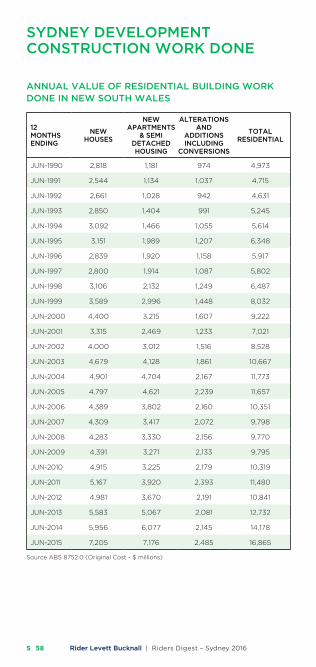
Rider Levett Bucknall | Riders Digest – Sydney 201658S
12 MOnTHS endInG
new HOUSeS
new APARTMenTS
& SeMI deTACHed HOUSInG
ALTeRATIOnS And
AddITIOnS InCLUdInG
COnVeRSIOnS
TOTAL ReSIdenTIAL
jUn-1990 2,818 1,181 974 4,973
jUn-1991 2,544 1,134 1,037 4,715
jUn-1992 2,661 1,028 942 4,631
jUn-1993 2,850 1,404 991 5,245
jUn-1994 3,092 1,466 1,055 5,614
jUn-1995 3,151 1,989 1,207 6,348
jUn-1996 2,839 1,920 1,158 5,917
jUn-1997 2,800 1,914 1,087 5,802
jUn-1998 3,106 2,132 1,249 6,487
jUn-1999 3,589 2,996 1,448 8,032
jUn-2000 4,400 3,215 1,607 9,222
jUn-2001 3,315 2,469 1,233 7,021
jUn-2002 4,000 3,012 1,516 8,528
jUn-2003 4,679 4,128 1,861 10,667
jUn-2004 4,901 4,704 2,167 11,773
jUn-2005 4,797 4,621 2,239 11,657
jUn-2006 4,389 3,802 2,160 10,351
jUn-2007 4,309 3,417 2,072 9,798
jUn-2008 4,283 3,330 2,156 9,770
jUn-2009 4,391 3,271 2,133 9,795
jUn-2010 4,915 3,225 2,179 10,319
jUn-2011 5,167 3,920 2,393 11,480
jUn-2012 4,981 3,670 2,191 10,841
jUn-2013 5,583 5,067 2,081 12,732
jUn-2014 5,956 6,077 2,145 14,178
jUn-2015 7,205 7,176 2,485 16,865
SourceABS8752.0(OriginalCost-$millions)
Sydney deVeLOPMenT COnSTRUCTIOn wORK dOne
AnnUAL VALUe OF ReSIdenTIAL BUILdInG wORK dOne In new SOUTH wALeS

Rider Levett Bucknall | Riders Digest – Sydney 2016 59S
Sydney deVeLOPMenTOFFICe SeCTOR dATA
Sydney CBd VACAnCy RATeS
PCA GRAde STOCK M2
VACAnCy M2
VAC % JUn-15
VAC % JUn-14
PReMIUM 796,626 41,547 5.2 8.2
GRAdeA 1,843,427 123,737 6.7 9.5
GRAdeB 1,576,404 97,536 6.2 7.6
GRAdeC 559,066 39,394 6.9 7.0
GRAded 188,668 10,464 5.5 7.9
TOTAL 4,964,191 311,678 6.3 8.4
PCA GRAde STOCK M2
VACAnCy M2
VAC % JUn-15
VAC % JUn-14
PReMIUM 36,500 488 1.3 0
GRAdeA 186,296 6,803 3.7 4.7
GRAdeB 430,666 43,080 10.0 11.6
GRAdeC 156,957 14,504 9.2 14.3
GRAded 12,932 748 5.8 5.8
TOTAL 823,351 65,623 8.0 10.0
PCA GRAde STOCK M2
VACAnCy M2
VAC % JUn-15
VAC % JUn-14
GRAdeA 273,617 6,573 2.4 0.2
GRAdeB 219,975 24,272 11.0 9.5
GRAdeC 104,972 17,902 17.1 18.3
GRAded 91,509 2,652 2.9 6.3
TOTAL 690,073 51,399 7.4 6.7
Source:PCA/SavillsResearchQ32015
nORTH Sydney VACAnCy RATeS
PARRAMATTA VACAnCy RATeS

Rider Levett Bucknall | Riders Digest – Sydney 201660S
Key MARKeT IndICATORS
Sydney CBd PCA PReMIUM PCA GRAde A PCA GRAde B
LOw HIGH LOw HIGH LOw HIGH
RenTAl–GROSSFACe($/M2) 970 1,510 740 1,020 550 750
RenTAl–neTFACe($/M2) 785 1,300 600 850 450 605
RenTAl–neTeFFeCTIVe($/M2) 513 802 393 493 313 366
OUTGOInGS–OPeRATInG($/M2) 130 145 85 105 70 85
OUTGOInGS–STATUTORy($/M2) 55 65 55 65 30 60
OUTGOInGS–TOTAl($/M2) 185 210 140 170 100 145
TyPICAlleASeTeRM(yeARS) 8 10 7 10 4 7
yIeld–MARkeT(%neTFACeRenTAl) 5.00 5.50 5.50 6.75 6.50 8.00
IRR(%) 7.00 7.50 7.25 7.75 7.75 8.50
CARSPeRMAnenTReSeRVed($/P.C.M) 800 1,000 650 850 550 650
CARSPeRMAnenT($/P.C.M) 750 800 600 700 500 600
OFFICeCOMPOnenTCAPITAlVAlUeS($/M2)
14,273 26,000 8,889 15,455 5,625 9,000
nORTH SHORenORTH Sydney
GRAde A nORTH Sydney
GRAde BnORTH Ryde
GRAde A
LOw HIGH LOw HIGH LOw HIGH
RenTAl–GROSSFACe($/M2) 645 880 535 645 405 455
RenTAl–neTFACe($/M2) 525 750 425 525 315 350
RenTAl–neTeFFeCTIVe($/M2) 379 527 300 335 227 227
OUTGOInGS–OPeRATInG($/M2) 90 95 80 85 65 80
OUTGOInGS–STATUTORy($/M2) 30 35 30 35 25 25
OUTGOInGS–TOTAl($/M2) 120 130 110 120 90 105
TyPICAlleASeTeRM(yeARS) 7 10 3 7 5 8
yIeld–MARkeT(%neTFACeRenTAl) 6.25 7.00 7.50 8.50 7.00 7.50
IRR(%) 8.00 8.50 8.50 9.00 8.25 8.75
CARSPeRMAnenTReSeRVed($/P.C.M) 550 625 475 550 200 250
CARSPeRMAnenT($/P.C.M) 500 550 400 500 nA nA
OFFICeCOMPOnenTCAPITAlVAlUeS($/M2)
7,500 12,000 5,000 7,000 4,200 5,000
Source:SavillsResearchQ32015
Sydney deVeLOPMenTOFFICe SeCTOR dATA

Rider Levett Bucknall | Riders Digest – Sydney 2016 61S
Sydney CBd PCA PReMIUM PCA GRAde A PCA GRAde B
LOw HIGH LOw HIGH LOw HIGH
RenTAl–GROSSFACe($/M2) 970 1,510 740 1,020 550 750
RenTAl–neTFACe($/M2) 785 1,300 600 850 450 605
RenTAl–neTeFFeCTIVe($/M2) 513 802 393 493 313 366
OUTGOInGS–OPeRATInG($/M2) 130 145 85 105 70 85
OUTGOInGS–STATUTORy($/M2) 55 65 55 65 30 60
OUTGOInGS–TOTAl($/M2) 185 210 140 170 100 145
TyPICAlleASeTeRM(yeARS) 8 10 7 10 4 7
yIeld–MARkeT(%neTFACeRenTAl) 5.00 5.50 5.50 6.75 6.50 8.00
IRR(%) 7.00 7.50 7.25 7.75 7.75 8.50
CARSPeRMAnenTReSeRVed($/P.C.M) 800 1,000 650 850 550 650
CARSPeRMAnenT($/P.C.M) 750 800 600 700 500 600
OFFICeCOMPOnenTCAPITAlVAlUeS($/M2)
14,273 26,000 8,889 15,455 5,625 9,000
nORTH SHORenORTH Sydney
GRAde A nORTH Sydney
GRAde BnORTH Ryde
GRAde A
LOw HIGH LOw HIGH LOw HIGH
RenTAl–GROSSFACe($/M2) 645 880 535 645 405 455
RenTAl–neTFACe($/M2) 525 750 425 525 315 350
RenTAl–neTeFFeCTIVe($/M2) 379 527 300 335 227 227
OUTGOInGS–OPeRATInG($/M2) 90 95 80 85 65 80
OUTGOInGS–STATUTORy($/M2) 30 35 30 35 25 25
OUTGOInGS–TOTAl($/M2) 120 130 110 120 90 105
TyPICAlleASeTeRM(yeARS) 7 10 3 7 5 8
yIeld–MARkeT(%neTFACeRenTAl) 6.25 7.00 7.50 8.50 7.00 7.50
IRR(%) 8.00 8.50 8.50 9.00 8.25 8.75
CARSPeRMAnenTReSeRVed($/P.C.M) 550 625 475 550 200 250
CARSPeRMAnenT($/P.C.M) 500 550 400 500 nA nA
OFFICeCOMPOnenTCAPITAlVAlUeS($/M2)
7,500 12,000 5,000 7,000 4,200 5,000
Source:SavillsResearchQ32015

Rider Levett Bucknall | Riders Digest – Sydney 201662S
Sydney deVeLOPMenTReTAIL SeCTOR dATA
Sydney enCLOSed CenTReS ReGIOnAL SUB ReGIOnAL neIGHBOURHOOd
LOw HIGH LOw HIGH LOw HIGH
MAjORTenAnTneTRenTAl($/M2) 310 660 235 405 225 390
ddSTenAnTneTRenTAl($/M2) 200 450 110 230 nA nA
SPeCIAlTyTenAnTneTRenTAl($/M2)
1,000 2,600 600 1,200 360 900
yIeld-MARkeT(%) 5.25 7.00 6.25 7.50 6.25 9.00
IRR(%) 8.00 9.00 8.50 9.50 8.50 9.50
OUTGOInGS-OPeRATInG($/M2) 135 179 117 151 97 148
OUTGOInGS-STATUTORy($/M2) 24 34 24 37 27 52
OUTGOInGS-TOTAl($/M2) 159 213 141 188 124 200
CAPITAlVAlUeS($/M2) 4,420 12,570 3,130 6,480 2,500 6,240
Sydney ReTAIL SHOPS PITT ST MALL OTHeR CBd
LOw HIGH LOw HIGH
neTRenTAl($/M2) 5,000 10,000 1,000 4,500
yIeld-MARkeT(%) 5.00 6.50 5.50 8.00
OUTGOInGS-OPeRATInG($/M2) 237 288 237 288
OUTGOInGS-STATUTORy($/M2) 37 73 37 73
OUTGOInGS-TOTAl($/M2) 274 361 274 361
CAPITAlVAlUeS($/M2) 100,000 140,000 12,500 80,000
Sydney BULKy GOOdS LOw HIGH
TenAnTneTRenTAl($/M2)>1,000M2 150 450
yIeld-MARkeT(%) 7.75 9.50
IRR(%) 9.50 11.50
OUTGOInGS-OPeRATInG($/M2) 12 40
OUTGOInGS-STATUTORy($/M2) 12 22
OUTGOInGS-TOTAl($/M2) 24 62
CAPITAlVAlUeS($/M2) 1,570 5,800
Source:SavillsResearchQ32015

Rider Levett Bucknall | Riders Digest – Sydney 2016 63S
Sydney enCLOSed CenTReS ReGIOnAL SUB ReGIOnAL neIGHBOURHOOd
LOw HIGH LOw HIGH LOw HIGH
MAjORTenAnTneTRenTAl($/M2) 310 660 235 405 225 390
ddSTenAnTneTRenTAl($/M2) 200 450 110 230 nA nA
SPeCIAlTyTenAnTneTRenTAl($/M2)
1,000 2,600 600 1,200 360 900
yIeld-MARkeT(%) 5.25 7.00 6.25 7.50 6.25 9.00
IRR(%) 8.00 9.00 8.50 9.50 8.50 9.50
OUTGOInGS-OPeRATInG($/M2) 135 179 117 151 97 148
OUTGOInGS-STATUTORy($/M2) 24 34 24 37 27 52
OUTGOInGS-TOTAl($/M2) 159 213 141 188 124 200
CAPITAlVAlUeS($/M2) 4,420 12,570 3,130 6,480 2,500 6,240
Sydney ReTAIL SHOPS PITT ST MALL OTHeR CBd
LOw HIGH LOw HIGH
neTRenTAl($/M2) 5,000 10,000 1,000 4,500
yIeld-MARkeT(%) 5.00 6.50 5.50 8.00
OUTGOInGS-OPeRATInG($/M2) 237 288 237 288
OUTGOInGS-STATUTORy($/M2) 37 73 37 73
OUTGOInGS-TOTAl($/M2) 274 361 274 361
CAPITAlVAlUeS($/M2) 100,000 140,000 12,500 80,000

Rider Levett Bucknall | Riders Digest – Sydney 201664S
Sydney deVeLOPMenT IndUSTRIAL SeCTOR dATA
SOUTH Sydney (ALexAndRIA, BOTAny, BAnKSMeAdOw, ROSeBeRy)
weSTeRn Sydney (ARndeLL PARK, eASTeRn CReeK, eRSKIne PARK, GReySTAneS, HUnTInGwOOd, SMITHFIeLd, weTHeRILL PARK)
PRIMe SeCOndARy
LOw HIGH LOw HIGH
RenTAlneTFACe($/M2) 130 190 90 115
yIeld-MARkeT(%) 6.50 7.00 7.50 8.75
IRR(%) 8.50 9.00 8.75 9.50
OUTGOInGS-TOTAl($/M2) 30 40 30 40
CAPITAlVAlUeS($/M2) 1,625 2,375 950 1,350
lAndVAlUeS3,000-5,000M2($/M2)
500-750
lAndVAlUeS10,000-30,000M2($/M2)
450-700
PRIMe SeCOndARy
LOw HIGH LOw HIGH
RenTAlneTFACe($/M2) 135 190 105 130
yIeld-MARkeT(%) 7.75 9.00 8.75 10.00
IRR(%) 9.25 9.50 9.50 10.00
OUTGOInGS-TOTAl($/M2) 40 50 40 50
CAPITAlVAlUeS($/M2) 1,500 2,300 1,000 1,300
lAndVAlUeS3,000-5,000M2($/M2)
600-700
lAndVAlUeS10,000-30,000M2($/M2)
400-600
PRIMe SeCOndARy
LOw HIGH LOw HIGH
RenTAlneTFACe($/M2) 100 120 70 95
yIeld-MARkeT(%) 6.50 7.25 7.50 8.50
IRR(%) 8.25 8.75 8.75 9.50
OUTGOInGS-TOTAl($/M2) 18 27 18 27
CAPITAlVAlUeS($/M2) 1,100 1,400 700 1,100
lAndVAlUeS3,000-5,000M2($/M2)
350-400
lAndVAlUeS10,000-30,000M2($/M2)
275-325
lAndVAlUeS10HA+($/M2) 275-325
Source:SavillsResearchQ32015
nORTH SHORe (ARTARMOn, LAne COVe, ST LeOnARdS)

BENCHMARKS
66 OfficeBuildingEfficiencies
67 LabourandMaterialsTradeRatios
68 ReinforcementRatios
69 ProgressPaymentClaims
70 KitchenEquipment
72 CommonIndustryAcronyms
73 MethodofMeasurementofBuildingAreas

Rider Levett Bucknall | Riders Digest 201666
TheefficiencyofanofficebuildingisexpressedasapercentageoftheNetLettableAreatotheGrossFloorArea.ThetablebelowindicatesthatrelationshiptotheGrossFloorAreaofthewholebuildingbothwithcarparksandbasementsincludedandexcluded,thatcouldbeexpectedforanaverageprojectinthenominatedcategory.Alsoshownistheaveragenettogrossefficiencyoftheofficefloorsonlyineachoftheeightbuildingtypeslistedbelow.
Type of office Building
efficiency
BasemenTs and car parks
included %
excluded %
office floors %
presTige
cBd
10TO25STOREyS 63–68 75-80 85-90
25TO40STOREyS 58-63 70-75 80-85
40TO55STOREyS 53-58 68-73 75-80
invesTmenT
cBd
UPTO10STOREyS 69-74 81-85 86-91
10TO25STOREyS 64-69 76-81 81-86
25TO40STOREyS 59-64 71-76 76-81
invesTmenT, oTher Than
cBd
UPTO10STOREyS 70-75 82-86 87-92
10TO25STOREyS 65-70 77-82 82-87
planT room space
Generallyplantroomspacerepresents6-11%oftheGrossFloorAreaofamulti-storeyofficebuilding.
Benchmarks office Building efficiencies

Rider Levett Bucknall | Riders Digest 2016 67
Benchmarks laBour and maTerial Trade raTios
Thefollowingrepresentstheratioofon-sitelabourtomaterialforvarioustradesandsub-tradesbaseduponourownsurvey.
Thefiguresarerelevanttoallworksconstructedbytraditionalmethods;variationstothesemethodswillchangetheratios,i.e.on-sitefabricationofitemstraditionallyfactoryfabricatedsuchasjoineryfittings,metalworkitems,etc.
PRELIMINARIES 40 10 50
DEMOLISHER 85 15
ExCAvATOR 32 15 53
PILER 20 50 30
INSITUCONCRETOR 25 75
FORMwORKER 70 30
REINFORCEMENTFIxER 20 80
PRECASTCONCRETOR 20 80
BRICKLAyER&BLOCKLAyER 50 50
MASON 10 90
ASPHALTOR 40 60
STRUCTURALSTEELwORK 60 40
METALwORKER 20 80
SUSPENDEDCEILINGFIxER 40 60
CARPENTER 45 55
JOINER 15 85
STEELDECKROOFER 40 60
BITUMINOUSBUILTUPROOFER 30 70
PIPEwORKPLUMBER 60 40
FITTINGPLUMBER 25 75
DRAINER 65 35
PLASTERER 80 20
PLASTERBOARD&FIB.PLASTERFIxER 40 60
CERAMICTILER 55 45
vINyLTILER 45 55
INSITUPAvIOR 75 25
GLAzIER 20 80
PAINTER 75 25
CARPETLAyER 10 90
ROADwORKER&ExTERNALPAvIOR 15 85
AIRCONDITIONINGSPECIALIST 35 65
LIFTINSTALLER 25 75
ELECTRICALSPECIALIST 40 60
wATERFIRESERvICESPECIALIST 44 56
LABOUR MATERIAL FIxEDFACTOR

Rider Levett Bucknall | Riders Digest 201668
Thefollowingratiosgiveanindicationoftheaverageweightofrodreinforcementpercubicmetreofconcreteforthelistedelements.Differingstructuralsystemsandsizesofindividualelementsandgridsizeswillcauseconsiderablevariationtothestatedratios.Forprojectspecificratiosastructuralengineershouldbeconsulted.
ave kg/m3 ave kg/m3
STRIPFOOTINGS 50 STRAPBEAMS 120
COLUMNBASES 40 SLABONGROUND 40
PILECAPS 50 SUSPENDEDSLABS100-150MMONEANDTwOwAy
90
BOREDPIER 90 250MMFLATPLATE 120
RAFTFOUNDATION 70 250MMwAFFLE 160
PEDESTAL&STUBCOLUMNS
240 COLUMNS 240
RETAININGwALLS
1-2STOREy 70 BEAMS 170
2-3STOREyS 120
GROUNDBEAMS 120 wALLS(CORE) 140
STAIRS 80
Benchmarks reinforcemenT raTios

Rider Levett Bucknall | Riders Digest 2016 69
Averagerateofclaimsexpenditureonconstructionprojectsfrom $4,000,000 to $34,000,000and/orgreaterthanoneyearbutlessthantwoyearsconstructionperiodtopracticalcompletionaredepictedinthefollowinggraph.
Benchmarks progress paymenT claims
100
90
80
70
60
50
40
30
20
10
CU
MU
LA
TIV
E P
RO
JEC
T E
XP
EN
DIT
UR
E %
100 20 30 40 50 60 70 80 90 100
CONTRACT PERIOD %
BUILDERS WORK
MECHANICAL SERVICES
LIFT SERVICES
ELECTRICAL SERVICES
OVERALL PROJECT

Rider Levett Bucknall | Riders Digest 201670
Thefollowingarecostsofkitchenequipmentformealsserviceinvariousfacilitiesandinclude:
– Gas,steamandelectriccooking,serviceandbeveragemakingequipment.
– Kitchenmachineryandconveyorswhereapplicable.
– Coldrooms,refrigerators,freezersandsimilarequipment.
– Stainlesssteeltables,benches,drainers,sinks,backcounters,racks,rails,drawers,etc.
– Mobileandportableitemsofkitchenequipment.
– Storeandcoldroomshelving.
costs are as at fourth Quarter 2015andexclude:
– Buildingworks.
– Mechanical,electricalandplumbingservices.
– Exhaustcanopiesandexhaustventilation.
– Kitchenutensils,chinaware,glassware,cutlery,trays,cashregisters,tables,chairs,etc.
– Goods&ServicesTax(GST).
cafeTerias
Benchmarks kiTchen eQuipmenT
450 MEALS
800 MEALS
1200 MEALS
1600 MEALS
MEALS INCLUDEFULL HOT OR COLD LIGHT HOT OR
COLD, OR SNACK MEALS
TO COMPUTE NUMBER OF MEALSMULTIPLY BY 0.68 THE NUMBER OF
PERSONS IN ESTABLISHMENT AT LUNCHTIME
EXAMPLEOFFICE BUILDING HAS
1175 ON DUTY AT LUNCHTIME
1175 X 0.68 = 799
COST EXAMPLE
800 MEALS AT$1,095/MEAL – $876,500
0
200
400
600
800
1000
1200
1400
1600
1800
700 800 900 1000 1100 1200 1300 1400 1500 1600 1700
$ PER MEAL EXCLUDING GST
NU
MB
ER
OF
LU
NC
H M
EA
LS

Rider Levett Bucknall | Riders Digest 2016 71
hoTels - 4 sTar inTernaTional
hospiTals
$920
$1,050
$1,125
$1,175
$1,200
COMPUTE THE APPROX. NUMBER OFMEALS REQUIRED TO BE SERVED DAILY
EXAMPLE
BRASSERIE 380THEME RESTAURANT 170FINE RESTAURANT 150CONFERENCE FUNCTION & MEETING ROOMS 600ROOM SERVICE 150STAFF CAFETERIA 300 TOTAL 1,750
ADD FOR5 STAR +15-20%5 STAR PLUS + 25-30%
COST EXAMPLE
FOR 4 STAR1,750 MEALS X $1,050 = $1,837,500
NOTE: LIQUOR BARS & LIQUORCOLD ROOMS NOT INCLUDED
500
1000
1500
2000
2500
3000
3500
4000
4500
5000
5500
6000
850 900 950 1000 1050 1100 1150 1200 1250 1300 1350
NU
MB
ER
OF
DA
ILY
ME
AL
S
$ PER MEAL EXCLUDING GST
200
450
700
950
1200
1450
TO COMPUTE NUMBER OF LUNCH MEALS
EXAMPLE300 BEDS X 1.0 = 300
100 MEALS ON WHEELS X 1 = 100440 STAFF X 0.68 = 300
TOTAL 700
COST EXAMPLE700 Meals x $1,966 = $1,376,200
0
200
400
600
800
1000
1200
1400
1600
1800
1000 1200 1400 1600 1800 2000 2200 2400 2600 2800 3000
NU
MB
ER O
F LU
NC
H M
EALS
$ PER MEAL EXCLUDING GST

Rider Levett Bucknall | Riders Digest 201672
Benchmarks common indusTry acronyms
projecT managemenT
AA ArchitectsAdvice
ABIC AustralianBuildingIndustryContracts
AI ArchitectsInstruction
AIA AustralianInstituteofArchitects
BCA BuildingCodeofAustralia
BOQ BillofQuantities
BP BuildingPermit
BS BuildingSurveyor
CA ContractAdministration
CAN ConsultantsAdviceNotice
DA DevelopmentApplication
DD DesignDevelopment
DwG Drawing(alsoanAutocadfileformat)
EBD EvidenceBasedDesign
ESD EnvironmentallySustainableDesign
PI ProfessionalIndemnity(Insurance)
PM ProjectManager
QS QuantitySurveyor
RCP ReflectedCeilingPlan
RFI RequestforInformation
SD SchematicDesign
archiTecTural
ABS AcrylonitrileButadieneStyrene(Edging)
AS AustralianStandards
COL Column
CTS Centres(Spacing)
DP Downpipe
ENS Ensuite
Ex Existing
FC FibreCement(Sheet)
FCL FinishedCeilingLevel
FFL FinishedFloorLevel
FR FireRated
GFA GrossFloorArea
HMR HighlyMoistureResistant(Particleboard)
KDHw KilnDriedHardwood
MDF MediumDensityFibreboard
PB Plasterboard
RL RelativeLevel
SS StainlessSteel
TyP Typical
vOC volatileOrganicCompound
wC waterCloset(Toilet)
land surveys
AHD AustralianHeightDatum
AMG AustralianMappingGrid
DP Downpipe
IL InvertLevel
U/G Underground
RL RelativeLevel
sTrucTural drawings
CFw ContinuousFilletweld
CHS CylindricalHollowSection
CJ ConstructionJoint
EA EqualAngle
PFC ParallelFlangeChannel
RB RoofBeam
RHS RectangularHollowSection
SB SillBeam
SHS SquareHollowSection
TB TieBeam
UA UnequalAngle
UB UniversalBeam
UC UniversalColumn
wT wallTie
hydraulic drawings
DCw DomesticColdwater
DHw DomesticHotwater
FH FireHydrant
FHR FireHoseReel
FIP FireIndicatorPanel
FS FireService
Fw Floorwaste
HwS HotwaterSystem
TD Tundish
TMv ThermostaticMixingvalve
UPvC UnplasticatedPolyvinylChloride(Pipework)
vP ventPipe
mechanical drawings
A/C AirConditioning
A/P AccessPanel
ACU AirConditioningUnit
AHU AirHandlingUnit
CU CondensingUnit
FCU FanCoilUnit
FD FireDamper
R/A ReturnAir
S/A SupplyAir
SD SmokeDamper
elecTrical drawings
DB DistributionBoard
DGPO DoubleGeneralPowerOutlet
GPO GeneralPowerOutlet
MSB MainSwitchboard
RCD ResidualCurrentDevice
SB Switchboard

Rider Levett Bucknall | Riders Digest 2016 73
Benchmarks meThod of measuremenT of Building areas
TherulesformeasurementofbuildingareasaredefinedbytheAustralianInstituteofQuantitySurveyorsandtheAustralianInstituteofArchitects.
Thedefinitionsareasfollows:Unitofmeasurement:squaremetres(m2).
gross floor area (g.f.a.)
Thesumofthe“FullyEnclosedCoveredArea”and“UnenclosedCoveredArea”asdefined.
fully enclosed covered area (f.e.c.a.)
Thesumofallsuchareasatallbuildingfloorlevels,includingbasements(exceptunexcavatedportions),flooredroofspacesandattics,garages,penthouses,enclosedporchesandattachedenclosedcoveredwaysalongsidebuildings,equipmentrooms,liftshafts,verticalducts,staircasesandanyotherfullyenclosedspacesandusableareasofthebuilding,computedbymeasuringfromthenormalinsidefaceofexteriorwallsbutignoringanyprojectionssuchasplinths,columns,piersandthelikewhichprojectfromthenormalinsidefaceofexteriorwalls.Itshallnotincludeopencourts,lightwells,connectingorisolatedcoveredwaysandnetopenareasorupperportionsofrooms,lobbies,halls,interstitialspacesandthelikewhichextendthroughthestoreybeingcomputed.
unenclosed covered area (u.c.a.)
Thesumofallsuchareasatallbuildingfloorlevels,includingroofedbalconies,openverandahs,porchesandporticos,attachedopencoveredwaysalongsidebuildings,undercroftsandusablespaceunderbuildings,unenclosedaccessgalleries(includinggroundfloor)andanyothertrafficablecoveredareasofthebuildingwhicharenottotallyenclosedbyfullheightwalls,computedbymeasuringtheareabetweentheenclosingwallsorbalustrade(i.e.fromtheinsidefaceoftheU.C.A.excludingthewallorbalustradethickness).whenthecoveringelement(i.e.rooforupperfloor)issupportedbycolumns,iscantileveredorissuspended,oranycombinationofthese,themeasurementsshallbetakentotheedgeofthepavingortotheedgeofthecover,whicheveristhelesser.U.C.A.shallnotincludeeavesoverhangs,sunshading,awningsandthelikewherethesedonotrelatetotheclearlydefindedtrafficableareas,norshallitincludeconnectingorisolatedcoveredways.
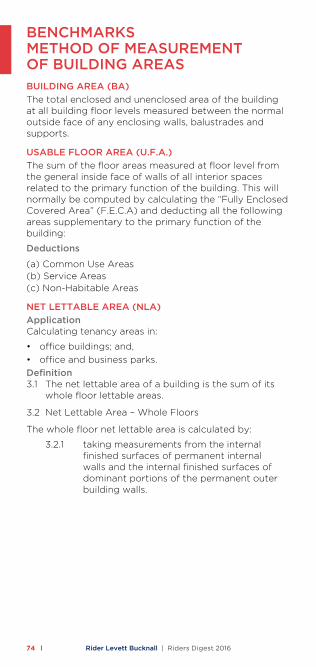
Rider Levett Bucknall | Riders Digest 201674
Building area (Ba)
Thetotalenclosedandunenclosedareaofthebuildingatallbuildingfloorlevelsmeasuredbetweenthenormaloutsidefaceofanyenclosingwalls,balustradesandsupports.
usaBle floor area (u.f.a.)
Thesumofthefloorareasmeasuredatfloorlevelfromthegeneralinsidefaceofwallsofallinteriorspacesrelatedtotheprimaryfunctionofthebuilding.Thiswillnormallybecomputedbycalculatingthe“FullyEnclosedCoveredArea”(F.E.C.A)anddeductingallthefollowingareassupplementarytotheprimaryfunctionofthebuilding:
deductions
(a)CommonUseAreas(b)ServiceAreas(c)Non-HabitableAreas
neT leTTaBle area (nla)
applicationCalculatingtenancyareasin:
• officebuildings;and,
• officeandbusinessparks.
definition3.1 Thenetlettableareaofabuildingisthesumofits
wholefloorlettableareas.
3.2 NetLettableArea–wholeFloors
Thewholefloornetlettableareaiscalculatedby:
3.2.1 takingmeasurementsfromtheinternalfinishedsurfacesofpermanentinternalwallsandtheinternalfinishedsurfacesofdominantportionsofthepermanentouterbuildingwalls.
Benchmarks meThod of measuremenT of Building areas
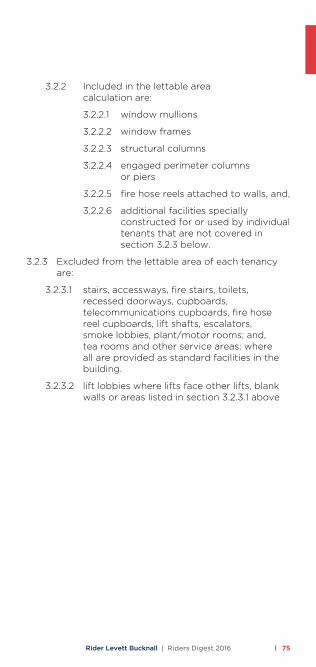
Rider Levett Bucknall | Riders Digest 2016 75
3.2.2 Includedinthelettableareacalculationare:
3.2.2.1 windowmullions
3.2.2.2 windowframes
3.2.2.3 structuralcolumns
3.2.2.4 engagedperimetercolumnsorpiers
3.2.2.5 firehosereelsattachedtowalls,and,
3.2.2.6 additionalfacilitiesspeciallyconstructedfororusedbyindividualtenantsthatarenotcoveredinsection3.2.3below.
3.2.3 Excludedfromthelettableareaofeachtenancyare:
3.2.3.1 stairs,accessways,firestairs,toilets,recesseddoorways,cupboards,telecommunicationscupboards,firehosereelcupboards,liftshafts,escalators,smokelobbies,plant/motorrooms;and,tearoomsandotherserviceareas;whereallareprovidedasstandardfacilitiesinthebuilding.
3.2.3.2 liftlobbieswhereliftsfaceotherlifts,blankwallsorareaslistedinsection3.2.3.1above

Rider Levett Bucknall | Riders Digest 201676
3.2.3.3 areassetasidefortheprovisionofallservices,suchaselectricalortelephoneductsandairconditioningriserstothefloor,wheresuchfacilitiesarestandardfacilitiesinthebuilding
3.2.3.4 areadedicatedaspublicspacesorthoroughfaressuchasfoyers,atriaandaccesswaysinliftandbuildingserviceareas
3.2.3.5 areasandaccesswayssetasideforusebyservicevehiclesandfordeliveryofgoods,wheresuchareasarenotfortheexclusiveuseofoccupiersofthefloororbuilding
3.2.3.6 areasandaccesswayssetasideforcarparking,and,
3.2.3.7 areaswherethereislessthan1.5metreheightclearanceabovefloorlevel–thesespacesshouldbemeasuredandrecordedseparately.
3.3 NetLettableArea–
Follow3.2butmeasuretothecentrelineofinter-tenancywallsorpartitionsexceptwherethewallsorpartitionsadjoinpublicareas,suchaslobbiesandcorridors,inwhichcasemeasuretothelineofthedominantportionoftheirpublicareafaces.
3.4 TreatmentofBalconies,verandahsetc.
Balconies,terraces,planterboxes,verandahs,awningsandcoveredareasshouldbeexcludedfromtenancyareacalculations,butmaybeseparatelyidentifiedforthepurposeofnegotiatingrentals.
Areasshouldbemeasuredtotheinsidefaceoftheenclosingwallsorstructures.Theouteredgeoftheawningorcoveredareaisthedefinededge.
Benchmarks meThod of measuremenT of Building areas

ASSETS&FACILITIES
78 SustainabilityandQuality
79 ManagementStandards
80 UsefulLifeAnalysis
81 Outgoings
82 EssentialSafetyMeasures
83 CapitalAllowances(TaxDepreciation)
ThroughtheRiderLevettBucknall|Lifesuiteofservices,weareabletoprovidemeaningful,practical,commercialadvicetoclientsinthedeliveryofsustainableandeconomicallyresponsibleprojects.
Theserviceshelpbuildingownersunderstandthelifevalueandexpectancyoftheirbuildings’wholelifecostsandprovideoptionstoextendtheusefullifeofbuildingsandmaintainquality.

Rider Levett Bucknall | Riders Digest 201678
AccordingtotheGreenBuildingCouncilofAustralia(GBCA),buildingshaveasignificantimpactontheglobalenvironment,consuming32%oftheworld’sresources,including12%ofitswaterandupto40%ofitsenergy.Buildingsalsoproduce40%ofwastegoingtolandfilland40%ofairemissions.Sustainabilityisconcernedwithimprovingthequalityoflifewhilelivingwithinthecarryingcapacityofsupportingecosystems.Theplanning,deliveringandmanagingourBuiltEnvironmentrequiresabalancebetweenenvironmental,economicandsocialfactors.Theprovisionofamoreproductive,sustainableandliveableBuiltEnvironmentisbestconsideredincollaborationwithallthestakeholders,includingowners,managersandtenants.Thisprocessshouldincludenotonlythereviewofsustainabilityobjectivesandinitiatives,butaddressfunctionalrequirementsandwholeoflifecostingsalongwiththeimplementationoffacilitiesplanningandassetmanagementstrategies.RatingsystemsdevelopedtoassistwiththebenchmarkingofbuildingswithinAustraliainclude:• green star–TheGBCA’ssixstarEnvironmentalratingsystem
evaluatesthedesignandconstructionofbuildingsintermsofenergyandwaterefficiency,indoorenvironmentalqualityandresourceconservation.BuildingsassessedusingtheGreenStar–PerformanceratingtoolcanachieveaGreenStarratingfrom1–6StarGreenStar.GreenStarratingtoolscoverbuildingDesign&AsBuilt,Interiors,CommunitiesandPerformance.
• naBers–NationalAustralianBuiltEnvironmentRatingSystemisanationalprogrammanagedbytheNSwDepartmentofEnvironmentandheritage.NABERSisanationalratingsystemthatmeasurestheenvironmentalperformanceofAustralianbuildings,tenanciesandhomes.Putsimply,NABERSmeasurestheenergyefficiency,waterusage,wastemanagementandindoorenvironmentqualityofabuildingortenancyanditsimpactontheenvironment.Additionally,aNABERSEnergyratingisamandatoryreportingrequirementundertheCommercialBuildingDisclosure(CBD)Program–anationalprogramdesignedtoimprovetheenergyefficiencyofAustralia’slargeofficebuildings.
• Quality–PropertyCouncilofAustralia(PCA)’s“a Guide to Office Building Quality”(2006,2012),providesseparatetoolsforassessingofficebuildingqualityinnewandexistingbuildings.Thetoolsprovideaguidetoparametersthattypicallyinfluencebuildingquality.Theyofferavoluntary,market-basedapproachtoclassifyingbuildingcharacteristicsandperformance.The2ndeditionoftheguidetookeffecton1January2012andincludesexpandedenvironmentalperformancecriteriaforEnergy,water,wasteandIndoorEnvironment.Additionally,theBuildingManagementcriteriawasexpandedtoincludeLevelofService,EnergyandwaterSub-MeteringandLifeCycle/MaintenancePlanrequirements.
RLBhavestaffaccreditedintheuseofGreenStar,NABERS,alongwithLEED,BREEAM,GreenMarkandotherinternationalstandards.RLBalsoprovidesBuildingQualityAssessment(BQA)services.
asseTs & faciliTiessusTainaBiliTy and QualiTy

Rider Levett Bucknall | Riders Digest 2016 79
Sincelate2012StandardsAustralia,supportedbyFMAAustralia,PCA,RICS,SBEnrc,TEFMAandotherindustrybodies,havebeeninvolvedwiththeISO’sinternationalfacilities management (fm)standardsinitiative.Todatethishasinvolved32countries,plusEuroFM,lookingatTermsandDefinitionsandGuidanceonstrategicsourcing.
Separately,therewasthereleasein2014oftheISO55000seriesforasset management (am).Thiscomprisesthreeparts:Overview,principlesandterminology;Managementsystemsrequirements;andGuidelinesfortheapplicationofthe standard.ISO55000specifiestherequirementsfortheestablishment,implementation,maintenanceandimprovementofamanagementsystemforassetmanagement,referredtoasan“assetmanagementsystem”forthosewishingto:
• improvetherealisationofvaluefortheirorganizationfromtheirassetbase
• involvedintheestablishment,implementation,maintenanceandimprovementofanassetmanagementsystem,and
• involvedintheplanning,design,implementationandreviewofassetmanagementactivitiesalongwithserviceproviders.
asseTs & faciliTies managemenT sTandards
Meanwhile,fma australia’slocaleffortsinclude“An Operational Guide To Sustainable Facilities Management”(2010)–apracticaldocumentthatprovidestechnicalguidanceinachievingamoresustainableFMapproachintheAustraliancontext.Theguidecoverspolicyandlegislationissues,implementingsustainability,energyefficiency,watermanagement,wastemanagement,indoorenvironmentquality(IEQ),monitoringandreporting,procurementandknowledgetransfer.
Internationallyusefulpublicationshaveincludedtheifma foundation’s“Benchmarking for Facility Professionals”(2014)andifma’s“High Stakes Business: People, Property and Services”(2014),aguidetoemergencypreparednessandbusinesscontinuityplanningasastrategicpriority.
rlBcanprovidesupportacrossthelatestinAMandFMpractices.
AC
QU
IRE
MA
INT
AIN
MA
INT
AIN
DIS
PO
SE
UP
GR
AD
E

Rider Levett Bucknall | Riders Digest 201680
asseTs & faciliTiesuseful life analysis
life cycle analysis
LifeCycleStudiesrecognisethatevery‘whole’assetconsistsofmanycomponentparts,eachwithitsownlifeexpectancy,interrelationships,resultingqualityandmaintenanceissues.However,inadditiontophysicalobsolescence,usefullifeexpectancyisalsodependentontheinfluenceofeconomic,functional,technological,socialandlegalobsolescence.
weighTed average service life
weightedAverageServiceLife(wASL)isamethodologyusedtodeterminethe“UsefulLife”ofanasset.ForbuildingsthewASListhecollectiveresultofapplyingservicelifecriteriatoeachelementofacostanalysis;excludingcapitalrecurrentexpenditureotherthanroutinemaintenance.
relifing
RElifingtakesthe“wASL”astagefurtherbyconsideringtheeffectofcapitalupgrades,refurbishments,replacementofplant,architecturalfabricandfinishes.BelowisagraphicalrepresentationofaRElifingprofileforatypicalofficebuilding,comparedtothebasewASL.RElifinganalysisisusefulfordevelopers,ownersandoccupiersinfinancialplanning,calculatingdepreciationandinthenegotiationoflongtermpropertycosts.
40
35
30
25
20
15
10
5
05 10 15 20 25 30 35 40 45 50 55 60 65 70
RELIFING WASL
WA
SL
BUILDING USEFUL LIFE

Rider Levett Bucknall | Riders Digest 2016 81
OutgoingsarethecostsrequiredtooperateapropertythataregenerallyrecoverablebyaLandlordfromthetenants.Therecoveryofoutgoingsisusuallycalculatedbyasharingofcostsamongsttenantsrelativetotheirleaseholdinterest.Theygenerallycovertherecurrentcostsforthedeliveryofservices,maintenance,powerandstatutoryandmanagementcosts.
Thelevelofrecoveryofoutgoingsisnormallygovernedandregulatedbyleasesandotheragreementswithtenants.
Thecostofoutgoingsvariesdependingupon:
• thelevelofmanagementandservicesprovided
• leaseagreements
• quality,typeandefficiencyofthebuilding
• locationandstatutoryregimesapplicable
Thefollowinggraphshighlighttypicalcomponentusageofbothenergyandwaterconsumptionforofficebuildings.
asseTs & faciliTies ouTgoings
TYPICAL OFFICE ENERGY USAGE
DOMESTIC HOT WATER 2%
HEATING 5%
CHILLER 24%
PUMPS 7%
FANS 17%
EQUIPMENT 19%
LIGHTS 23%
LIFTS 3%
TYPICAL OFFICE WATER USAGE
IRRIGATION 1%
LEAKAGE 26%
AMENITIES 37%
COOLING TOWERS 31%
OTHERS 2%
RETAIL 3%

Rider Levett Bucknall | Riders Digest 201682
Thefollowingtableprovidesabriefoverviewofbuildingowners’responsibilitieswithregardtocertifyingtheannualmaintenanceofessentialsafetysystemsandmeasureswithincommercialbuildings.
asseTs & faciliTies essenTial safeTy measures
TherelevantlegislationgoverningrequirementsrelatingtoessentialsafetymeasuresbyStateis:
vic BuildingRegulations2006Part12
Qld QueenslandFireandRescueServiceAct2004
nsw EnvironmentalPlanningandAssessmentRegulations2000
sa SADevelopmentAct1993&Minister’sSpecificationsSA76
Tas FireServicesAct1979&GeneralFireRegulations2000
acT ACTEmergenciesAct2004
wa Nospecificlegislation
note:Theaboveisabriefguideonly.Otherstateornationallegislationandlawsmayalsoberelevant.Itisrecommendedthatallpropertyownersconsultabuildingsurveyorregardingresponsibilitiesassociatedwithmaintenanceofessentialmeasureswithintheirbuildings.
vic
Ql
d
ns
w
sa
Ta
s
ac
T
wa
ISMAINTENANCEOFESSENTIALSAFETyMEASURESREQUIREDByLEGISLATION(OTHERTHANBCA)?
3 3 3 3 3 3 7
ISTHEREAPRESCRIBEDFORMOFCERTIFICATE? 3 3 3 3 3 7 7CERTIFICATEREQUIREDTOBEDISPLAyED 7 7 3 7 3 NA NA
CERTIFICATEREQUIREDTOBEFORwARDEDTOANAUTHORITy 7 3 3 3 7 NA NA
CANFINESBEIMPOSEDIFMAINTENANCEISNOTCARRIEDOUT?
3 3 3 7 3 3 NA

Rider Levett Bucknall | Riders Digest 2016 83
TheAustralianTaxationOffice(ATO)allowsataxdeductionfortherecoveryofthecostofassetsusedinabusinessorfortheproductionofincome.TheIncomeTaxAssessmentAct(ITAA)allowstwotypesofallowancesforassets:
division 40 - depreciating assets Assetswithalimitedeffectivelifethatarereasonably
expectedtodeclineinvalue.Thedeclineinvalueisbasedonthecostandeffectivelifeofthedepreciatingasset,notitsactualchangeinvalue.Examplesofthesearecarpet,airconditioningplant,lightsetc.
division 43 – capital allowances CapitalallowancesaretheBuildingAllowanceand
StructuralImprovementdeductionsthatareavailableforbuildings.Depreciatingratesareeither2.5%or4%dependentontheuseofthebuildingandconstructioncommencementdate.
TheATOissuedthelatesteffectivelifereviewofassetsunderTR2015/2whichcameintoeffectonthe1stJuly2015.
ThefollowingbroadprinciplesoutlinetheratesofdepreciationdeductionsrelativetoincomeproducingassetsunderITAA1997(Division40&43).
• Theeffectivelifeandhencetherateofdepreciationofanitemofplantcanbeself-assessedbythetaxpayer.
• DepreciatingAssets(Division40)aresubjecttoabalancingadjustmentondisposal.CapitalworksDeductions(Division43)aresubjecttoCapitalGainsTaxondisposal.
• Lowvaluepooloptionforassetslessthan$1,000invaluedepreciatedat18.75%inthefirstyearand37.50%insubsequentyears.
• TheDiminishingvaluerateiscurrently200%ofPrimeCostrate(excludingLowvaluePool),withtheeffectofacceleratingthetaxwriteoffinearlieryearsoftheasset’slife.
asseTs & faciliTies capiTal allowances (Tax depreciaTion)
Typicalpercentageapportionmentofdepreciationallowancesbasedonnew$300mCommercialOfficeTowerwith6StarGreenStarcertification.
TOTAL ALLOWANCES ($)
27% DIVISION 40
70% DIVISION 43
NON - QUALIFYING 3%
RLBemploysqualifiedstaff,whoareregisteredwiththeTaxPractitionersBoardundertheTaxAgentServicesAct2009,forthepreparationofCapitalAllowanceReports.

Rider Levett Bucknall | Riders Digest 201684
schedule of asseTs prime cosT %
diminishing value
%
The following lisT gives a sample of eligiBle depreciaTing asseTs.
office Building
HOTwATERINSTALLATIONS 6.667 13.333
MULTITyPEFIREDETECTIONSySTEMS 4-16.67 8-33.33
CENTRALAIRCONDITIONING(vARIOUSRATESAPPLyTOEQUIPMENTCOMPONENTS)
4-10 8-20
ROOMAIRCONDITIONING 10 20
PACKAGEDAIRCONDITIONING 6.667 13.333
ELECTRICHANDDRyERS 10 20
DEMOUNTABLEPARTITIONS 5 10
SECURITySySTEMS 14.286-50 28.572-100
LIGHTINGPLANT 5 10
vINyLFLOORING 10 20
CARPET 12.5 25
wINDOwBLINDS 5 10
OFFICEFURNITURE,FREESTANDING 4-10 8-20
ESCALATORS 5 10
LIFTS,ELEvATORSANDHOISTS 3.333 6.667
SIGNAGEFORBUSINESSIDENTIFICATION 10 20
hoTels, moTels
CARPETS 14.286 28.572
wINDOwBLINDSANDCURTAINS 16.667 33.333
FURNITUREANDFITTINGS(FREESTANDING) 14.286-20 28.572-40
HOTwATERSySTEMS 10 20
BEDSANDBEDDING 14.286-50 28.572-100
shopping cenTres
generally The lisT for office Buildings will apply wiTh The following addiTion:
FLOATINGTIMBERFLOORS 10 20
FURNITURE,FREESTANDING 10 20
indusTrial
generally The lisT for office Buildings will apply wiTh The following addiTions:
CRANES 5 10
GANTRIES 3 6
DOCKLEvELLERS 5 10
INFLATABLEDOCKSEALS 10 20
residenTial
EFFECTIvEFROM1STJULy2004
floor coverings:
CARPET 10 20
FLOATINGTIMBER 6.667 13.333
hoTwaTer sysTems (excluding piping):
ELECTRICANDGAS 8.333 16.667
SOLAR 6.667 13.333
miscellaneous:
INTERCOMSySTEMASSETS 10 20
wINDOwBLINDS 10 20
ROOMAIRCONDITIONING 10 20
kiTchen asseTs:
COOKTOPS,OvENS,RANGEHOODS 8.333 16.667
DISHwASHERS,wASHINGMACHINES,CLOTHESDRyERS
10 20
asseTs & faciliTies capiTal allowances (Tax depreciaTion)
OFFICESAROUNDTHEwORLD
86 Oceania
87 Africa
87 MiddleEast
88 UnitedKingdom
88 Asia
91 Americas

Rider Levett Bucknall | Riders Digest 201686
offices around The world
ausTraliaadelaideRiderLevettBucknallSAPtyLtdLevel1,8LeighStreet,Adelaide,SA5000Telephone:+61881001200Email:[email protected]: PeterTulla
BrisBaneRiderLevettBucknallQLDPtyLtdLevel13,10EagleStreet,BrisbaneQLD4000Telephone:+61730096933Email:[email protected]: DaveStewart
cairnsRiderLevettBucknallQLDPtyLtdSuite7,1stFloor,CairnsProfessionalCentre,92-96PeaseStreet,CairnsQLD4870Telephone:+61740321533Email:[email protected]: NicholasDuncan
canBerraRiderLevettBucknallACTPtyLtd16BenthamStreet,yarralumlaACT2600Telephone:+61262815446Email:[email protected]: MarkChappe
darwinRiderLevettBucknallNTPtyLtdLevel4,62CavanaghStreet,DarwinNT0800Telephone:+61889412262Email:[email protected]: PaulLassemillante
gold coasTRiderLevettBucknallQLDPtyLtd45NerangStreet,SouthportQLD4215Telephone:+61755956900Email:[email protected]: StuartHoughton
melBourneRiderLevettBucknallvICPtyLtdLevel13,380St.KildaRoad,MelbournevIC3004Telephone: +61396906111Email:[email protected]: EwenMcDonald
newcasTleRiderLevettBucknallNSwPtyLtd63LindsayStreet,HamiltonNSw2303Telephone:+61249400000Email:[email protected]: MarkHocking
norThern nswRiderLevettBucknallNSwPtyLtdLevel1,9ParkAvenue,CoffsHarbourNSw2450Telephone:+61266592060Email:[email protected]: MarkHocking
perThRiderLevettBucknallwAPtyLtdLevel9,160StGeorgesTce,Perth,wA6000Telephone:+61894211230Email:[email protected]: AlastairMcMichael
sunshine coasTRiderLevettBucknallQLDPtyLtd63TheEsplanade,MaroochydoreQLD4558Telephone:+61754433622Email:[email protected]: DavidStewart
sydneyRiderLevettBucknallNSwPtyLtdLevel19,141walkerStreet,NorthSydneyNSw2060Telephone:+61299222277Email:[email protected]: MatthewHarris
TownsvilleRiderLevettBucknallQLDPtyLtdLevel1,45EyreStreet,Northward,TownsvilleQLD4810Telephone:+61747715718Email:[email protected]: ChrisMarais
new ZealandaucklandRiderLevettBucknallAucklandLtdLevel16,veroCentre,48ShortlandStreet,Auckland1141Telephone:+6493091074Email:[email protected]: StephenGracey
chrisTchurchRiderLevettBucknallChristchurchLtdLevel1,UnitJA,1RadcliffeRoad,Belfast,Christchurch8051Telephone:+6433546873Email:[email protected]: MalcolmTimms

Rider Levett Bucknall | Riders Digest 2016 87
palmersTon norThRiderLevettBucknallPalmerstonNorthLtdSuite1,Level1,219BroadwayAvenue,PalmerstonNorth4440Telephone:+6463570326Email:[email protected]: MichaelCraine
QueensTownRiderLevettBucknallOtagoLtdLevel2,36ShotoverStreet,Queenstown9348Telephone:+6434090325Email:[email protected]: ChrisHaines
TaurangaRiderLevettBucknallAucklandLtdGroundFloor,3/602CameronRoad,Tauranga3141Telephone:+6475795873Email:[email protected]: MartinGrace
wellingTonRiderLevettBucknallwellingtonLtdLevel1,279willisStreet,wellington6011Telephone:+6443849198Email:[email protected]: TonySutherland
africapenTad QuanTiTy surveyor (pTy) lTd.
johannesBurgBlockB,LittleFourwaysOfficePark,1LeslieAvenueEast,Fourways,Johannesburg,SouthAfricaTelephone:+27115484000Contact:LeonCronje
cape Town9thFloor,22BreeStreet,CapeTown,SouthAfricaTelephone:+27214189977Contact:MartinMeinesz
preToria 1stFloor,BuildingA,LynnwoodBridgeOfficePark,Pretoria,SouthAfricaTelephone:+27123481040Contact:NicolasSheard
gaBarone (BoTswana)Plot39,Unit7,InternationalCommercePark,Gabarone,BotswanaTelephone:+27832260303Contact:NicolasSheard
porT louis (mauriTius)GroundFloor,Office4,ENLHouse,vivéaBusinessPark,Moka,MauritiusTelephone:+23057678815Contact:MarvindBeetul
mapuTo (moZamBiQue)RuaDomEstêvãoAtaíde,nº38/42,noBairrodaSommerschield1,Maputo,MozambiqueTelephone:+258824078580Contact:Charléviljoen
middle easTaBu dhaBiMezzanineLevel,AlMazroueiBuilding,MuroorRoad,POBox105766AbuDhabi,UnitedArabEmiratesTelephone:+97126433691Email:[email protected]: TonyBratt
dohaOffice32,SecondFloor,AlMirqabComplex,AlMirqabAlJadeedStreet,AlNaserArea,Doha,QatarTelephone:+97440162777Email:[email protected]: SamGraham
duBaiOasisCentre,Level3,Suite9,SheikhzayedRoad,P.O.Box115882,Dubai,UnitedArabEmiratesTelephone:+97143397444Email:[email protected]: RobEdgecombe
muscaTBuildingNo.287,18thNovemberRoad,NorthAzaiba,SultanateofOmanTelephone:+96824499676Email:[email protected]: RockyChan
riyadhPOBox53911,Riyadh11593,SaudiArabiaTelephone:+966506633288Email:[email protected]: JohnPrior

Rider Levett Bucknall | Riders Digest 201688
offices around The world
uniTed kingdomBirchwoodSuiteA4,ChadwickHouse,BirchwoodPark,warringtonwA36AETelephone:+4401925851787Email:[email protected]: DeryckBarton
BirminghamCathedralCourt,15ColmoreRow,Birmingham,B32BHTelephone:+4401215031500Email:[email protected]: NigelMason
BrisTolEmbassyHouse,86QueensAvenue,Bristol,BS81SBTelephone:+4401179741122Email:[email protected]: JackiePinder
glasgow151westGeorgeStreet,GlasgowG22JJTelephone:+4401412286274Email:[email protected]: DeanSheehy
leedsAtlasHouse,31KingStreet,LeedsLS12HLTelephone:+4401134573225Email:[email protected]: MatthewGosling
london2ndFloor,60NewBroadStreet,London,EC2M1JJTelephone:+4402073988300Email:[email protected]: PhilBreeden
manchesTer8ExchangeQuay,SalfordQuays,Manchester,M53EJTelephone:+4401618687700Email:[email protected]: ChrisHartley
newcasTleEvansBusinessCentre,DurhamwaySouth,AycliffeIndustrialPark,NewtonAycliffe,CountyDurham,DL56xPTelephone:+4401215031500Email:[email protected]: Markweaver
sheffield6thFloorOrchardLanewing,FountainPrecinct,BalmGreen,Sheffield,S12JATelephone:+4401142733300Email:[email protected]: MatthewGosling
welwyn garden ciTy29BroadwaterRoad,welwynGardenCity,Hertfordshire,AL73BQTelephone:+4401707800440Email:[email protected]: GordonGlenn
wokingham1000EskdaleRoad,winnershTriangle,wokingham,Berkshire,RG415TSTelephone:+4401189743600Email:[email protected]: MichaelRighton
chinaBeijingRoom1803-1809,18thFloor,EastOceanCentre,24AJianGuoMenwaiAvenue,ChaoyangDistrict,Beijing100004,ChinaTelephone:+861065155818Email:[email protected]: SimonTuen
chengdu29thFloor,SquareOne,No.18DongyuStreet,JinjiangDistrict,Chengdu610016,SichuanProvince,ChinaTelephone:+862886703382Email:[email protected]: EricLau
chongQingRoom3007-3008,30thFloor,MetropolitanTower,No.68zourongRoad,CentralDistrict,Chongqing400010,ChinaTelephone:+862363806628Email:[email protected]: DannyChow
dalianRoom1103,11thFloor,xiwangTower,No.136zhongshanRoad,zhongshanDistrict,Dalian116001,LiaoningProvince,ChinaTelephone:+8641139737778Email:[email protected]: SimonTuen

Rider Levett Bucknall | Riders Digest 2016 89
guangZhouRoom601,6Floor,TaikooHuiTower,385TianHeRoad,Guangzhou510620,GuangzhouProvinceTelephone:+862087321801Email:[email protected]: DannyChow
guiyangRoomE,12thFloor,FuzhongInternationalPlaza,126xinHuaRoad,Guiyang550002,GuizhouProvince,ChinaTelephone:+868515533818Email:[email protected]: DannyChow
haikouRoom1708,17thFloor,FortuneCenter,38DaTongRoad,Haikou570102,HainanProvince,ChinaTelephone:+8689866726638Email:[email protected]: StephenLai
hangZhouRoom2306,23rdFloor,DeepBluePlaza,No.203,zhaoHuiRoad,Hangzhou,310014zhejiangProvince,ChinaTelephone:+8657185393028Email:[email protected]: IrisLee
hong kong20thFloor,EasternCentralPlaza,3yiuHingRoad,ShaukeiwanTelephone:+85228231823Email:[email protected]: PhilipLo
macauAlamedaDr.CarlosD’Assumpção,No.398EdificioCNAC9°Andar,I-JMacauSARTelephone:+85328753088Email:[email protected]: KennethKwan
nanjingRoom1202,SouthTowerNIC,201zhongyangRoad,Nanjing210009,JiangSuProvince,ChinaTelephone:+862586780300Email:[email protected]: EricFong
QingdaoRoom2019,20thFloor,ParksonCommericalPlaza,44-60zhongshanRoad,ShinanDistrict,Quingdao266001,ShandongProvinces,ChinaTelephone:+8653286123015Email:[email protected]:StephenLiu
shanghai22ndFloor,GreentechTower,436HengfengRoad,zhabeiDistrict,Shanghai200070,ChinaTelephone:+862163301999Email:[email protected]: w.Q.wang
shenyang25thFloor,TowerA,PresidentBuilding,No.69HepingNorthAvenue,HepingDistrict,Shenyang110003,LiaoningProvince,ChinaTelephone:+862423965516Email:[email protected]: C.H.Chan
shenZhenRoom4510-4513,45thFloor,ShunHingSquareDiwangCommercialCentre,5002ShennanRoadEast,Shenzhen518001,GuangdongProvince,ChinaTelephone:+8675582460959Email:[email protected]: KennethKwan
TianjinRoom1908,19thFloor,TianjinInternationalBuilding,75NanjingRoad,HepingDistrict,Tianjin300050,ChinaTelephone:+862223396632Email:[email protected]: StephenLai
wuhanRoom2301,23rdFloor,NewworldInternationalTradeCentre,No.568JiansheAvenue,wuhan430022,HubeiProvince,ChinaTelephone:+862768850986Email:[email protected]: StephenLai
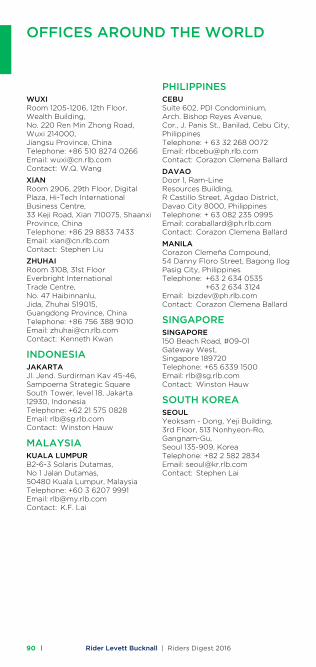
Rider Levett Bucknall | Riders Digest 201690
wuxiRoom1205-1206,12thFloor,wealthBuilding,No.220RenMinzhongRoad,wuxi214000,JiangsuProvince,ChinaTelephone:+8651082740266Email:[email protected]: w.Q.wang
xianRoom2906,29thFloor,DigitalPlaza,Hi-TechInternationalBusinessCentre,33KejiRoad,xian710075,ShaanxiProvince,ChinaTelephone:+862988337433Email:[email protected]: StephenLiu
ZhuhaiRoom3108,31stFloorEverbrightInternationalTradeCentre,No.47Haibinnanlu,Jida,zhuhai519015,GuangdongProvince,ChinaTelephone:+867563889010Email:[email protected]: KennethKwan
indonesiajakarTaJl.Jend.SurdirmanKav45-46,SampoernaStrategicSquareSouthTower,level18,Jakarta12930,IndonesiaTelephone:+62215750828Email:[email protected]: winstonHauw
malaysiakuala lumpurB2-6-3SolarisDutamas,No1JalanDutamas,50480KualaLumpur,MalaysiaTelephone:+60362079991Email:[email protected]: K.F.Lai
philippinesceBuSuite602,PDICondominium,Arch.BishopReyesAvenue,Cor.,J.PanisSt.,Banilad,CebuCity,PhilippinesTelephone:+63322680072Email:[email protected]: CorazonClemenaBallard
davaoDoor1,Ram-LineResourcesBuilding,RCastilloStreet,AgdaoDistrict,DavaoCity8000,PhilippinesTelephone:+630822350995Email:[email protected]: CorazonClemenaBallard
manilaCorazonClemeñaCompound,54DannyFloroStreet,BagongIlogPasigCity,PhilippinesTelephone: +6326340535
+6326343124Email:[email protected]: CorazonClemenaBallard
singaporesingapore150BeachRoad,#09-01Gatewaywest,Singapore189720Telephone:+6563391500Email:[email protected]: winstonHauw
souTh koreaseoulyeoksam-Dong,yejiBuilding,3rdFloor,513Nonhyeon-Ro,Gangnam-Gu,Seoul135-909,KoreaTelephone:+8225822834Email:[email protected]: StephenLai
offices around The world
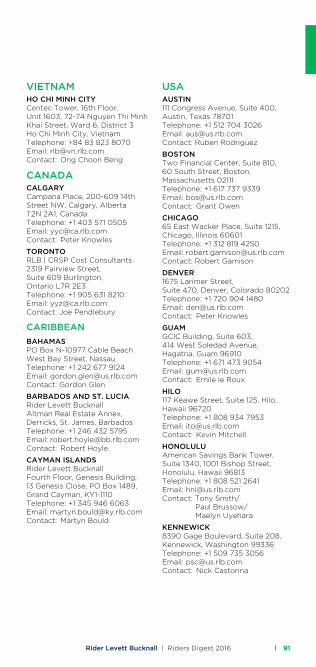
Rider Levett Bucknall | Riders Digest 2016 91
vieTnamho chi minh ciTyCentecTower,16thFloor,Unit1603,72-74NguyenThiMinhKhaiStreet,ward6,District3HoChiMinhCity,vietnamTelephone:+84838238070Email:[email protected]: OngChoonBeng
canadacalgaryCampanaPlace,200-60914thStreetNw,Calgary,AlbertaT2N2A1,CanadaTelephone:+14035710505Email:[email protected]: PeterKnowles
ToronToRLB|CRSPCostConsultants2319FairviewStreet,Suite609Burlington,OntarioL7R2E3Telephone:+19056318210Email:[email protected]:JoePendlebury
cariBBean
BahamasPOBoxN-10977CableBeachwestBayStreet,NassauTelephone:+12426779124Email:[email protected]:GordonGlen
BarBados and sT. luciaRiderLevettBucknallAltmanRealEstateAnnex,Derricks,St.James,BarbadosTelephone:+12464325795Email:[email protected]: RobertHoyle
cayman islandsRiderLevettBucknallFourthFloor,GenesisBuilding,13GenesisClose,POBox1489,GrandCayman,Ky1-1110Telephone:+13459466063Email:[email protected]: MartynBould
usaausTin111CongressAvenue,Suite400,Austin,Texas78701Telephone:+15127043026Email:[email protected]:RubenRodriguez
BosTonTwoFinancialCenter,Suite810,60SouthStreet,Boston,Massachusetts02111Telephone:+16177379339Email:[email protected]: GrantOwen
chicago65EastwackerPlace,Suite1215,Chicago,Illinois60601Telephone:+13128194250Email:[email protected]:RobertGamison
denver1675LarimerStreet,Suite470,Denver,Colorado80202Telephone:+17209041480Email:[email protected]: PeterKnowles
guamGCICBuilding,Suite603,414westSoledadAvenue,Hagatna,Guam96910Telephone:+16714739054Email:[email protected]: EmileleRoux
hilo117KeaweStreet,Suite125,Hilo,Hawaii96720Telephone:+18089347953Email:[email protected]: KevinMitchell
honoluluAmericanSavingsBankTower,Suite1340,1001BishopStreet,Honolulu,Hawaii96813Telephone:+18085212641Email:[email protected]:TonySmith/ PaulBrussow/ MaelynUyehara
kennewick8390GageBoulevard,Suite208,Kennewick,washington99336Telephone:+15097353056Email:[email protected]: NickCastorina

Rider Levett Bucknall | Riders Digest 201692
las vegas3753HowardHughes,Parkway,Suite211,Lasvegas,Nevada89169Telephone:+17022278818Email:[email protected]: JulianAnderson
los angelesPacificCenter,523westSixthStreet,Suite522,LosAngeles,California90014Telephone:+12136891103Email:[email protected]: GrahamRoy
maui300OhukaiRoad,BuildingB,Kihei,Hawaii96753Telephone:+18088751945Email:[email protected]: BrianLowder
new yorkBroadStreetCentre,80BroadStreet,5thFloor,Newyork10004Telephone:+12128377789Email:[email protected]: GrantOwen
phoenix4343EastCamelbackRoad,Suite350,Phoenix,Arizona85018Telephone:+16024434848Email:[email protected]: JulianAnderson/
JohnJozwick/ScottMacpherson
porTlandBreweryBlock2,1120NwCouchStreet,Suite730,Portland,Oregon97209Telephone:+15032262730Email:[email protected]: GrahamRoy
san francisco425MarketStreet,22ndFloor,SanFrancisco,California94105Telephone:+14153622613Email:[email protected]: GrahamRoy
seaTTle19241stAvenue,SecondFloor,Seattle,washington98101Telephone:+12062232055Email:[email protected]: ChrisBurris
TusconTwoEastCongress,Suite900,Tucson,Arizona85701Telephone:+15202027378Email:[email protected]: JoelBrown
waikoloawaikoloaHighlandsCentre68-1845waikeloaRoad,Suite202,waikoloa,Hawaii96738Telephone:+18088833379Email:[email protected]:KevinMitchell
washingTonMetroCenter,1200GStreetNw,Suite800,washington,DC20005Telephone:+12024348350Email:[email protected]: GrantOwen
offices around The world

CALENDARS
94 PublicHolidaysinAustralia
95 Calendars2015–2018

Rider Levett Bucknall | Riders Digest 201694
all sTaTes 2016 2017 2018
NewyearsDay 1JAN 2JAN 1JAN
AustraliaDay 26JAN 26JAN 26JAN
GoodFriday 25MAR 14APR 30MAR
EasterMonday 28MAR 17APR 2APR
AnzacDay 25APR 25APR 25APR
QueensBirthday(exceptwA) 13JUN 12JUN 11JUN
ChristmasDay 27DEC 25DEC 25DEC
BoxingDay 26DEC 26DEC 26DEC
vicToria
LabourDay 14MAR 13MAR 12MAR
GrandFinalEveDay 30SEP 29SEP 28SEP
MelbourneCupDay 1NOv 7NOv 6NOv
new souTh wales
BankHoliday 1AUG 7AUG 6AUG
LabourDay 3OCT 2OCT 1OCT
Queensland
LabourDay 3OCT 2OCT 1OCT
RoyalNationalShow 17AUG 16AUG 15AUG
souTh ausTralia
AdelaideCupDay 14MAR 13MAR 12MAR
LabourDay 3OCT 2OCT 1OCT
wesTern ausTralia
LabourDay 7MAR 6MAR 5MAR
FoundationDay 6JUN 5JUN 4JUN
Queen’sBirthday 26SEP 2OCT 24SEP
Tasmania
RoyalHobartRegatta 8FEB 13FEB 12FEB
LauncestonCup 24FEB 22FEB 28FEB
EightHoursDay 14MAR 13MAR 12MAR
LauncestonShow 6OCT 12OCT 11OCT
HobartShow 20OCT 26OCT 25NOv
RecreationDay(Northern) 7NOv 6NOv 5NOv
a.c.T.
CanberraDay 14MAR 13MAR 12MAR
LabourDay 3OCT 2OCT 1OCT
norThern TerriTory
MayDay 2MAy 1MAy 7MAy
DarwinShowDay 22JUL 28JUL 24JUL
PicnicDay 1AUG 7AUG 6AUG
calendars puBlic holidays in ausTralia

Rider Levett Bucknall | Riders Digest 2016 95
january 2015s m T w T f s 1 2 34 5 6 7 8 9 1011 12 13 14 15 16 1718 19 20 21 22 23 2425 26 27 28 29 30 31
april 2015s m T w T f s
1 2 3 45 6 7 8 9 10 1112 13 14 15 16 17 1819 20 21 22 23 24 2526 27 28 29 30
july 2015s m T w T f s 1 2 3 45 6 7 8 9 10 1112 13 14 15 16 17 1819 20 21 22 23 24 2526 27 28 29 30 31
ocToBer 2015s m T w T f s 1 2 34 5 6 7 8 9 1011 12 13 14 15 16 1718 19 20 21 22 23 2425 26 27 28 29 30 31
feBruary 2015s m T w T f s1 2 3 4 5 6 78 9 10 11 12 13 1415 16 17 18 19 20 2122 23 24 25 26 27 28
may 2015s m T w T f s 1 23 4 5 6 7 8 910 11 12 13 14 15 1617 18 19 20 21 22 2324 25 26 27 28 29 3031
augusT 2015s m T w T f s 12 3 4 5 6 7 89 10 11 12 13 14 1516 17 18 19 20 21 2223 24 25 26 27 28 2930 31
novemBer 2015s m T w T f s1 2 3 4 5 6 78 9 10 11 12 13 1415 16 17 18 19 20 2122 23 24 25 26 27 2829 30
march 2015s m T w T f s1 2 3 4 5 6 78 9 10 11 12 13 1415 16 17 18 19 20 2122 23 24 25 26 27 2829 30 31
june 2015s m T w T f s 1 2 3 4 5 67 8 9 10 11 12 1314 15 16 17 18 19 2021 22 23 24 25 26 2728 29 30
sepTemBer 2015s m T w T f s 1 2 3 4 56 7 8 9 10 11 1213 14 15 16 17 18 1920 21 22 23 24 25 2627 28 29 30
decemBer 2015s m T w T f s 1 2 3 4 56 7 8 9 10 11 1213 14 15 16 17 18 1920 21 22 23 24 25 2627 28 29 30 31
2015
january 2016s m T w T f s 1 23 4 5 6 7 8 910 11 12 13 14 15 1617 18 19 20 21 22 2324 25 26 27 28 29 3031
april 2016s m T w T f s 1 23 4 5 6 7 8 910 11 12 13 14 15 1617 18 19 20 21 22 2324 25 26 27 28 29 30
july 2016s m T w T f s 1 23 4 5 6 7 8 910 11 12 13 14 15 1617 18 19 20 21 22 2324 25 26 27 28 29 3031
ocToBer 2016s m T w T f s 12 3 4 5 6 7 89 10 11 12 13 14 1516 17 18 19 20 21 2223 24 25 26 27 28 2930 31
feBruary 2016s m T w T f s 1 2 3 4 5 67 8 9 10 11 12 1314 15 16 17 18 19 2021 22 23 24 25 26 2728 29
may 2016s m T w T f s1 2 3 4 5 6 78 9 10 11 12 13 1415 16 17 18 19 20 2122 23 24 25 26 27 2829 30 31
augusT 2016s m T w T f s 1 2 3 4 5 67 8 9 10 11 12 1314 15 16 17 18 19 2021 22 23 24 25 26 2728 29 30 31
novemBer 2016s m T w T f s 1 2 3 4 56 7 8 9 10 11 1213 14 15 16 17 18 1920 21 22 23 24 25 2627 28 29 30
march 2016s m T w T f s 1 2 3 4 56 7 8 9 10 11 1213 14 15 16 17 18 1920 21 22 23 24 25 2627 28 29 30 31
june 2016s m T w T f s 1 2 3 45 6 7 8 9 10 1112 13 14 15 16 17 1819 20 21 22 23 24 2526 27 28 29 30
sepTemBer 2016s m T w T f s 1 2 34 5 6 7 8 9 1011 12 13 14 15 16 1718 19 20 21 22 23 2425 26 27 28 29 30
decemBer 2016s m T w T f s 1 2 34 5 6 7 8 9 1011 12 13 14 15 16 1718 19 20 21 22 23 2425 26 27 28 29 30 31
2016

Rider Levett Bucknall | Riders Digest 201696
january 2017s m T w T f s1 2 3 4 5 6 78 9 10 11 12 13 1415 16 17 18 19 20 2122 23 24 25 26 27 2829 30 31
april 2017s m T w T f s 12 3 4 5 6 7 89 10 11 12 13 14 1516 17 18 19 20 21 2223 24 25 26 27 28 2930
july 2017s m T w T f s 12 3 4 5 6 7 89 10 11 12 13 14 1516 17 18 19 20 21 2223 24 25 26 27 28 2930 31
ocToBer 2017s m T w T f s1 2 3 4 5 6 78 9 10 11 12 13 1415 16 17 18 19 20 2122 23 24 25 26 27 2829 30 31
feBruary 2017s m T w T f s 1 2 3 45 6 7 8 9 10 1112 13 14 15 16 17 1819 20 21 22 23 24 2526 27 28
may 2017s m T w T f s 1 2 3 4 5 67 8 9 10 11 12 1314 15 16 17 18 19 2021 22 23 24 25 26 2728 29 30 31
augusT 2017s m T w T f s 1 2 3 4 56 7 8 9 10 11 1213 14 15 16 17 18 1920 21 22 23 24 25 2627 28 29 30 31
novemBer 2017s m T w T f s 1 2 3 45 6 7 8 9 10 1112 13 14 15 16 17 1819 20 21 22 23 24 2526 27 28 29 30
march 2017s m T w T f s 1 2 3 45 6 7 8 9 10 1112 13 14 15 16 17 1819 20 21 22 23 24 2526 27 28 29 30 31
june 2017s m T w T f s 1 2 34 5 6 7 8 9 1011 12 13 14 15 16 1718 19 20 21 22 23 2425 26 27 28 29 30
sepTemBer 2017s m T w T f s 1 23 4 5 6 7 8 910 11 12 13 14 15 1617 18 19 20 21 22 2324 25 26 27 28 29 30
decemBer 2017s m T w T f s 1 23 4 5 6 7 8 910 11 12 13 14 15 1617 18 19 20 21 22 2324 25 26 27 28 29 3031
2017
january 2018s m T w T f s 1 2 3 4 5 67 8 9 10 11 12 1314 15 16 17 18 19 2021 22 23 24 25 26 2728 29 30 31
april 2018s m T w T f s1 2 3 4 5 6 78 9 10 11 12 13 1415 16 17 18 19 20 2122 23 24 25 26 27 2829 30
july 2018s m T w T f s1 2 3 4 5 6 78 9 10 11 12 13 1415 16 17 18 19 20 2122 23 24 25 26 27 2829 30 31
ocToBer 2018s m T w T f s 1 2 3 4 5 67 8 9 10 11 12 1314 15 16 17 18 19 2021 22 23 24 25 26 2728 29 30 31
feBruary 2018s m T w T f s 1 2 34 5 6 7 8 9 1011 12 13 14 15 16 1718 19 20 21 22 23 2425 26 27 28
may 2018s m T w T f s 1 2 3 4 56 7 8 9 10 11 1213 14 15 16 17 18 1920 21 22 23 24 25 2627 28 29 30 31
augusT 2018s m T w T f s 1 2 3 45 6 7 8 9 10 1112 13 14 15 16 17 1819 20 21 22 23 24 2526 27 28 29 30 31
novemBer 2018s m T w T f s 1 2 34 5 6 7 8 9 1011 12 13 14 15 16 1718 19 20 21 22 23 2425 26 27 28 29 30
march 2018s m T w T f s 1 2 34 5 6 7 8 9 1011 12 13 14 15 16 1718 19 20 21 22 23 2425 26 27 28 29 30 31
june 2018s m T w T f s 1 23 4 5 6 7 8 910 11 12 13 14 15 1617 18 19 20 21 22 2324 25 26 27 28 29 30
sepTemBer 2018s m T w T f s 12 3 4 5 6 7 89 10 11 12 13 14 1516 17 18 19 20 21 2223 24 25 26 27 28 2930
decemBer 2018s m T w T f s 12 3 4 5 6 7 89 10 11 12 13 14 1516 17 18 19 20 21 2223 24 25 26 27 28 2930 31
2018


rlb.com


![Licensing MotorcycleRiders’ Handbookironbrothersmc.com/motors/[Riders' book]/Riders' handbook.pdf · MotorcycleRiders’ Handbook. Motorcycle Riders’ Handbook Learner Approved](https://static.fdocuments.in/doc/165x107/5a7801147f8b9ad22a8e985c/licensing-motorcycleriders-ha-riders-bookriders-handbookpdf-motorcycleriders.jpg)