RICE MARKETING IN EASTERN NIGERIA - AgEcon...
24
DELANE E. W ELSCH* RICE MARKETING IN EASTERN NIGERIA t INTRODUCTION The development of rice production, marketing, and processing in Eastern Nigeria provides a useful example of the establishment of a new agri- cultural industry in a preindustrial economy. Rice has been grown in the North- ern and Western Regions of Nigeria for centuries, but in the Eastern Region it is a relatively new crop. Variety 79 (long grain), an Asian rice (0. sativa), was first introduced from British Guiana to the Abakaliki area of Eastern Nigeria in 1942, and it is still the only variety produced in the East. After several years of testing and demonstration, its cultivation as a cash crop by small farmers began to expand. By 1948 the volume of production exceeded the capacity of hand- hulling methods, and the government introduced small milling machines. By 1950 ownership of these machines had been transferred to private hands, and many more machines have since been installed. During this short period a com- plete marketing system for rice evolved. This paper deals mainly with that marketing system. The structure of marketing in 1963 is described, and its potential for contributing to increased production and economic development in general is examined. Paddy Production in Eastern Nigeria Paddy is produced primarily in small saucer-shaped inland swamps and in low-lying areas bordering small drainage ways. Techniques are essentially Far Eastern; i.e., seed is planted in nurseries, and the seedlings are transplanted into the swamps. Nurseries are planted just before the start of the wet season (May), and the crop is harvested at the start of the dry season (November). One aspect of production is particularly important for the purposes of this paper, namely, the existence of two types of paddy farmers. In the Abakaliki area (accounting for two-thirds of the Region's production) the "native" farmer, who lives and farms in the village where he was born, is the typical peasant or formerly subsistence farmer, and his group constitutes nearly all of the rice farmers. A second group of "stranger" farmers, who have migrated from more densely populated areas of Eastern Nigeria to the Abakaliki or other urban (not farming- • Assistant professor of agricultural economics, Texas A&M University. t Texas Agr. Exp. Sta. Tech. Art. 5463. The material in this paper is drawn from the author's Ph.D. thesis, Michigan State University. The author wishes to acknowledge Michigan State University International Programs for providing financial assistance, and the University of Nigeria Economic De- velopment Institute for providing a base from which to work.
Transcript of RICE MARKETING IN EASTERN NIGERIA - AgEcon...

DELANE E. W ELSCH*
RICE MARKETING IN EASTERN NIGERIA t
INTRODUCTION
The development of rice production, marketing, and processing in Eastern Nigeria provides a useful example of the establishment of a new agricultural industry in a preindustrial economy. Rice has been grown in the Northern and Western Regions of Nigeria for centuries, but in the Eastern Region it is a relatively new crop. Variety 79 (long grain), an Asian rice (0. sativa), was first introduced from British Guiana to the Abakaliki area of Eastern Nigeria in 1942, and it is still the only variety produced in the East. After several years of testing and demonstration, its cultivation as a cash crop by small farmers began to expand. By 1948 the volume of production exceeded the capacity of handhulling methods, and the government introduced small milling machines. By 1950 ownership of these machines had been transferred to private hands, and many more machines have since been installed. During this short period a complete marketing system for rice evolved. This paper deals mainly with that marketing system. The structure of marketing in 1963 is described, and its potential for contributing to increased production and economic development in general is examined.
Paddy Production in Eastern Nigeria
Paddy is produced primarily in small saucer-shaped inland swamps and in low-lying areas bordering small drainage ways. Techniques are essentially Far Eastern; i.e., seed is planted in nurseries, and the seedlings are transplanted into the swamps. Nurseries are planted just before the start of the wet season (May), and the crop is harvested at the start of the dry season (November).
One aspect of production is particularly important for the purposes of this paper, namely, the existence of two types of paddy farmers. In the Abakaliki area (accounting for two-thirds of the Region's production) the "native" farmer, who lives and farms in the village where he was born, is the typical peasant or formerly subsistence farmer, and his group constitutes nearly all of the rice farmers. A second group of "stranger" farmers, who have migrated from more densely populated areas of Eastern Nigeria to the Abakaliki or other urban (not farming-
• Assistant professor of agricultural economics, Texas A&M University. t Texas Agr. Exp. Sta. Tech. Art. 5463. The material in this paper is drawn from the author's
Ph.D. thesis, Michigan State University. The author wishes to acknowledge Michigan State University International Programs for providing financial assistance, and the University of Nigeria Economic Development Institute for providing a base from which to work.

330 DELANE E. WELSCH
type village) areas, not only grow rice but also usually engage in paddy trading and processing. In 1963 they averaged 28 acres of paddy per "stranger" farmer compared with 3.7 acres per "native" farmer. Although much less numerous (there are probably not over 150 at the present time) than the "native" farmers, the "strangers" have had a tremendous impact on the rice industry. They were the "innovators" and "early adopters" who were largely responsible for the rapid spread of paddy cultivation. By selecting and paying cash rent for choice swamps, they have brought about the modification of a traditional land tenure system based on "communal" ownership into a dynamic institution with private ownership and cash rental arrangements.
Stages in the Rice Industry
The rice industry in Eastern Nigeria may be divided into four stages, with a change in ownership of the product usually occurring between each stage. Production through harvesting is the first stage; the other three stages are the main concern of this paper. The second stage includes movement from the farm to processing centers, storage, and processing (parboiling and milling). Although a few individuals have integrated stages one and two (mostly the "stranger" farmer-traders, to be discussed in the next section), the product is invariably sold at the end of stage two. The third stage consists of moving the milled rice from processing areas to urban consumption centers. The fourth stage encompasses wholesaling and retailing in the urban areas.
\ r'
"
MILES 0,===,==40"" ==,,=89
OEW/AJO/FRI/66
RICE MARKETING IN EASTERN NIGERIA 331
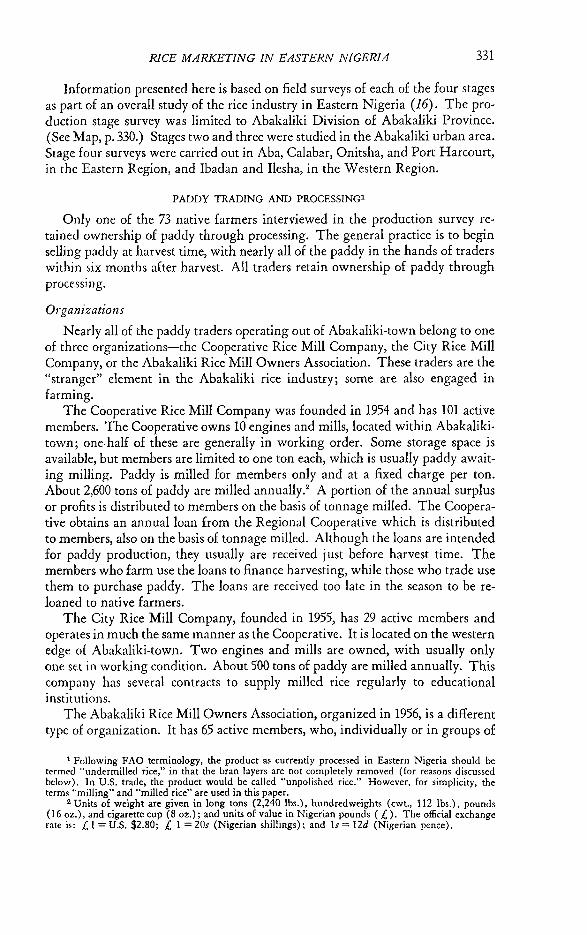
Information presented here is based on field surveys of each of the four stages as part of an overall study of the rice industry in Eastern Nigeria (16). The production stage survey was limited to Abakaliki Division of Abakaliki Province. (See Map, p. 330.) Stages two and three were studied in the Abakaliki urban area. Stage four surveys were carried out in Aba, Calabar, Onitsha, and Port Harcourt, in the Eastern Region, and Ibadan and Ilesha, in the Western Region.
PADDY TRADING AND PROCESSINGl
Only one of the 73 native farmers interviewed in the production survey retained ownership of paddy through processing. The general practice is to begin selling paddy at harvest time, with nearly all of the paddy in the hands of traders within six months after harvest. All traders retain ownership of paddy through processmg.
Organizations
Nearly all of the paddy traders operating out of Abakaliki-town belong to one of three organizations-the Cooperative Rice Mill Company, the City Rice Mill Company, or the Abakaliki Rice Mill Owners Association. These traders are the "stranger" element in the Abakaliki rice industry; some are also engaged in farming.
The Cooperative Rice Mill Company was founded in 1954 and has 101 active members. The Cooperative owns 10 engines and mills, located within Abakalikitown; one-half of these are generally in working order. Some storage space is available, but members are limited to one ton each, which is usually paddy awaiting milling. Paddy is milled for members only and at a fixed charge per ton. About 2,600 tons of paddy are milled annually.2 A portion of the annual surplus or profits is distributed to members on the basis of tonnage milled. The Cooperative obtains an annual loan from the Regional Cooperative which is distributed to members, also on the basis of tonnage milled. Although the loans are intended for paddy production, they usually are received just before harvest time. The members who farm use the loans to finance harvesting, while those who trade use them to purchase paddy. The loans are received too late in the season to be reloaned to native farmers.
The City Rice Mill Company, founded in 1955, has 29 active members and operates in much the same manner as the Cooperative. It is located on the western edge of Abakaliki-town. Two engines and mills are owned, with usually only one set in working condition. About 500 tons of paddy are milled annually. This company has several contracts to supply milled rice regularly to educational institutions.
The Abakaliki Rice Mill Owners Association, organized in 1956, is a different type of organization. It has 65 active members, who, individually or in groups of
1 Following FAO terminology, the product as currently processed in Eastern Nigeria should be termed "undermilled rice," in that the bran layers are not completely removed (for reasons discussed below). In U.S. trade, the product would be called "unpolished rice." However, for simplicity, the terms "milling" and "milled rice" are used in this paper.
2 Units of weight are given in long tons (2,240 Ibs.), hundredweights (cwt., 112 Ibs.), pounds (16 oz.), and cigarette cup (8 oz.); and units of value in Nigerian pounds ( £). The official exchange rate is: £ I = U.S. $2.80; £ 1= 20s (Nigerian shillings); and Is = 12d (Nigerian pence).

332 DELANE E. WELSCH
not more than six, own and operate 144 mills and engines located in an "industrial area" about one mile east of the town proper, but still within its boundaries. Although originally organized to fight health and nuisance complaints by local administrators, the present purposes of this organization appear to be to restrict the hours of milling by its members to four hours per day, six days per week, and to impose minimum milling charges. It has achieved both full membership by all independents and limitation of operating hours through coercion (sometimes violent), but it has failed to maintain minimum charges, particularly in slack seasons. The apparent pressure for imposing regulations arises from the fact that present capacity far exceeds supply; when operations were unrestricted, hulling charges were being driven down to a point where only variable costs were met.
Characteristics of Traders
A random sample was drawn from the list of active members of each of the three organizations. If the person drawn farmed, a farm interview was completed; if he traded in paddy, a paddy trader interview was completed; and if he did both, both schedules were taken.
TABLE I.-ACTIVITIES IN 1963 OF A SAMPLE OF MEMBERS OF THREE ORGANIZATIONS
IN ABAKALIKI-TOWN, AND CHARACTERISTICS OF THOSE WHO TRADED PADDY
Item
Activities:
Number in sample who-Farm only............................. 7 Trade only. . . . . . . . . . . . . . . . . . . . . . . . . . . .. 15 Farm and trade ........................ 3
Total interviewed .................... 25 Total number of active members ........... 101 Per cent of sample who-
Farm only.. ... ............ ...... ...... 28 Trade only. . . . . . . . . . . . . . . . . . . . . . . . . . . .. 60 Farm and trade ........................ 12
Per cent of active members interviewed. . . . .. 25 Home of origin, number of traders:
Onitsha Province-Awka Division .. . . . . . . . . . . . . . . . . . . . . . .. 12 Other Divisions ........................ 6
Umuahia Province-Arochukwu-town ...................... .
Total............................. ... 18 Years in paddy trading:
o to 5 years ........ . . . . . . . . . . . . . . . . . . . . . . 1 6 to 10 years ............................. 6 11 to 15 years . . . . . . . . . . . . . . . . . . . . . . . . . . . . 8 Over 15 years ............................ 3
Average number of years. . . . . . . . . . . . . . .. 12
1 9 4
14 29
7 64 29 48
11
2 13
2 6 5
13
a Cooperative. b City Rice Mill. o Mill Owners Association.
MOAO Total
1 9 6
16 65
6 56 38 25
13
2 15
7 5 3
II
9 33 13 55
195
16 60 24 28
36 6
4 46
1 15 19 11 12

RICE MARKETING IN EASTRRN NIGERIA 333
The first section of Table 1 indicates the distribution of members between activities and the number from each organization who were interviewed. The percentage distribution between "farm only," "trade only," and "both" is valid for the 1963 crop year only. Although several of the largest farmers never trade, and several of the largest traders never farm, most shift from category to category, depending upon their financial resources and availability of land. Negotiations for land for the next season begin before the previous crop is harvested, and by the end of December nearly all of the available paddy land has been placed under contract. Swamps within 15 miles of Abakaliki are often rented two to three years in advance. The cash rent is paid at the time the land is rented. If an individual can rent a swamp on which he thinks he can make a profit and if he has only enough money to farm, he does not trade in paddy that year. If, on the other hand, he can borrow more money, he then tends also to trade in paddy rather than apply the extra capital to the land area he has rented. If he is late in starting negotiations or lacks finance at the time he must pay the rental charge, he may not farm that year but only trade in paddy.
The last two sections of Table 1 indicate important characteristics of the paddy traders. The dominance of people from Awka Division in paddy trading is clearly evident. In addition, people from the same part of the division tend to belong to the same organization. For example, 10 of the 11 persons from Awka Division in the City Rice Mill are from the same village (Enugu-Ukwu). This closeness of social and cultural ties is often evident, as well, in joint ventures among several individuals in farming and trading, usually undertaken for one venture only. The distrustfulness among the traders described by Ottenberg (10) seems to prevent lasting combinations.
The paddy traders have had considerable experience in this occupation; nearly one-fourth have been in the business over 15 years, or almost as long as the rice industry has been a commercial venture in Abakaliki. Only one of the 46 traders interviewed entered the business in the past five years, which has been a period of generally high rice prices and commonly thought to have been one of high profits in paddy trading.
Purchase of Paddy
Table 2 indicates the sources of paddy purchased by the traders. The sources are progressively inclusive; i.e., a person buying rice in Benin also buys in the four other areas. "Abakaliki-town only" refers to Abakpa market, located on the western edge of the town (near the City Rice Mill). This is a small market, and, although a few native farmers bring paddy in by truck, the bulk of the paddy sold there comes by head load or handcart from the surrounding area. "Abakaliki Province only" includes not only Abakpa market but also the many small local village markets and farmers' compounds scattered throughout the province. Ogoja Province is the neighboring province to the east, between Abakaliki and the Cameroons. One-half of the traders interviewed went into the Northern Region for paddy, mostly south of the Benue River (100 miles north of Abakaliki). One trader who ranges as far north as Sokoto (900 miles) usually purchases paddy for several associates on each trip. The frequency of buying at Benin (284 miles) is probably understated. The two traders who went there in 1963 pur-

334 DELANE E. WELSCH
TABLE 2.-BUYING ACTIVITIES OF ABAKALIKI PADDY TRADERS, BY NUMBER
OF TRADERS, 1963
Item COOP" CRMb
Place of purchase: Abakaliki-town only ...................... 4 1 Abakaliki Province only . . . . . . . . . . . . . . . . . . . 3 4 Also Ogoja Province .... . . . . . . . . . . . . . . . . . . 3 Also Northern Region .................... 10 5 Also Benin (Midwest) .................... 1
Purchase directly from farmers: In their compounds. . . . . . . . . . . . . . . . . . . . . .. 12 12 Who bring paddy to Abakaliki-town . . . . . . . . 15 11
Size of purchase per buying trip: Less than one ton . . . . . . . . . . . . . . . . . . . . . . . . . 2 One to three tons .. . . . . . . . . . . . . . . . . . . . . . .. 11 10 Four to six tons. . . . . . . . . . . . . . . . . . . . . . . . . . . 3 3 Seven tons or more .... . . . . . . . . . . . . . . . . . . . 2
Loans to farmers from whom paddy is purchased: Does not loan. . . . . . . . . . . . . . . . . . . . . . . . . . .. 15 Loans at no interest-
Before planting ........................ 1 At harvest ............................. 1
Loans on profit-sharing basis .... . . . . . . . . . . . 1
,. Cooperative. b City Rice Mill. o Mill Owners Association.
8
2 1 2
MOAO Total
5 2 9 4 7 8 23 1 2
9 33 11 37
3 5 9 30 1 7 2 4
12
3
35
6 2 3
chased paddy for groups of traders who banded together to finance each trip. The trips to Benin are made in July and August when the upland paddy in that area is being harvested.
The next section of Table 2 shows the frequency of purchases of paddy at farmers' compounds and from farmers who bring paddy into Abakaliki-town. Over three-fourths of the traders bought in towns; this suggests that farmers' suspicions of collusion on the part of the trader are unfounded. Personal observations in a number of local markets where bidding for paddy was spirited also reinforce the conclusion that collusion does not characterize this trade.
The third section in Table 2 indicates the distribution of average amounts purchased per buying trip. Most of the trucks hired by the traders have a capacity of 75 John Holt bags (7.5 tons).3 The four traders who purchased over seven tons per trip bought either 75 or 150 bags. The five traders purchasing less than one ton per trip bought mostly in Abakpa market or nearby village markets.
The fourth section of Table 2 shows that less than one-fourth of the traders loaned any money at all, and then only to farmers who were subsequently committed to sell their paddy to the lender. The two traders who said that they loan at harvest time may in fact only make down payments on paddy already purchased. The two profit-sharing arrangements required that the amount of the
8 The John Holt Co., Ltd., an import-export firm, sells a sisal bag which, when filled with rough rice firmly packed, holds about two cwt. (224 Ibs.). (Confirmed by repeated weighings at the Coop and at the Norwegian Church Agricultural Project (NORCAP) in Ikwo, southern Abakaliki Division.)

RICE MARKETING IN EASTERN NIGERIA 335
loan first be repaid from the proceeds of sale of the paddy (to the trader making the loan), and the remainder be divided equally between borrower and lender. In no instances did traders loan money to farmers from whom they did not buy paddy. Traders may have a clientele of farmers from whom they purchase paddy regularly every year, especially when purchases are made at the compound, but this could not be documented.
Transport
The cost of transporting paddy is given in Table 3. Costs decline steadily as distance increases from 5 miles to 200 miles. Too few observations were available to generalize on longer hauls. The higher rate for the Benin trip reflects both
TABLE 3.-COST OF TRANSPORTING PADDY BY TRUCK TO ABAKALIKI-TOWN, 1963
Distance in miles
5-12 ......................... . 18-45 ........................ . 72-120 ....................... . 150-200 ...................... . 284 (from Benin) ............. . 500 .......................... . 900 (from Sokoto) ............ .
Pence per ton-mile
15 8 5 4 5 3 5.3
Number of observations
2 17 29
6 3 1 1
ferry charges across the Niger and a strong transport union which requires that loads be transferred from one truck to another at Onitsha. (This will be discussed more fully in a later section.) The Sakata trip probably also involves ferry charges and possibly similar union problems.
None of the traders owned trucks. Only three or four of the 46 interviewed owned an automobile. Buying trips within 30 miles of Abakaliki-town are made on bicycles or by truck. They may charter a truck if they have purchased a full load from several farmers directly in their compounds. The more general practice, however, is for several trucks to appear at each of the village markets on market day. Most of the paddy sold in these markets is in 50- to 60-pound baskets. The trader buys the paddy, places it in bags which he has brought with him, and arranges for a trucker to deliver it to his compound in Abakaliki-town. Transport charges vary from day to day at the same market, depending upon the number of trucks that arrive. (Most markets are held every four days, but some of the small ones are eight-day markets.) Cost of transporting paddy by hand pushcart within Abakaliki-town is much higher and averages about seven shillings per ton-mile.
Storage
In the Abakaliki area, rice is stored exclusively in the form of unparboiled paddy. It is one of the few crops that can be stored safely with simple practices in the tropics, for the tightness and thickness of the glumes keep it free from insect and weevil damage. If the paddy is adequately dried soon after threshing

336 DELANE E. WELSCH
TABLE 4.-NuMBER WHO REGULARLY STORE PADDY, LENGTH OF TIME STORED, AND
HIGI-IEST TONNAGE STORED, ABAKALIKI PADDY TRADERS, 1963
Item coopa CRMb MOAo Total
Number who stored paddy ............. 5 8 6 19 Average storage period (months) ....... 6 5 6 6 Highest tonnage stored ................ 11.6 13.2 15.2 13.4
a Cooperative. b City Rice Mill. o Mill Owners Association.
and kept in a dry, rodent-free place, it can be stored safely for up to one year without loss in germination, and for longer periods for consumption. After milling, or even after parboiling, it is subject to damage much the same as maize and beans.
Of the 46 traders interviewed, all stored paddy for periods of up to one month, and 19 regularly held it longer (Table 4). Storage in vol ves speculation as well as creation of time utility. Paddy is purchased when prices are low, usually after harvest in November and December, and it is stored for an average of six months. Prices for milled rice usually are highest from June until November, with a slight decline when upland paddy from the Western and Midwestern Regions enters the market in August. The periods of low and high prices vary from year to year.4 The average peak tonnage stored per trader was 13.4 tons, valued at from £300 to £400, indicating that only traders with adequate financing engage in this practice.
As mentioned previously, most milling facilities have some storage space available, but this is reserved for parboiled paddy awaiting milling. Traders store unparboiled paddy in their compounds. They may keep it at an old house, but it is more usual for one or more rooms of the house in which they live to be filled with bags of paddy. Farmers store paddy in the same way. On the basis of several observations of storage space rented for a very short period of time, the cost of building a dwelling, and the rental value of the dwelling for living, the annual return to capital invested in storage appears to be less than 6 per cent. Adequate data were not available from which to draw conclusions about the magnitude of seasonal price variations and therefore the gains from the creation of time utility. Such gains would, however, include returns to storage, to capital, and to risk.
Finance
Paddy" traders were reluctant to discuss their sources of finance. They do not appear to use commercial sources (except for cooperative members) or moneylenders, but instead rely heavily on friends and relatives. No instances were reported of borrowing from the rice wholesalers who purchase the milled rice.
Parboiling
All of the paddy processed in Abakaliki is parboiled before milling. Although method and timing vary among operators and perhaps among batches by the
4 In July 1963, prices dropped from 25 to 50 per cent, probably because of an earlier underestimation of paddy supplies by speculators. This opinion is based on some evidence of an increase in the number of farmers who stored paddy. This break brought Abakaliki rice prices into adjustment with the world rice market.

RICP; MARKETING IN EASTERN NIGERIA 337
same operator, the general process is as follows. Old oil barrels are cut in half and placed on several small rocks, leaving space for fire underneath. The barrels are filled with paddy and cold water. After 30 minutes of soaking, a fire is started and the water is brought to a boil. The fire is then extinguished, or in cool weather reduced in size, the barrels are covered with old sacks, and the paddy is allowed to soak in the hot water the rest of the day and night. The next morning the water is drained and a small amount of fresh water added; the paddy is steamed for one-half hour, then drained and placed on mats to dry in the sun.
The parboiling process is desirable in that much of the vitamin and part of the protein content of the paddy are retained in the milled rice (5, p. 336). Also the percentage of whole grains after milling is increased (1,2,3,11,12). Undesirable results from the present method are discoloring of milled rice as a result of using dirty water, and contamination of the paddy with soil, rocks, and goat dung, as a result of the drying on mats.
Parboiling costs during the survey period were estimated at 35s per ton of paddy, which is equal to 58s per ton of milled rice for wood and water only.5 Practices varied from the use of all-hired labor to all-family labor. When hired labor is used, costs per laborer are £1 per month plus food, clothing, and housing. The traders asserted that parboiling was one of their biggest problems, and complained of rising wood and water prices and of the strenuous labor required. Several were hospitalized recently with back trouble and advised to stop doing the work of parboiling. It appears that any sizable increases in volume will have to be accompanied by mechanization of the parboiling process.
Milling
The mills currently in use are mostly Lewis Grant mills, known locally as "planter's mills," which were first introduced in the late 1940's. They have a capacity of about 500 pounds of paddy per hour, and are powered by a 10- to 15-horsepower diesel engine. These mills are horizontal hullers combining hulling and whitening in one operation. The cleaning-polishing part of the machines is not maintained, and as a result the milled rice is not polished. The broken rice is mixed with bran and hulls, and their disposal is quite a problem. Some of it is spread on nearby rice fields, but it decomposes slowly. Burning is difficult, due both to rain and to close proximity to the mill buildings. None is sold or fed.
Costs and returns for a typical unit of one machine owned and operated by one man are shown in Table 5. Costs are based on those incurred during one year's operation, following the four-hours-per-day, five-days-per-week regulations of the Abakaliki Rice Mill Owners Association. Revenue is based on the average hulling charge of 38s per ton of paddy (from the paddy trader's survey). Charges range from 24s during slack times to 48s during the rush season.
The two greatest problems associated with present processing methods are excess capacity and low quality. The Abakaliki Rice Mill Owners Association is able to restrict milling to four hours per day, six days per week (24 hours per week)
fi This is based on the 60 per cent conversion factor that is used throughout this paper, and in the 1963 FAO Rice Report (4, p. 45). A more recent FAO publication gives a rate of 70 per cent, which seems high in view of the fact that the mills in Eastern Nigeria are poorly adjusted so that milling loss of broken kernels is high.

338 DELANE E. WELSCH
TABLE 5.-ANNUAL COSTS AND RETURNS FOR A PADDY PROCESSING FIRM IN
ABAKALIKI INDUSTRIAL AREA'"
Item Basis Amount (l.)
Revenuea ................. 250 tons paddy processed 475
Fixed costs: Depreciation ............ £500 over 5 years ..................... 100 Interest. . . . . . . . . . . . . . . .. £250 at 4 per cent . . . . . . . . . . . . . . . . . . . . . 10 Rent ................... £5 per month.. .. . .. . .. . ........ .. ... . 60 Miscellaneous ........... £ 3 per month . . . . . . . . . . . . . . . . . . . . . . . . . 36
Total fixed costs. . . . . . . . . . . . . . . . . . . . . . . . . . . . . . . . . . . . . . . . . . . . . . 206
Variable costs: Repair and maintenance .. 5 per cent of £500 . . . . . . . . . . . . . . . . . . . . . 25 Labor .................. £5 per month....... ............. . .... 60 Petrol .................. £0.5 per day, 250 days ............. . . . . 125 Oil .................... £0.75 per month................... ... 9
Total variable costs ........................................... 219
Total costs .. . . . . . . . . . . . . . . . . . . . . . . . . . . . . . . . . . . . . . . . . . . . . . . . . . . . . . 425
Net returns .............. To operator's labor, management, and risk 50
* Data from personal correspondence with W. O. Achukwu, Agricultural Engineer, Ministry of Agriculture, Research and Demonstration Farm, Abakaliki.
a Calculated as follows:
Milling rate: Paddy Pounds per hour ................................. 560 Tons per year at 250 four-hour days ... . . . . . . . . . . . . . . . 250
Hulling charge ([. per ton) •..........................• 1.9 Gross annual receipts ([.) ............................. 475
Milled 336 150
3.17 475
on about 92 per cent of the milling machines in Abakaliki. The Cooperative and the City Rice Mill set their own working hours, and even during slack seasons they normally mill rice from 48 to 72 hours per week. A reasonable criteria of "full" capacity of the present mills, at least during peak seasons, would be aroundthe-clock operations, since labor is plentiful and capital is scarce. This could easily be carried out with four operating periods per day of five hours each, with a one-hour shutdown for maintenance. By this criterion, present mills are operating at about 20 per cent of full capacity, with consequent low net returns to the operators. The Mill Owners Association has not been able to enforce minimum hulling charges, and during slack times charges are driven down to the point where in extreme cases only variable costs are covered. It is certain that mill owners are incurring capital losses in an expanding industry as a result of this excess capacity; yet the capacity is available for further expansion in production. Perhaps the capacity has been installed in anticipation of such expansion. It is also of interest to development planners that this overinvestment has been made entirely by the private sector from private sources of capital. By contrast, the Northern Region of Nigeria produces four times as much rice but has only twothirds as many mills, all of which were financed by government loans.
With respect to quality, one consequence of low returns to operators is general deterioration in physical condition of the mills, resulting in a poor job of milling. Although failure to adjust the mill properly results in more broken rice, this same
RICE MARKETING IN EASTERN NIGERIA 339
failure also results in a product that is not highly polished and therefore more nutritious. Foreign matter incorporated in the rice when it is dried after parboiling causes further damage to the mills during hulling.
MOVEMENT TO CONSUMPTION CENTERS
Milled rice is invariably sold on the day it is milled. Freshly milled rice is placed on mats in front of the mill buildings or, in case of rainy weather, inside the buildings. No instances of paddy traders either transporting milled rice to consumption centers or storing it were reported. These functions are performed by individuals known locally as "big rice buyers."
Characteristics of Buyers
In general, a rice buyer lives in the market area to which he takes the rice. No list of buyers was available from which to draw a sample. Therefore, every buyer entering the main processing area in Abakaliki during the first two weeks of December 1963 was approached. One-third of them refused to be interviewed, perhaps because an intense tax drive was being conducted by the civil authorities during that period, perhaps because they were in a hurry to be about their buying business or to get back to their homes before the rice arrived. Too, since all transactions were in cash, they may have been reluctant to talk to strangers while carrying from £50 to £250 on their person. In addition, this group claims to have lost heavily during the mid-1963 price break, and they may have been overly suspicious of anyone inquiring about their business.
Due to these respondent difficulties, the data collected must be interpreted with caution, although they represent the only empirical information on distribution practices, and provide estimates of costs at various steps and some insight into how this stage is performing in relation to other stages. The major weakness is that the comparability of behavior of the 86 respondents with that of the 43 non-respondents is not known.
Several characteristics of the buyers interviewed are shown in Table 6. Most buyers who said they made two or more trips per month appeared a second time during the interviewing period. They were not interviewed again. The selection procedure did not permit estimation of the number of buyers who make less than two trips per month.
The Lagos buyers tended to handle much larger volumes than buyers from other areas. Both wholesalers and retailers purchased rice at the mills. Nearly one-fourth of the 86 respondents sold rice at retail only. One-third sold at both wholesale and retail levels. Both wholesalers and retailers tended to specialize in rice (56 of the 86). If they handled another food product, it was generally beans (19 of the 30 non-specialists). Most bought rice in Abakaliki only (52 of the 86). Half of those who also bought elsewhere did so in the Northern Region (18 of the 34). Ten buyers also bought in their home market, reflecting the tendency for Eastern Nigeria retailers to obtain most of their rice from wholesalers in their home market, and only traveled to Abakaliki occasionally. About one-half of the wholesalers had been in business less than five years, and very few over ten years.
Data on finance were difficult to obtain. Between one-fourth and one-half of the wholesalers borrowed money for each buying trip. They almost always bor-

340 DELANE E. WELSCH
TABLE 6.-DESTINATION OF RICE PURCHASED IN THE ABAKALIKI INDUSTRIAL AREA TRIP CHARACTERISTICS, AND TRANSPORT COSTS FOR 86 BUYERS, DECEMBER 1963 '
Average Road Transportation cost Number mileage of respon- Tons per Trips per to desti- Per ton Per ton-
Destination dents trip month nation (£ s d) mile (d)
Lagos ......... 20 6.1 2.2 529 4 14 7 2.1 Onitsha ........ 16 3.0 3.2 119 1 4- 2.4 Aba ........... 14 3.2 2.8 185 1 16 2 2.3 Port Harcourt .. 7 3.3 2.3 243 2 6- 2.3 Enugu ......... 6 1.3 2.7 52 o 14 4 3.3 Umuahia ...... 6 3.1 2.5 147 1 10 6 2.5 Owerri ........ 5 2.6 1.3 184 2 2 11 2.8 Mbaise ........ 3 2.5 1.0 165 2 2 11 3.1 Calabar ........ 2 2.4 2.0 a
Ibadan " ....... 2 2.4 2.0 440 5 2 2.8 Uyo 1 2.2 b 198 ........... Yahe .......... 1 1.0 1.0 70 Obubra ........ 1 0.25 1.0 30 Mamfe ........ 1 0.8 1.0 131 LagosO ......... 1 529
a No road (moved by canoe on Cross River). b Two times per year but buys at Aba two times per month. o This firm, a partnership of three brothers, is based in Abakaiiki and ships rice exclusively to
Lagos. The firm owns and operates a mill, buys rice after milling, transports it as far as Onitsha in its own truck, and uses hired transport from Onitsha to Lagos. Although this firm handled 13 per cent of the volume in the sample, it probably handles 3 to 4 per cent of total actual volume. It is the largest firm in this stage.
rowed from a friend or relative at no interest. If they did have to borrow from other than a friend or relative, it was generally from a moneylender and at an interest charge of 25 per cent per week. It is obvious that such sources would be used only when high profits are expected. The money, regardless of source, was deposited in the trader's bank (at his home), which then wired the money to the bank in Abakaliki. The buyers claimed the money at the bank in Abakaliki upon arrival and went directly to the processing area to buy. All transactions at Abakaliki are cash only, but most transactions with retailers at destination were on credit. The wholesaler generally advanced the retailer £10 to £15 worth of rice and received payment after the retailer had sold the rice.
Costs and Margins
Transportation charges are shown in the last two columns of Table 6. They are surprisingly low compared with generally accepted estimates of costs of providing transport, and the charges show no regular tendency to decline as distance increases. The International Bank for Reconstruction and Development survey mission (1953) reported freight rates ranging from 5d to 7d per ton-mile, with some rates in the vicinity of Lagos and Ibadan at 4d (6, p. 493). Meyer et al. report total costs of providing truck transport on good, hard-surfaced roads in the United States ranging from 4.8 to 7.3 cents--4d to 6d per ton-mile for comparable distances and weight of shipment (9, p. 157). Personal discussions with transport owners in the Enugu area indicated that 6d per ton-mile was a normal charge for long hauls for ordinary freight.

RICE MARKETING IN EASTERN NIGERIA 341
TABLE 7.-COST OF MILLED RICE AT MILLS IN THE ABAKALIKI INDUSTRIAL AREA AND DELIVERED TO DESTINATION, SELLING PRICE, MARGIN, AND AVERAGE
SIZE OF SALE FOR 63 WHOLESALERS, DECEMBER 1963 ( £ per ton, except as otherwise indicated)
Number of Cost Selling Average Destination respondents At mill Delivereda price Margin (lbs.)
Lagos ........... 20 37.0 41.8 45.4 3.6 830 Onitsha ......... 15 37.0 38.2 40.0 1.8 980 Aba •••••• 0 ••••• 14 36.6 38.4 40.8 2.4 680 Port Harcourt ... 6 37.0 39.3 40.7 1.4 740 Enugu ••• 0 ••• 0 •• 1 38.0 38.7 40.0 1.3 1,080 Umuahia ......... 5 36.8 38.4 40.2 1.8 460 Ibadan .......... 2 37.5 42.6 51.0 8.4 385
a Cost at the mill in the Abakaliki industrial area, plus transport to the indicated destination as given in Table 6.
All rice going to Lagos is hauled first to Onitsha where it is transferred to another truck for the remainder of the trip. Labor cost for transferring the rice from the first truck to the second was from 2s to 4s per ton. The Lagos buyers explained that a strong transport union exists for the Lagos-Onitsha run. This union forbids any through-hauls from Abakaliki to Lagos. However, the charge for transporting rice from Onitsha to Lagos is very low, probably because rice is a back-haul cargo for trucks which bring imported goods from Lagos to the Onitsha market.
The most reliable data obtained were on costs of rice at the mill, transportation, and selling price. Within categories by destination, costs at mill varied little (Table 7). Variation among destinations in cost at mill may reflect quality differences related to different consumer preferences. Cost of transport from Table 6 was added to cost at mill to obtain the cost-delivered figures in Table 7. Selling price, margin, and size of sale at destination are not reliable for Enugu and Ibadan, due to the small number of observations. The Onitsha wholesalers tend to sell to retailers from Ibadan and other Western Region markets. Their margin is lower, but they make more trips per month.
WHOLESALE AND RETAIL TRADE IN URBAN AREAS
The survey of this stage was carried out in six large retail market areas: Aba, Calabar, Onitsha, and Port Harcourt, in the Eastern Region, and Ibadan and Ilesha, in the Western Region. lbadan included four, Ilesha and Port Harcourt three, and Aba two, sub-markets. The markets to be studied were selected on the basis of their importance as indicated by pretesting of the distribution stage survey questionnaire, availability of interviewers from these important areas, and research budget limitations. Six markets as shown in Table 8 and nine interviewers (two each in Ibadan, Onitsha, and Aba) were selected. Although Lagos is probably the largest rice market in Nigeria, it was not surveyed due to personnel and budget limitations. The surveys were conducted during the week of December 15,1963.

342 DELANE E. WELSCH
TABLE 8.-RETAIL MARKET AREAS SURVEYED, SIZE OF SAMPLE, AND DISTRIBUTION AMONG TYPES OF SELLERS, DECEMBER 1963
(Number of rice sellers")
Sample surveyed
Retail Retail and Wholesale Market Total Total only Wholesale only
Eastern Region: Aba ....................... 170 160 75 78 7 Calabar ................... 69 69 38 28 3 Onitsha ••• 0 ••••••••••••••• 321 155 11 106 38 Port Harcourt ............. 262 73 50 18 5
Total ................... 822 457 174 230 53
Western Region: Ibadan .................... 120 105 103 0 2 Ilesha ..................... 335 71 58 0 13
Total ................... 455 176 161 0 15
Total, both Regions .......... 1,277 633 335 230 68
a The "wholesale only" category includes only sellers who maintain a permanent stall in the marketplace. See text for additional qualifications.
The Sample
Sizes of universes and samples for each market are shown in the first part of Table 8. The procedure followed in each market was first to prepare a numbered list of all rice sellers in the market. Each interviewer aimed for a total of 60 to 80 interviews. If there were 180 rice sellers in a market and 60 interviews were intended, for example, then every third seller on the prepared list was approached. In Aba, Calabar, and Ibadan all sellers were approached. The differences in Table 8 between total and sample for these three markets indicate nonresponses. One-half of the sellers in Onitsha were interviewed, and about one-fourth in Port Harcourt and Ilesha. Variation between sub-markets, in areas where they occurred (Ibadan, Ilesha, Aba, and Port Harcourt), was small enough that the data are presented by general market area only.
Types of Selling Activities
Three levels of selling activities were found. In all of the markets surveyed, one group sold rice at the retail level only and a second group sold at the wholesale level only. In the relatively "younger" rice trade in the Eastern Region, a third group was present which sold rice at both levels. Why this third type of seller is present in the East but not in the West is not clear, but several possible reasons are given in Appendix I. Economic, social, and institutional characteristics bearing on selling activities are also discussed in Appendix I.
Distribution of interviewees among the three categories is shown in Table 8. There is considerable variation in the Eastern Region markets in the proportion in each category.
The number engaged in wholesale activities only should be interpreted carefully, as it does not represent all of the wholesalers supplying that market area.
RICE MARKETING IN EASTERN NIGERIA 343
First, it is only the number that maintain a permanent stall in the marketplace. Some of the "big rice buyers" discussed in a previous section (and described in Table 6) do not maintain a stall, but instead book orders in advance or dispose of their stocks directly from a truck. Second, Onitsha serves as a depot, and its wholesalers and wholesaler-retailers supply rice to the Western and Midwestern Region markets, as well as to other markets. Third, after the surveys were carried out it was discovered that in Ibadan and Port Harcourt some large wholesalers maintained offices away from the marketplace. Follow-up interviews in Ibadan could not be made, and it is not known whether these firms were contacted during the stage three surveyor not.
Volumes
Frequency of purchases and average sizes and prices of purchases and sales are shown in Table 9. Volume and frequency of purchase refer to the "usual" size or frequency, while prices refer to the week of December 15, 1963, when the survey was carried out. Where amounts purchased are shown in both head pans and long tons, the purchase was usually in headpans.
A verage purchases by rice sellers in the two Western markets were noticeably smaller than in the Eastern markets. Sellers at Calabar and the two Western markets tended to buy less often than sellers in the other three markets. There were no consistent differences in frequency of purchase among categories of sellers within a market.
MARKETING MARGINS
The data in Table 10 show the portion of consumer expenditures on milled rice that accrues to each stage of the industry for one specific market channel. The data were obtained in the December 1963 surveys, with Abakaliki Division as the point of origin (production) of the paddy and the Port Harcourt retail market as the point of final sale of milled rice to consumers. This market was chosen to measure retail margins because the small amount of rice that is imported (mostly from the United States) enters Nigeria either through Lagos or Port Harcourt. Thus, in these two markets domestically produced rice is particularly under pressure to stay competitive with the world rice market. In December 1963, prices in Port Harcourt were in adjustment with world rice prices (16, p. 179).
Producers received 54 per cent of consumer rice expenditures. The major part of this accrues to farmer and family labor. The trading-processing stage received 12 per cent of consumer expenditure on milled rice. Parboiling cash costs were nearly as high as milling costs. The margin, 1.4 per cent of consumer expenditure or 12 per cent of the total accruing to the trading-processing stage, includes both the return to labor and profit. Movement of the milled rice from processing area to urban consumption area and wholesaling activities required less than 6 per cent of final expenditure. Of this amount, 4 per cent went directly into transporting the rice, leaving less than 2 per cent to cover profit, return on capital, and operating costs of the trader.
Of the three post-production stages in the industry, retailing took by far the greatest share of consumer expenditure, 28.2 per cent. In Table 10 this item is not

344 DELANE E. WELSCH
TABLE 9.-AVERAGE SIZE OF PURCHASE AND SALE, USUAL FREQUENCY OF PURCHASES,
AND PRICES PAID AND RECEIVED FOR RICE DURING THE WEEK OF DECEMBER
15, 1963, BY THREE CATEGORIES OF RICE SELLERS IN SIX EASTERN
AND WESTERN NIGERIA URBAN AREA MARKETS""
Item Wholesale
only
Aba
Retail only
Wholesale and
retail
Calabar
Wholesale Retail only only
AVERAGE SIZE OF TRANSACTIONS, AND 1963 MID-DECEMBER PRICES Purchases:
Size-Headpansa ............ 17.60 Tons ................. 1.6 3.2 2.4 0.44
Price-£ per ton ., ........... 37.2 37.9 38.00
Sales: Size-
Headpansa ............ Cigarette cupsa ......... 3
Price-d per cupa ............ 3
USUAL FREQUENCY OF PURCHASE (per cent of total sellers) Per month:
Over twice ............ 29 28 5 0 3 Twice ., ............. , 57 51 46 75 27 Once .0 ..••.•..•.•.••• 14 17 39 0 59 Less frequent .......... 0 4 10 25 11
Port Harcourt Onitsha Ilesha
Whole- Whole-Whole- Re- sale Whole- Re- sale Whole- Re-
sale tail and sale tail and sale tail Item only only retail only only retail only only
AVERAGE SIZE OF TRANSACTIONS, AND 1963 MID-DECEMBER PRICES Purchases:
Size-Headpansa 25.30 18.00 9.50 Tons ....... 2.5 0.63 2.9 3.3 0.45 3.6 1.0 0.24
Price-£ per ton ... 38.7 40.20 37.5 36.0 40.00 39.2 36.0 42.40
Sales: Size-
Headpansa 11 2.5 Cig. cupsa 12 12 few 4
Price-d per cupa .. 3 3 5
USUAL FREQUENCY OF PURCHASE (per cent of total sellers) Per month:
Over twice 40 9 0 0 60 17 8 16 Twice ........ 40 33 35 55 20 42 31 27 Once ........• 20 52 60 45 20 35 38 36 Less freq uen t .• 0 6 5 0 0 6 23 21
.. Dots ( •.• ) indicate that data could not be obtained or were judged to be unreliable. for total number of sellers.
Wholesale and retail
1.6
36.7
8.5 50.0
0 8
50 42
Ibadan
Re-tail
only
8.30 0.21
51.80
6.0
5.3
11 15 49 25
See Table 8
a Volume measures; approximate weights are 56 pounds per headpan (40 head pans equal one long ton) and 8 ounces per cigarette cup.

RICE MARKETING IN EASTERN NIGERIA 345
TABLE 10.-VALUE AND PER CENT OF CONSUMER EXPENDITURE ON MILLED RICE IN
PORT HARCOURT THAT ACCRUES TO EACH OPERATION AND STAGE IN
THE ABAKALIKI RICE INDUSTRY, DECEMBER 1963
Item
Production: Land .................... . Seed .................... . Labor ................... .
Trading-processing: Parboiling ............... . Milling .................. . Margin .................. .
Distribution: Transportation ........... . Margin .................. .
Retailing:
Value penon (£) Byoperation Totals
1.97 2.56
25.57
2.9 3.2
.8
2.3 .9
30.1 a
6.9
3.2
Margin. . . . . . . . . . . . . . . . . . . 15.8 15.8 56.0b Totals ............... .
a Equal to £ 18 per ton for paddy. b Equal to 3d per cigarette cup of miIIed rice.
Per cent Byoperation Totals
3.5 4.6
45.7
5.2 5.7 1.4
4.1 1.6
28.2
53.8
12.3
5.7
28.2 100.0
divided into stall rental, market association fees, labor costs, and profit, because the data collected did not permit such a breakdown. Even with a 28.2 per cent margin, the free entry and consequent large number of retailers keep individual volumes so low that the net income of the retailers suffers accordingly.
No data are available on other West African rice producing countries with which to compare the margins reported in Table 10. For the Philippines, Mangahas (8) has compared the mean farm price with the mean retail price for the nine regions. The data were for 1957-63 and were collected by the Central Bank of the Philippines. In peak harvest months the farm price ranged from 49 to 77 per cent of retail price, with the average for all regions of 66 per cent. Thuroczy (14) has reported the distribution of the retail dollar for medium grain rice in the United States for two time periods. For 1948-50 the distribution in percentages was: farmers, 39; mill margin, 11; packaging, 9; transportation, 5; and local wholesaling and retailing, 36. For 1956-58 the distribution in percentages was: farmers, 43; mill margin, 8; packaging, 14; transportation, 6; and local wholesaling and retailing, 29. The main differences in distribution of the retail dollar between the United States in 1956-58 and Eastern Nigeria in 1963 appear to be that in the U.S. the farmer gets 11 cents less and the mill gets 4 cents less, but 14 cents are spent on packaging, a cost not incurred in Nigeria.
SUMMARY AND CONCLUSIONS
The distribution of rice produced in Eastern Nigeria is carried out by many individuals, each operating independently and on a small scale. Free entry and

346 DELANE E. WELSCH
exit characterize the wholesaling and retailing stages of the industry, but there is very little entry into paddy trading and processing. This may be due to the amount of capital required to hold stocks for speculative purposes, or the clannishness of the present traders. Present excess capacity certainly discourages entry into processing.
Nearly all of the working capital in rice distribution is from private sources. A very small amount is provided by government because a few vertically integrated firms divert production loans into paddy trading. Furthermore, very little of this working capital is provided by commercial banks. It comes mostly from relatives, accumulated profits, and cash hoards. Commercial banks are used only to transfer funds from points of final sale back to the processing areas.
Investment capital has come from two sources. The infrastructure or social overhead capital has been furnished by government, primarily in the form of roads for movement of milled rice to consumption centers. Local council development of dry-season roads into producing areas has also aided the movement from farm to processing. Very little benefit has come from market construction in urban areas, for food retailers rarely use the new stalls, which are most often occupied by sellers of clothing and other manufactured goods.
Two other major areas of investment have affected rice distribution: one direct, in rice mills; the other indirect, in the form of trucks. Both of these have been entirely from private sources, and both are characterized by heavy overinvestment. By contrast, the Northern Region produces three times as much rice and has two-thirds as many mills as the East, and all Northern mills were financed by government loans.
The rice marketing system appears to be sensitive to prices. In the early 1960's rice prices rose steadily until a sharp break in mid-1963. This break brought wholesale prices back into adjustment with the world rice market. This adjustment was brought about and carried out without governmental intervention.
The present structure has expanded more rapidly than production. Its expansion was aided by increased urbanization, by road building by the government, and by added private investment in trucks to move rice to the increasing markets. The processing stage appears to be capable of keeping pace with further increases in production, which could probably expand fourfold without encountering processing restrictions. An indication of the ability of the marketing system to expand is in the quantity of rice produced in other regions that flows through the rice processing and wholesaling channels in the Eastern Region, and moves on to consumption in other regions (see Tables 2 and 6).
However, the present distributional setup has not encouraged quality improvement; the average consumer is not yet willing to pay the 10-20 per cent premium for high-quality imported rice. Possibly when such demand does arise quality improvements will be forthcoming from within the system. Research into processing methods to promote improved quality, particularly in parboiling (where most of the foreign matter enters the product), is badly needed.
The stage in rice marketing which takes the biggest margin and which may be the bottleneck in bringing about quality improvement is retailing. A separate retail organization did not come about with the advent of rice production in Eastern Nigeria as did the trading-processing and, in part, the wholesaling stage.

RICE MARKETING IN EASTERN NIGERIA 347
Instead, rice was incorporated into the existing food retailing setup. Over 80 per cent of the retailers interviewed also carried other food products, usually beans. Initially, domestically produced rice merely replaced imports. Increased urbanization and rising numbers of salaried workers increased the demand for foods other than the root crops which are the traditional staple foods, and rice production and commercial sales have increased rapidly in response to this rising demand. Since rice imported in bulk fits into this same retailing system quite well, the industry is kept in adjustment with the world rice market, and consumer demands for certain grades and qualities are easily met.
CITATIONS
1 W. O. Achukwu, "Processing of Rice" (Ministry of Agriculture, Research and Demonstration Farm, Abakaliki, n.d.), mimeo.
2 ---, "Speculative Considerations on Grain Handling and Processing with Special Emphasis on Rice and Maize" (Ministry of Agriculture, Research and Demonstration Farm, Abakaliki, n.d.), mimeo.
3 R. G. Crauford, Breakage of Rice During Milling (West African Rice Research Station, Periodic Scientific Report No. 11, Rokupr, Sierra Leone, September 1960).
4 Food and Agriculture Organization of the United Nations, FAO Rice Report 1963 (Rome, 1963).
4a --, The World Rice Economy in Figures 1909/1963 (Commodity Reference Series No.3, Rome, May 1965).
5 D. H. Grist, Rice (3rd ed., London, 1959). 6 International Bank for Reconstruction and Development, The Economic Devel
opment of Nigeria (Baltimore, 1955). 7 B. F. Johnston, The Staple Food Economies of Western Tropical Africa (Stan
ford, 1958). 8 Mahar Mangahas, "The Response of Philippine Rice Farmers to Price," unpub
lished Master's thesis, Department of Economics, University of the Philippines, 1965. 9 J. R. Meyer, M. J. Peck, J. Stenason, and C. Zwick, The Economics of Competi
tion in the Transportation Industries (Cambridge, 1959). 10 Simon Ottenberg, "Ibo Receptivity to Change," in W. R. Bascom and Melville
Herskovits, eds., Continuity and Change in African Cultures (Chicago, 1959). 11 J. A. F. M. Sluyters, "Milling Studies on Parboiled Rice in Nigeria," Tropical
Agriculture, Vol. 40, No.2, April 1963. 12 ---, "Some Information About Local Rice Mills and the Rice (Oryza sativa
L.) Produced in a Part of the Bida Division, Northern Nigeria," Netherlands Journal of Agricultural Science, Vol. 10, No.4, November 1962.
13 I. G. Stewart, R. C. Ogley, and W. D. C. Wright, Nigeria: Determinants of Projected Level of Demand, Supply, and Imports of Farm Products in 1965 and 1975 (U.S. Dept. of Agr., ERS-Foreign 32, Washington, D.C., 1962).
14 N. M. Thuroczy, Marketing Margins for Medium-Grain Rice (U.S. Dept. of Agr., Marketing Research Report No. 444, Washington, D.C., 1960).
15 Peter Von Blanckenburg, "Rice Farming in the Abakaliki Area," Preliminary R~port, Nigerian Institute of Social and Economic Research (Ibadan, October 1962), mlmeo.
16 D. E. Welsch, "The Rice Industry in the Abakaliki Area of Eastern Nigeria, 1964," unpublished Ph.D. thesis, Michigan State University, 1964.
17 ---, "Response to Economic Incentive by Abakaliki Rice Farmers in Eastern Nigeria," Journal of Farm Economics, Vol. 47, No.4, November 1965.

34H DELANE E. WELSCH
APPENDIX I
ADDITIONAL CHARACTERISTICS OF RICE SELLERS IN MARKETS SURVEYED
Three Kinds of Sellers
The presence of three distinct kinds of rice sellers was discussed in the main body of this paper and shown in Table 8. One of the categories, in which both wholesale and retail activities were engaged in by the same person or firm, is present in the relatively "younger" rice markets in the Eastern Region but not in the "older" rice marketing system in the West and Midwest. Several plausible hypotheses may be offered as to why this is so. One is that it may be due to differences between the Yoruba (West) and the Ibo (East) people. Ibo traders tend to be small- or medium-sized operators, while Y oruba traders are usually either very large or very small operators. A second is that the difference may be due to the generally larger size of Y oruba towns, which have a large population of farmers whose wives are willing to trade on a small scale at retail at a low profit. A third is that, since the Eastern rice trade is relatively new, combination wholesaler-retailers may be a transitional form of trader and may eventually become larger and engage in wholesaling only. The difference is not due to distance from producing-milling areas, for Ibadan and Ilesha are nearly as close to Northern Region sources as the Eastern markets are to Abakaliki.
Other Characteristics
Various other characteristics of traders are shown in Appendix Table 1. Considerable variation between markets and between regions is evident. Men dominate wholesaling and represent nearly one-half of the retailers in the East, whereas nearly all of the rice-selling activities in the West are carried out by women. The combination wholesaler-retailers in the East are also mostly men.
In the next section of Appendix Table I, "big rice buyer" refers to the persons described previously. Retailers in the two western markets relied almost entirely on big rice buyers for rice. "Trader at mills," for Calabar, Port Harcourt, and Aba, refers to rice sellers who traveled to Abakaliki to purchase rice as many Easterners did. For Onitsha it may include small local mills in nearby small ricegrowing areas of the Midwestern, Northern, and Eastern Regions. Purchases from farmers by Onitsha and Ilesha rice sellers also reflect this nearness to small producing areas. "Local market middleman" means a person-usually in the wholesale or wholesale-retail category-operating in the local market, who purchases rice from the big rice buyers and then resells smaller lots at wholesale. The number in this category at Onitsha is striking, for this usually indicates four changes of ownership of rice within the Onitsha market itself (big rice buyer to middleman to wholesaler-retailer to retailer to consumer).
In general, wholesalers have been in business the longest time, and retailers the shortest. In the East, "over 15 years" is nearly as long as there has been an active rice trade. Only at Aba was there a tendency to specialize in rice; in the rest of the markets the sellers usually handled another food product, often beans.
Purchases on credit were more important for retailers only, and conversely, sales on credit were more frequent by wholesalers only. Sellers in all categories at Port Harcourt used credit less than at the other five markets.

ApPENDIX TABLE I.-CHARACTERISTICS OF RICE SELLERS ENGAGED IN WHOLESALE (W), RETAIL (R), OR A COMBINATION OF BOTH ACTIVITIES (W-R) IN THE SIX MARKETS SURVEYED, 1963
( Per cent of total sellers)
Aba Calabar Port Harcourt Onitsha Ilesha Ibadan ---W R W-R W R W-R W R W-R W R W-R W R R
Sex-age: Man ............................. 86 41 62 100 16 93 100 62 100 100 64 100 8 0 1 Woman .......................... 0 40 5 0 71 7 0 38 0 0 36 0 92 100 93 Boy-girl ........................ 14 19 33 0 13 0 0 0 0 0 0 0 0 0 6
Bought from: Big rice buyer ..................... 0 20 6 50 78 58 40 73 52 32 30 25 64 84 99 Trader at mills .................... 86 27 94 50 15 42 60 21 48 0 0 2 18 2 1 Farmer ......................... . 0 0 0 0 2 0 0 2 0 42 20 41 18 14 0 Local market middleman ........... 14 53 0 0 5 0 0 4 0 26 50 32 0 0 0
Average years selling: 0-5 years ......................... 14 81 47 25 37 15 60 72 22 42 64 46 15 48 60 6-10 years ........................ 29 11 27 0 45 42 20 18 50 34 27 31 39 28 22 11-15 years ....................... 14 7 19 25 13 35 20 4 28 13 9 15 0 14 5 Over 15 years ..................... 43 1 7 50 5 8 0 6 0 11 0 8 46 10 13
Sells: Rice only ......................... 71 48 58 0 0 0 0 2 0 29 0 46 0 10 6 Rice-beans ...................... 29 23 24 0 0 4 20 28 0 21 27 7 69 50 31 Rice-other food .................. 0 29 18 100 100 96 80 70 100 50 73 47 31 40 63
Buying credit: With interest ..................... 0 1 0 0 0 0 0 2 0 0 0 0 0 0 4 No interest ....................... 29 43 12 0 32 0 0 60 0 13 55 39 31 50 88 No credit ......................... 71 56 88 100 68 100 100 38 100 87 45 61 69 50 8
Selling credit: No ............................. . 43 76 67 50 79 19 100 90 83 71 82 79 15 66 26 Yes .............................. 57 24 33 50 21 81 0 10 17 29 18 21 85 34 74

350 DELANE E. WELSCH
The Western retailers tended to both buy and sell on credit more frequently than did the Eastern retailers, especially in Ibadan. The Ibadan retailers complained bitterly about business, and the interviewers reported a very low level of activity. The retailers offered the explanation that the large transfer of civil servants to the new Midwestern Region capital, Benin, resulted in loss of many of their best customers. Midwesterners might be expected to consume more rice than others because upland paddy has been produced in that area for many years.
Sellers in all categories in all markets reported December as the month of highest sales and highest profits. Replies to questions about the months of lowest sales and profits indicated: Aba-no noticeable trend; Calabar-February, June, July, and August; Onitsha-June, July, and August; Port Harcourt-January and February; Ibadan-June and July; and Ilesha-February, March, June, July, and August.
General Patterns of Supply
Answers to the question "Where was the rice that you sell grown?" were difficult to obtain. Most of the sellers, particularly retailers, who purchase rice in their own market had no idea where the rice was grown. Response by sellers who purchase at mill or from farmers indicates that almost all rice sold in Aba, Calabar, and Port Harcourt is from Abakaliki. A few buyers from these three markets go to Onitsha also. Much of the rice arriving in Calabar is carried by truck from Abakaliki to Afikpo and travels the remainder of the way on the Cross River by boat. Some rice imported from the United States is also sold in Calabar. In Onitsha about one-half of the rice comes from Abakaliki and the rest from the Northern Region. Buyers go as far north as Sokoto to purchase rice. Much of the rice sold in the Ibadan market comes from Abakaliki. Other sources for Ibadan were Bida, other Northern Region areas, Onitsha, and the Midwest. A frequently mentioned source was Ghana. However, the interviewers, when examining the sacks in which the "Ghana" rice came, found them to be from Houston, Texas. The wholesalers said that the Texas rice was first imported in 1960, the year that Ghana became a republic. The rice did not sell well because it was "too white." The traders then began to call it "Ghana rice" and appealed to consumers' loyalty to African nationalism to eat "Ghana rice." An interesting observation is that, while Ibadan consumers did not like the United States rice "because it is whiter," Calabar consumers prefer it for that very reason. Rice sold in Ilesha appears to come equally from Bida, Onitsha, and the Midwestern Region. Rice is not grown near Onitsha in quantity, so the rice sold at Onitsha may be either from Abakaliki or the Northern Region. Very few sellers said that they tried to buy rice from any particular area. If they did, they usually named the nearest source and gave "cheaper" as the reason.
Production
APPENDIX II
ESTIMATES OF PRODUCTION AND CONSUMPTION OF RICE IN THE REPUBLIC OF NIGERIA
Data on paddy production prior to 1957 consist of estimates by civil administrators. Systematic sample surveys of agriculture were started in 1957. The fol-

RICE MARKETING IN EASTERN NIGERIA 351
lowing estimates for 1962 are based on those surveys, as revised by the Ministries of Agriculture in each Region.
The Northern Region produces about 171,000 tons of paddy on 376,000 acres, for an average yield of 1,000 pounds per acre. Two-thirds of this is produced in Sokoto Province. Nearly all of the paddy is produced in swamps, low-lying fadamas bordering rivers, or on otherwise irrigated land. The West produces only about 6,900 tons on 29,000 acres, for an average yield of 530 pounds per acre. This is chiefly upland or dryland paddy produced in the Benin area. The previously best estimate for the East was 85,000 acres, 47,000 tons of paddy, and 1,000 pounds-per-acre average yield, with Abakaliki, Enugu, and Oguja provinces each contributing roughly one-third. On the basis of my study (16), estimates for the East should be raised to 185,000 acres, 120,000 tons, and 1,456 pounds per acre, with two-thirds in Abakaliki Province.
Consumption
Because data on changes in stocks are not available, discussion of consumption is limited to "available for consumption" only. Discussion of per capita consumption is further limited by the lack of census results more recent than 1951 that are acceptable to all three regions. Taking the previously best estimates for Nigeria would mean 120,000 tons of milled rice available for consumption.*' Inclusion of the revised estimates for the East would raise this estimate to 160,000 tons. Assuming populations of 40, 45, and 50 millions would indicate per capita disappearances of 6.7, 6.0, and 5.4 pounds, respectively, under previous estimates of production, and 9.0, 8.0, and 7.2 pounds, respectively, under the revised estimate. Regardless of the exact population size, average consumption of rice is very low-in the neighborhood of 5 to 7 pounds (23 to 3.2 kilograms) per capita. In contrast, per capita consumption in West Africa as a whole has been previously estimated at 16 kilograms (4, p. 8).
The discussion of internal consumption is further complicated by the fact that very few surveys of consumption have been carried out in Nigeria, and none at the national level. Consumption of milled or hulled rice by paddy producers varies between regions. Von Blanckenburg has said that producers in the Eastern Region consume little or no rice (15, p. 48). However, during the course of a paddy production survey carried out in 10 villages of Abakaliki Division (16), data were collected on rice consumption by the families who produced paddy. The results were: in two villages, children consume rice daily and adults three to four times weekly (one farmer said his children did not like yams and would eat only rice); in four villages, rice is consumed weekly; in two villages, monthly; and in the last two, on important holidays three or four times per year. Consumption of rice in rural areas in the East thus appears to be expanding rapidly.
Paddy producers in the North probably consume a considerable amount of milled and hand-hulled rice. Not only have they been growing the crop longer than Eastern Nigerian farmers, but they are also accustomed to consuming other cereals, such as millet and sorghum.
• Total paddy production less seed requirements (75Ibs. per acre), less loss in storage (5 per cent), converted to milled equivalent (using official FAO conversion rate for Nigeria of 60 per cent), plus net imports (about 1,500 tons annually).
352 DELANE E. WELSCH
The bulk of rice consumption in Nigeria is probably in urban areas for two reasons. First, urban residents have higher incomes and cash incomes. They purchase nearly all the food they consume, and rice costs only one-half to twothirds as much per 1,000 calories as do yams (16, p. 47). Second, the consumption habits of urban residents may not be as bound to traditional norms as those of people living in rural areas. Yams have traditionally been the preferred staple, but Johnston finds that "the scanty evidence at hand suggests that, especially in urban areas, African consumers readily shift to rice" (7, p. 95). Using a recent estimate that one-eighth of the total population are salaried and nonagricultural self-employed urban residents (13, pp. 24 and 69), and an estimate that onetwenty-fourth of the total population are rural producer-consumers of rice, then the per capita consumption by the group actually consuming rice is somewhere between 32 and 40 pounds (15 to 18 kilograms, depending upon the population estimate used), which is near the FAO estimate.