Rice Global Forum - South Dakota Public Utilities...
37
SIMMONS & COMPANY INTERNATIONAL The World’s Arterial And Circulatory System The World’s Arterial And Circulatory System Sixth Annual Rice Global Forum Rice University September 8, 2003 Houston, Texas Presented By: Matthew R. Simmons Energy Infrastructure: Energy Infrastructure:
Transcript of Rice Global Forum - South Dakota Public Utilities...

SIMMONS & COMPANYINTERNATIONAL
The World’s Arterial And Circulatory System
The World’s Arterial And Circulatory System
Sixth Annual Rice Global ForumRice University
September 8, 2003Houston, Texas
Presented By: Matthew R. Simmons
Energy Infrastructure:Energy Infrastructure:

SIMMONS & COMPANYINTERNATIONAL
Energy Is The Earth’s Most Precious Resource
Energy Is The Earth’s Most Precious Resource
n Modern energy was the greatest 20th century innovation.– Electricity– Internal combustion engine– Potable water– Age of technological revolution– Modern food system
§ Hybrids§ Fertilizer§ Refrigeration
– Health system
n Modern energy made wood, waste and dung obsolete in many parts of the globe.
n This miracle invented “prosperity.”
Without primary energy, none would happen

SIMMONS & COMPANYINTERNATIONAL
Useable Modern Energy Requires Complex “Infrastructure”
Useable Modern Energy Requires Complex “Infrastructure”
n No element of energy simply “turns on.”
n Each component has its own unique set of critical transformations and transmission from “raw energy” to useable energy.
n Many parts of this infrastructure are extremely energy intensive.
n Final “Point of Consumption Yield” varies enormously. (It takes energy to create useable energy.
n Each energy component has its own unique peak capacity.
n All have finite physical lives.

SIMMONS & COMPANYINTERNATIONAL
Much Of Our Energy System Was Built Between 1947 And 1975
Much Of Our Energy System Was Built Between 1947 And 1975
n Global energy demand exploded post-World War II.
n By mid-1970s, last major transformation/ transportation systems were built.
n Bulk of primary energy systems today were constructed in the 1950s and 1960s.– Last giant oilfields were discovered by 1975.– Most of OECD power plants were built prior to 1975.– Major oil and gas pipelines were built pre-1970.– Only a handful of refineries were built post-1970.
SIMMONS & COMPANYINTERNATIONAL
Over Last Decade, Spare Energy Capacity Disappeared
Over Last Decade, Spare Energy Capacity Disappeared
n Reserve margins in power grids eroded to skinny levels.
n Petroleum stocks fell in days’ use by 25% to 30%.
n Refinery utilization in most of the world rose from 70%-75% to 90%-95%.
n Oil and gas pipelines operate at 99% to 100% capacity at all times.
n Global tanker fleet is always over 95% full.
n “Shut-in” daily oil and gas supply is >2% of daily use (or less!).

SIMMONS & COMPANYINTERNATIONAL
U.S. Motor Gasoline: We Squander Our Transportation Cushion
U.S. Motor Gasoline: We Squander Our Transportation Cushion
Source: The Petroleum Economics Monthly, August 2003.
SIMMONS & COMPANYINTERNATIONAL
August 14, 2003 Blackout Highlighted The Fragility Of U.S. Power Grid
August 14, 2003 Blackout Highlighted The Fragility Of U.S. Power Grid
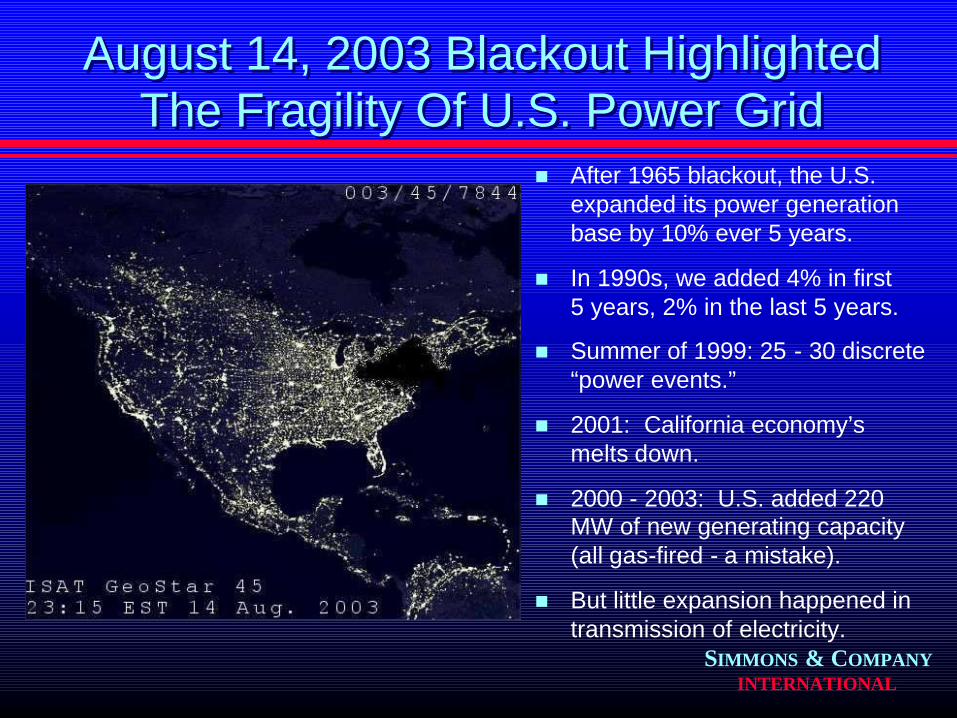
n After 1965 blackout, the U.S. expanded its power generation base by 10% ever 5 years.
n In 1990s, we added 4% in first 5 years, 2% in the last 5 years.
n Summer of 1999: 25 - 30 discrete “power events.”
n 2001: California economy’s melts down.
n 2000 - 2003: U.S. added 220 MW of new generating capacity (all gas-fired - a mistake).
n But little expansion happened in transmission of electricity.
SIMMONS & COMPANYINTERNATIONAL
The North American Grid Is OldThe North American Grid Is Old
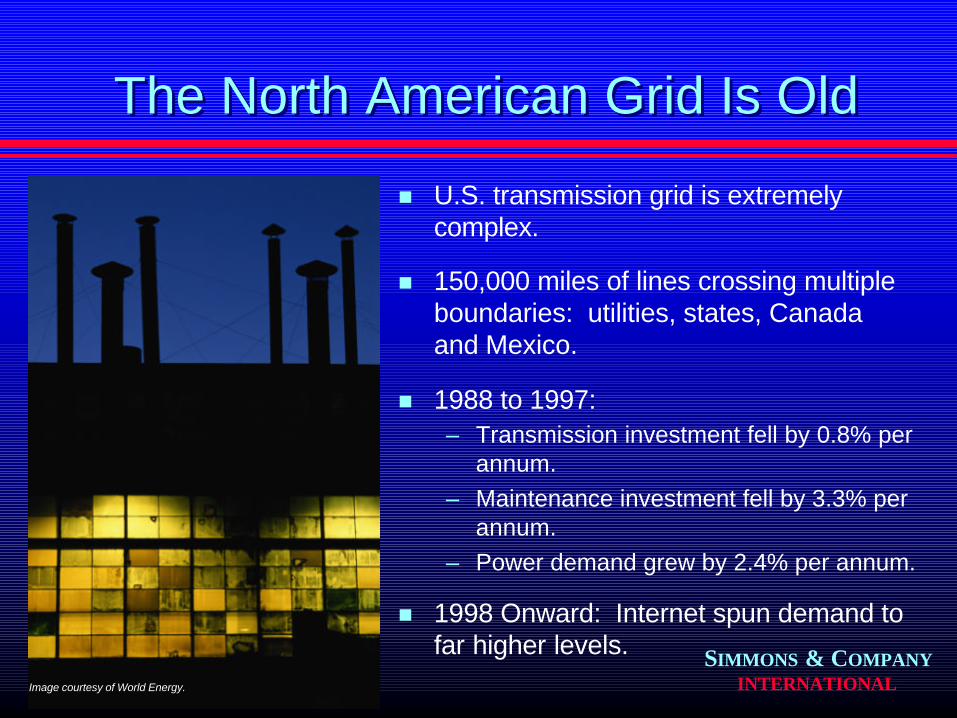
n U.S. transmission grid is extremely complex.
n 150,000 miles of lines crossing multiple boundaries: utilities, states, Canada and Mexico.
n 1988 to 1997: – Transmission investment fell by 0.8% per
annum.– Maintenance investment fell by 3.3% per
annum.– Power demand grew by 2.4% per annum.
n 1998 Onward: Internet spun demand to far higher levels.
Image courtesy of World Energy.

SIMMONS & COMPANYINTERNATIONAL
n Florida will soon be the 3rd most popular state.
n It has no “domestic” energy production.
n Its current power generating capacity is 41,719 MW.
n 2002 peak summer demand was 40,260 MW (97%).
n 2002 peak winter demand was 44,774 MW (107%).
n State plans to add 16,000 MW of new power plants by 2012 to meetprojected 2012 peak of 54,682 MW (winter). (This would leave Florida with a 5% cushion.)
n Natural gas needs should rise by 2.6 Bcf/day. In 2001, its gas need were 1.38 Bcf/day. In 2002, they grew 30%. This forecast assumes gas demand grows 4.4 Bcf/day by 2012, an increase of 3.2 times 2001 levels.
Florida Is A Classic Case Study Of What Went Wrong
Florida Is A Classic Case Study Of What Went Wrong

SIMMONS & COMPANYINTERNATIONAL
Power Generation Surge Created Growth For Natural Gas
Power Generation Surge Created Growth For Natural Gas
n Adding 220 MW of new gas-fired power plants created a bonanza for North American natural gas.
n But natural gas supply peaked and is now in decline.
n 1992 to 2001 “flat supply” was boosted by rapid growth in non-conventional supplies.
n Industrial use of gas is now endangered.
n As is the use of U.S. new power plants.
SIMMONS & COMPANYINTERNATIONAL
Our Spare Energy Capacity Is GoneOur Spare Energy Capacity Is Gone
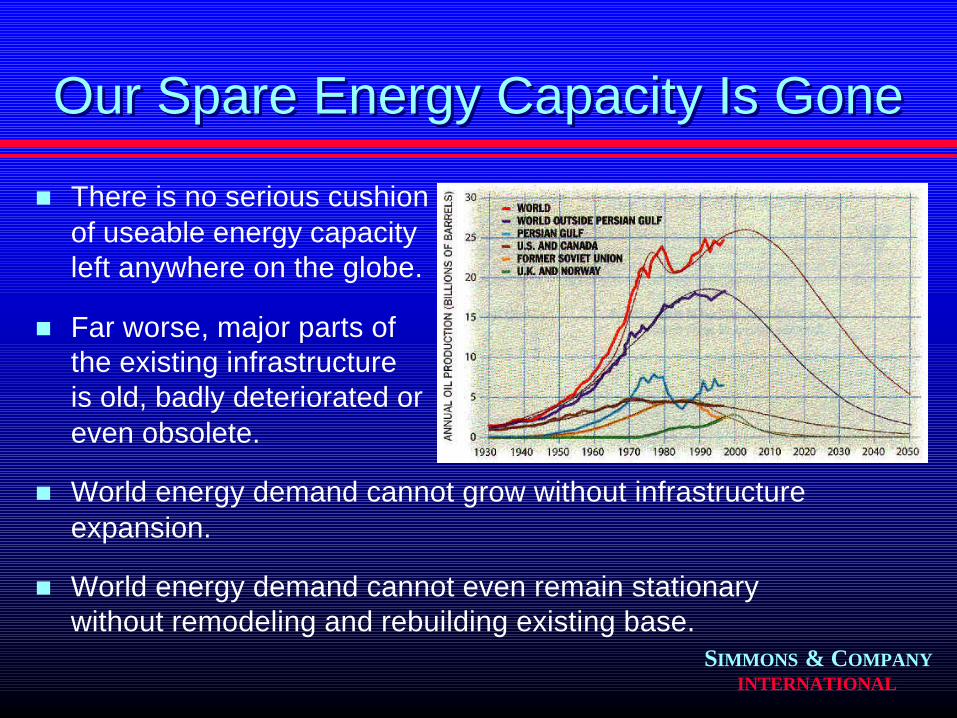
n There is no serious cushion of useable energy capacity left anywhere on the globe.
n Far worse, major parts of the existing infrastructure is old, badly deteriorated or even obsolete.
n World energy demand cannot grow without infrastructure expansion.
n World energy demand cannot even remain stationary without remodeling and rebuilding existing base.

SIMMONS & COMPANYINTERNATIONAL
Why Our Energy Cushion EvaporatedWhy Our Energy Cushion Evaporated
n NO ONE consciously decided to use up global “safety valve.”
n Energy demand grew when many assumed it would not.
n Energy prices either stayed flat or declined.
– This further stimulated demand.
– And made new energy investments “bad deals.”
n Energy “deregulation” sped up this process.– Free markets never intentionally build redundant capacity.– Free markets punish spare capacity as “glut.”
n As demand periodically exceeded supply, consuming spare capacity became out “energy bridge.”
SIMMONS & COMPANYINTERNATIONAL
Technology Sped The Process Of Eroding Cushion
Technology Sped The Process Of Eroding Cushion
n The internet created a surge in power use.
n Globalization increased developing country energy use.
n Oil and gas technology created new era of oil and gas.– Small fields became commercially viable.– Horizontal drilling/multizone completions created monstrous
rates of production decline.
n Many energy observers assumed “New Economy” used less energy and made supplies easier to find.
SIMMONS & COMPANYINTERNATIONAL
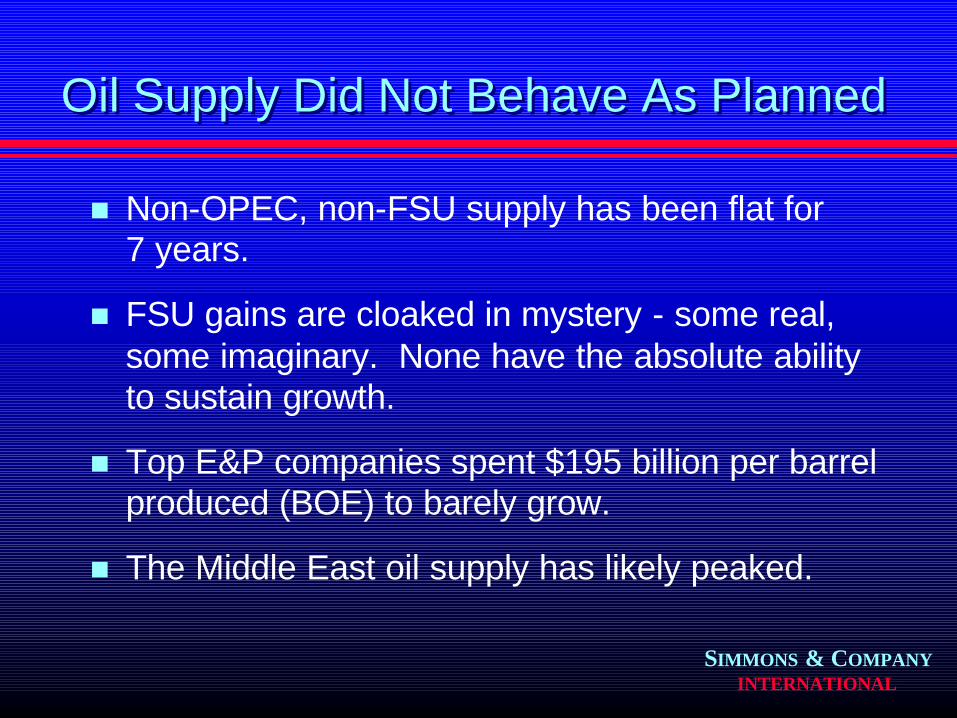
Oil Supply Did Not Behave As PlannedOil Supply Did Not Behave As Planned
n Non-OPEC, non-FSU supply has been flat for 7 years.
n FSU gains are cloaked in mystery - some real, some imaginary. None have the absolute ability to sustain growth.
n Top E&P companies spent $195 billion per barrel produced (BOE) to barely grow.
n The Middle East oil supply has likely peaked.

SIMMONS & COMPANYINTERNATIONAL
Non-OPEC (Excluding FSU)Supply Never Surged
Non-OPEC (Excluding FSU)Supply Never Surged
20.0
25.0
30.0
35.0
40.0
45.0
1Q 2Q 3Q 4Q 1Q 2Q 3Q 4Q 1Q 2Q 3Q 4Q 1Q 2Q 3Q 4Q 1Q 2Q 3Q 4Q 1Q 2Q 3Q 4Q 1Q 2Q 3Q 4Q1996 1997 1998 1999 2000 2001 2002
SIMMONS & COMPANYINTERNATIONAL
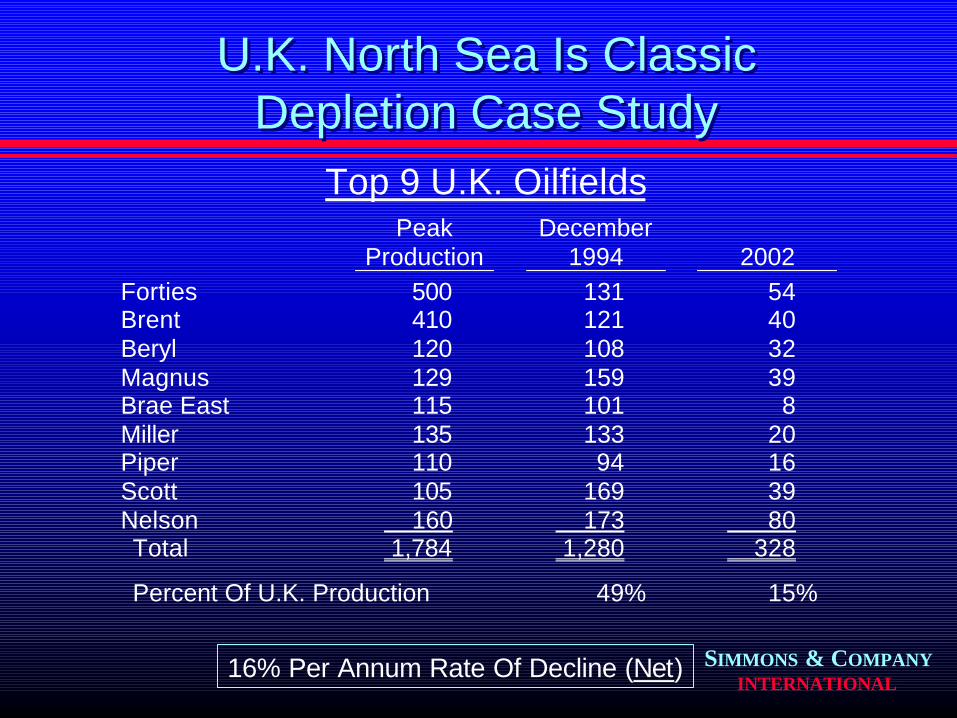
U.K. North Sea Is Classic Depletion Case Study
U.K. North Sea Is Classic Depletion Case Study
Peak Production
December 1994
2002
Forties 500 131 54 Brent 410 121 40 Beryl 120 108 32 Magnus 129 159 39 Brae East 115 101 8 Miller 135 133 20 Piper 110 94 16 Scott 105 169 39 Nelson 160 173 80 Total 1,784 1,280 328
Percent Of U.K. Production 49% 15%
16% Per Annum Rate Of Decline (Net)
Top 9 U.K. Oilfields

SIMMONS & COMPANYINTERNATIONAL
Top 10 E&P Companies Spending2000 To 2002
Top 10 E&P Companies Spending2000 To 2002
2000 Costs Incurred (Millions) Acquisition $25,549 Exploration 8,617 Development 29,316 Total $63,483 BOE Bbl Produced (BOE/d, 000) 22,487
2001 Costs Incurred (Millions) Acquisition $ 8,154 Exploration 9,218 Development 37,974 Total $55,347 BOE Bbl Produced (BOE/d, 000) 23,107
2002 Costs Incurred (Millions) Acquisition $23,147 Exploration 8,430 Development 44,617 Total $76,193 BOE Bbl Produced (BOE/d, 000) 24,091
Source: Company annual reports and SEC filings.
Development
Acquisition
Exploration
DevelopmentAcquisition
Exploration
Development Acquisition
Exploration
SIMMONS & COMPANYINTERNATIONAL
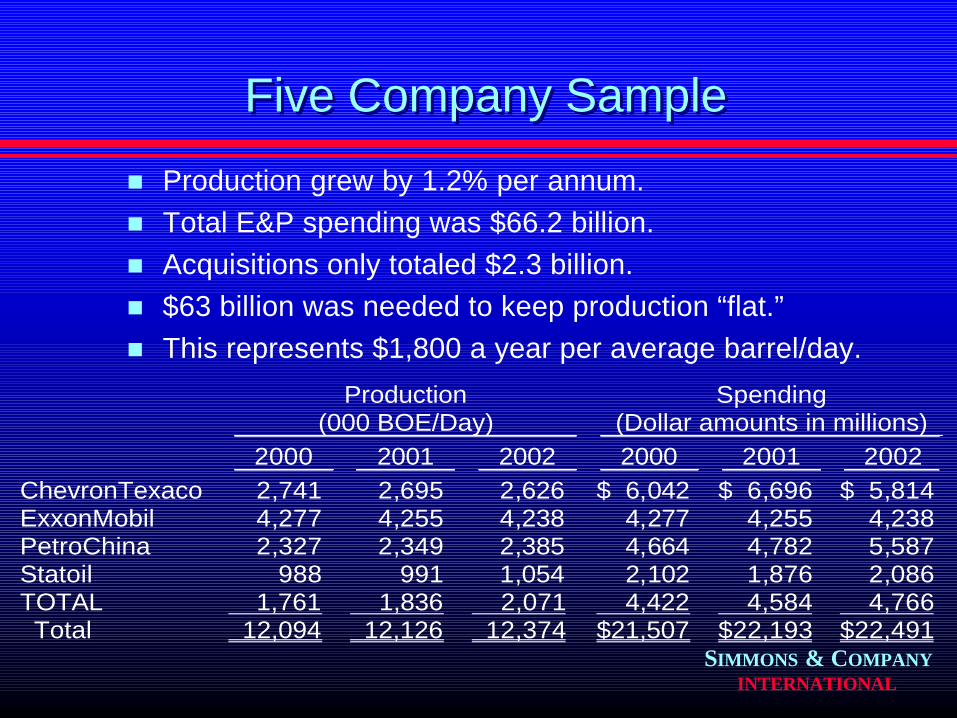
Five Company SampleFive Company Sample
n Production grew by 1.2% per annum.n Total E&P spending was $66.2 billion.n Acquisitions only totaled $2.3 billion.n $63 billion was needed to keep production “flat.”n This represents $1,800 a year per average barrel/day.
Production (000 BOE/Day)
Spending (Dollar amounts in millions)
2000 2001 2002 2000 2001 2002 ChevronTexaco 2,741 2,695 2,626 $ 6,042 $ 6,696 $ 5,814 ExxonMobil 4,277 4,255 4,238 4,277 4,255 4,238 PetroChina 2,327 2,349 2,385 4,664 4,782 5,587 Statoil 988 991 1,054 2,102 1,876 2,086 TOTAL 1,761 1,836 2,071 4,422 4,584 4,766 Total 12,094 12,126 12,374 $21,507 $22,193 $22,491

SIMMONS & COMPANYINTERNATIONAL
Middle East Is Only Place Any Spare Capacity Might Exist
Middle East Is Only Place Any Spare Capacity Might Exist
n Future reserve estimates for oil and gas are remarkable.
n Conventional wisdom suggests Middle East energy is almost free.
n The only “nervousness is geopolitics of this complex region.
SIMMONS & COMPANYINTERNATIONAL
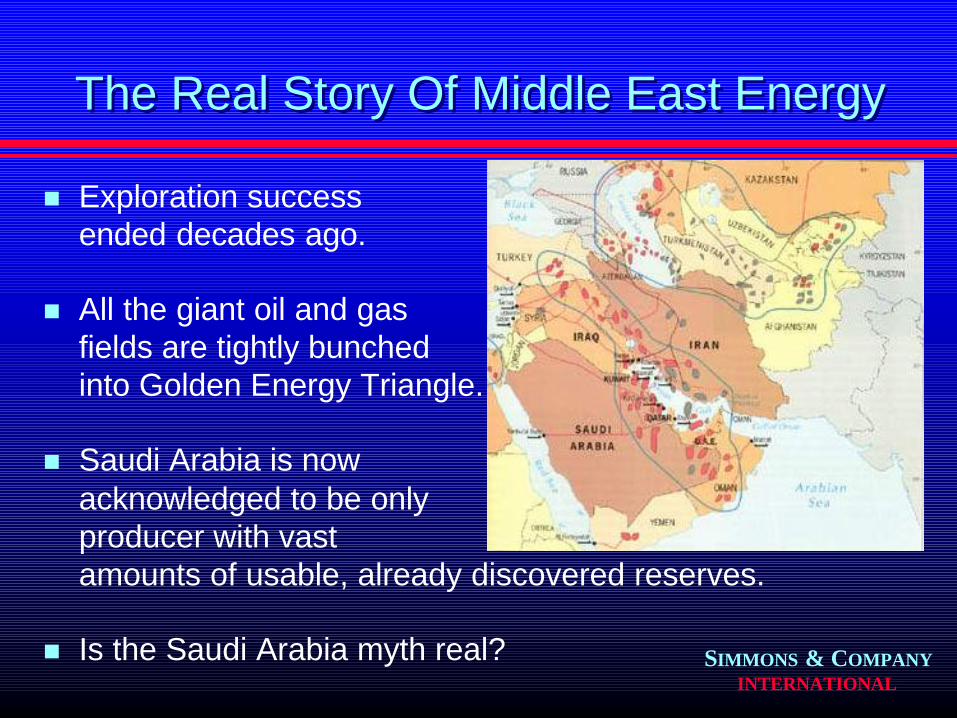
The Real Story Of Middle East EnergyThe Real Story Of Middle East Energy
n Exploration success ended decades ago.
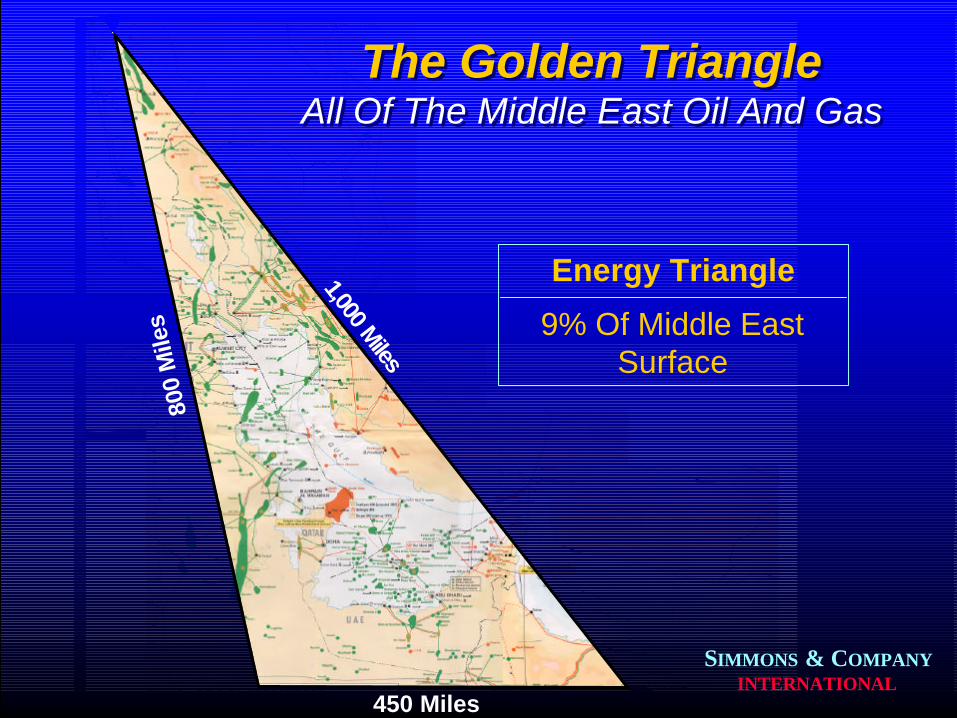
n All the giant oil and gas fields are tightly bunched into Golden Energy Triangle.
n Saudi Arabia is now acknowledged to be only producer with vast amounts of usable, already discovered reserves.
n Is the Saudi Arabia myth real?
SIMMONS & COMPANYINTERNATIONAL
The Golden TriangleAll Of The Middle East Oil And Gas
The Golden TriangleAll Of The Middle East Oil And Gas
1,000 Miles
800
Mile
s
450 Miles
Energy Triangle
9% Of Middle EastSurface
SIMMONS & COMPANYINTERNATIONAL
SIMMONS & COMPANYINTERNATIONAL
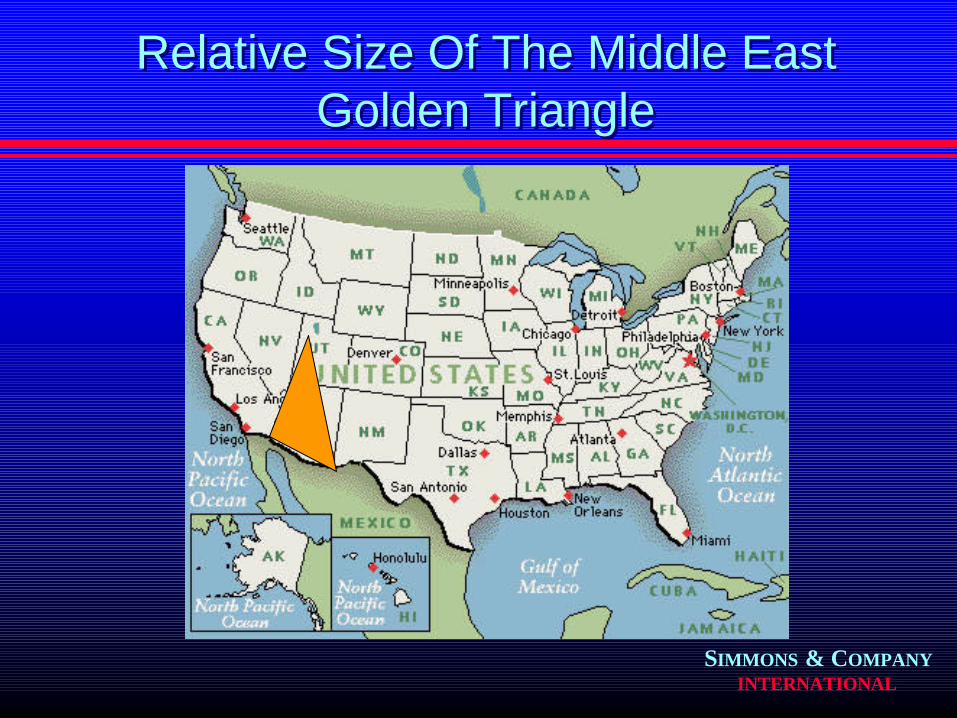
Relative Size Of The Middle East Golden Triangle
Relative Size Of The Middle East Golden Triangle
SIMMONS & COMPANYINTERNATIONAL
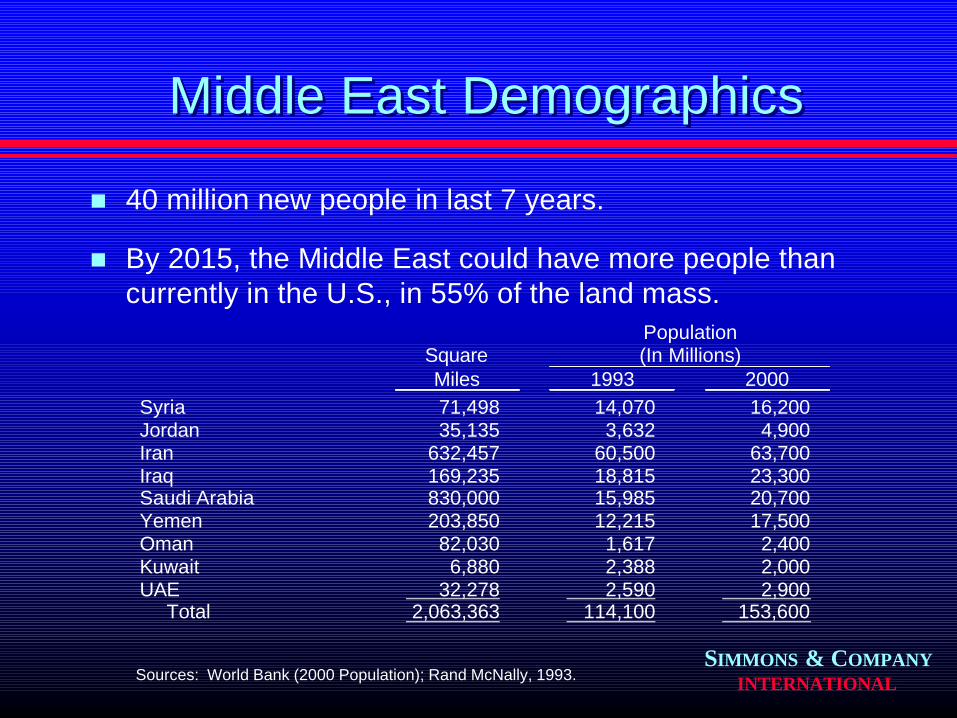
Middle East DemographicsMiddle East Demographics
Square
Population (In Millions)
Miles 1993 2000 Syria 71,498 14,070 16,200 Jordan 35,135 3,632 4,900 Iran 632,457 60,500 63,700 Iraq 169,235 18,815 23,300 Saudi Arabia 830,000 15,985 20,700 Yemen 203,850 12,215 17,500 Oman 82,030 1,617 2,400 Kuwait 6,880 2,388 2,000 UAE 32,278 2,590 2,900 Total 2,063,363 114,100 153,600
Sources: World Bank (2000 Population); Rand McNally, 1993.
n 40 million new people in last 7 years.
n By 2015, the Middle East could have more people than currently in the U.S., in 55% of the land mass.
SIMMONS & COMPANYINTERNATIONAL
Saudi Arabia Is The Dominant Oil Producer In The Middle East
Saudi Arabia Is The Dominant Oil Producer In The Middle East
n All other Middle East producers pale in comparison to Saudi Arabia’s production, spare capacity and reserves.
n Saudi Arabia became most important oil exporter once U.S peaked.
n While often not trusted, Saudi Arabia has constantly tried to become world’s most trusted supplier of oil. (It is all they have.)
n Saudi Arabia is assumed to hold virtually limitless amounts of cheap oil.

SIMMONS & COMPANYINTERNATIONAL
Saudi Arabia’s Oil And Gas ChallengesSaudi Arabia’s Oil And Gas Challenges
n No major exploration success since the 1960s.
n Almost all its production comes from very old fields.
n Almost every field has high and rising water cut.
n Ghawar, the world’s largest field, injects 7 million b/d of seawater to prop up the reservoir pressure.
n Outside “North Ghawar,” permeability and porosity are hard to find.
n Some key fields never worked.n Others are watering out.n It takes “fuzzy logic” to plan for Saudi
Arabia’s future.

SIMMONS & COMPANYINTERNATIONAL
Pending Saudi Oil Challenges Paper Will Be Revealing
Pending Saudi Oil Challenges Paper Will Be Revealing
n Last spring I decided to tackle an in-depth assessment of Saudi Arabia’s oil and gas resources.
n Downloaded over 150 detailed technical papers written by Saudi technicians on the real problems facing each significant field.
n These findings fly in the face of everything I have heard over the past 3 decades about Saudi’s abundance in oil resources.
n The research has totally changed my long-term thinking about our energy challenges.
SIMMONS & COMPANYINTERNATIONAL
What Saudi Arabia’s Real Energy Costs Might Be
What Saudi Arabia’s Real Energy Costs Might Be
n Saudi Arabia is no longer a low cost producer.
n Lifting cost must be rising exponentially.
n Natural gas finding costs are extremely high.
n What is Saudi Arabia’s “right price” for oil? Does anyone really know?
SIMMONS & COMPANYINTERNATIONAL
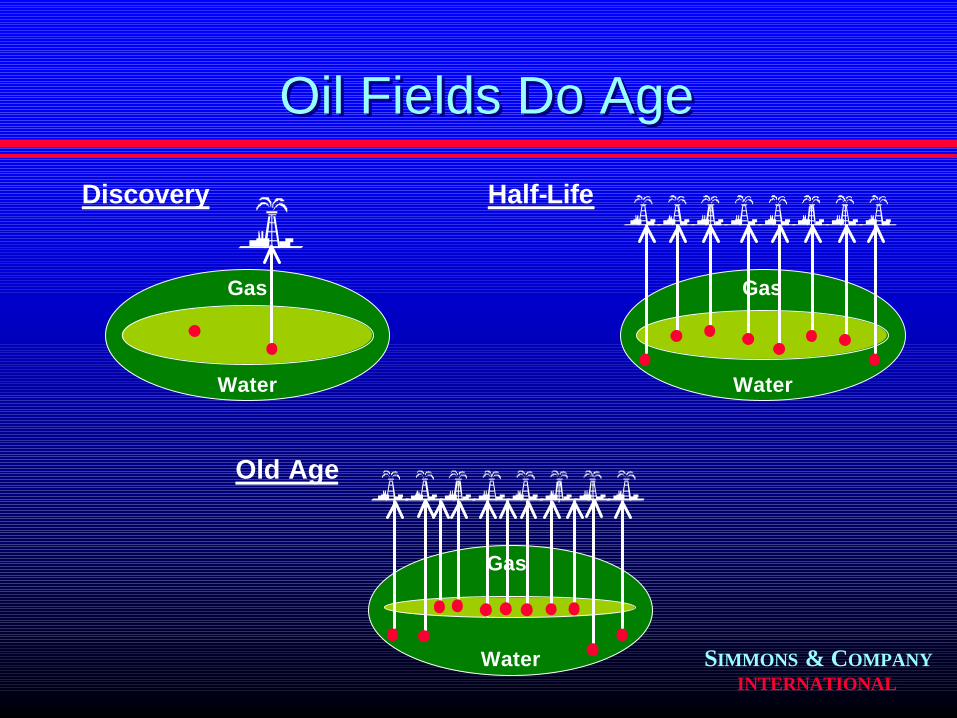
Oil Fields Do AgeOil Fields Do Age
Gas
Water
Discovery
Gas
Water
Half-Life
Gas
Water
Old Age

SIMMONS & COMPANYINTERNATIONAL
World Has Enjoyed Cheap Oil For Two Decades
World Has Enjoyed Cheap Oil For Two Decades
n Global economy has enjoyed stable and low oil prices for almost all of the past 2 decades.
n This price is no longer economically viable for either public companies or any OPEC producer.
n Natural gas prices in most areas need to also rise.
n Both resources might either be peaking or have already peaked.
n The issue of oil and gas “peaking” deserves a far more serious analysis.

SIMMONS & COMPANYINTERNATIONAL
The Global Economy Does Not Work Without Energy
The Global Economy Does Not Work Without Energy
n Local economies can become less energy dependent by exporting energy intensive efforts.
n But exports have to find homes with ample energy.
n A major energy “myth” was that energy was becoming an even smaller percentage of GDP.– U.S. reduction came in brief era:
§ Nuclear energy appeared.§ Oil stopped creating kilowatts.§ “Rust Belt” economies shifted overseas.
n The global economy still barely uses energy.
n As it expands, energy use has to also grow.
SIMMONS & COMPANYINTERNATIONAL
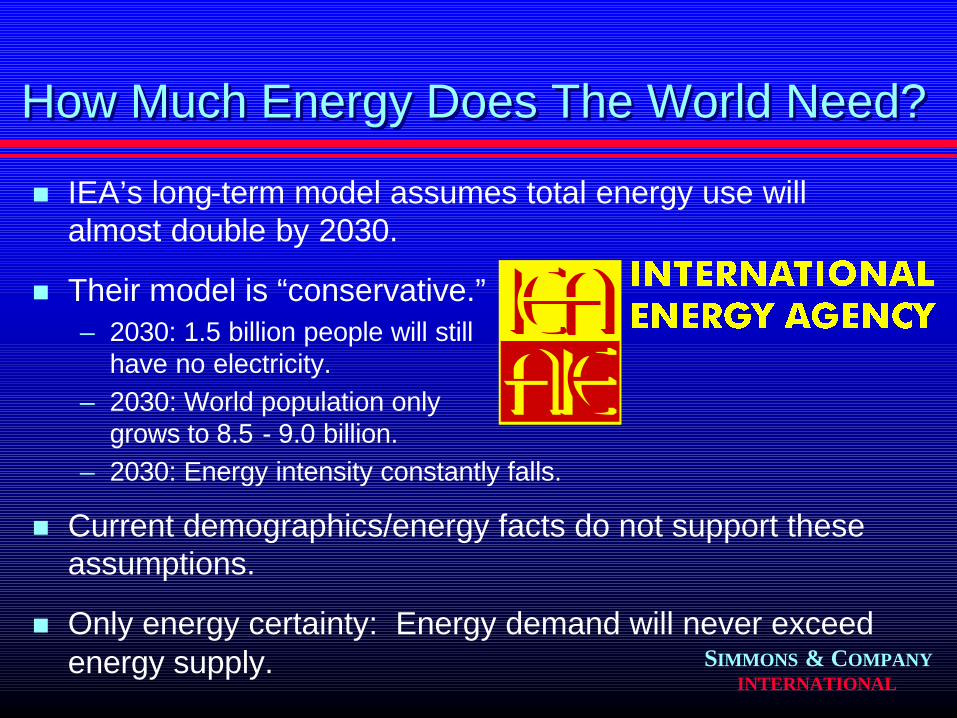
How Much Energy Does The World Need?How Much Energy Does The World Need?
n IEA’s long-term model assumes total energy use will almost double by 2030.
n Their model is “conservative.”– 2030: 1.5 billion people will still
have no electricity.– 2030: World population only
grows to 8.5 - 9.0 billion.– 2030: Energy intensity constantly falls.
n Current demographics/energy facts do not support these assumptions.
n Only energy certainty: Energy demand will never exceed energy supply.
SIMMONS & COMPANYINTERNATIONAL
How Much Will Creating Energy Growth Cost?
How Much Will Creating Energy Growth Cost?
n IEA’s World Energy Outlook 2003 will address this subject for the first time in history.– November 5, 2003: Roll-out in London.– November 14, 2003: Presentation in Houston
(At Rice University!!)
n Getting hard numbers was a daunting task.– Oil and gas depletion is a “black hole” guess.– Data for the cost of replacement energy assets is hard to find.
n The numbers are mind boggling.
SIMMONS & COMPANYINTERNATIONAL
A Sample Of Current Energy CostsA Sample Of Current Energy Costs
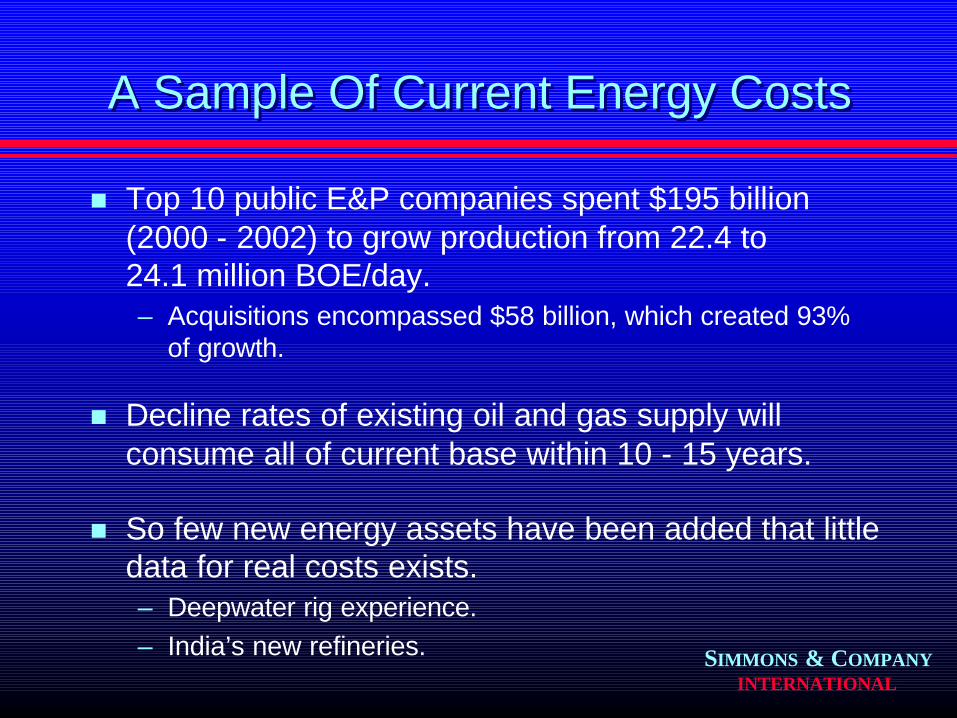
n Top 10 public E&P companies spent $195 billion (2000 - 2002) to grow production from 22.4 to 24.1 million BOE/day.– Acquisitions encompassed $58 billion, which created 93%
of growth.
n Decline rates of existing oil and gas supply will consume all of current base within 10 - 15 years.
n So few new energy assets have been added that little data for real costs exists.– Deepwater rig experience.– India’s new refineries.

SIMMONS & COMPANYINTERNATIONAL
Who Will Pay The Energy Bill?Who Will Pay The Energy Bill?
n If we can expand energy, it will be extremely costly.
n There are only two groups to foot this bill.– Energy consumers.– Governments (who tax
consumers).
n Finding the funds is easy if returns are visible, safe and attractive.
n Free markets do not throw money at bad investments (knowingly).
SIMMONS & COMPANYINTERNATIONAL
The World Needs A Fast Energy Wake-Up Call
The World Needs A Fast Energy Wake-Up Call
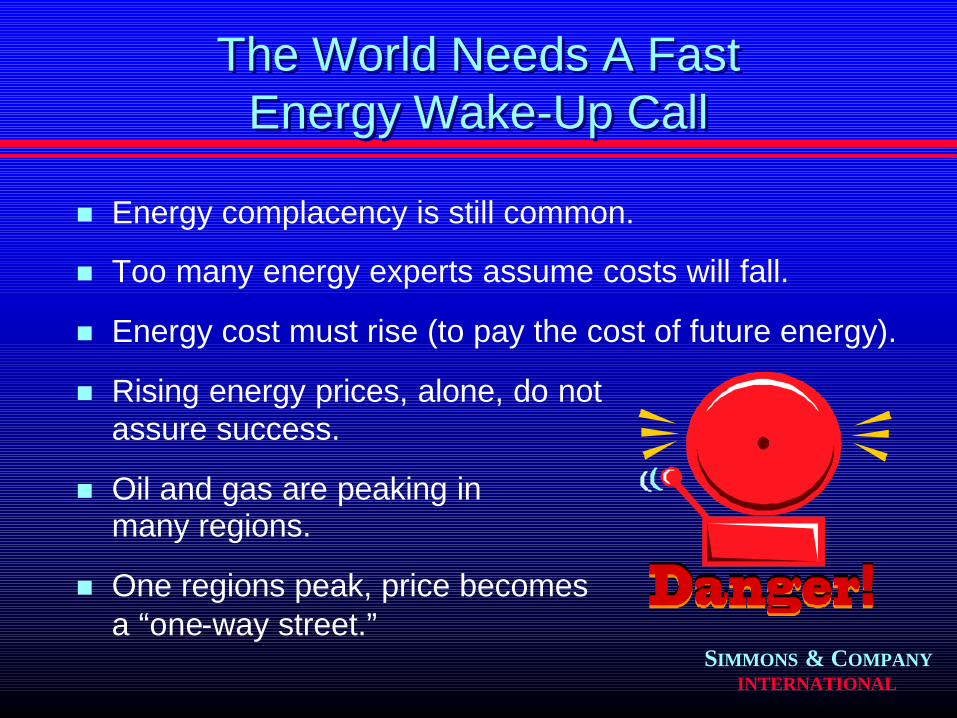
n Energy complacency is still common.
n Too many energy experts assume costs will fall.
n Energy cost must rise (to pay the cost of future energy).
n Rising energy prices, alone, do not assure success.
n Oil and gas are peaking in many regions.
n One regions peak, price becomes a “one-way street.”
SIMMONS & COMPANYINTERNATIONAL
Energy Infrastructure Spending Holds All The Keys
Energy Infrastructure Spending Holds All The Keys
n Without recreating energy cushions, global economies cannot grow.
n The existing energy base must be rebuilt.
n Only time and cost are unknown factors.
n Future could be grim if this job is not done.
SIMMONS & COMPANYINTERNATIONAL
SIMMONS & COMPANYINTERNATIONAL
Investment Bankersto the Energy
Industry