RICE CRC FINAL RESEARCH REPORT · general, rice is harvested as paddy rice which is dehulled to...
29
RICE CRC FINAL RESEARCH REPORT P4503FR09/05 ISBN 1 876903 39 3 Title of Project : New Applications for Rice Flour Project Reference number : 4503 Research Organisation Name : SunRice Principal Investigator Details : Names : Phillip Williams, Yu Pan & Vicki Poulson Address : PO Box 561 Leeton 2705 Telephone contact : 02 6953 0411
Transcript of RICE CRC FINAL RESEARCH REPORT · general, rice is harvested as paddy rice which is dehulled to...

RICE CRC
FINAL RESEARCH REPORT
P4503FR09/05
ISBN 1 876903 39 3
Title of Project : New Applications for Rice Flour
Project Reference number : 4503
Research Organisation Name : SunRice
Principal Investigator Details :
Names : Phillip Williams, Yu Pan & Vicki Poulson
Address : PO Box 561 Leeton 2705
Telephone contact : 02 6953 0411

Rice CRC
Final Report – Project Number: 4503 This Projects reports on 3 sub-projects A Rice Flour Technical Data. B Blending Rice Varieties for use in Rice Flour Production C New Applications for Rice Flour
TABLE OF CONTENTS New Applications for Rice Flour ....................................................................................................................................... 1 Background ......................................................................................................................................................................... 1 A: Rice Flour Technical Data .............................................................................................................................. 2 1. Objectives ......................................................................................................................................................... 2 2. Methods and materials ...................................................................................................................................... 2 2.1 Rice flours and other cereal flours .................................................................................................................... 2 2.2 Measurement of water absorption capacity (WAC).......................................................................................... 3 2.3 Determination of gelatinisation properties ........................................................................................................ 4 2.4 Texture analysis of starch gel............................................................................................................................ 4 3. Results and data ................................................................................................................................................ 5 3.1 Water absorption capacities of rice flours......................................................................................................... 5 3.1.1. The effect of rice varieties and resources.......................................................................................................... 5 3.1.2. The effect of particle size of rice flour on WAC............................................................................................... 6 3.2. Gelatinisation properties of rice flours.............................................................................................................. 7 3.2.1. The effect of varieties on the gelatinisation properties of rice flours ................................................................ 7 3.2.2. The effect of particle size on the gelatinisation properties of rice flours .......................................................... 8 3.3 Texture analysis of rice flour gel....................................................................................................................... 8 3.3.1 The effect of particle size on the texture of rice gel .......................................................................................... 8 3.3.2 The effect of varieties on the texture of rice gel.............................................................................................. 10 B : Blending of Rice Varieties. ........................................................................................................................... 11 4. Objectives ....................................................................................................................................................... 11 4.1 Long grain v’s medium grain .......................................................................................................................... 11 5. Methodology ................................................................................................................................................... 11 6. Results and data .............................................................................................................................................. 13 6.1 Blending of rice varieties and the effect on performance................................................................................ 13 6.1.1 RVA analysis .................................................................................................................................................. 13 6.1.1.1 Small brokens.................................................................................................................................................. 13 6.1.1.2 Arborio............................................................................................................................................................ 14 6.1.1.3 Opus ............................................................................................................................................................... 14 6.1.1.4 Koshihikari...................................................................................................................................................... 15 6.2 Blending of rice varieties and the effect on performance................................................................................ 15 6.2.1 RVA analyses.................................................................................................................................................. 15 6.3 Long grain v’s medium grain .......................................................................................................................... 17 6.3.1 RVA (Rapid Viscosity Analyses) ................................................................................................................... 17 6.3.2 Sieve................................................................................................................................................................ 18 6.3.3 Particle size comparison.................................................................................................................................. 18 7. Discussion ....................................................................................................................................................... 19 7.1 Blending of rice varieties and the effect on performance................................................................................ 19 7.2 Long grain v’s medium grain .......................................................................................................................... 19 7.3 Particle size comparison.................................................................................................................................. 20 8. Implications and recommendation .................................................................................................................. 20 8.1 Blending of rice varieties and the effect on performance................................................................................ 20 8.2 Long grain v’s medium grain .......................................................................................................................... 20 C: New Applications for Rice Flour – Cake mix ............................................................................................. 21 9. Objective ......................................................................................................................................................... 21 10. Methods........................................................................................................................................................... 21 10.1 Manual measurement of spot counts (visual assessment). .............................................................................. 21 10.2 Instrumental measurement of specks. ............................................................................................................. 21 10.3 Measurement of the gelatinisation properties ................................................................................................. 21 10.4 Texture analyses on the cakemix .................................................................................................................... 22 10.5 Colour analysis on cakemix flour and cakemix dough ................................................................................... 22 11. Results............................................................................................................................................................. 23 11.1 Chemical analyses........................................................................................................................................... 23 11.1.1 Speck analyses – Japanese cook test ............................................................................................................... 23 11.1.2 Speck analyses results ..................................................................................................................................... 23 11.1.2.1 Speck analyses – BRI (Branscan) ................................................................................................................... 24 11.2 Colour results .................................................................................................................................................. 24 12. Conclusion ...................................................................................................................................................... 25 13. References....................................................................................................................................................... 25

-1-
Rice CRC Project – 4503
New Applications for Rice Flour Background In recent years, the rice industry has faced many upheavals as a result of the continuing drought conditions we are experiencing. The effect on the rice growing industry has been staggering in regards to quantity and quality. As we have seen the effects of the drought worsen and the water level decade we have also seen rice crop sizes decreasing at a dramatic rate. This decrease has not been consistent throughout the varieties of rice currently grown in Australia due to the growing conditions required for some varieties and the availability of water in these areas. The aim of this project is to closely look at various attributes of rice in flour form in an aim to identify areas where different varieties can be used for rice flour production for new or the same purposes. This can potentially maximise rice usage and help ensure supply of rice flour requirements to consumers.

-2-
A: Rice Flour Technical Data Rice (Oryza sativa L.) is one of the leading crops in the world and a close second to wheat in its importance as a food cereal in the human diet. In 1999, about 560 million metric tons (MMT) of rice were worldwide grown compared to 600 MMT for wheat, 300 MMT for oil seeds, and 900 MMT coarse grains (corn, sorghum, barley, oats, rye, millet and mixed grains) (Saga V Food, 2000). In general, rice is harvested as paddy rice which is dehulled to obtain the brown rice or cargo rice. The white rice is obtained after polishing the brown rice. During the polishing process, broken rice is produced, which serves as the raw material for production of rice flour. It is known that gluten in some cereals such as wheat, rye, oat and barley is the cause of coeliac disease. However, rice protein is different from gluten and has very low allergic effect; and is used as a main ingredient to prepare wheat-free food products (Kylie T, 2000). There are a number of gluten-free products sold using rice flour as a main component. Also, rice is a good basic and energetic foodstuff with a high digestibility. It combines a high amount of carbohydrates (about 78%) with a low level of fats (about 0.4 to 0.8%) and a good quality protein (about 7%) (Laureys,1999). Moreover, rice contains the lowest amount of sodium from all basic foodstuff: It is well known that food with a low content of sodium is recommended for heart diseases (Laureys,1999). According to the data shown by Griffiths (2000), rice is a healthy food for our diet compared well with other cereal products (eg. Bread, pasta, breakfast cereal). Besides those nutritional attributes of rice and rice products, the specialities of rice starch and flour contribute to their unique applications. Rice starch granule is the smallest in size among the cereal starches and results in a smooth and creamy texture. Its short-textured paste gives a clean taste. Rice starch and flour can provide suitable textures for a range of foods with a high natural stability and digestibility. In addition, rice flour, starch and protein can be also used as processing aid, ingredients in health food, coating agents in confectionary, water binders in smallgoods, expanding agents in extrusion food, flavour carriers, emulsifiers and fat replacers in diary products and paper coating agents (Laurey, 1999). Rice flours at RCL are mainly made from the large broken long and medium grain rices. Therefore, the properties of rice flour highly depend on the variants of rice. However, there is very limited technical data on Australian rice and rice flour. Meanwhile, the demand of rice flours is increased but the availability of broken rice is variable due to the seasonal fluctuations. Hence, the new resources of rice flour have to be investigated and exploited. All of those problems on rice flour raise the objectives of this study. 1. Objectives To collect technical data on RCL rice flours: chemical and physical properties, gelatinisation properties, properties of starch gel and water absorption capacity. 2. Methods and materials 2.1 Rice flours and other cereal flours Commercial rice flours from RICEGROWERS CO-OP LTD are listed in Table 1. Milled rice from NSW varieties were milled with lab miller (ITECATOR® Cyclotec 1093 Sample Mill). The average particle sizes of different rice flours summarised in Table 2.

-3-
2.2 Measurement of water absorption capacity (WAC) Tsai et al (1998) developed the method to evaluate the water binding capacities of the binder in a meat product. The method is described in following: Five grams of sample (3 grams of meat and 2 grams of binder) were blended with excess distilled water (15 mL) for 1 min, and the same amount of beef meat was used as a control. The homogenized mixture was then poured and rinsed into a pre-weighed tube and centrifuged at 2000 rpm for 20 min. The remaining unabsorbed water was decanted after centrifugation and the water absorbed by sample was determined. WAC was calculated as gram of water absorbed per gram of sample. The method was modified from Tsai’s method to measure the WACs of rice flours at 25 and 70°C. The experimental steps are followings: Record the weight of each centrifuge tube, Pour 8ml or 10ml distilled water into pre-weighed tube (8ml for 25°C and 10ml for 70°C), Weigh 1.5g flour and put it into the centrifuge tube, and mix it thoroughly, Incubate it for 0.5 hour and 1 hour at 25°C and 70°C respectively, Cool the hot tube down to room temperature (for about 1 hour) before centrifugation, Centrifuge the tube at 2000 rpm for 20 minutes, Pour the supernatant out and absorb the left water by tissue paper, Weigh the tube with residue and calculate the water absorption capacity according to the following equation: (Weight of sample after centri. – Weight of sample before centri.) Water absorption capacity = -------------------------------------------------------------------------------- Weight of dry sample
Table 1. Sample list and description in this study Binder Name Typical data
Rice Flour 580 Long grain rice, 20-22% amylose content, 6.7% protein, 0.9% oil. Particle size: 5%> 500µm, 425µm <10-30% < 500µm, 212µm <40-60%< 425µm, 15-35%< 212µm.
Rice Flour 584 Long grain rice, 20-22% amylose content, 6.7% protein, 0.9% oil. Particle size: 12%> 150µm, 88%< 150µm.
Rice Flour 587 Long grain rice, 20-22% amylose content, 6.7% protein, 0.9% oil. Particle size: 0-2%> 1400µm, 1180µm <10-30%< 1400µm, 1000µm <20-40%<1180µm, 850µm <10-30%<1000µm, 500µm <15-35%< 850µm, 0-3%<150µm.
Rice Flour 578 Medium grain rice, 18-20% amylose content, 6.4% protein, 0.7% oil. Particle size: 500µm <0-5%, 425µm<10-30%<500µm, 212µm <40-60%<425µm, 15-35%<212µm.
Rice Flour 594 Medium grain rice, 18-20% amylose content, 6.4% protein, 0.7% oil. Particle size: 212µm <0-5%, 150µm <35-55%<212µm , 40-69%<150µm.
Table 2. The average particle size of rice flours
Rice flour Average particle size (µm) Flour 584 157.4 Flour 594 177.9 Flour 580 253.5 Flour 578 253.5 Flour 587 871.3
Flour from lab miller 208.0

-4-
2.3 Determination of gelatinisation properties Plant cells deposit the starch molecules in successive layers around a central hilum to form a tightly packed granule. The adjacent amylose molecules and outer branches of amylopectin associate through hydrogen bonding in a parallel fashion to give radially oriented, crystalline bundles known as “micelles” (National Starch and Chemical Company, 1996). These highly oriented and crystalline micellular areas explain the ability of ungelatinized starch granules to rotate a plane-polarised light to produce characteristic interference crosses, so called bi-refringence. This bi-refringent cross is one of the features used in identifying starch source. When heat is applied in starch suspension, the starch granules start to swell and finally break and release the amylose molecules into the solution. During the process, the gelatinization temperatures are considered as ranges covering the temperatures at which loss of bi-refringence is first noticed and less than 10% remains. The gelatinisation properties of the samples in this study were determined by RVA (Rapid Visco Analyser, Model RVA-3D+, Newport Scientific Australia), which has been widely applied to determine the gelatinisation properties of various starches and cereal flours. The pasting temperature, holding strength, peak and final viscosity can be measured during a very short cooking time. Normally, the heating temperature is 95°C in the measurement. However, in order to determine the gelatinisation properties of rice flour in applications where the cooking temperatures are between 68 and 72°C, a lower temperature RVA profile was also employed (National Starch & Chemical, 2000). The profile is described in Table 3. In this study, all the flours were tested by RVA with the Rapid Rice Method (AACC Method 61-02) in which the heating temperature was 95°C. This method is normally used for the analysis of rice flour at RCL.
Table 3. Profile of low temperature RVA Time Type Value 00:00:00 Temp 50°C 00:00:00 Speed 960 rpm 00:00:10 Speed 160 rpm 00:01:00 Temp 50°C 00:05:00 Temp 68, 72 or 75°C 00:10:00 Temp 68, 72 or 75°C 00:17:00 Temp 30°C
Sample size: 3.00±0.01g Moisture content of sample: should be around 12% (if not, calculate sample and water corrections for 12% moisture basis) Adding water: 25.0±0.01g Idle temperature: 50°C End of test: 18 min. Time between readings: 4 sec. 2.4 Texture analysis of starch gel The texture analysis of rice flour gel was conducted by using Texture Analyser (TA-XT2i) and Texture Expert Exceed. The method was suggested by Dr. M. Fitzgerald, Yanco Agriculture Institute.
-5-
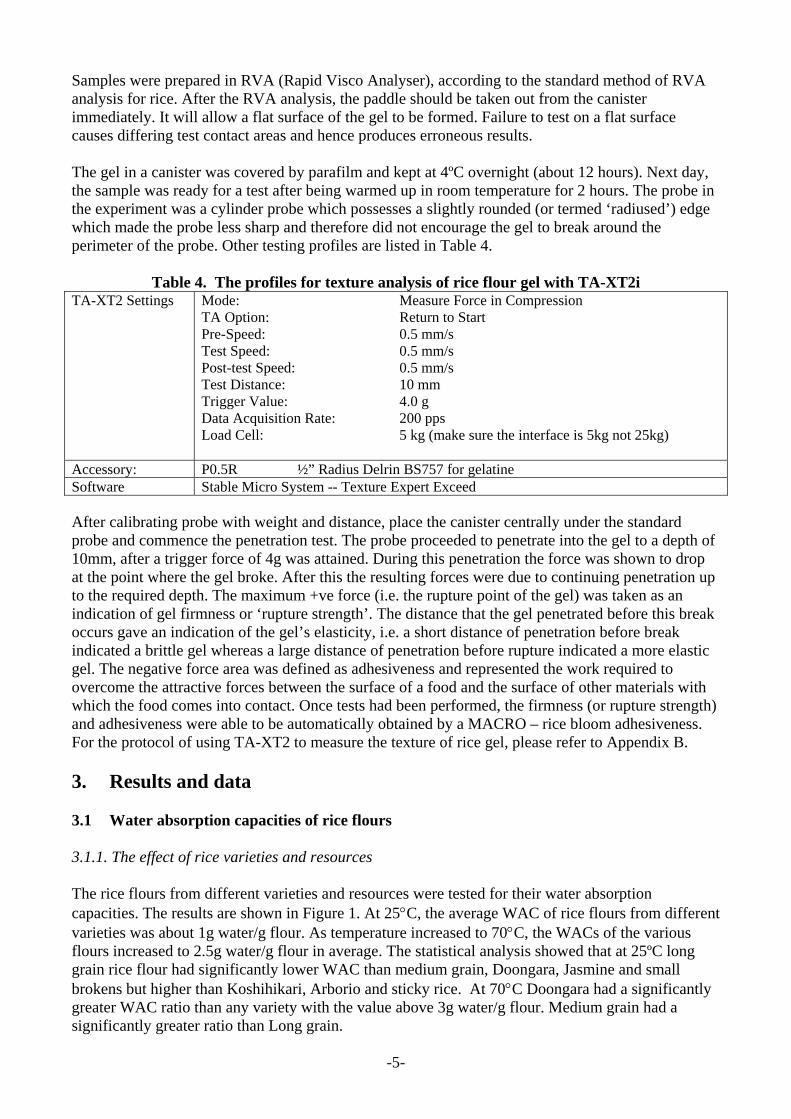
Samples were prepared in RVA (Rapid Visco Analyser), according to the standard method of RVA analysis for rice. After the RVA analysis, the paddle should be taken out from the canister immediately. It will allow a flat surface of the gel to be formed. Failure to test on a flat surface causes differing test contact areas and hence produces erroneous results. The gel in a canister was covered by parafilm and kept at 4ºC overnight (about 12 hours). Next day, the sample was ready for a test after being warmed up in room temperature for 2 hours. The probe in the experiment was a cylinder probe which possesses a slightly rounded (or termed ‘radiused’) edge which made the probe less sharp and therefore did not encourage the gel to break around the perimeter of the probe. Other testing profiles are listed in Table 4.
Table 4. The profiles for texture analysis of rice flour gel with TA-XT2i TA-XT2 Settings Mode:
TA Option: Pre-Speed: Test Speed: Post-test Speed: Test Distance: Trigger Value: Data Acquisition Rate: Load Cell:
Measure Force in Compression Return to Start 0.5 mm/s 0.5 mm/s 0.5 mm/s 10 mm 4.0 g 200 pps 5 kg (make sure the interface is 5kg not 25kg)
Accessory: P0.5R ½” Radius Delrin BS757 for gelatine Software Stable Micro System -- Texture Expert Exceed After calibrating probe with weight and distance, place the canister centrally under the standard probe and commence the penetration test. The probe proceeded to penetrate into the gel to a depth of 10mm, after a trigger force of 4g was attained. During this penetration the force was shown to drop at the point where the gel broke. After this the resulting forces were due to continuing penetration up to the required depth. The maximum +ve force (i.e. the rupture point of the gel) was taken as an indication of gel firmness or ‘rupture strength’. The distance that the gel penetrated before this break occurs gave an indication of the gel’s elasticity, i.e. a short distance of penetration before break indicated a brittle gel whereas a large distance of penetration before rupture indicated a more elastic gel. The negative force area was defined as adhesiveness and represented the work required to overcome the attractive forces between the surface of a food and the surface of other materials with which the food comes into contact. Once tests had been performed, the firmness (or rupture strength) and adhesiveness were able to be automatically obtained by a MACRO – rice bloom adhesiveness. For the protocol of using TA-XT2 to measure the texture of rice gel, please refer to Appendix B. 3. Results and data 3.1 Water absorption capacities of rice flours 3.1.1. The effect of rice varieties and resources The rice flours from different varieties and resources were tested for their water absorption capacities. The results are shown in Figure 1. At 25°C, the average WAC of rice flours from different varieties was about 1g water/g flour. As temperature increased to 70°C, the WACs of the various flours increased to 2.5g water/g flour in average. The statistical analysis showed that at 25ºC long grain rice flour had significantly lower WAC than medium grain, Doongara, Jasmine and small brokens but higher than Koshihikari, Arborio and sticky rice. At 70°C Doongara had a significantly greater WAC ratio than any variety with the value above 3g water/g flour. Medium grain had a significantly greater ratio than Long grain.

-6-
Figure 1. The comparison of rice flours from different resources on water absorption capacity at 25 and 70°C.
3.1.2. The effect of particle size of rice flour on WAC The particle size of rice flour also affects water absorption capacity. Figure 2 shows the comparison of long grain and medium grain rice flours with different particle sizes. The finer flour absorbed the more water, especially at 70°C.
Figure 2. The effect of particle size of rice flour on water absorption capacity. Among RCL commercial rice flours, Flour 584 demonstrated the highest WAC at 25ºC. There were no other significant differences between other samples at room temperature. The statistical analysis also showed that at 70ºC Flour 587 had a significantly lower WAC ratio than any other flours. At 70ºC, amylose content is another reason affecting water absorption capacity according to the statistical analysis. The rice flour with higher amylose content had a significantly lower WAC.
0
0.5
1
1.5
2
2.5
3
3.5
4
Long grain Doongara Jasimine Medium grain Koshi Arborio
rice flours from different varieties
Wat
er a
bsor
ptio
n ca
paci
ty (g
wat
er/g
flou
r) at 25C at 70C
0
0.5
1
1.5
2
2.5
3
Long grain rice Flour 587 Flour 580 Flour 584 Medium grainrice
Flour 578 Flour 594
Rice flours with different particle sizes
Wat
er a
bsor
ptio
n ca
paci
ty
(g w
ater
/g fl
our)
at 25C at 70C

-7-
Therefore, it can be concluded that Flour 594 was significantly different from Flour 584 and Flour 578 from Flour 580, even though they had similar particle size. It may be due to the difference on gelatinisation temperature of rice flour. However, amylose content and particle size were not the only factors on WAC, because Doongara in the last section had highest amylose content and larger particle size than BRI flour, but it had higher WAC than BRI flour. So, the variety, the structure of starch granule or the protein content and structure in rice also may affect WAC. 3.2. Gelatinisation properties of rice flours The gelatinisation properties of the commercial rice flours of RCL were measured by RVA with peak temperatures at 95 and 72ºC. The rice flours from different varieties obtained by using the lab miller.
3.2.1. The effect of varieties on the gelatinisation properties of rice flours The results showed that pasting temperatures of rice flours were different from the gelatinisation temperature of rice starch, maybe because there were other components in the flours such as proteins and lipids, which may resist the gelatinisation of rice starch. In general, long grain rice flour had relatively higher pasting temperature, medium grain rice the lowest pasting temperature. However, Doongara (a long grain variety) has the highest amylose content (about 26%) and significantly lower pasting temperature than the other two varieties of long grains. In addition, Doongara had the Table 5. The gelatinisation properties of the rice flours from different varieties and resources - Binder Name Pasting
temperature (°C)
Peak viscosity (RVU)
Holding strength (Trough viscosity)
(RVU)
Final (Set-back) Viscosity (RVU)
Peak viscosity at 72°C RVA
test (RVU) Doongara (long grain) 77.1 217.1 125.6 258.5 12.6
Long grain, Langi 81.5 236.4 133.3 258.3 1.5
Jasmine, Kyeema 79.1 285.9 148.3 279.5 2.8
Medium grain 69.6 268.3 136.6 246.4 30.8
Koshihikari 70.5 287.0 143.5 249.3 29.3 Arborio, Illabong 70.1 261.2 132.4 243.2 31.0
lowest peak viscosity, similar final viscosity with long grain, and the highest viscosity at 72ºC among those long grain varieties. It seems that the structure of starch granule in rice also contributes the gelatinisation properties. Jasmine had the highest peak; holding and final viscosity among those long grain varieties, but it had a similar pasting temperature and viscosity at 72ºC in comparison with long grain. Among three medium or short grain varieties, there were no significant differences except for Koshihikari which had significantly higher peak viscosity. In addition, the final viscosities of those medium grain varieties were higher than those of long grain varieties. Sticky rice had a soft gel because its final viscosity was only two third of other rice flours but it had high viscosity at 72ºC.

-8-
3.2.2. The effect of particle size on the gelatinisation properties of rice flours Two batches of rice flours had been tested for their gelatinisation properties, which are shown in Table 6. In general, the pasting temperature (PT) was reasonably consistent across two experiments, except for Flour 584. The PT of Flour 584 in the second experiment was significantly higher than the one in the first. It may be due to the variety difference in the two batches of samples. As it is mentioned in section 3.2.1, the PTs of Jasmine and normal long grain rice are higher than that of Doongara by 2-3ºC. However, the overall viscosities in Experiment 2 were higher than those in Experiment 1 and the reason need to be investigated.
Table 6. The gelatinisation properties of commercial rice flours in RCL Pasting temp. (°C)
Peak viscosity (RVU)
Holding strength (Trough viscosity) (RVU)
Final Viscosity (RVU)
Peak viscosity at 72°C RVA test (RVU)
Binder Name
Exp. 1 Exp. 2 Exp. 1 Exp. 2 Exp. 1 Exp. 2 Exp. 1 Exp. 2 Exp. 1 Exp. 2 Flour 587 --- --- --- 8.8 --- 5.1 --- 77.1 --- -0.1
Flour 580 88.3 88.0 170.0 191.3 103.0 131.2 206.5 258.4 --- 2.1
Flour 584 77.6 79.2 240.0 284.9 106.8 134.2 207.5 269.1 2.9 5.7
Flour 578 85.3 85.6 185.5 241.4 108.0 130.2 214.2 233.9 8.6 12.4
Flour 594 69.6 70.3 256.3 290.9 128.2 137.1 230.2 242.9 16.1 23.3
It is also shown in Table 6 that particle size and amylose content of rice flours considerably affect the gelatinisation properties. As particle size decreased, the pasting temperature of rice flour would decrease and peak viscosity would increase, but the holding and final viscosities didn’t change very much compared with the variance in peak viscosity. The statistical analysis also showed that Flour 584 was significantly different from Flour 594 and Flour 580 from Flour 578, even though they shared the almost same particle size. Besides, the rice flours from long grain had very low viscosity at 72ºC. Medium-grain rice flours produced slightly higher viscose slurry than long-grain rice flours. It is suggested the rice flours may not absorb the maximum water at processing temperatures from 68 to 72°C. 3.3 Texture analysis of rice flour gel 3.3.1 The effect of particle size on the texture of rice gel The rice gel was obtained after RVA analysis and kept at 4ºC overnight. And then the texture analysis was conducted after the sample had been brought to room temperature. Flour 587, the coarsest flour, was a lot lower than any other flours in terms of Firmness and Adhesiveness (See Table 8). Obviously, it is because the flour has particles too big to be gelatinised and it has very soft gel. Besides, the statistical analysis didn’t show the difference between other flours because of the domination of Flour 587. The analysis should be tried again when Flour 587 is removed. The statistical analysis did show that Flour 580 was significantly different from Flour 594 in term of firmness.

-9-
Table 7. Comparison of long and medium grain rice flours.
Long grain Jasmine rice Flour 594
L* 93.93 94.29 94.7 a* -0.33 -0.5 -0.28
Col
our
b* 5.48 4.87 4.67 Moisture
(%) 13.5-14.5 13.5-14.5 13.5-14.5
Ash (%)
0.51±0.22 --- 0.47±0.26
Protein (%)
6.7 --- 6.7
Oil (%)
0.9 --- 0.7 Che
mic
al
Ana
lysi
s
Amylose (%)
20-22 --- 18-20
*The colour analyser gives a three-dimensional reading for colour. The axis used are L* (black/red), a*(green/red) and b*(blue/yellow). Each scale ranges from –100 to +100.
Figure 3 indicates that the gel from finer flour with lower amylose content was harder than that from the coarse flour with higher amylose content. It is shown in Figure 4 that rice gel from medium grain had less adhesiveness than that from long grain rice. However, it seems that the particle size and amylose content within a certain range are not the key factors on the firmness and adhesiveness (See Table 8). Further statistical analysis should be performed to confirm this point.
Figure 3. The comparison of commercial rice flour on the firmness of rice gel
Figure 4. The comparison of commercial rice flour on the adhesiveness of rice gel
Table 8. The texture analysis data on commercial rice flours in RCL Rice flour Firmness
(g) Adhesiveness (g x s)
Flour 587 61.8 ± 1.0 7.6 ± 9.2 Flour 580 22.6 ± 1.6 161.5 ± 6.3 Flour 584 23.9 ± 1.1 158.9 ± 7.1 Flour 578 23.5 ± 0.8 155.0 ± 4.5 Flour 594 23.9 ± 1.0 158.9 ± 8.8
20.00
21.00
22.00
23.00
24.00
25.00
Flour 580 Flour 578 Flour 584 Flour 594
Rice flour gel
Firm
ness
(g)
150.00
152.00
154.00
156.00
158.00
160.00
162.00
Flour 580 Flour 578 Flour 584 Flour 594
Rice flour gel
Adh
ensi
vene
ss (g
.s)

-10-
3.3.2 The effect of varieties on the texture of rice gel On the adhesiveness, the statistical analysis showed that the only significant differences were that medium grain was more adhesive than Doongara, Jasmine and Arborio. The firmness of Doongara was significantly higher than any variety in the trial. Arborio was significantly firmer than all other varieties except Doongara. Jasmine and medium grain were both significantly firmer than Koshihikari and long grain. Therefore, the variety difference seems to be more important than amylose content affecting the texture of rice gel.
Figure 5. The comparison of rice gel on the firmness and adhesiveness from different rice varieties.
Table 9. The texture analysis data on rice flours from different varieties Rice flour Firmness
(g) Adhesiveness
(g x s) Long grain 29.5 ± 1.5 174.9 ± 17.3
Jasmine 32.3 ± 1.5 160.7 ± 16.5 Doongara 71.0 ± 3.2 157.2 ± 23.9
Medium grain 33.4 ± 1.4 186.7 ± 15.6 Arborio 41.6 ± 1.7 157.3 ± 26.9
Koshihikari 29.4 ± 1.5 169.8 ± 13.3
0.0
20.0
40.0
60.0
80.0
100.0
120.0
140.0
160.0
180.0
200.0
Long grain Arborio Jasmine Doongara Medium grain Koshi
Rice flour
Firm
ness
or A
dhen
sive
ness
Firmness (g)
Adhensiveness (g.s)

-11-
B : Blending of Rice Varieties. The aim of this portion is to closely look at the different rice varieties currently grown and determine their suitability for blending into medium grain rice flour which is typically made up of a mixture of medium grain rice cultivars although Amaroo is the main variety currently grown. The rices assessed include;
1. Small brokens 2. Arborio 3. Opus 4. Koshihikari
The rice flours were blended to various percentage portions to allow for a full evaluation. The selected blends were 20, 40, 60, 80 & 100 percent with all varieties being analysed and compared to that of the “normal” medium grain rice flour. 4. Objectives 4.1 Long grain v’s medium grain The purpose of this project is to do a direct comparison between long grain and medium grain rice flour that has been milled to a fine long grain flour specification. This will allow us to determine the suitability of using medium grain as a substitute for long grain for our rice flour process. The other purpose for this project is to analyse several different samples of the medium grain flour to aid in the production of specifications and also to gain more insight into our flour mill capabilities. 5. Methodology The initial steps of the projects were to source the different rice flours and prepare them for analyses. The analyses were conducted by a trained and experienced operator and the majority of analyses were conducted by the same operator to ensure result integrity. The various rice flour and their blends were subjected to a large range of analyses and these are set out below in Table 10.

-12-
Table 10. Analyses and their descriptors
Ash AOAC 923.03 (32.1.05, 16th edition, 4th revision) This determines the amount of mineral residue remaining after incineration at 5500C of organic matter. Applicable to cereals. Moisture AACC Method 44-15A, 10th edition This method determines the moisture content as loss in weight of a sample when heated under specified conditions (1300C for 1 hour). Applicable to flour, grain, and for samples containing <13% moisture. Protein (dumas) N x 6.25
Leco Manuals AOAC 990.03 (4.2.08), 992.15 (39.1.16), 992.23 (32.2.02), 16th edition, 4th revision.
This method determines the Nitrogen released at high temperature into pure Oxygen and detected by thermal conductivity. This method is applicable to meat products (including pet foods) with 10-20% Protein, cereal grains, solid feeds and oilseeds containing >1% Protein. Oil AACC 30-25 modified
Modifications: Hexane replaces petroleum ether. Analysis performed on as ‘as is’ basis. Analysis time increased to 6 hours. Table 1 values used.
This method determines the substances (crude fat) extracted by hexane. Colour Chroma Meter CR –310 Instruction Manual To obtain a numerical value to represent colour as a product quality factor. The result is measured in L*a*b*. Where L* refers to Lightness, a* is the red/green, and b* is the yellow/blue. RVA (Rapid Visco Analyser)
AACC Method 61-02, 10th edition. RVA Japanese Rice Method, Newport Scientific
This method is applicable to milled rice. An aqueous suspension of ground sample is prepared in the disposable canister and placed into the instrument, which simultaneously heats and stirs the contents. The starch in the heated sample gelatinises and forms a paste, with consequent increase in viscosity, which is continually monitored. The maximum viscosity during heating (peak viscosity), minimum viscosity after the peak, and final viscosity provide an indication of the pasting properties of the sample and hence it’s processing value for different purposes. It also describes modifications used by the Food Agency in Japan to provide longer run times to better discriminate between rice samples. Sieve Internal SunRice Method (Analytical Laboratory) This method describes the procedure to be used for sieve analysis. Water Absorption Capacity
Tsai et al (1998) adapted to rice flour from meat. Method report Yu Pan, March 2001.
The analyses were conducted to allow us to gather data on all samples in all areas of the project in an aim to be able to quantitatively identify any varietal difference and also assist in identifying any potential processing issues.

-13-
6. Results and data 6.1 Blending of rice varieties and the effect on performance
Table 11. Chemical results for unblended flours
Rice flour Blend % Moisture
% Protein
% Oil
% Ash Water* L a b
100% Medium Grain 12.9 7.58 0.44 0.38 2.27 94.61 -5.16 9.92 100% Small Brokens 13.4 7.67 1.04 0.61 2.15 93.75 -5.17 11.13 100% Arborio 13.2 7.58 0.37 0.36 2.48 95.03 -5.01 9.62 100% Opus 13.3 6.79 0.64 0.33 2.45 94.70 -5.21 10.13 100% Koshihikari 13.1 6.67 0.37 0.35 2.40 95.14 -5.17 9.75
* Water hydration capacity is the maximum amount of water, which a 1g sample will retain after filtering. The chemical analyses conducted indicated that there is very little difference between the five rice flour variants analysed. The main difference detected was between medium grain and small brokens with the results for the small brokens found to be higher than that of the medium grain. The small brokens also had a 1 point lower level in the “L” value for colour. This indicates that the small brokens were slightly yellowier than the medium grain. For the short grain rices the protein level was found to be slightly lower than that of the medium grain and the long grain varieties. 6.1.1 RVA analysis There are some anomalies within the RVA results with some results of the blends being found to be slightly out of the limits set by the 100% samples analysed. This could be attributed to the difference within the samples at preparation with the results of the sieve analyses showing that the particle size distribution is different for all varieties with some whole grains being detected in the Arborio. For the purpose of determining significance, a cross section of production samples were analysed and used in the review step. These samples showed a wide variation in results obtained and allowed for easier interpretation of significance. 6.1.1.1 Small brokens
Graph 1. Rice flour blends of small brokens with M/G

-14-
The results indicate that there is a difference between Small brokens and Medium Grain rice flour. This difference is quite significant even when comparing the results to that of 594 rice flour analysed over an extended period of time. The RVA graph is lower at all points on the graph. The RVA curve is much lower for the small brokens but the difference is minimised once blended with the 40/60 blend falling into the min/max specification of the 594 production samples. These results were also reflected in the Japanese RVA analyses. 6.1.1.2 Arborio
Graph 2. Rice flour blends of Arborio with M/G
It is easily seen from the RVA data collected from the medium grain flour, Arborio flour and their blends that under the conditions of the test, the flour of each is very similar. With the results of the project samples generally falling in between the limits of the min/max of the production samples. 6.1.1.3 Opus
Graph 3. Rice flour blends of Opus with M/G
At the 100% blends the two different products perform similarly but with the Opus producing higher results in the Peak 1 and breakdown sections of the analyses. However, once blended the results for the RVA are once again altered and the differences minimised.

-15-
6.1.1.4 Koshihikari Graph 4. Rice flour blends of Koshihikari with M/G
Although there is a slight difference between the 100% samples, the blends results indicate that there is very little difference between the medium grain product and the koshi/medium grain blend. Overall there is little difference between medium grain and the other varieties analysed, with any of the differences being minimised during blending. The results reflect a similarity in performance in the analyses conducted. 6.2 Blending of rice varieties and the effect on performance 6.2.1 RVA analyses For the purpose of determining significance, a cross section of production samples were analysed and used in the review step. These samples showed a wide variation in results obtain and allowed for easier interpretation of significance. These results are displayed in each of the Tables 12 and 13 as the Average, Min, and Max sections of the tables. This data has been highlighted for ease of reading.
Table 12. RVA Data for 594 blends
Peak 1 Trough 1 Breakdown Final Visc Setback Peak time
Pasting temp
RB22 243 137 105 230 93 6.0 75 RB23 244 146 98 240 94 6.1 83 RB24 238 147 92 240 93 6.1 83 RB25 255 160 95 254 94 6.2 74 RB26 256 156 101 251 96 6.1 77 RB27 256 151 106 247 96 6.1 78 Average 256 151 105 262 111 6.2 70 Max 289 173 141 291 123 8.9 74 Min 222 132 75 231 92 5.8 69
Although the RVA raw data results do differ from one sample to the next, when compared to that of the 594 cross section it can easily be determined that the differences seen are present in unblended samples. The 594 results used in the analyses (Table 12) are a cross section of production samples. These results allow us to determine that the blending does not appear to have a major effect upon the performance of the 594 rice flour, with the majority of results lying between that of the production min/max. Any difference could directly be attributed to the differing particle size distribution of 594 rice flour and the blends (see Table 14).

-16-
Results from the Japanese RVA reflect similar results, with the blending of the two products not seemingly having a great effect on the product performance at this level of blending.
Table 13. RVA data for 578 blends
Peak 1 Trough 1 Breakdown Final Visc Setback Peak time
Pasting temp
RB28 220 152 69 235 84 6.2 88 RB29 221 146 75 231 86 6.1 88 RB30 218 145 74 232 87 6.1 86 Average 224 137 87 244 106 6.0 85 Max 256 156 117 268 116 6.2 96 Min 198 124 61 218 64 5.7 71
As with the 594 rice flour the blending of the 578 with 580 does not appear to have a major effect upon product performance. This is once again demonstrated by the blend results falling in between that of the min/max results set by the production samples (Table 13).
Table 14. Sieve results 594 212 150 Through
SunRice Specification - 594 <5 35-55 40-60
RF Blend 594/10% 580 RB22 10.9 34.9 54.2 RF Blend 594/20% 580 RB23 15.9 33.7 50.4 RF Blend 594/25% 580 RB24 20.3 33.3 46.5 RF Blend 594/10% 584 RB25 3.0 33.5 63.5 RF Blend 594/20% 584 RB26 3.4 30.1 66.5 RF Blend 594/25% 584 RB27 3.4 27.8 68.8
The results show that the blending has a very large impact on the sieve results and subsequent specification. Even at the 10% blending the product is no longer within specification for both the 580 and 584 rice flours. These results indicate that unless blending is done prior to sieve this blending will not result in a product that is within specification. If product is sieved after blending to allow for the “differences” between the two flour types then all other results indicate that blending does not significantly alter the products performance.
Table 15. Sieve results 578 500 425 212 Through
SunRice specification - 578
<5 10-30 40-60 15-35
04-6008 RF Blend 578/10% 580 RB28 3.2 21.7 43.9 30.5 04-6009 RF Blend 578/20% 580 RB29 3.7 21.2 46.4 27.8 04-6010 RF Blend 578/25% 580 RB30 4.6 22.0 47.2 25.4
The sieve results indicate that the blending of the 578/580 does indeed change the particle size profile of the sample. However this change is not significant as all three blends still meet the processing/customer specifications. The only sample that may cause some concern is the 25% 580 sample as it does not allow for dramatic changes. If the blending was to be done at this rate it may cause product to become out of specification and would need to be monitored to ensure compliance. It is recommend that the lower blending ratio be adopted in this case to ensure minimal product be non-compliant.

-17-
6.3 Long grain v’s medium grain
Table 16. Chemical analyses
Description Moisture Protein Oil Ash Water Ab L a b
584 M/G - 1a 12.0 7.3 0.6 0.6 1.3 94.50 -5.24 10.20 584 M/G - 2a 12.2 7.0 0.6 0.6 1.2 94.74 -5.24 10.09 584 L/G - 3a 10.8 8.4 0.6 0.6 1.3 94.77 -5.15 9.95 584 L/G - 4a 12.5 8.7 0.5 0.6 1.3 94.69 -4.98 9.79 594 L/G - 5a 12.8 7.1 0.5 0.5 1.3 94.30 -5.24 10.43
Chemically the two rice varieties are not that different when analysed for the above analyses. The most significant difference is related to the amount of detectable protein in the different rice varieties which is an expected result. All other results recorded were very similar in their findings. Water absorption rate as compared to most other varieties of flour milled to this specification is very similar. The results we have obtained in the chemical analyses are to be expected due to the initial milling process removing the hull and excess bran layer and therefore minimising any chemical characteristics. The rice flour milling process is more indicative for the colour measurements due to the refraction from different particle sizes. Due to the samples being very similar in their sieve analyses results, similar results would be expected. If one sample was grossly course then the colour reading would start to differ. Colour is a good indicator of particle fineness but can not ever be as accurate as sieving as it is only an indicative analyses. 6.3.1 RVA (Rapid Viscosity Analyses) All samples were analysed by a method referred to as an RVA. This method allows us to receive data when the rice flour is heated. The sample gelatinises and forms a paste, with consequent increase in viscosity, which is continually monitored. The maximum viscosity during heating (peak viscosity), minimum viscosity after the peak, and final viscosity provide an indication of the pasting properties of the sample and hence it’s processing value for different purposes.
Graph 5. Medium and long grain comparison

-18-
Table 17. Results for RVA analyses
Peak 1 Trough 1 Breakdown Final Visc Setback Pasting temp 584 M/G RVA 273.8 151.4 122.4 273.6 122.2 69.7 584 L/G RVA 223.9 142.7 81.8 258.7 116.0 77.4
The graph and results indicate that the performance of the different varieties differs at the initial peak and breakdown. When the setback and trough are considered in both the medium and long grain samples the results we see are very similar. The similarity of ending points and also the difference with the initial peaks indicates that depending on the crucial point in a processing plant the two rice varieties in regards to viscosity can be substituted in some cases. 6.3.2 Sieve Samples were provided from Leeton Mill QA team. The sample received underwent a sieve analyses to determine if the different varieties milled within specification
Table 18
584 L/G Specifications 150 Through
12% Max 88% Min
584 M/G - 1a 44.7 55.3 584 M/G - 2a 41.3 58.7 584 L/G - 3a 49.6 50.4 584 L/G - 4a 48.7 51.3
6.3.3 Particle size comparison
Table 19. Medium grain RVA results
Peak 1 Trough 1 Breakdown Final Visc Setback Peak time Pasting temp Peak temp 45 254.3 132.8 121.5 261.2 128.4 6.0 69.7 95.0 90 250.7 132.8 117.8 256.8 124.0 6.0 70.6 95.0 106 267.4 151.2 116.3 278.3 127.2 6.0 69.6 95.0 125 278.9 163.0 115.9 287.3 124.3 6.1 70.4 95.0 150 288.1 165.2 122.9 286.5 121.3 6.0 69.6 95.0 180 260.0 150.4 109.6 274.0 123.6 6.0 70.5 95.0 212 245.9 151.1 94.8 266.9 115.8 6.1 69.7 95.0 250 269.8 154.4 115.4 278.9 124.5 6.0 70.5 95.0 300 220.7 137.7 83.0 253.6 115.9 6.0 84.6 95.0

-19-
Table 20. Long grain RVA results
Peak 1 Trough 1 Breakdown Final Visc Setback Peak time Pasting temp Peak temp 45 214.8 133.3 81.6 249.1 115.8 6.3 75.2 95.0 90 214.1 133.0 81.1 249.4 116.4 6.3 76.0 95.0 106 220.3 149.1 71.3 261.4 112.3 6.5 76.0 95.0 125 216.2 139.7 76.5 253.4 113.8 6.3 76.0 95.0 150 212.9 140.6 72.3 251.3 110.8 6.3 77.0 95.0 180 208.1 144.9 63.2 251.3 106.3 6.3 78.5 95.0 212 200.8 128.8 7.9 238.3 109.4 6.1 88.6 95.0 250 187.0 121.4 65.6 229.0 107.6 6.0 87.9 95.0 300 126.9 101.1 25.8 203.3 102.2 6.1 91.1 95.0
7. Discussion 7.1 Blending of rice varieties and the effect on performance The results of part one of this study indicate that the blending process has little or no effect on the performance of the flour in analyses conducted. The only exception to this is with the blending of the small brokens. The results for the small brokens show a difference between the M/G rice flour and that of the blended flours. These results allow us to conclude that the blending of the small brokens can be done without affecting performance but the ratio at which it is blended must be controlled. For the other varietal blends the effect of blending is minimal so we can conclude that the blending can be performed at the maximum level in the study. 7.2 Long grain v’s medium grain Based on the results obtained in this project and with the samples provided, recommended specification data is below.
Table 21 584 Long Grain 584 Medium Grain Moisture 10.8 – 12.5 12.0 - 12.2 Protein 8.4 – 8.7 7.0 – 7.3 Oil 0.6 0.6 Ash 0.6 0.6 Water Absorption 1.2 – 1.3 1.2 – 1.3 L 94.69 – 94.77 94.50 – 94.74 a 4.98 - 5.15 (negative) 5.24 (negative) b 9.79 – 9.95 10.09 – 10.20 Peak 1 202.8 - 247.1 269.7 – 278.6 Trough 1 125.5 - 165.5 146.4 - 155.6 Breakdown 72.7 - 94.0 117.6 - 128.3 Final Visc 236.1 - 282.8 267.9 - 277.8 Setback 109.2 - 123.6 121.5 - 123.4 Pasting temp 76.8 - 78.6 68.9 - 70.7

-20-
7.3 Particle size comparison The water absorption analyses were conducted using a 1 gram sample with excess amounts of water added and was incubated at 25 degrees (room temperature). All flour fractions, including both long grain and medium grain performed very similarly. The largest difference noted between all samples analysed was 0.26. This difference is very minimal and demonstrates that at room temperature the flours ability to absorb water is either enhanced or worsened by particle size variation. However the difference is easily seen when the RVA analyses is performed. It allows us to comprehensively see the differences between the rice fractions as well as the varietal differences. The differences between varieties of rice are clearly shown in the peak 1 area of both the variety and also the rice fractions. This indicates that upon heating the rice flour has very different properties when comparing long grain to medium grain and also when comparing the same variety with a differing particle size. The most significant difference between the analyses comes from the varietal difference. It has a different curve with both the all aspects of the curve differing. The difference with the fractions is minimised over the whole analyses. Although the difference can still be quite significant to a manufacturing process the difference can be minimised if the properties of the flour are known to be different. 8. Implications and recommendation 8.1 Blending of rice varieties and the effect on performance The results we have seen indicate that blending, to a certain point, of different rice flour types, not just looking at varieties but also looking at particles size differences could achieve results similar to the already marketed products. Both the blending of varieties and also the blending of different particle size flour can be utilised. However both need to be carefully monitored as, if the blending exceeds stated amounts, the possibility of having “out of specification” product increases. 8.2 Long grain v’s medium grain In this case the difference between the two rice varieties is really only displayed when an RVA is performed and this analyses demonstrates the similarities and differences between the two varieties. The substitution of one grain for another would have to be considered by the customer who intends purchasing the rice flour and the chemical properties that they deem important.
-21-
C: New Applications for Rice Flour – Cake mix 9. Objective “Cake mix” in this application is generally a blend of rice flour and some other ingredient/s for use in some Japanese foods. The aim of Project “Cake mix” is to analyse current methods for determining key quality attributes. Coloured specks in the rice flour are of particular importance in some applications where the rice flour cake mix is kneaded and steamed and used for human consumption with little further processing. In these foods the coloured specks are readily visible against the cream / white background of the steamed rice flour dough and are considered by potential consumers to be very unattractive and undesirable. 10. Methods Various samples over a 16 month period were collected. The samples were manually tested for specks and divided into pass and fail samples on the basis of visual count of specks. These samples range from 0 to 21 specks. A total of 55 commercially milled rice flour samples were collected. 10.1 Manual measurement of spot counts (visual assessment). Rice flour or rice flour based cake mix was mixed with hot water and formed into dough, steamed, cooled in water, hand kneaded into a steam dough piece and pressed flat. The dough was then visually examined for specks and these counted. The spot detection method will be done internally using the Cake mix and a Japanese cook method. The samples were tested in triplicate. 10.2 Instrumental measurement of specks. In the wheat flour industry there is a focus on the brown spots in wheat flour that are indicative of the amount of bran in the flour. Specks in wheat flour can be counted using a commercially available instrument called a Branscan. This instrumental analysis is now used in the place of much more subjective and laborious visual analyses. The Branscan is an image analysis system designed to measure the appearance of specks in flour. The dry flour is placed on a tray that spreads the flour sample over a standard area that is then pressed against a glass plate. Above the glass plate is a camera, which takes 22 different, images or shots of the flour sample, these images do not overlap. Each image is analyzed using software to differentiate specks based on colour contrast to the flour. For each image a Branscan value is calculated which gives the total area of the specks for that image and it also counts the number of specks. 10.3 Measurement of the gelatinisation properties The gelatinisation properties of the cakemix was determined by the RVA (Rapid Visco Analyser, Model RVA-3D+, Newport Scientific Australia), which has been widely used throughout the rice and wheat industry for many years in determining the gelatinisation properties of various samples.

-22-
The samples were tested using the Rapid Rice Method (AACC Method 61-02) where the heating temperature used was 95oC. This is the standard method used across the industry for rice flour. This method was also chosen as it reflects the amount of heat required for the cakemix process. The profile is listed in Table 22.
Table 22. RVA Profile Time Type Value 00.00.00 Temp 50oC 00.00.00 Speed 960 rpm 00.00.10 Speed 160 rpm 00.01.00 Temp 50oC 00.04.48 Temp 95oC 00.07.18 Temp 95oC 00.11.06 Temp 50oC Idle Temperature: 50 +- 1oC End of test: 12 min 30 sec
Time between readings: 4 sec 10.4 Texture analyses on the cakemix The texture analysis was conducted on the texture Analyser (TA-XT2I) using the Texture Expert Exceed software. The gel was tested in the RVA canisters after they were processed and cooled. The program specifications used are listed in the Table 23.
Table 23. Texture analyser TA-XT2i Settings
Mode Measure Force in Compression TA Option Return to Start Pre Speed 0.5 mm/s Test Speed 0.5 mm/s Post-test Speed 0.5 mm/s Test Distance 10 mm Trigger Value 4.0 g Data Acquisition Rate 200 pps Load Cell 5 kg Accessory (Probe) Software Stable Micro Systems – Texture expert Exceed
10.5 Colour analysis on cakemix flour and cakemix dough The colour analysis was performed using the Minolta Colour Meter (Chroma Meter CR-310). This is used to obtain a numerical value to represent colour as a product quality factor. The Colour Analyser gives a three-dimensional reading for colour. The result is measured in L*a*b*. Where L* refers to Lightness, this scale is from 0 (black) to 100 (white). a* is the red/green, and b* is the yellow/blue. These two scales range from –100 to +100. Work Instruction 4.10.1.01.001.507.

-23-
11. Results 11.1 Chemical analyses The chemical analyses determined during the course of the project showed that there was very little difference between the samples analysed (Table 24).
Table 24. Chemical analyses results WAbs
25oC WAbs 70oC
Moisture % Protein
% Protein (dsb)
% Ash % Oil
Average 1.25 3.20 12.2 6.18 7.03 0.53 0.37 Minimum 1.05 2.46 11.6 5.56 6.33 0.17 0.16 Maximum 1.39 3.90 12.7 6.67 7.56 1.20 0.82 Difference 0.34 1.44 1.10 1.11 1.23 1.03 0.66 • WAbs – Water Absorption The results that were obtained had very little difference and this small difference could easily be attributed to the differences in starch content of the cakemix samples. This difference although small can help us understand how the product could perform differently depending upon the process for which it is used. Although we did not actually analyse the samples for their % rice flour content there is a method available to determine the variability in the samples. This method takes into account the protein and moisture of each sample and the raw material used in production. Water Absorption is the main area that demonstrates how the product’s performance could change depending upon the variability of the starch content. The water absorption in the cakemix could be considered a critical area as the cakemix is used to make dough for what the Japanese called a “cookie”. 11.1.1 Speck analyses – Japanese cook test Speck analyses conducted on the Cakemix samples were found to be variable.. The samples were analysed 4 times. These results differed quite substantially not only between the original analyses but also between the replicates conducted. This difference can be seen in Graph 6. 11.1.2 Speck analyses results
Graph 6
Japanese Cook Test
02468
10121416182022
No.
Spe
cs
Average Maximum Minimum

-24-
These results indicate the difficulty in reproducing results. The major problem that has been noted over the course of the project is the subjective nature of the analyses. There are several issues that can dramatically affect the results. These include; • The visual count of the samples can vary quite dramatically from one operator to another and
also the use of large and small specks within the specification. The question of how large is a large spot and also how big does a small spot have to be to count it as a spot. This varies quite a bit depending upon the operator.
• The question of surface area. Each operator kneads the cake differently and this results in
differing surface areas when the count is obtained. Two laboratory members were observed analysing samples, one squashed the cake quite flat to maximise the surface area whereas the other counted on a sample that was ball-like. The differing surface areas could be said to affect the results quite dramatically.
11.1.2.1 Speck analyses – BRI (Branscan) Samples analysed at BRI were mainly performed as a single analysis due to the cost involved. However some samples were analysed in triplicate to aid in better understanding the performance of the Branscan. The comparison between the manual Japanese cook method and the instrumental method proved to be quite hard due to the difference between the two methods. To better understand the results obtained the correlation between the manual method results and the instrumental method results were calculated. This is shown in Table 25.
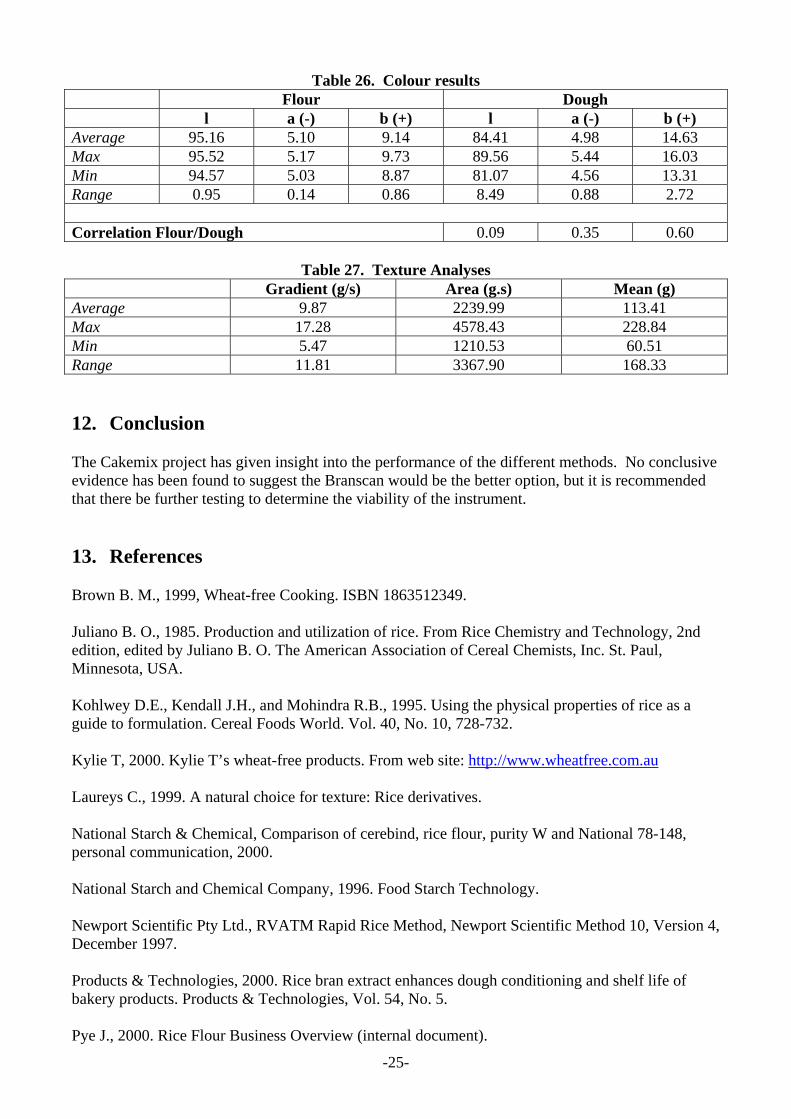
Table 25. Correlation results Japanese Cook Method (manual) R2 (a/b) R2 (a/c) R2 (a/d) R2 (b/c) R2 (b/d) R2 (c/d) Correlation 0.68 0.54 0.38 0.59 0.58 0.38 Branscan Method (instrumental) R2 (a/b) R2 (a/c) R2 (b/c) Correlation 0.82 0.98 0.87 Japanese Cook v’s Branscan R2 (SR/BRI) Correlation 0.37 11.2 Colour results The colour of both the flour and the dough was tested to determine if there was any link to the colour of the flour to the colour of the end product. This was determined not to be the case as the correlation between the two samples was low <0.10. The colour results can be seen in Table 26.
-25-
Table 26. Colour results Flour Dough l a (-) b (+) l a (-) b (+)
Average 95.16 5.10 9.14 84.41 4.98 14.63 Max 95.52 5.17 9.73 89.56 5.44 16.03 Min 94.57 5.03 8.87 81.07 4.56 13.31 Range 0.95 0.14 0.86 8.49 0.88 2.72 Correlation Flour/Dough 0.09 0.35 0.60
Table 27. Texture Analyses Gradient (g/s) Area (g.s) Mean (g)
Average 9.87 2239.99 113.41 Max 17.28 4578.43 228.84 Min 5.47 1210.53 60.51 Range 11.81 3367.90 168.33 12. Conclusion The Cakemix project has given insight into the performance of the different methods. No conclusive evidence has been found to suggest the Branscan would be the better option, but it is recommended that there be further testing to determine the viability of the instrument. 13. References Brown B. M., 1999, Wheat-free Cooking. ISBN 1863512349. Juliano B. O., 1985. Production and utilization of rice. From Rice Chemistry and Technology, 2nd edition, edited by Juliano B. O. The American Association of Cereal Chemists, Inc. St. Paul, Minnesota, USA. Kohlwey D.E., Kendall J.H., and Mohindra R.B., 1995. Using the physical properties of rice as a guide to formulation. Cereal Foods World. Vol. 40, No. 10, 728-732. Kylie T, 2000. Kylie T’s wheat-free products. From web site: http://www.wheatfree.com.au Laureys C., 1999. A natural choice for texture: Rice derivatives. National Starch & Chemical, Comparison of cerebind, rice flour, purity W and National 78-148, personal communication, 2000. National Starch and Chemical Company, 1996. Food Starch Technology. Newport Scientific Pty Ltd., RVATM Rapid Rice Method, Newport Scientific Method 10, Version 4, December 1997. Products & Technologies, 2000. Rice bran extract enhances dough conditioning and shelf life of bakery products. Products & Technologies, Vol. 54, No. 5. Pye J., 2000. Rice Flour Business Overview (internal document).

-26-
Sage V Foods, 2000. From web site: http://www.sagevfoods.com Shih F and Daigle K. 1999. Oil uptake properties of fried batters from rice flour. J. Agric. Food Chem. 47, 1611-1615. Tsai S., Unklesbay N., Unklesbay K. and Clarke A., 1998. Water and absorptive properties of restructured beef products with five binders at four isothermal temperatures. Lebensm. -Wiss. u.-Technol., 31, 78-83.