RICARDO RAMIREZ ASSOCIATE PROFESSOR UNIVERSITY OF NOTRE DAME Transforming Politics, Transforming...
36
RICARDO RAMIREZ ASSOCIATE PROFESSOR UNIVERSITY OF NOTRE DAME Transforming Politics, Transforming America: Emerging Representatives
-
Upload
albert-norman -
Category
Documents
-
view
216 -
download
0
Transcript of RICARDO RAMIREZ ASSOCIATE PROFESSOR UNIVERSITY OF NOTRE DAME Transforming Politics, Transforming...

RICARDO RAMIREZASSOCIATE PROFESSOR
UNIVERSITY OF NOTRE DAME
Transforming Politics, Transforming America:
Emerging Representatives
Diverse Representation
What?Who?How?Why?
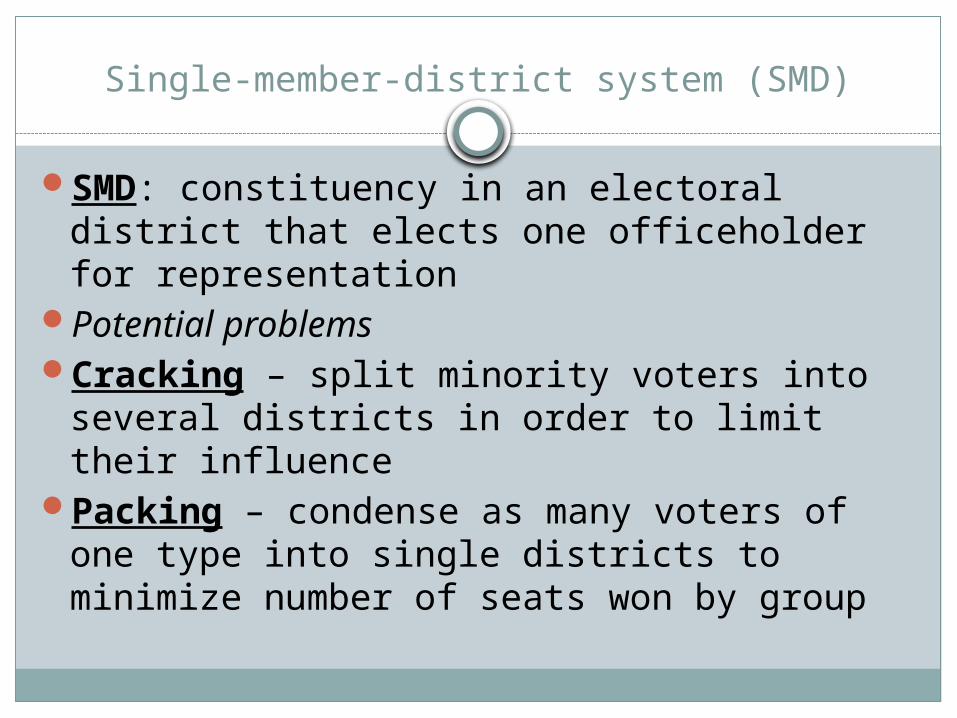
Single-member-district system (SMD)
SMD: constituency in an electoral district that elects one officeholder for representation
Potential problemsCracking – split minority voters into several
districts in order to limit their influencePacking – condense as many voters of one
type into single districts to minimize number of seats won by group

Single-member-district system (SMD)

At-large-plurality system (ALP)
Vote dilution in at-large-plurality systems is harder to identify Compared to SMD vote dilution (especially
“cracking”)How dilution worksrelies on a variety of individual behaviors depends on the relative population shares of
groupsdegree of racially polarized bloc votingminority candidates splitting the vote
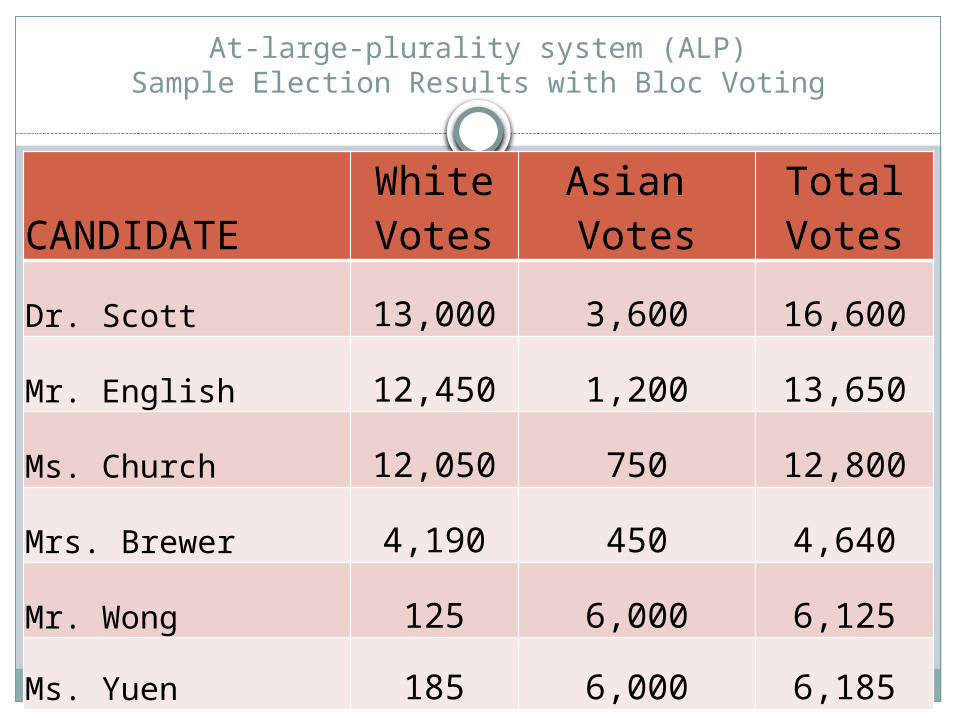
At-large-plurality system (ALP)Sample Election Results with Bloc Voting
CANDIDATEWhite Votes
Asian Votes
Total Votes
Dr. Scott 13,000 3,600 16,600
Mr. English 12,450 1,200 13,650
Ms. Church 12,050 750 12,800
Mrs. Brewer 4,190 450 4,640
Mr. Wong 125 6,000 6,125
Ms. Yuen 185 6,000 6,185

At-large-plurality system (ALP)
WhitesAfrican
Americans LatinosAsian
AmericansCitizen (among adults) 98 94 63 68Registered (among citizen) 74 70 59 55Turnout (among registered) 90 93 84 86Political contributor 13 8 5 13Contact government official 21 11 9 9
Community work 30 27 21 21
Municipalities with Mixed system: Both SMD and ALP
Most representatives elected under SMDLess representatives under ALP
What kind of system do they have in your city?How well does it work?Examples of real world problems?

Political Participation
The level of political participation among minority groups (African Americans, Latinos, Asian Americans) is affected by: Group Consciousness- The extent to which
members of each group identify with each other facilitates mobilization.
Partisanship-The level of loyalty a group has to a political party affects the rate of participation, candidate selection, and policy preferences.
Political Participation
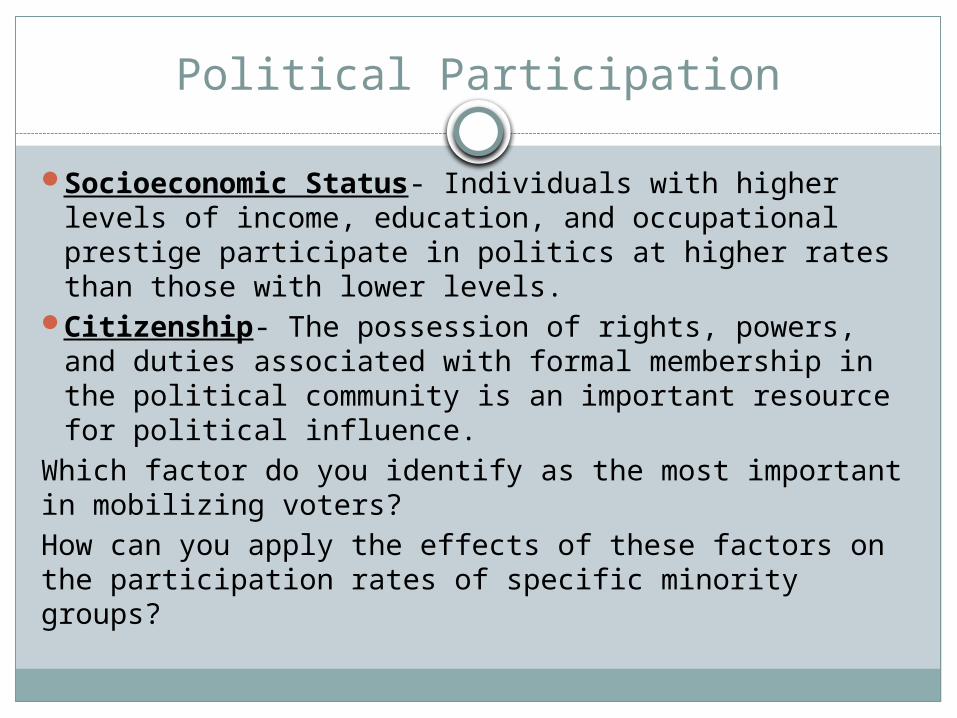
Socioeconomic Status- Individuals with higher levels of income, education, and occupational prestige participate in politics at higher rates than those with lower levels.
Citizenship- The possession of rights, powers, and duties associated with formal membership in the political community is an important resource for political influence.
Which factor do you identify as the most important in mobilizing voters? How can you apply the effects of these factors on the participation rates of specific minority groups?
Descriptive Representation
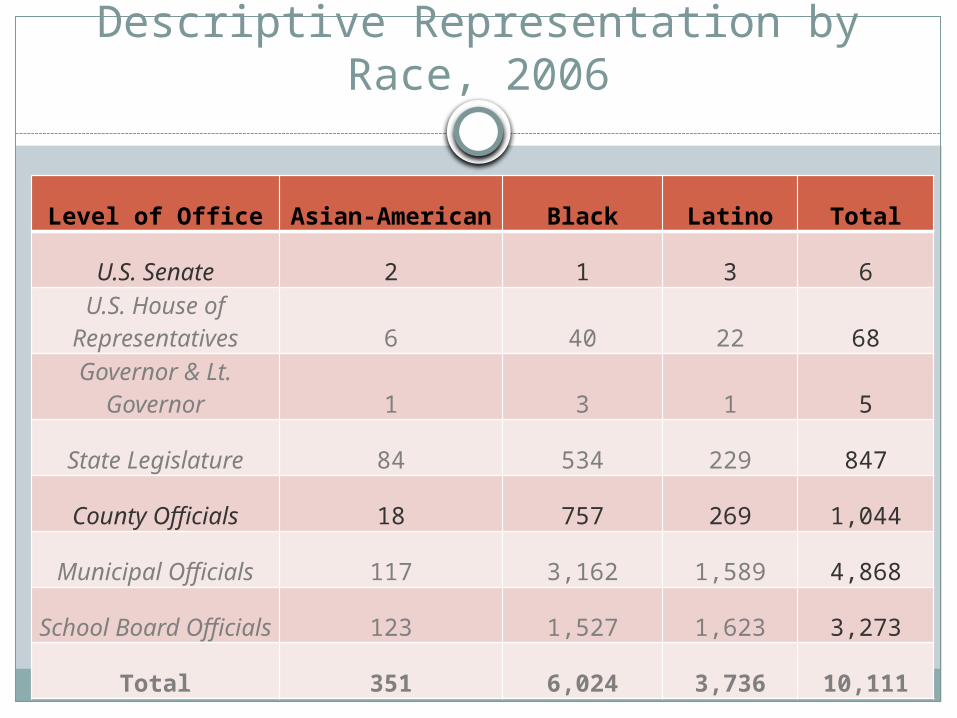
Descriptive Representation by Race, 2006
Level of Office Asian-American Black Latino Total
U.S. Senate 2 1 3 6U.S. House of
Representatives 6 40 22 68Governor & Lt.
Governor 1 3 1 5
State Legislature 84 534 229 847
County Officials 18 757 269 1,044
Municipal Officials 117 3,162 1,589 4,868School Board
Officials 123 1,527 1,623 3,273
Total 351 6,024 3,736 10,111
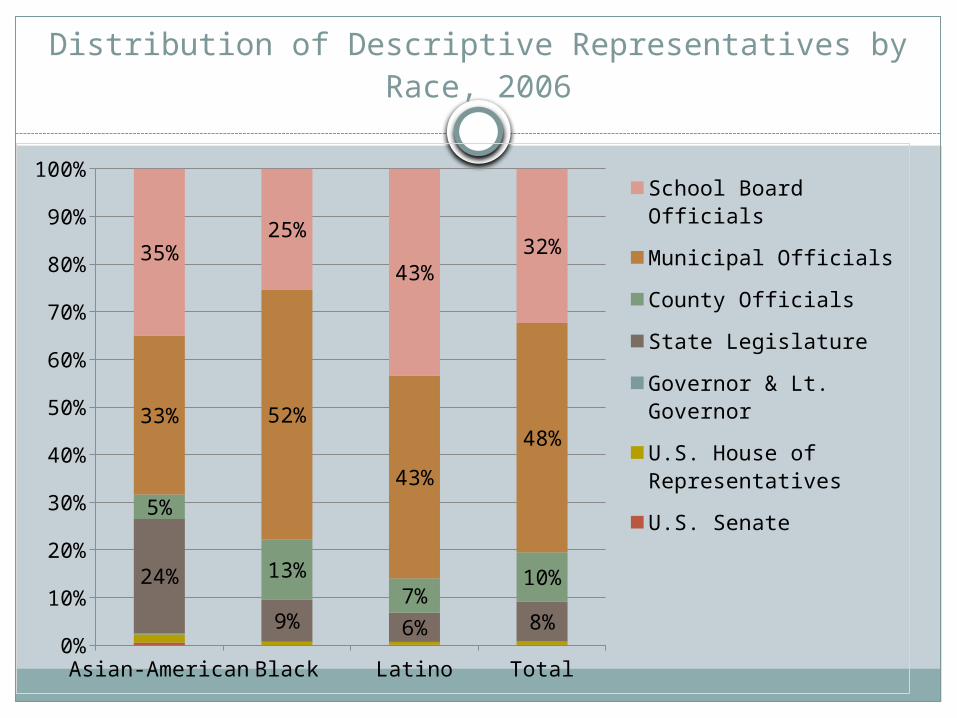
Distribution of Descriptive Representatives by Race, 2006
Asian-American
Black Latino Total0%
10%
20%
30%
40%
50%
60%
70%
80%
90%
100%
24%
9% 6% 8%
5%
13%7%
10%
33% 52%
43%
48%
35%25%
43%32%
School Board Officials
Municipal Officials
County Officials
State Legislature
Governor & Lt. Governor
U.S. House of Rep-resentatives
U.S. Senate

Race and Representation
2008 Presidential Election Obama Congress
41 Black 24 Latino 7 Asian Americans
State Legislatures 628 Black 242 Latino 85 Asian Americans

Descriptive Representation Questions
Why are African American and Latino descriptive representatives more numerous at municipal level rather than state and national legislative levels?
Asian Americans are more likely than other minority groups to be elected in districts in which other ethno racial groups constitute the majority. Why might this the case?

Descriptive Representation
Politically Consequential? Effect on political behavior
Black, White and Latino turnout
Attitudes Black political attitudes
Latino political attitudes
Trust in Government
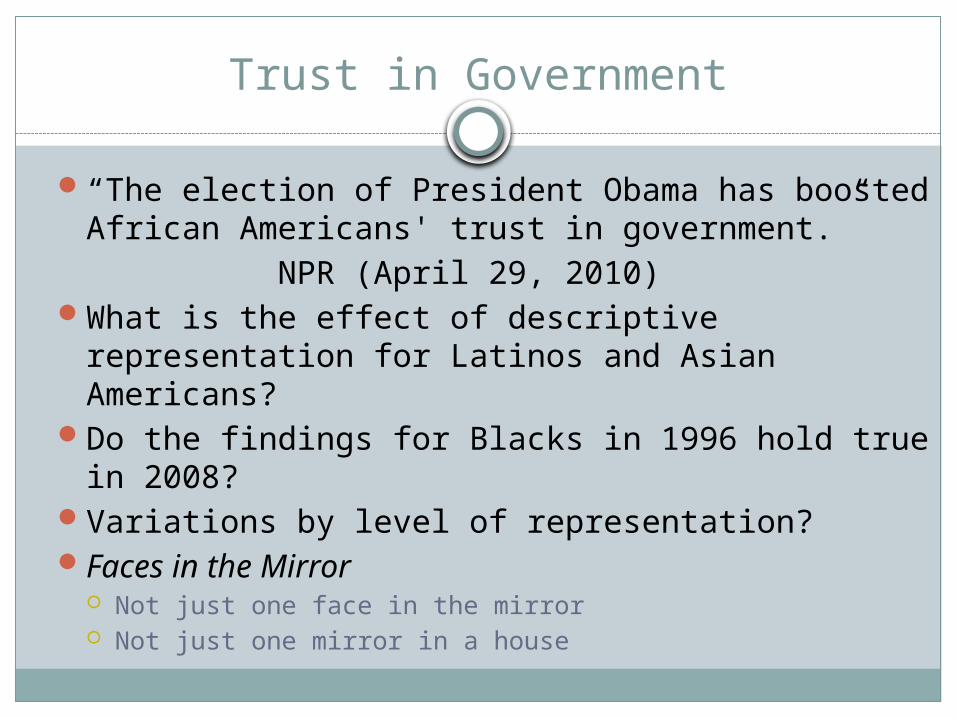
“The election of President Obama has boosted African Americans' trust in government.”
NPR (April 29, 2010)What is the effect of descriptive representation for
Latinos and Asian Americans?Do the findings for Blacks in 1996 hold true in
2008?Variations by level of representation?Faces in the Mirror
Not just one face in the mirror Not just one mirror in a house

Trust in Government
Trust in Government, a common measure in this research area.
Also control for several important factors: Substantive Representation- “Party Congruence” Party ID National Origin for Latinos/Asians Political Knowledge Nativity Income, Education, Age, Gender, “Better Off”
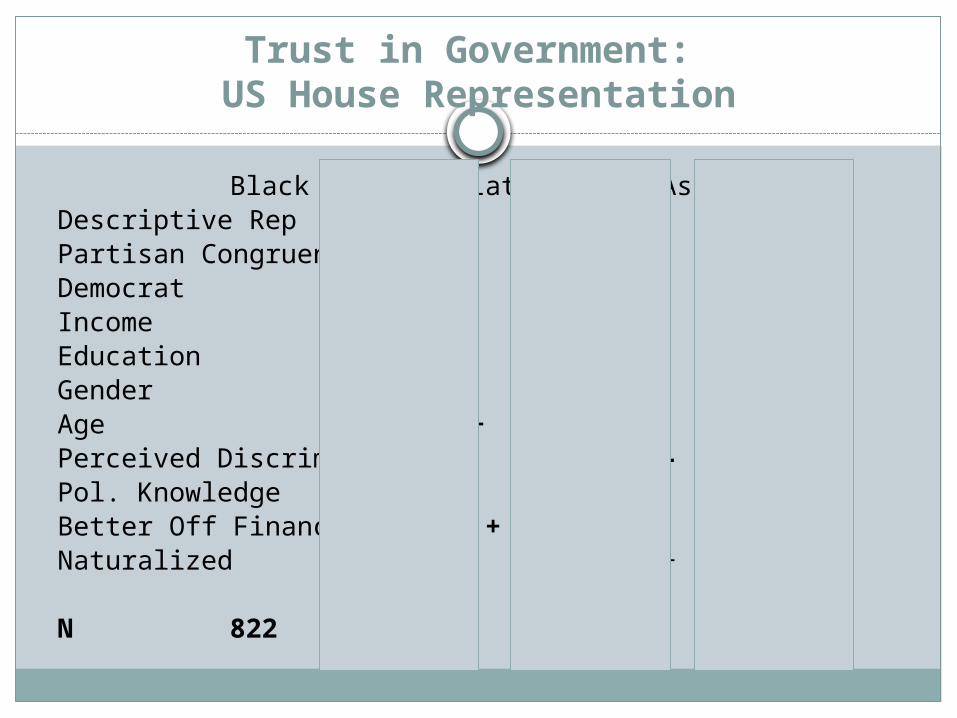
Trust in Government: US House Representation
Black Latino AsianDescriptive Rep ns + nsPartisan Congruence ns + nsDemocrat ns ns –Income ns – nsEducation ns ns –Gender ns ns –Age ns + +Perceived Discrim – – –Pol. Knowledge ns ns nsBetter Off Financially + + nsNaturalized ns + +
N 822 1264 655

Trust in Government: State House Representation
Black Latino AsianDescriptive Rep ns + nsPartisan Congruence ns ns nsDemocrat ns ns –Income ns ns nsEducation ns ns –Gender ns ns –Age ns + +Perceived Discrim – – –Pol. Knowledge ns ns +Better Off Financially + + nsNaturalized ns ns +
N 820 1193 654
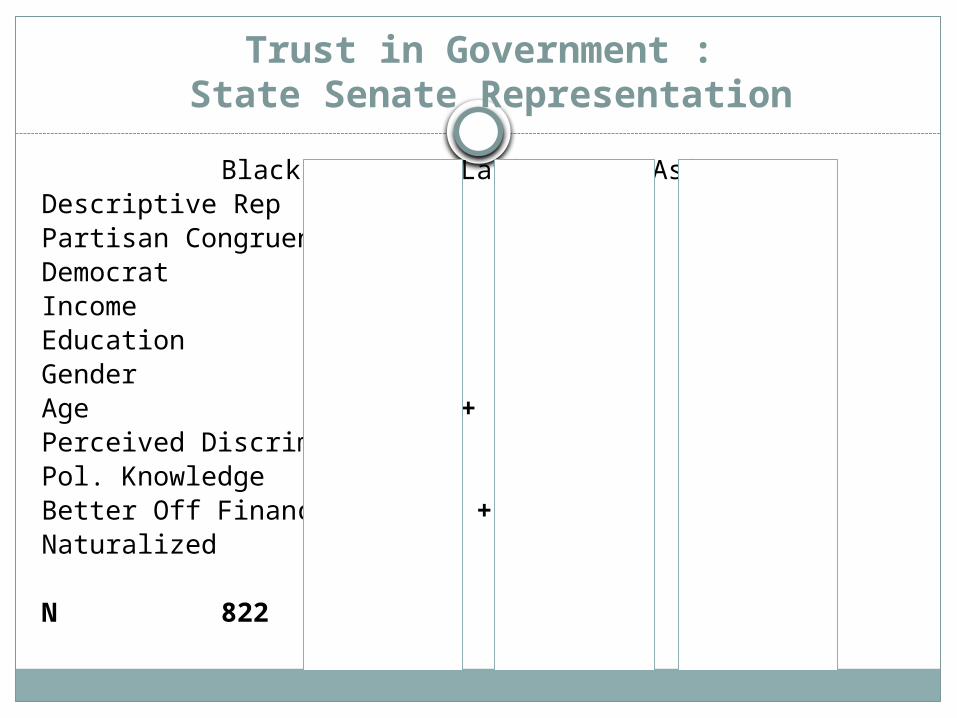
Trust in Government : State Senate Representation
Black Latino AsianDescriptive Rep ns + nsPartisan Congruence ns + nsDemocrat ns ns –Income ns – nsEducation ns ns –Gender ns ns –Age ns + nsPerceived Discrim – – –Pol. Knowledge ns ns nsBetter Off Financially + + nsNaturalized ns + +
N 822 1264 655

Does Descriptive Representation Matter?
The effects of descriptive representation on trust are most consistent among Latinos.
There are differences across different levels of representation.
Beyond “feelin’ good”:Evolution of Mobilization and its Consequences
Evolution of Mobilization Less labor-intensive
Downstream effects of shift in quality contacts
Endogenous relationship Voting and Mobilization If co-ethnic representation leads to greater participation,does co-ethnic representation lead to greater mobilization?
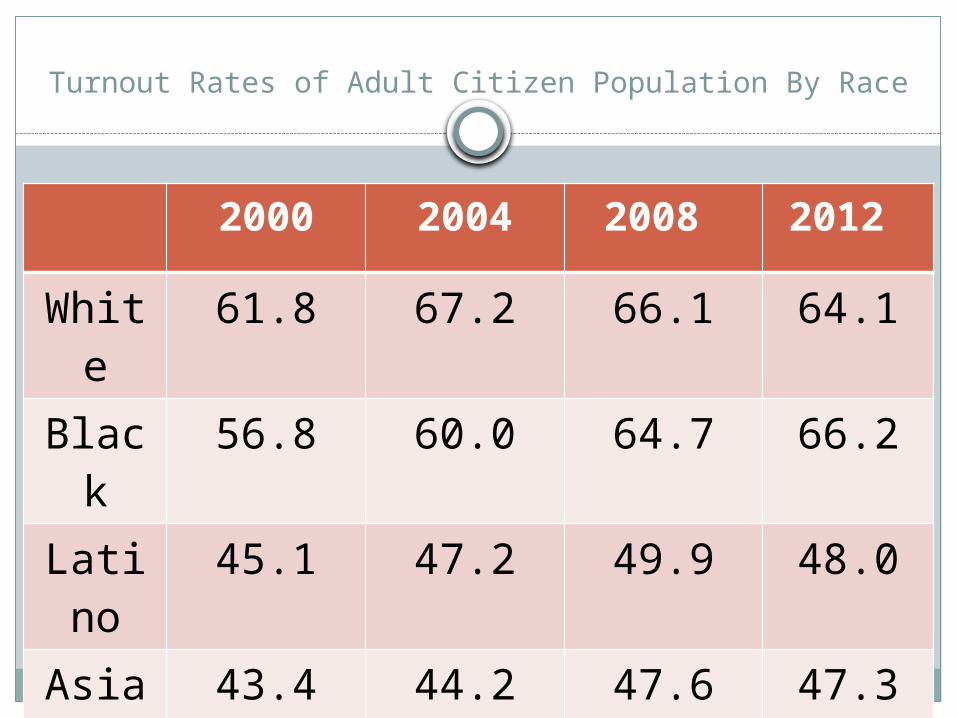
Turnout Rates of Adult Citizen Population By Race
2000 2004 2008 2012
White
61.8 67.2 66.1 64.1
Black 56.8 60.0 64.7 66.2
Latino
45.1 47.2 49.9 48.0
Asian 43.4 44.2 47.6 47.3

Race & Turnout Differences: Beyond SocioEconomic Status (SES)
Social and Political Context Group Size
Majority-Minority Districts & Turnout
Empowerment Descriptive Representation & Turnout Collective Representation & Turnout
Group Size and Empowerment
Electoral Competition
Psychological Empowering Effect of Descriptive Representation
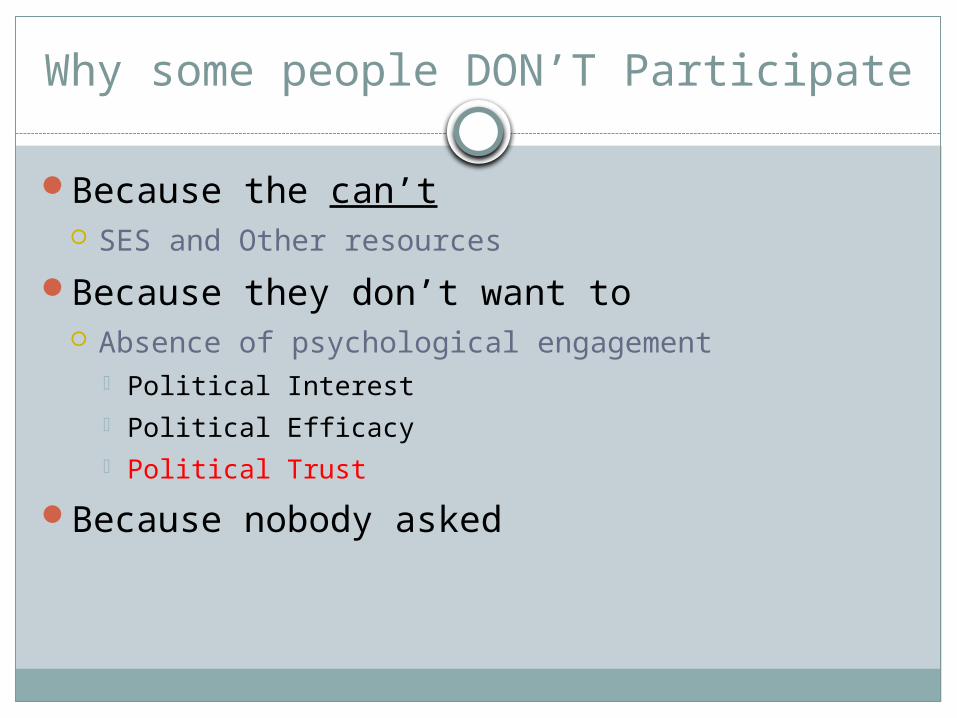
Why some people DON’T Participate
Because the can’t SES and Other resources
Because they don’t want to Absence of psychological engagement
Political Interest Political Efficacy Political Trust
Because nobody asked
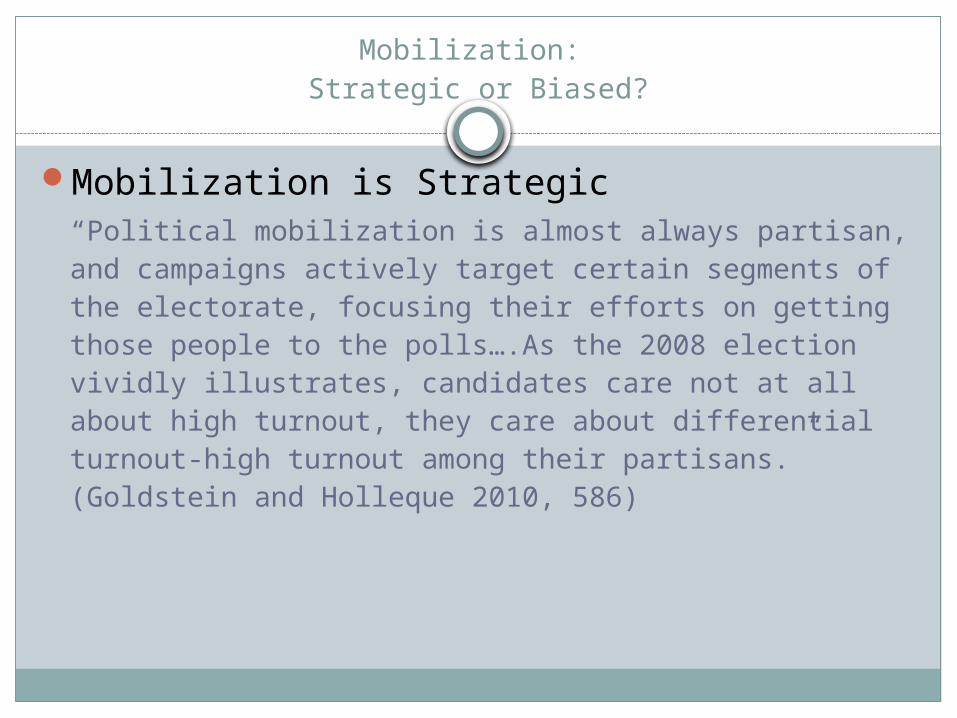
Mobilization: Strategic or Biased?
Mobilization is Strategic“Political mobilization is almost always partisan, and campaigns actively target certain segments of the electorate, focusing their efforts on getting those people to the polls….As the 2008 election vividly illustrates, candidates care not at all about high turnout, they care about differential turnout-high turnout among their partisans.” (Goldstein and Holleque 2010, 586)

Mobilization: Strategic or Biased?
What accounts for the puzzle of disparate rates of mobilization? because of who they are
Race, Gender, Age, SES, Homeowner, Nativity, Residential Stability
because of where they live Race Context
because of strategic/biased considerations. Active voters, Battleground State, Competitive
districts,Partisan Districts,
Co-ethnic representation congruence Ignoring the willing recruits

Rate of Co-ethnic representation
Mobilization by Race and Co-Ethnic representation

Mobilization patterns by Race
Latino Asian Black WhiteFemaleAgeEducation + + + +Homeowner +US Born +Registered DEM Registered GOP –Primary Voter ’08Battleground State + + +
N 1,518 789 914 1,093

Mobilization patterns by RaceLatino Asian Black White
Female –AgeEducation + +Homeowner US Born +Resid. Stability Latino NeighborhoodAsian Neighborhood –Black Neighborhood –Mixed Neighborhood Registered DEM Registered GOP –Primary Voter ’08Battleground State + + Total Co-EthnicTotal DEM +Total Competition +Self-Recruit + +N 1,482 776 890 1,076
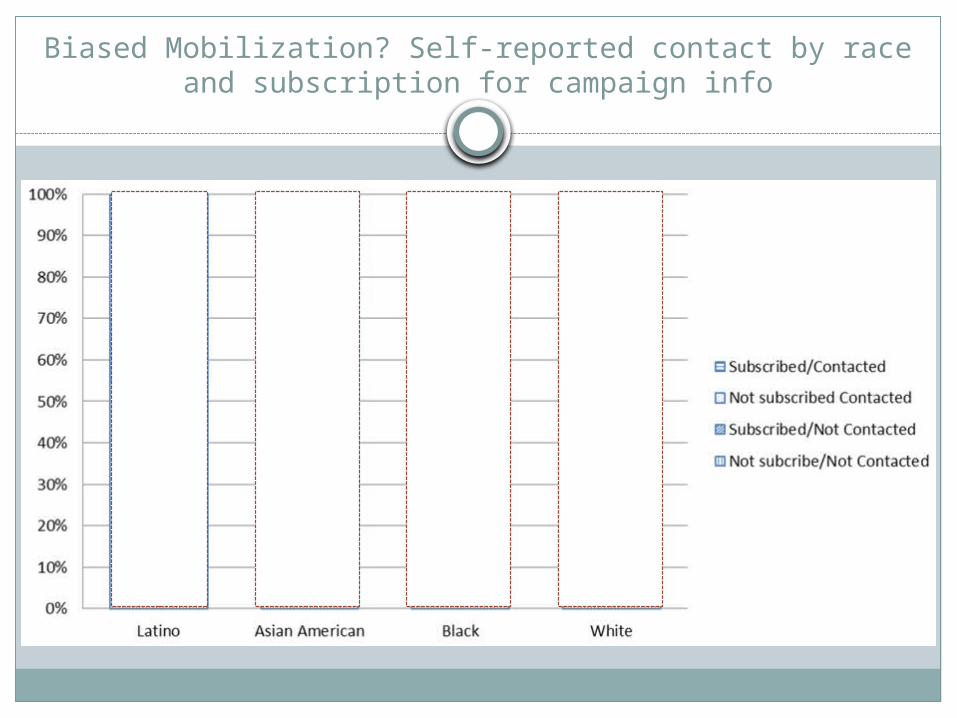
Biased Mobilization? Self-reported contact by race and subscription for campaign info
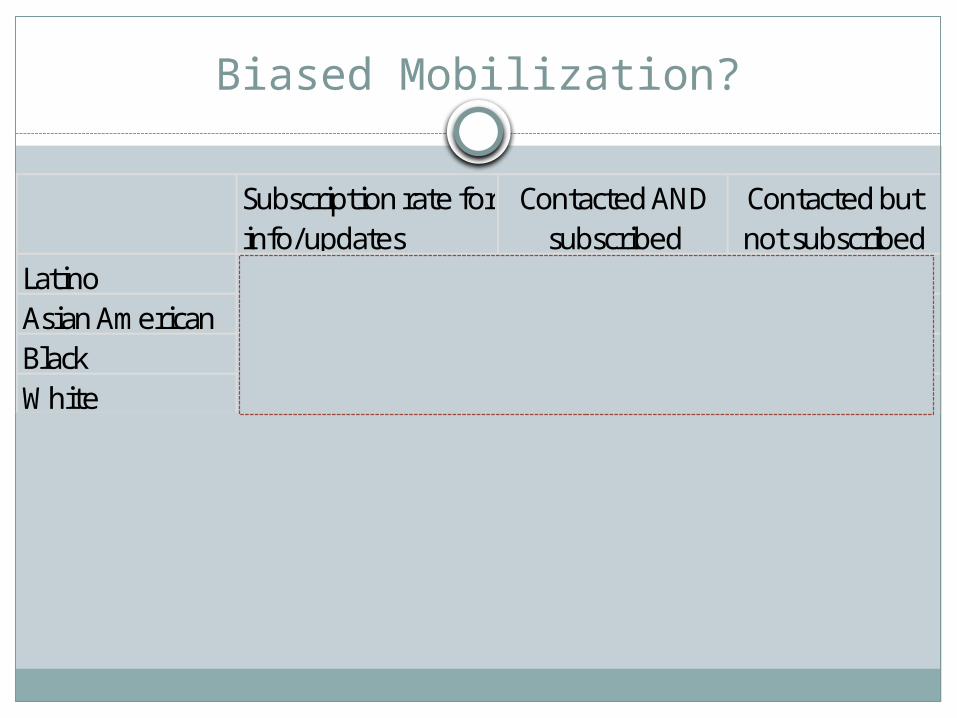
Biased Mobilization?
Subscription rate for info/updates
Contacted AND subscribed
Contacted but not subscribed
Latino 24.8% 41.4% 65.9%Asian American 21.8% 37.9% 71.7%Black 28.0% 52.0% 58.3%White 20.9% 48.3% 73.2%

BREAK
Breakout session