RHEOLOGICAL STUDIES OF FULLY-FORMULATED COATINGS …
86
RHEOLOGICAL STUDIES OF FULLY-FORMULATED COATINGS THICKENED WITH HEUR: EFFECTS OF SURFACTANTS A Thesis presented to the Faculty of California Polytechnic State University, San Luis Obispo In Partial Fulfillment of the Requirements for the Degree Master of Science in Polymers and Coatings by Brandon Michael Bonilla September 2020
Transcript of RHEOLOGICAL STUDIES OF FULLY-FORMULATED COATINGS …

RHEOLOGICAL STUDIES OF FULLY-FORMULATED COATINGS THICKENED WITH HEUR: EFFECTS OF SURFACTANTS
A Thesis
presented to
the Faculty of California Polytechnic State University,
San Luis Obispo
In Partial Fulfillment
of the Requirements for the Degree
Master of Science in Polymers and Coatings
by
Brandon Michael Bonilla
September 2020

ii
© 2020
Brandon Michael Bonilla
ALL RIGHTS RESERVED

iii
COMMITTEE MEMBERSHIP
TITLE: Rheological Studies of Fully-Formulated Coatings Thickened With HEUR: Effects of Surfactants
AUTHOR:
Brandon Michael Bonilla
DATE SUBMITTED:
September 2020
COMMITTEE CHAIR:
Raymond Fernando, Ph.D.
Professor of Polymers and Coatings
COMMITTEE MEMBER: Erik Sapper, Ph.D.
Assistant Professor of Polymers and Coatings
COMMITTEE MEMBER:
Shanju Zhang, Ph.D.
Associate Professor of Polymers and Coatings

iv
ABSTRACT
Rheological Studies of Fully-Formulated Coatings Thickened With HEUR: Effects of Surfactants
Brandon Michael Bonilla
Rheology modifiers such as hydrophobically-modified ethoxylated urethane (HEUR)
thickeners are included in waterborne latex coatings to optimize shear-rate dependent
viscosity and other rheological properties. While these HEUR polymers are commonly used in
industry, the complex chemical interactions that contribute to rheological properties are still not
completely understood. Prior work in this area has focused on understanding latex-HEUR and
latex-surfactant-HEUR interactions that affect rheological properties. Additionally, studies have
been previously conducted to understand the relaxation mechanisms of complex interactions
present in HEUR-thickened waterborne latex coatings under various dynamic conditions. The
objective of this work is to extend the experimental work to fully-formulated coatings and
determine the effects of additional ingredients in a fully-formulated system.
Coating formulations were prepared with a target 90 KU (Kreb Units) viscosity, having
0.23wt% HEUR. The pigment volume concentration (PVC) and non-volatiles by volume (NVV)
were kept constant at 19.87% and 30.47%, respectively. An analysis of phase stability (presence
or absence of syneresis), flow sweep (10-2 to 103 s-1), oscillatory strain (10-2 to 102 %), and
oscillatory frequency (10-2 to 102 Hz) data was carried out in an attempt to determine connections
among these properties. Furthermore, brief comparisons were made with previous results on
latex-HEUR and latex-HEUR-surfactant systems that utilized the same HEUR thickener and latex
used in this study. In the fully-formulated system, 0.23wt% HEUR was found to be in excess of
what is needed to saturate latex surfaces. This HEUR level is less than half of the level needed to
saturate latex surfaces in simpler latex-HEUR systems in previous studies. Fully-formulated
coatings, in addition to having TiO2 and other ingredients are more crowded than the previous
systems. It appeared that a depletion flocculation mechanism dominated at low surfactant
concentrations for fully-formulated systems in this study as evident from syneresis; large HEUR
aggregates appear to build enough osmotic pressure to drive aggregation of latex and pigment
particles resulting in depletion flocculation. At increasing surfactant levels, the depletion

v
flocculation mechanism was negated allowing the associative HEUR bridge networks to dominate
and stabilize the system. Phase stability for fully-formulated systems in this study were
associated with Newtonian viscosity plateaus on flow sweeps, strain hardening on oscillatory
strain sweeps, and formation of high frequency moduli plateaus in frequency sweeps. Further
increase of surfactant concentration appeared to disrupt the stable latex-HEUR network due to
competitive adsorption of surfactant on latex particles, resulting in syneresis from bridging
flocculation.
Possible correlations between phase stability and high relaxation times were seen,
although further analysis of relaxation time data and simulations will need to be carried out to
better understand the behavior of HEUR in fully-formulated systems.
Keywords: Fully-Formulated Coatings, HEUR, Phase Stability, Relaxation Time, Associative
Thickener, Surfactant, Rheology, Latex Paints, Bridging Flocculation, Depletion Flocculation

vi
ACKNOWLEDGMENTS
Firstly, I thank Jesus Christ for the opportunity to work on this project. Thank you Dr.
Raymond Fernando for your mentorship, grace, and making this project possible. Thank you Dr.
Erik Sapper for sharing you insights and enthusiasm for polymers chemistry. Thank you Dr.
Shanju Zhang for your helpful feedback and encouragement. Thank you Juan Alejandro Ortiz
Salazar for the many helpful discussions on the topic of fully-formulated coatings. Furthermore,
thank you Shubham Gupta, Brenden Posson, and Jasmol Dhesi for helping me with rheological
testing.
Special Thanks for Financial Support Provided by:
Arthur C. Edwards Endowment
Freudenberg North America Scholarship
Additional Thanks for Provided Resources and Materials:
Kenneth N. Edwards Western Coatings Technology Center
Members of the Dow Chemical Company Research Team:
Dr. Gary W. Dombrowski
Dr. John J. Rabasco
Dr. Patrick E. Hartnett

vii
TABLE OF CONTENTS
Page
LIST OF TABLES ................................................................................................................................................. viii
LIST OF FIGURES ................................................................................................................................................ ix
CHAPTER
1. INTRODUCTION ............................................................................................................................................... 1
1.1 Rheology ................................................................................................................................................... 1
1.2 Colloidal Aspects of Waterborne Coating Formulations ...................................................................... 8
1.3 Chemistry and Composition of a Fully-Formulated Coating ............................................................. 12
1.4 Latex-HEUR-Surfactant Interactions ................................................................................................... 19
1.5 Pigment-HEUR-Dispersant Interactions ............................................................................................. 20
1.6 Relaxation Modes from Frequency and Flow Sweeps ..................................................................... 21
2. EXPERIMENTAL MATERIALS AND METHODS ...................................................................................... 24
3. RESULTS AND DISCUSSION..................................................................................................................... 31
3.1 Mechanistic Interpretation of Results .................................................................................................. 66
4. CONCLUSIONS AND SUGGESTED FUTURE WORK .......................................................................... 68
REFERENCES .................................................................................................................................................... 69

viii
LIST OF TABLES
Table Page
Table 1. Grind Formulation. ........................................................................................................... 25
Table 2. Letdown Formulation. ...................................................................................................... 25
Table 3. Description of formulation components. .......................................................................... 25
Table 4. Properties of butyl acrylate (BA), styrene (STY), and methacrylic acid (MAA) latex ....... 26
Table 5. HEUR characteristics. ...................................................................................................... 26
Table 6. Pigment properties. .......................................................................................................... 26
Table 7. Surfactant properties. ....................................................................................................... 27
Table 8. Characteristics of the fully-formulated system. ............................................................... 28
Table 9. Pre-shearing conditions. .................................................................................................. 29
Table 10. Logarithmic Strain sweep conditions. ............................................................................ 29
Table 11. Logarithmic Frequency sweep conditions. ..................................................................... 29
Table 12. Logarithmic flow sweep conditions. ............................................................................... 29
Table 13. Pre-shearing conditions for 0.60%, 0.62%, 0.64%, 0.66%, 0.68%, 0.70%)
Tergitol 15-S-40 and Triton X-100 systems. .................................................................. 30
Table 14. Logarithmic flow sweep conditions for 0.60%, 0.62%, 0.64%, 0.66%, 0.68%,
0.70% Tergitol 15-S-40 and Triton X-100 systems. ...................................................... 30
Table 15. Precision tests in oscillatory frequency sweep data for measuring Maxwell
relaxation times. ............................................................................................................. 64

ix
LIST OF FIGURES
Figure Page
Figure 1. Description of shear stress and shear rate. ...................................................................... 2
Figure 2. Schematic illustration of cone-and-plate configuration on a rheometer [6]. ..................... 2
Figure 3. Various viscosity profiles as a function of shear rate. ...................................................... 3
Figure 4. Complex shear dependant behavior for fully-formulated coatings where I)
Newtonian plateau, II) shear thickening, III) complex shear thinning, & IV)
simple shear thinning occurs. .......................................................................................... 3
Figure 5. Illustration of Maxwell model and its viscoelastic response to stress. The spring
represents the elastic reversible element, and dashpot represents non-
reversible viscoous element. ............................................................................................. 4
Figure 6. Illustration of generalized Maxwell model. ........................................................................ 4
Figure 7. Dynamic oscillatory testing. .............................................................................................. 5
Figure 8. Oscillatory strain sweep. ................................................................................................... 6
Figure 9. Strain sweep response as function of strain amplitude. ................................................... 6
Figure 10. Oscillatory frequency sweep. .......................................................................................... 7
Figure 11. Oscillation frequency response [6]. ................................................................................ 7
Figure 12. Representation of an electronic double layer (stern layer and slipping plane) [13]........ 8
Figure 13. Representation of potential energy of colloids as funciton of interparticle
distance in a typical fully-formulated coating. Energy barrier must be surpassed
for irreversible aggregation to occur. ............................................................................... 9
Figure 14. A good dispersion (a) versus a dispersion (b) undergoing depletion
flocculation, bridging flocculation, or coagulation. ........................................................... 9
Figure 15. Dispersion phase diagram that can apply to all particles in a coating (primarily
latex and pigment particles). Concentrations of thickener are based on the
continuous phase and concentration of dispersant or surfactant is based on the
specific solids phase [12]. .............................................................................................. 10

x
Figure 16. Schematic representation of pigment and latex dispersion states in waterborne
HEUR thickened latex coatings where (b) represents the idealized uniformly
dispersed state. Dispersion (a) resembles a depletion state where HEUR
thickener is not associating causing co-flocculation. Dispersion (c) resembles
flocculated pigment due to poor choice of dispersant. Dispersion (d) resembles
well dispersed pigment surrounded by latex flocks [12]. ............................................... 10
Figure 17. Schematic representation of bridging flocculation. ....................................................... 11
Figure 18. Depletion flocculation phenomena where the blue circles represent latex or
pigment particles and the yellow lines represent free floating polymer in the
continuous media. This yellow polymer can be a rheology modifier such as
HEC or HEUR. ............................................................................................................... 11
Figure 19. Copolymer latex with partial sodium dodecyl sulfate surfactant surface coverage. ..... 13
Figure 20. Types of surfactants categorized by a) non-ionic Triton-X-100 b) cationic
cetyltrimethylammonium bromide (CTAB) c) anionic sodium dodecyl sulfate
(SDS) d) zwitterionic Amidopropyl Hydroxysultaine. ..................................................... 14
Figure 21. TiO2 pigment in alkaline pH with attached polyelectrolyte dispersant. ......................... 15
Figure 22. Polyacrylate dispersant. ................................................................................................ 15
Figure 23. Structure of an associative HEUR thickener. ............................................................... 16
Figure 24. HEUR loops, flower-like micelles and aggregate networks in an HEUR
aqueous solution. ........................................................................................................................... 17
Figure 25. Shear induced chain stretching. ................................................................................... 17
Figure 26. Representation of the original model for HEUR/latex dispersion interactions.
SDS covered latex particles bridged by HEUR thickener in aqueous media. ............... 18
Figure 27. Representation of the new model for HEUR/latex dispersion interactions. .................. 19
Figure 28. HEUR adsorption as a function of hydrophilic and hydrophobic dispersant
concentration [27]. ......................................................................................................... 20
Figure 29. Low shear viscosity contributions due to cluster rearrangements. ............................... 22

xi
Figure 30. Mid-shear thinning viscosity contribution due to unimolecular and
multimolecular bridging redistributions. ......................................................................... 22
Figure 31. High shear thinning viscosity due to high rate of loop-to-bridge transitions. ................ 23
Figure 32. Hydrophobic copolymer polyelectrolyte dispersant generic structure for Tamol
731A. .............................................................................................................................. 26
Figure 33. Tergitol 15-S-40 surfactant structure [3]. ...................................................................... 27
Figure 34. TSP-16 surfactant structure [31]. .................................................................................. 27
Figure 35. TSP-16S surfactant structure [31]. ............................................................................... 27
Figure 36. TSP-16PE30 surfactant structure [31]. ......................................................................... 28
Figure 37. Observable phase stability of fully formulated coatings with surfactants a)
Tergitol-15-S-40 b) Trition X-100 c) TSP-16 d) TSP-16S e) TSP-16PE30 f)
SDS in weight percent. .................................................................................................. 31
Figure 38. Flow sweep overlay for BA/STY latex at 0.23wt% C18-EO795 thickener with
Tergitol 15-S-40 surfactant in wt%. ............................................................................... 33
Figure 39. Flow sweep overlay for BA/STY latex at 0.23wt% C18-EO795 thickener with
Tergitol 15-S-40 surfactant in wt%. ............................................................................... 33
Figure 40. Complex modulus as function of oscillation strain at 1 Hz for fully-formulated
system with Tergitol 15-S-40 surfactant in weight percent (0.0%, 0.10%,
0.25%, 0.75%, 1.0%, 2.0%). .......................................................................................... 34
Figure 41. Complex modulus as function of oscillation strain at 1 Hz for fully-formulated
system with Tergitol 15-S-40 surfactant in weight percent (0.20%, 0.30%,
0.40%, 0.50%, .60%, 0.70%). ........................................................................................ 35
Figure 42. Complex modulus as function of oscillation strain at 1 Hz for fully-formulated
system with Tergitol 15-S-40 surfactant in weight percent (0.60%, 0.62%,
0.64%, 0.66%, 0.68%, 0.70%). ...................................................................................... 35
Figure 43. Complex modulus as function of oscillation frequency at 1% strain for fully-
formulated system with Tergitol 15-S-40 surfactant in weight percent (0.0%,
0.10%, 0.25%, 0.75%, 1.0%, 2.0%). ............................................................................. 36

xii
Figure 44. Complex modulus as function of oscillation frequency at 1% strain for fully-
formulated system with Tergitol 15-S-40 surfactant in weight percent (0.20%,
0.30%, 0.40%, 0.50%, .60%, 0.70%). ........................................................................... 37
Figure 45. Complex modulus as function of oscillation frequency at 1% strain for fully-
formulated system with Tergitol 15-S-40 surfactant in weight percent (0.60%,
0.62%, 0.64%, 0.66%, 0.68%, 0.70%). ......................................................................... 38
Figure 46. Flow sweep overlay for BA/STY latex at 0.23wt% C18-EO795 thickener with
Triton-X-100 surfactant in wt%. ..................................................................................... 39
Figure 47. Complex modulus as function of oscillation strain at 1 Hz for fully-formulated
system with Triton X-100 surfactant in weight percent (0.0%, 0.10%, 0.25%,
0.75%, 1.0%, 2.0%). ...................................................................................................... 40
Figure 48. Complex modulus as function of oscillation strain at 1 Hz for fully-formulated
system with Triton X-100 surfactant in weight percent (0.20%, 0.30%, 0.40%,
0.50%, 0.60%, 0.62%, 0.64%, 0.66%, 0.68%, 0.70%). ................................................. 41
Figure 49. Complex modulus as function of oscillation strain at 1 Hz for fully-formulated
system with Triton X-100 surfactant in weight percent (0.60%, 0.62%, 0.64%,
0.66%, 0.68%, 0.70%). .................................................................................................. 42
Figure 50. Complex modulus as function of oscillation frequency at 1% strain for fully-
formulated system with Triton X-100 surfactant in weight percent (0.0%, 0.10%,
0.25%, 0.75%, 1.0%, 2.0%). .......................................................................................... 43
Figure 51. Complex modulus as function of oscillation frequency at 1% strain for fully-
formulated system with Triton X-100 surfactant in weight percent (0.20%,
0.30%, 0.40%, 0.50%, 0.60%, 0.62%, 0.64%, 0.66%, 0.68%, 0.70%). ........................ 44
Figure 52. Complex modulus as function of oscillation frequency at 1% strain for fully-
formulated system with Triton X-100 surfactant in weight percent (0.60%,
0.62%, 0.64%, 0.66%, 0.68%, 0.70%). ......................................................................... 45
Figure 53. Flow sweep overlay for BA/STY latex at 0.23wt% C18-EO795 thickener with
TSP-16 surfactant. ......................................................................................................... 46

xiii
Figure 54. Complex modulus as function of oscillation strain at 1 Hz for fully-formulated
system with TSP-16 surfactant in weight percent (0.0%, 0.10%, 0.25%, 0.75%,
1.0%, 2.0%). .................................................................................................................. 47
Figure 55. Complex modulus as function of oscillation strain at 1 Hz for fully-formulated
system with TSP-16 surfactant in weight percent (0.20%, 0.30%, 0.40%,
0.50%, 0.60%, 0.70%). .................................................................................................. 48
Figure 56. Complex modulus as function of oscillation frequency at 1% strain for fully-
formulated system with TSP-16 surfactant in weight percent (0.0%, 0.10%,
0.25%, 0.75%, 1.0%, 2.0%). .......................................................................................... 49
Figure 57. Complex modulus as function of oscillation frequency at 1% strain for fully-
formulated system with TSP-16 surfactant in weight percent (0.20%, 0.30%,
0.40%, 0.50%, 0.60%, 0.70%). ...................................................................................... 50
Figure 58. Flow sweep overlay for BA/STY latex at 0.23wt% C18-EO795 thickener with
TSP-16S surfactant. ...................................................................................................... 51
Figure 59. Complex modulus as function of oscillation strain percent at 1 Hz for fully-
formulated system with TSP-16S surfactant in weight percent (0.0%, 0.10%,
0.25%, 0.75%, 1.0%, 2.0%). .......................................................................................... 52
Figure 60. Complex modulus as function of oscillation frequency at 1% strain for fully-
formulated system with TSP-16S surfactant in weight percent (0.0%, 0.10%,
0.25%, 0.75%, 1.0%, 2.0%). .......................................................................................... 53
Figure 61. Flow sweep overlay for BA/STY latex at 0.23wt% C18-EO795 thickener with
TSP-16PE30 surfactant. ................................................................................................ 54
Figure 62. Complex modulus as function of oscillation strain percent at 1 Hz for fully-
formulated system with TSP-16PE30 surfactant in weight percent (0.0%,
0.10%, 0.25%, 0.75%, 1.0%, 2.0%). ............................................................................. 55
Figure 63. Complex modulus as function of oscillation frequency at 1% strain for fully-
formulated system with TSP-16PE30 surfactant in weight percent (0.0%,
0.10%, 0.25%, 0.75%, 1.0%, 2.0%). ............................................................................. 56

xiv
Figure 64. Flow sweep overlay for BA/STY latex at 0.23wt% C18-EO795 thickener with
SDS surfactant. .............................................................................................................. 57
Figure 65. Complex modulus as function of oscillation strain percent at 1 Hz for fully-
formulated system with SDS surfactant in weight percent (0.0%, 0.10%, 0.25%,
0.75%, 1.0%, 2.0%). ...................................................................................................... 58
Figure 66. Complex modulus as function of oscillation frequency at 1% strain for fully-
formulated system with SDS surfactant in weight percent (0.0%, 0.10%, 0.25%,
0.75%, 1.0%, 2.0%). ...................................................................................................... 59
Figure 67. Flow sweep data from latex-HEUR (25.0vol% BA/STY / 0.50wt% C18-EO795)
experiments [4,5]. .......................................................................................................... 60
Figure 68. Flow swep overlay of Latex-HEUR-surfactant (25vol% BA/STY / C18-EO795 /
Tergitol 15-S-40) and fully-formulated 0.70% Tergitol 15-S-40 surfactant
coatings [3]. .................................................................................................................... 61
Figure 69. Flow swep overlay of Latex-HEUR-surfactant (25vol% BA/STY / C18-EO795 /
Tergitol 15-S-40) and fully formulated 0.50% Triton X-100 surfactant coatings
[3]. .................................................................................................................................. 62
Figure 70. Complex modulus trends seen in oscillatory strain tests for increasing HEUR
concentration in a latex-HEUR system, and increasing surfactant concentration
in a fully formulated system. These trends are inverse of each other [4,5]. .................. 63
Figure 71. Oscillatory frequency sweep data example for 0.70% Tergitol 15-S-40
formulation; storage G’ and Loss G” modulus as a function of frequency (Hz). ............ 64
Figure 72. Relaxation time as a function of Tergitol 15-S-40 surfactant wt% for fully-
formulated systems. ....................................................................................................... 65
Figure 73. Comparison of relaxation time as a function of surfactant concentration for
fully-formulated (FF) 0.75wt% Triton-X-100 and 0.75wt%Tergitol-15-S-40
systems, Latex/HEUR/Surfactant systems, and Latex/HEUR systems. ....................... 66

1
Chapter 1:
INTRODUCTION
Rheology modifiers such as hydrophobically-modified ethoxylated urethane (HEUR) thickeners
are included in waterborne latex coatings to optimize shear-rate dependent viscosity and other
rheological properties. For example, a low viscosity is needed for brush or rolling applications while higher
viscosities are required to balance coating sag and leveling after application [1]. The addition of HEUR
rheology modifiers in waterborne latex coatings allows for these dynamic viscosity needs to be met. While
these HEUR thickeners are commonly used in industry, the complex chemical interactions that contribute
towards rheological properties are not completely understood. Prior work at Cal Poly has focused on
understanding latex-HEUR [2] and latex-HEUR-surfactant [3] interactions that affect rheological
properties and phase stability. In latex-HEUR systems a systematic change in stability mechanisms were
observed as HEUR concentration increases [4,5]. There is a transition between three mechanisms of
stability represented by changes in phase behavior as seen by optical microscopy [4,5]. As HEUR
concentration is increased, a homogenous phase is seen to transition to a grainy heterogenous phase,
and then transition back to a homogenous phase. These phase changes are accompanied by a formation
of a Newtonian plateau following shear thinning behavior as seen in flow sweep data. Furthermore, these
phase changes are accompanied by the formation of a strain hardening peak following formation of
plateau behavior as seen in oscillatory strain data. In latex-HEUR-surfactant systems, a Newtonian
plateau is seen to remain as surfactant concentration increases where no phase instability is experienced
[3]. The objective of this work is to add rheological insights via analysis of a fully-formulated latex-
pigment-dispersant-surfactant-HEUR system that utilizes identical HEUR thickener as prior latex-HEUR
and latex-HEUR-surfactant systems. A brief overview of rheology, dispersion stability, and suspected
chemical interactions in a fully-formulated HEUR thickened waterborne latex will be described below.
1.1 RHEOLOGY
Rheology is the science behind the flow and deformation of materials. The study and control of
waterborne latex rheology is very important to control the long-term stability of a coating and its
application; application methods include brush coating, spray coating, or roll coatings. Furthermore,
rheology is important in preventing paint from dripping and also showing brush marks [6]. Typical

2
rheological tests include analysis of viscosity, or resistance to flow, of a fluid as functions of time, shear
rate, and as shear stress. Viscosity is defined as the ratio of shear stress and shear rate as seen in
Equation 1. Shear stress, σ, is the force applied to a fluid per unit area, and the shear rate, �̇� is the
change in velocity across a fluid. Figure 1 visually demonstrates this phenomenon assuming a linear
velocity profile where successive layers of fluid move in their own planes relative to a reference layer (i.e.,
laminar flow).
η = 𝜎
�̇� (1)
Figure 1. Description of shear stress and shear rate.
A cone-and-plate rheometer can be utilized to measure rheological properties such as viscosity
over range of shear rates. This rheometer can be configured to have a truncated cone that rotates against
a flat plate. In this configuration, the shear rate does not vary from the center axis of rotation because the
linear velocity and the gap between the cone and the plate increase with an increase distance from the
axis of rotation as seen in Figure 2 [6]. As the angular velocity of rotation of the cone increases, the shear
rate increases. Experimentally, the torque or moment of force from the applied stress is measured for a
given shear rate in order to calculate viscosity [7].
Figure 2. Schematic illustration of cone-and-plate configuration on a rheometer [6].
A fluid is Newtonian when viscosity is independent of shear rate, or non-Newtonian when
viscosity changes with shear rate. Furthermore, a fluid can be shear thickening and shear thinning as

3
seen in Figure 3. In the case of fully-formulated waterborne latex paints with associative, hydrophobically-
modified, ethoxylated urethane (HEUR) thickeners, complex shear dependant behavior occurs as seen in
Figure 4.
Figure 3. Various viscosity profiles as a function of shear rate.
Figure 4. Complex shear dependant behavior for fully-formulated coatings where I) Newtonian plateau, II)
shear thickening, III) complex shear thinning, & IV) simple shear thinning occurs.
Viscosity could also be referred as the ability of a material to dissipate energy [6]. When HEUR
thickened waterborne latex systems are subject to stress, they can absorb stress like an elastic solid and
then flow like a viscous liquid due to the presence of a transient network of bridged particles [8]. This is
represented as viscoelastic behavior, represented by the Maxwell model utilizing a spring that represents

4
the elastic response and a dashpot that represents the viscous response; the spring is in series with the
dashpot as seen in Figure 5. When the Maxwell element is subject to stress, the spring first experiences
immediate reversible deformation whereas the dashpot experiences slow permanent deformation [6].
Figure 5 demonstrates the correlated stress and strain for a real or non-ideal viscoelastic system. Figure
6 demonstrates the generalized Maxwell model having multiple Maxwell elements connected in paralell.
Figure 5. Illustration of Maxwell model and its viscoelastic response to stress. The spring represents the
elastic reversible element, and dashpot represents non-reversible viscoous element.
Figure 6. Illustration of generalized Maxwell model.
Pure HEUR aqueous solutions are known to demonstrate viscoelasticity similar to a single
Maxwell element, and fully-formulated HEUR thickened coatings have a viscoelasticity akin to multiple
Maxwell elements, demonstrating a broad range of independent relaxation times; each Maxwell element
has an independent relaxation time [9]. The relaxation time, τm, is defined as the time required to let the
initial stress, σ0, of a mode relax to 1/e (36.79%) of its initial value [10].
A rheometer with truncated cone and plate geometry can perform dynamic oscillatory testing that
can be utilized to investigate viscoelastic responses in HEUR thickened waterborne latex coatings. In
dynamic oscillatory testing, a coating is tested for responses to oscillating stress or strain in a sinosoidal
pattern as seen in Figure 7; typically strain and frequency sweeps are performed. The resultant stress

5
and strain sine waves are then analyzed to determine if a material’s response is elastic, viscous, or
viscoelastic [6]. For elastic responses the maxima will line up having no time shift between sine waves,
demonstrating no energy dissipation; this represents a phase angle shift, δ, of 0° (ideal elastic solid
behavior). An ideal viscous liquid response demonstrates a phase angle shift of 90° where the maximum
stress aligns with the maximum shear at the inflection point, demonstrating maximum energy dissipation.
A viscoelastic response demonstrates a phase angle shift anywhere between 0° and 90°.
Figure 7. Dynamic oscillatory testing.
In an oscillation strain sweep seen in Figure 8 the frequency, ω (rad/sec or Hz), is held constant
and complex modulus G* (Pa) information can be measured. The complex modulus can be resolved into
the storage modulus, G’ (Pa), and loss modulus ,G” (Pa) that represent the elastic and viscous
responses, respectively, as seen in Equations 3 and 4 [6]. Furthermore, the storage and loss moduli
relate to phase angle as seen in Equation 2. The critical strain, γcr, indicates the strain above which the
structure starts to break down as seen in Figure 9. Furthermore, this test can determine the melting strain
where the system becomes more viscous than elastic (that is where G” becomes greater than G’).

6
tan δ = G"
G′ (2)
G’ = G* cos δ (3)
G” = G* sin δ (4)
Figure 8. Oscillatory strain sweep.
Figure 9. Strain sweep response as function of strain amplitude.
In an oscillatory frequency sweep illustrated in Figure 10, G’ and G” are measured as a function
of frequency while the strain remains constant; typically, the strain is chosen within the linear viscoelastic
region previously determined from the strain sweep experiment [6]. This experiment can be used to
determine the characteristic frequency, ω*, which is the Maxwell relaxation time, τm , seen in Equation 5.

7
Figure 11 demonstrates a generalized viscoelastic liquid response to an oscillatory frequency test, where
G’ is equivalent to G” at ω*. Furthermore, this experiment demonstrates that energy can be dissipated as
viscous flow for longer term experiments at ω < ω* where G” > G’, and less energy is dissipated for short
term experiments at higher frequencies where ω > ω* and G” < G’.
τm = 1
ω∗ (5)
Figure 10. Oscillatory frequency sweep.
Figure 11. Oscillation frequency response [6].

8
1.2 COLLOIDAL ASPECTS OF WATERBORNE COATING FORMULATIONS
The long-term storage and stability of fully-formulated waterborne coatings is important, so it is
critical to look at the in-can stability and phase separation or syneresis behavior that may take place over
time. Typical fully-formulated waterborne latex coatings consist of dispersed latex particles, pigments,
fillers, rheology modifiers, surfactants and dispersants [11]. All formulation components contribute to the
overall stability of these colloidal systems. Typical methods to describe the stability of colloidal
dispersions are Derjagin-Landau-Verwey-Overbeek (DLVO) theory and dispersion phase diagrams
(DPDs) [12]. According to DLVO theory a stabilized colloidal dispersion will have repulsive electric double
layer forces greater than attractive van der Waals forces that prevents flocculation or coagulation [13]. An
electric double layer is the sum of the stern layer and diffuse layer or slipping plane as seen in Figure 12.
These attractive and repulsion forces can be represented as potential energies summed to produce a
chart such as Figure 13 [13].
Figure 12. Representation of an electronic double layer (stern layer and slipping plane) [13].

9
Figure 13. Representation of potential energy of colloids as funciton of interparticle distance in a typical
fully-formulated coating. Energy barrier must be surpassed for irreversible aggregation to occur.
Stabilization of a colloidal dispersion is described as having good dispersions where neither
flocculation nor aggregation occurs as visualized in Figure Figure 14a and Figure 15 with DPDs.
Furthermore, fully-formulated coatings can be visualized in Figure 16 where the phase stabilities of
pigments and latexes vary [12].
(a) (b)
Figure 14. A good dispersion (a) versus a dispersion (b) undergoing depletion flocculation, bridging
flocculation, or coagulation.

10
Figure 15. Dispersion phase diagram that can apply to all particles in a coating (primarily latex and
pigment particles). Concentrations of thickener are based on the continuous phase and concentration of
dispersant or surfactant is based on the specific solids phase [12].
Figure 16. Schematic representation of pigment and latex dispersion states in waterborne HEUR
thickened latex coatings where (b) represents the idealized uniformly dispersed state. Dispersion (a)
resembles a depletion state where HEUR thickener is not associating causing co-flocculation. Dispersion
(c) resembles flocculated pigment due to poor choice of dispersant. Dispersion (d) resembles well
dispersed pigment surrounded by latex flocks [12].
Aggregation, bridging flocculation, and depletion flocculation can occur when attractive forces
surpass the repulsive forces [13]. At aggregation the particles are virtually in physical contact with one
another as seen in Figure 13. Bridging flocculation is typically seen at additive and HEUR concentration
levels far less than levels found in fully-formulated coatings, and is therefore rare to occur [12]. This type
of flocculation occurs when two or more particles are linked using a polymer chain adsorbed to the

11
surface as seen in Figure 17 [13]. For the HEUR to act as an effective bridge, it must remain extended
beyond the double layer thickness for a significant time. Therefore, higher molecular weight HEUR can
have longer Maxwell relaxation times τm, acting as effective bridges.
Figure 17. Schematic representation of bridging flocculation.
Depletion flocculation, as seen in Figure 18, occurs from osmotic pressure becoming greater
outside particles than in between particles, resulting in attractive forces causing aggregation and
flocculation [6]. This type of flocculation is typical for non-associative thickeners such as hydroxyethyl
cellulose (HEC) [14].
Figure 18. Depletion flocculation phenomena where the blue circles represent latex or pigment particles
and the yellow lines represent free floating polymer in the continuous media. This yellow polymer can be
a rheology modifier such as HEC or HEUR.
Fully-formulated HEUR thickened waterborne latex dispersions can have steric and/or
electrostatic repulsions that prevent destabilization and syneresis. Steric, entropic, or osmotic repulsion
can be present where a nonionic surfactant or HEUR thickener is adsorbed onto the surface of a particle.
Particles in a colloidal dispersion typically undergo rapid and random movements known as Brownian
motion. For latex particles with adsorbed surfactant or thickener molecules, these adsorbed layers
become crowded as particles come closer together. When the particles are closer, they become more

12
ordered and adsorbed species become crowded with less possible conformations and lose entropy,
resulting in an unstable high energy transition state. This is an unfavorable energy state and therefore the
particles repel each other to create a more favorable lower energy state [11].
Another method of stabilization is to promote electrostatic repulsion forces with the use of ionic
surfactants such as sodium dodecyl sulfate (SDS). The surfactant hydrophobic tail adsorbs to the particle
surface while the ionic head faces outwards and interacts with the water. The surface of the latex particle
then can become negatively charged, causing electrostatic repulsion between the particles [14]. It is
common for both steric and electrostatic (electrosteric) repulsion forces to be present.
1.3 CHEMISTRY AND COMPOSITION OF A FULLY-FORMULATED COATING
Waterborne latex paint formulations typically contain latex particles as the binder, pigments,
thickeners or rheology modifiers, dispersants, and surfactants to stabilize colloidal dispersions of latex
particles. Each formulation component has a chemical contribution to the stability of the aqueous resin
system. A typical fully-formulated coating will contain these components, and for the purpose of this study
biocide, defoamer, and coalescing aid was excluded. The coatings formulated for this project contained a
waterborne latex stabilized with sodium dodecyl sulfate (SDS), an organically treated titanium dioxide
pigment (TiO2), one of six surfactants used in the study, a relatively hydrophobic polyelectrolyte
dispersant, and a hydrophobically modified urethane ethoxylate (HEUR) thickener.
Waterborne latex coatings have several distinct properties associated with them. Polymer resin
particles are typically enveloped by surfactant such as SDS seen in Figure 19. For the case of Figure 19,
an anionic surfactant such as SDS has formed a micelle enveloping the hydrophobic polymer or
copolymer chains. A hydrophobic effect orients the surfactant hydrocarbon chains inward to envelope
polymer while the anionic sulfate group orients outwards in the aqueous media. As a result, the latex
particles then create an electrostatic repulsion between like particles producing colloidal stability.

13
Figure 19. Copolymer latex with partial sodium dodecyl sulfate surfactant surface coverage.
Surfactants are surface active agents that decrease interfacial tension between two phases of
material. In the case of waterborne latex coatings these phases are liquid-gas at the water-air interface,
and solid-liquid at the polymer-dispersion medium interface. Surfactants are amphiphilic, comprised of
both oil-loving lipophilic and water-loving hydrophilic properties. The lipophilic hydrocarbon chain is
referred to as the tail and the hydrophilic portion is referred to as the head. Furthermore, there are many
types of surfactant categories such as nonionic, anionic, cationic, and zwitterionic as seen in Figure 20. In
latex paints, it is common to both nonionic and anionic surfactants to impart electrosteric stabilization of
colloidal systems.
As surfactant concentration increases in a system, a critical micelle concentration (CMC) is
reached where the surface tension no longer decreases, and aggregate formation becomes the dominant
surface transport and assembly process, due to interfaces already being saturated with surfactant. These
surfactant aggregates can form structures such as spherical micelles, as is common in waterborne latex
systems, or even cylinders and bilayers. These aggregate geometries depend on the packing ratio of
surfactants, a ratio between the volume of the hydrophobic chain, and the product of the hydrocarbon
chain length and effective area per head group [15]. SDS surfactant is restricted in transforming into rod-
like micelles unless aqueous solutions are saline [16].
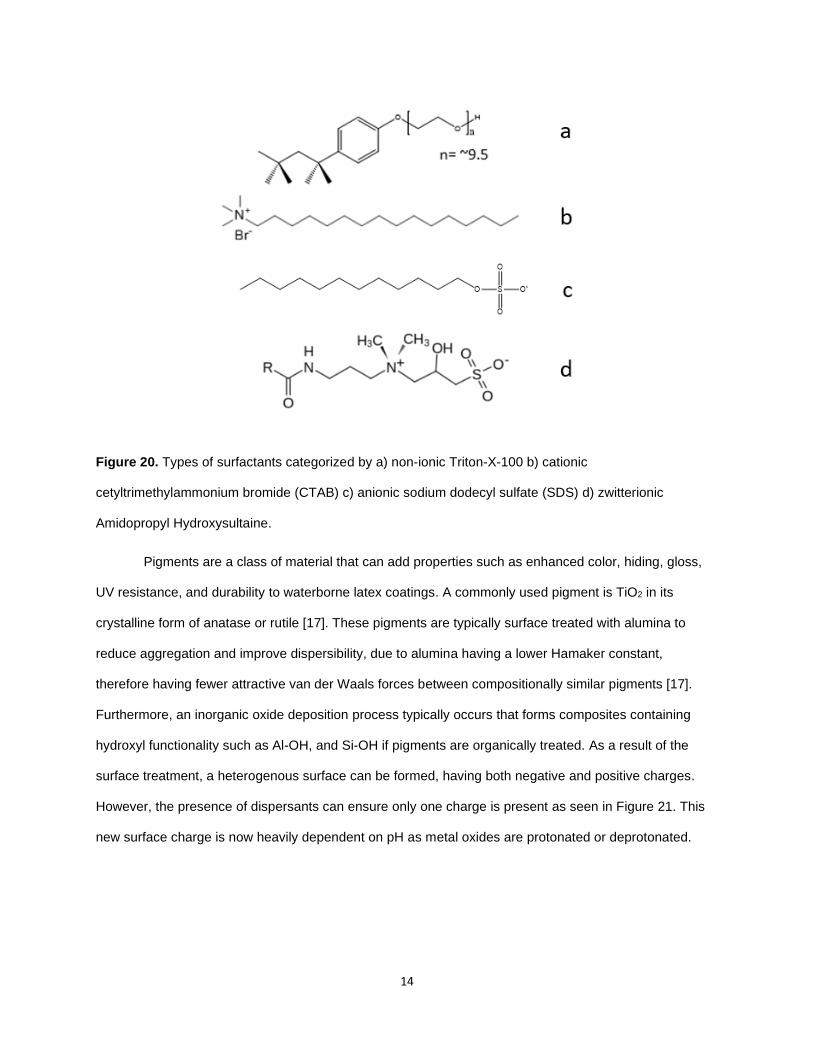
14
Figure 20. Types of surfactants categorized by a) non-ionic Triton-X-100 b) cationic
cetyltrimethylammonium bromide (CTAB) c) anionic sodium dodecyl sulfate (SDS) d) zwitterionic
Amidopropyl Hydroxysultaine.
Pigments are a class of material that can add properties such as enhanced color, hiding, gloss,
UV resistance, and durability to waterborne latex coatings. A commonly used pigment is TiO2 in its
crystalline form of anatase or rutile [17]. These pigments are typically surface treated with alumina to
reduce aggregation and improve dispersibility, due to alumina having a lower Hamaker constant,
therefore having fewer attractive van der Waals forces between compositionally similar pigments [17].
Furthermore, an inorganic oxide deposition process typically occurs that forms composites containing
hydroxyl functionality such as Al-OH, and Si-OH if pigments are organically treated. As a result of the
surface treatment, a heterogenous surface can be formed, having both negative and positive charges.
However, the presence of dispersants can ensure only one charge is present as seen in Figure 21. This
new surface charge is now heavily dependent on pH as metal oxides are protonated or deprotonated.

15
Figure 21. TiO2 pigment in alkaline pH with attached polyelectrolyte dispersant.
In the scope of waterborne latex coatings, dispersants are designed to promote wetting and
colloidal dispersion stabilization [18]. Dispersants are akin to surfactants in their amphiphilic nature and
stabilizing behavior as seen in Figure 20. A common dispersant for aqueous systems that promotes
charge-repulsion are polyacrylates as seen in Figure 22 [19]. They contain ionic functional groups that
anchor or adsorb onto the surface of pigments while adding a hydrophobic backbone as seen above,
adding electrostatic, steric, or electrosteric repulsion forces between pigment. In aqueous systems,
dispersing agents shift the zeta potential at the particle-liquid interface to a negative value to remove
attractive forces [19]. This helps to stabilize the colloidal dispersion and prevent flocculation. It is
important to note that the stability of pigment dispersions depends on the pH of the system due to the
impact of pH on surface charges. For pH values above the isoelectric point the surface is negatively
charged, promoting charge-repulsion and electrostatic stabilization [11].
Figure 22. Polyacrylate dispersant.
A common class of rheology modifiers used in waterborne latex coatings are hydrophobically-
modified ethoxylated urethanes (HEURs). These rheology modifiers are commonly known as associative
thickeners because they associate with themselves and other components in the coating. These rheology

16
modifiers typically contain a hydrophilic poly(ethylene glycol) center, urethane groups, and hydrophobic
alkyl end caps as seen in Figure 23. Due to the dual hydrophobic end cap nature, these molecules can
form bridges between hydrophobic particles, causing viscosity increases in the system.
Figure 23. Structure of an associative HEUR thickener.
Associative thickeners in a waterborne system can form looped micelles where the hydrophobic
ends point inward and the hydrophilic polyethylene oxide (PEO) chains are looped outwards as seen in
Figure 24 [20]. At points above the critical micelle concentration (CMC) these loops can interact and form
flower-like micelles. Furthermore, above the critical aggregation concentration (CAC) an aggregate
associative network can be formed [20]. In this aggregated network, super-bridges can be formed
between the flower-like micelles that serve to transmit stress through the bridge network. All the HEUR
conformations are reversible, constantly undergoing dynamic motions. This new ability to transmit stress
across the aggregate network creates complex rheology and shear thinning behavior as seen in Figure 4.
Additionally, as seen in phase II of Figure 25 a shear-thickening phenomenon can occur. One proposed
model to describe shear thickening is seen as an incorporation of unassociated flower micelles into the
super-bridge associative network [8]. This theory is supported by an increase in G0, the high frequency
plateau modulus, at the shear thickening region. The high frequency plateau modulus is a function of
density of strands or bridges, and its evident increase at the shear thickening region indicates that
unassociated flower aggregates are becoming more involved in the associative HEUR network. A second
phenomena to describe shear thickening is a gaussian chain stretching of the associative HEUR
thickener as seen in Figure 25 [21].

17
Figure 24. HEUR loops, flower-like micelles and aggregate networks in an HEUR aqueous solution.
Figure 25. Shear induced chain stretching.
The strength of the HEUR associative network is strongly correlated to the hydrophobic functional
group and chain length. Hydrophobic ends that are cyclic cannot form micelles, and therefore will weaken
the associative aggregate network due to an inability to form loops and flower-like aggregates [21].
Longer hydrophobic end groups promote the formation of these flower-like micelles, lower the CAC,
increasing the strength and viscosity of the system [22]. Therefore, if the molecular weight of the HEUR
increased while the hydrophobic concentration remained constant, a decrease in viscosity would be seen.
Additionally, the viscosity increase as a function of molecular weight of HEUR is limited due to decreased
intramolecular forces and increased bridging since hydrophobic ends are further apart and less likely to
form flower-like micelles [23].
The hydrophobic ends of HEUR thickeners can associate with hydrophobic portions of a latex
particle surface. These interactions can increase in strength due to increasing the HEUR hydrophobic end
length [24]. At low concentrations of HEUR, it is thought that end groups and urethane links adsorb onto

18
the surface in a pancake like structure. At high concentrations it is believed urethane links desorb and
only hydrophobic end groups attach to the latex particle surface [25]. Viscosity is increased due to larger
effective particle volume from HEUR adsorption onto the latex particle surface [25]. In older models it was
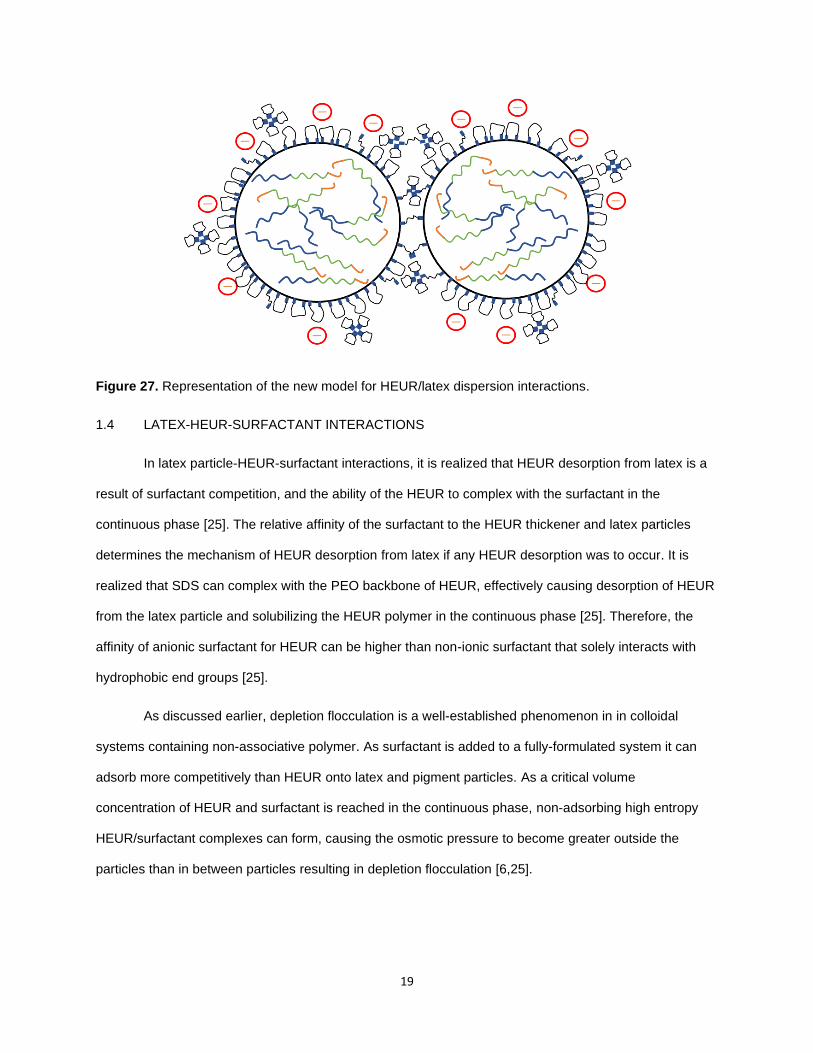
thought that the viscoelasticity of latex-HEUR dispersions depended on three dimensional HEUR
associative networks as seen in Figure 26; the viscoelasticity of pure HEUR solutions has been attributed
to the formation of a similar network [9]. In a recent, revised model it is realized that practically all of the
HEUR thickener in fully-formulated coatings is adsorbed onto the latex particles, and the rheology of
latex-HEUR dispersions is determined by transient HEUR bridges between particles as seen Figure 27
[9]. These bridges are in a dynamic equilibrium, constantly undergoing loop-to-bridge or bridge-to-loop
transitions. This new model also assumes that even above the HEUR critical micelle concentration the
HEUR-latex interaction is more energetically favored over latex-surfactant interactions or the formation of
flower micelles [26]. It is hypothesized that super-bridges can still form at excessively high concentrations
of thickener (>2.0wt%), but is outside the scope of a typical fully-formulated coatings [26]. Viscosity
increases in the revised model are due to effective volume increases of latex particles due to HEUR
adsorption [25].
Figure 26. Representation of the original model for HEUR/latex dispersion interactions. SDS covered
latex particles bridged by HEUR thickener in aqueous media.
19
Figure 27. Representation of the new model for HEUR/latex dispersion interactions.
1.4 LATEX-HEUR-SURFACTANT INTERACTIONS
In latex particle-HEUR-surfactant interactions, it is realized that HEUR desorption from latex is a
result of surfactant competition, and the ability of the HEUR to complex with the surfactant in the
continuous phase [25]. The relative affinity of the surfactant to the HEUR thickener and latex particles
determines the mechanism of HEUR desorption from latex if any HEUR desorption was to occur. It is
realized that SDS can complex with the PEO backbone of HEUR, effectively causing desorption of HEUR
from the latex particle and solubilizing the HEUR polymer in the continuous phase [25]. Therefore, the
affinity of anionic surfactant for HEUR can be higher than non-ionic surfactant that solely interacts with
hydrophobic end groups [25].
As discussed earlier, depletion flocculation is a well-established phenomenon in in colloidal
systems containing non-associative polymer. As surfactant is added to a fully-formulated system it can
adsorb more competitively than HEUR onto latex and pigment particles. As a critical volume
concentration of HEUR and surfactant is reached in the continuous phase, non-adsorbing high entropy
HEUR/surfactant complexes can form, causing the osmotic pressure to become greater outside the
particles than in between particles resulting in depletion flocculation [6,25].

20
1.5 PIGMENT-HEUR-DISPERSANT INTERACTIONS
It has been found that the choice of TiO2 pigment grade and dispersant has a significant effect on
the pigment-dispersant complex to be a part of the HEUR associative network [27]. Interior grade TiO2
(alumina-rich surface) has a significantly larger adsorption of HEUR than exterior grade TiO2 (silica-rich
surface). Furthermore, the dispersant can act as a coupling agent between the TiO2 surface and the
hydrophobes of the HEUR thickener. In this regard it is important for the dispersant be primarily
hydrophobic to attract HEUR hydrophobe end groups. Too much added dispersant can decreases the
adsorption of HEUR to pigment particles due to dispersant acting as a sink for HEUR molecules in the
continuous phase as seen in Figure 28 [27]. At typical dispersant levels of 1.0% most of the dispersant is
in the continuous phase [27]. Additionally, HEUR thickener molecules have a higher affinity to latex
particles than higher surface energy pigment particles; the latex particles are smaller than pigment
particles and therefore have increased surface area for enhanced HEUR adsorption [28]. Due to these
phenomena, virtually all HEUR molecules are expected to adsorb onto latex particle surfaces instead, so
it is critical for the correct dispersant to be chosen to couple pigment particles to HEUR molecules to
enhance phase stability [9].
Figure 28. HEUR adsorption as a function of hydrophilic and hydrophobic dispersant concentration [27].

21
1.6 RELAXATION MODES FROM FREQUENCY AND FLOW SWEEPS
There are many varying independent relaxation modes for each type of intramolecular or
intermolecular HEUR interaction. The presence or absence of these relaxation modes can be determined
from flow sweep tests and dynamic viscoelastic tests conducted in a range of time scales. According to
simulations conducted by Wang and Larson [29], an idealized latex-HEUR system can have at least four
relaxation modes: 1) relaxation of the HEUR chains 2) relaxation of transitional loops on the surface of
hydrophobes 3) relaxation or breakage of HEUR bridges 4) relaxation of clusters of bridged particles or
interparticle bridging networks. Figure 29 through Figure 31 demonstrate the various relaxation modes
present for various ranges of shear rate in a flow sweep experiments.
In low shear ranges, the HEUR bridges can comfortably relax and rearrange to associate with
latex particles more frequently, promoting formation of latex and pigment particle clusters. A Newtonian
plateau is evident where the particle cluster structure is not disrupted by the external shear stress and
large cluster hydrodynamics dominate. Therefore for low shear ranges, the primary viscosity contributions
arise from jamming and rearrangement of large particle clusters as seen in Figure 29 [9]. In section II,
mid-shear ranges, HEUR bridges are theorized to experience gaussian chain stretching that causes
shear-thickening [21]. In section III, the multimolecular bridges as seen in Figure 30 contribute
significantly to elasticity of the system. This mid-shear range contains a broad spectrum of relaxation
times due to the various types of multi-strand bridges; each bridge type has a unique relaxation time [26].
The multimolecular bridges undergo bridge and loop redistributions that disrupt the particle cluster
structure resulting relatively weak shear thinning behavior [9,25]. At higher shear rates the rate of bridge-
to-loop transitions is increased significantly; the HEUR hydrophobes are primarily occupied with
rearranging themselves on the surface of latex particles. As a result, no particle clusters are formed, and
viscosity continues to decrease due to lack of interparticle bridging and thinning of the adsorbed HEUR
layer [25].
For HEUR thickened waterborne latex coatings, a spectrum of relaxation times can be seen on
different timescales in oscillatory frequency sweep tests as determined previously by simulations [9]. For
example, at very high frequencies above 106 rad/s the primary viscoelastic response is dominated by

22
rearrangement of hydrophobes on the latex surface. For intermediate frequencies (100 to 106 rad/s) the
dominant viscoelastic response is due to relaxation of monomolecular and unimolecular bridges between
latex particles. Furthermore, at lower frequencies (10-4 to 101 rad/s) the dominant viscoelastic response is
due to jamming and rearrangement of large particle clusters [9]. Therefore, there are independent
relaxation modes for each type of interaction. Measuring the entire relaxation time spectrum can reveal
mechanisms of the viscoelastic behavior of the system and contributing factors to viscous flow.
Figure 29. Low shear viscosity contributions due to cluster rearrangements.
Figure 30. Mid-shear thinning viscosity contribution due to unimolecular and multimolecular bridging
redistributions.

23
Figure 31. High shear thinning viscosity due to high rate of loop-to-bridge transitions.

24
Chapter 2:
EXPERIMENTAL MATERIALS AND METHODS
The poly(butyl acrylate-co-styrene) (BA/STY) latex formulations were first prepared in 412.65 g
batches with formulation components as seen in Table 1 and Table 2. The concentration of HEUR,
0.23wt%, was determined by adding thickener until a viscosity between 90 – 100 KU was reached. This
large batch was used to prepare 20 g samples with varying concentrations of surfactant at 0.0, 0.10, 0.25,
0.75, 1.0, 2.0 wt.% based on the total weight of each sample. Phase stability of these samples were
determined after an equilibration period of 6 to 8 days. An additional batch of the formulation was
prepared and used to prepare samples having 0.20, 0.30, 0.40, 0.50, 0.60, 0.70 wt.% concentrations for
Tergitol 15-S-40, Triton X-100, and TSP-16. Additionally, a new batch of samples were prepared with
surfactant concentrations of 0.60, 0.62, 0.64, 0.66, 0.68, 0.70 wt.% for Tergitol 15-S-40, and surfactant
concentrations of 0.62, 0.64, 0.66, 0.68 wt% for Triton X-100. After, the grind was prepared with an EMI
laboratory disperser under high shear. The letdown formulation ingredients were then added while
undergoing mixing at low shear for additional 15 minutes. The 20g samples were mixed in a Thinky Mixer
at 1000 rpm for 1 minute prior to placing in 40ml glass vials.
The experimental HEUR polymer C18-E0795 and BA/STY latex was provided by Dow Chemical
Co. Furthermore, the non-ionic surfactants Tergitol 15-S-40 and Triton X-100 were provided by Dow
Chemical Co, whereas TSP-16 was provided by Stephan Co. The anionic surfactants sodium dodecyl
sulfate was purchased from Fisher Scientific, whereas TSP-16S and TSP-16PE30 were provided by
Stephan Co. The pigment TiPure R902+ was provided by Chemours, and the dispersant Tamol 731A was
provided by Dow Chemical Co. Surfactant structures can be seen in Figure 33 though Figure 36. Table 3
through Table 7 contains properties of these experimental materials. Furthermore, Table 8 contains the
information on fully-formulated coating. The pH of the fully-formulated system is above the IEP so
pigment particle surfaces are negatively charged. The SDS concentration is low and is not sufficiently
high to begin complexing with HEUR molecules [25]. The HEUR weight percent is significantly lower than
2.0% so large associate networks are not assumed to form [30]. The latex particles have higher surace
area and therefore will have higher affinity for HEUR molecules. Low concentration of dispersant will

25
promote adsorbtion of HEUR [27]. The hydrophobic latex will promote HEUR adsorbtion to latex particle
surfaces.
Table 1. Grind Formulation.
GRIND
Non-volatiles (% NV) Density (Lbs/Gal) Material Mass (g)
0 8.33 Water 54.22
25 9.19 Tamol 731A 3.5
5
HEUR C18-EO795 3.0
100 33.33 Ti-Pure R-902+ 83.41
Grind Total 144.13
Table 2. Letdown Formulation.
LETDOWN
Non-volatiles (% NV) Density (lbs/Gal) Material Mass (g)
Grind 144.113
0 8.33 Water 25.45
5 8.35 HEUR 18-EO795
15.8
45 8.60 BA/STY Latex 197.15
25 8.33 Water 30.12
TOTAL 412.65
Table 3. Description of formulation components.
Formulation Component Formulation Category Purpose
Water Liquid Medium Dispersion Medium – polar solvent
BA/STY Latex Binder/Resin Latex – acrylic emulsion that allows formation of film
C18-EO795 HEUR Additive Associative Thickener – HEUR
TiPure R-902+ Pigment Titanium Dioxide Pigment. Alumina and organic surface treatment.
Tamol 731A Additive Dispersant –Hydrophobic copolymer polyelectrolyte

26
Table 4. Properties of butyl acrylate (BA), styrene (STY), and methacrylic acid (MAA) latex
Property BA/STY
Composition 55 BA/43 STY/2 MAA
Solids (wt%) 45
Glass Transition Temperature (°C) 14
Particle Diameter (nm) 123
pKa 8.5
pH 9.6
Table 5. HEUR characteristics.
Model Thickeners Composition Mn (GPC) kg/mol Mw/Mn
C18-E0795 PEG 35,000 / Octadecyl Isocyanate
26.8 1.04
Table 6. Pigment properties.
Property Ti-Pure R902+
Type Rutile
Organic Treatment Yes
Alumina/Amorphous Silica Yes
IEP 4.7
Particle Size (nm) 405
pH 7.9
Figure 32. Hydrophobic copolymer polyelectrolyte dispersant generic structure for Tamol 731A.

27
Table 7. Surfactant properties.
Property Tergitol 15-S-40
Triton X-100
TSP-16 TSP-16S
TSP-16PE30
Sodium Dodecyl Sulfate (SDS)
Type Non-ionic Non-ionic Non-ionic
Anionic Anionic Anionic
M.W. (g/mol) 2000-2100 624 1100 1200 1200 288
CMC (mmol/liter) 0.64 0.30 0.0045 0.042 0.083 8.1
Figure 33. Tergitol 15-S-40 surfactant structure [3].
Figure 34. TSP-16 surfactant structure [31].
Figure 35. TSP-16S surfactant structure [31].

28
Figure 36. TSP-16PE30 surfactant structure [31].
Table 8. Characteristics of the fully-formulated system.
System Definition Value
PVC 19.87
% Non-volatiles by volume 30.47
KU viscosity 90 - 100
9.4 pH > 4.7 IEP negative surface charge
1.0 wt% SDS (polymer solids) SDS concentration low
HEUR 0.23wt% 0.23 wt% < 2.0 wt%
Pigment 405 nm > Latex 123 nm Latex nm2 > Pigment nm2
Tamol 731A 0.20wt% Low concentration for hydrophobic polyelectrolyte dispersant
BA/STY Hydrophobic Latex
A TA instruments Discovery HR-2 Hybrid Rheometer was utilized for all rheological testing. Each
sample was subjected to a pre-shear step followed by a logarithmic amplitude sweep, logarithmic
frequency sweep, and a logarithmic flow sweep test; the testing parameters can be seen in Table 9
through Table 12. A 40mm, 2° cone was used with a gap of 55 µm. Testing parameters were altered to
increase points per decade for a weight percent concentration range (0.60, 0.62, 0.64, 0.66, 0.68, 0.70)
for Tergitol 15-S-40 and Trition X-100 as represented in Tables 13 and 14.

29
Table 9. Pre-shearing conditions.
Parameter Value Units
Temperature 25 °C
Duration 60 s
Shear Rate 5 s-1
Table 10. Logarithmic Strain sweep conditions.
Parameter Value Units
Temperature 25 °C
Frequency 1 Hz
Strain % 0.01 – 100.0 %
Points per decade 5
Conditioning Time 3 s
Sensing Time 3 s
Table 11. Logarithmic Frequency sweep conditions.
Parameter Value Units
Temperature 25 °C
Frequency 0.01 – 100.0 Hz
Strain % 1.0 %
Points per decade 5
Conditioning Time 3 s
Sensing Time 3 s
Table 12. Logarithmic flow sweep conditions.
Parameter Value Units
Temperature 25 °C
Shear Rate 0.01 – 1000.0 s-1
Points per decade 5
Steady state sensing No
Equilibration Time 5 s
Averaging time 10 s

30
Table 13. Pre-shearing conditions for 0.60%, 0.62%, 0.64%, 0.66%, 0.68%, 0.70%)Tergitol 15-S-40 and Triton X-100 systems.
Parameter Value Units
Temperature 25 °C
Duration 120 s
Shear Rate 5 s-1
Table 14. Logarithmic flow sweep conditions for 0.60%, 0.62%, 0.64%, 0.66%, 0.68%, 0.70% Tergitol 15-S-40 and Triton X-100 systems.
Parameter Value Units
Temperature 25 °C
Shear Rate 0.001 – 1000.0 s-1
Points per decade 10
Steady state sensing
No
Equilibration Time 5 s
Averaging time 10 s

31
Chapter 3:
RESULTS AND DISCUSSION
In this project, a HEUR thickener was added to a fully-formulated coating until 90-100 KU
viscosity was reached resulting in 0.23wt% C18-EO795 HEUR being added. Formulations were prepared
and tested wherein the surfactant type (non-ionic or ionic) and concentration was varied. The HEUR
thickener concentration remained constant at 0.23wt%. Visual observations of phase stability were
recorded for samples of surfactant concentrations 0.0%, 0.10%, 0.25%, 0.75%, 1.0%, and 2.0%. Flow
sweep and dynamic viscoelasticity data were collected for all samples. First, the results on phase stability
will be discussed. Next, rheology data will be discussed and compared with phase stability data.
Furthermore, results for fully-formulated systems will be compared with previous results for latex-HEUR
(BA-STY 25.0 vol% / C18-EO795) and latex-HEUR-surfactant (25.0 vol% BA/STY / 0.50wt% C18-EO795)
systems.
Figure 37. Observable phase stability of fully formulated coatings with surfactants a) Tergitol-15-S-40 b)
Trition X-100 c) TSP-16 d) TSP-16S e) TSP-16PE30 f) SDS in weight percent.

32
Figure 37 shows images of fully-formulated coatings containing all six surfactants used in this
study at 0, 0.10, 0.25, 0,75, 1.0, and 2.0 wt.% concentrations. A systematic phase stability transition is
observed as Tergitol 15-S-40 surfactant concentration increases for the fully-formulated system. As
surfactant concentration increases there is a transition from a transparent phase separation to a phase
stable region, and then to a phase separation that is milky white. The transparent phase separation can
be seen in the 0.0%, 0.10%, and 0.25% Tergitol 15-S-40 samples. The phase stability is seen at the
0.75% concentration. The milky white phase instability is seen in the 1.0% and 2.0% concentration
samples. This transition correlates well with DPD diagrams for fully-formulated systems as seen in Figure
15 where surfactant concentration increases for constant HEUR concentrations. This suggests that there
are at least three mechanisms for these three visually different regions. In the flow sweep data, as seen in
Figure 38, there is a transition from shear thinning behavior towards a Newtonian plateau forming at low
shear rates as surfactant concentration increases. The Newtonian behavior then extends towards higher
shear rates as surfactant concentration increases. To examine and verify the connection between the
phase stability and low-shear Newtonian behavior, a series of formulations was prepared to have HEUR
concentrations between 0.60 and 0.70 wt.%. The Newtonian behavior is clearly confirmed by the data in
Figure 39.

33
Figure 38. Flow sweep overlay for BA/STY latex at 0.23wt% C18-EO795 thickener with Tergitol 15-S-40
surfactant in wt%.
Figure 39. Flow sweep overlay for BA/STY latex at 0.23wt% C18-EO795 thickener with Tergitol 15-S-40
surfactant in wt%.

34
A pattern that is consistent with phase stability and flow sweep data was observed in complex
modulus changes as surfactant is added to the fully-formulated systems. As surfactant concentration
increases the linear region of the complex modulus initially narrows within the 1% to 10% oscillation strain
range. This trend is observed in both Figure 40 and Figure 41 where the complex modulus linear region
progessively narrows from 0.0% to 0.40% surfactant loading. As seen in Figure 41, the complex modulus
linear region begins to broaden as surfactant level further increses from 0.50% to 0.70%. In Figure 41 a
strain hardening peak is seen at 0.70% surfactant concentration. This strain hardening peak can be seen
more clearly in Figure 42 for a series of formutaions prepared as a separate batch. It is realized that there
are batch to batch differences as seen comparing 0.60% between Figure 41 with Figure 42.
Figure 40. Complex modulus as function of oscillation strain at 1 Hz for fully-formulated system with
Tergitol 15-S-40 surfactant in weight percent (0.0%, 0.10%, 0.25%, 0.75%, 1.0%, 2.0%).

35
Figure 41. Complex modulus as function of oscillation strain at 1 Hz for fully-formulated system with
Tergitol 15-S-40 surfactant in weight percent (0.20%, 0.30%, 0.40%, 0.50%, .60%, 0.70%).
Figure 42. Complex modulus as function of oscillation strain at 1 Hz for fully-formulated system with
Tergitol 15-S-40 surfactant in weight percent (0.60%, 0.62%, 0.64%, 0.66%, 0.68%, 0.70%).

36
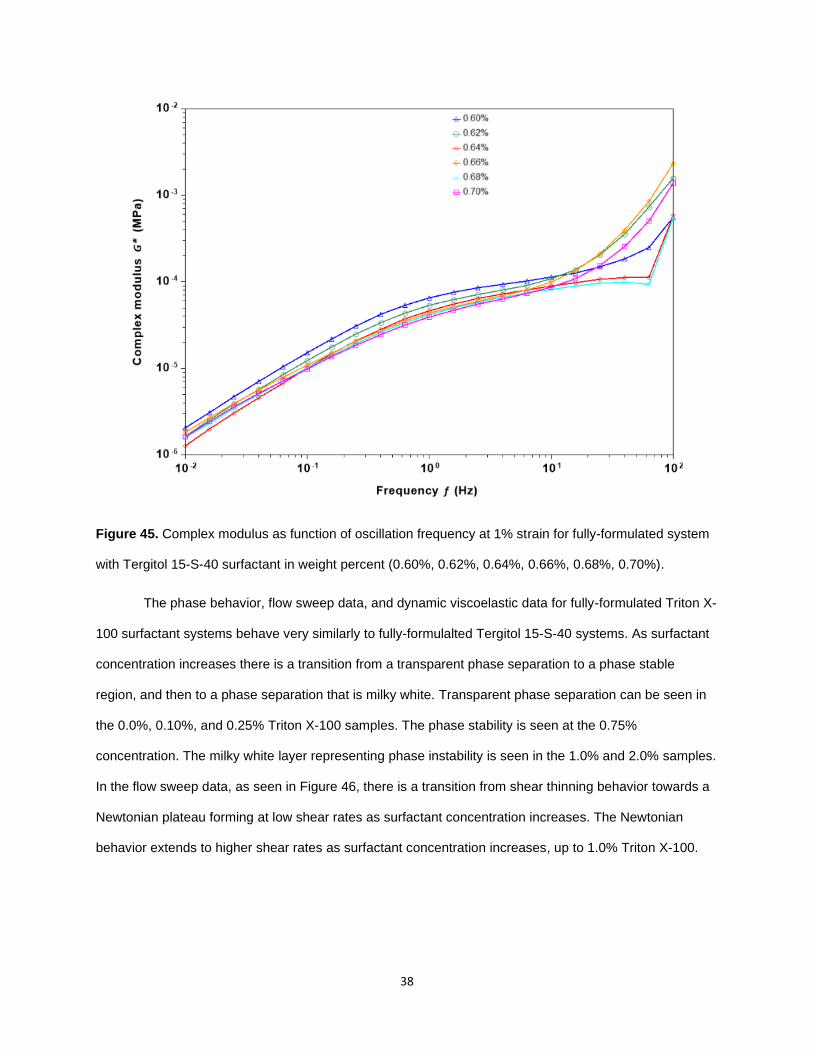
The oscillation frequency sweep results for the fully-formulated Tergitol 15-S-40 system are
shown in Figure 43. These results can be compared to the response of an ideal visoelastic liquid shown
in Figure 11 [6]. For the 0.0% surfactant formulation, the complex modulus behaves as expected for a
viscoelastic liquid. As the concentration of the surfactant increases, a high freuency plateau modulus is
seen at the 0.75% surfactant concentration as seen in Figure 43. Additionally it is seen that a plateou
begins to form at 0.70% in Figure 44 that represents results for a separate batch of formulations.
Furthermore, for there is the presence of a increase in hardening at the freqency of about 63 Hz that may
represent probing of latex-HEUR bridging in the formulations.
Figure 43. Complex modulus as function of oscillation frequency at 1% strain for fully-formulated system
with Tergitol 15-S-40 surfactant in weight percent (0.0%, 0.10%, 0.25%, 0.75%, 1.0%, 2.0%).

37
Figure 44. Complex modulus as function of oscillation frequency at 1% strain for fully-formulated system
with Tergitol 15-S-40 surfactant in weight percent (0.20%, 0.30%, 0.40%, 0.50%, .60%, 0.70%).
38
Figure 45. Complex modulus as function of oscillation frequency at 1% strain for fully-formulated system
with Tergitol 15-S-40 surfactant in weight percent (0.60%, 0.62%, 0.64%, 0.66%, 0.68%, 0.70%).
The phase behavior, flow sweep data, and dynamic viscoelastic data for fully-formulated Triton X-
100 surfactant systems behave very similarly to fully-formulalted Tergitol 15-S-40 systems. As surfactant
concentration increases there is a transition from a transparent phase separation to a phase stable
region, and then to a phase separation that is milky white. Transparent phase separation can be seen in
the 0.0%, 0.10%, and 0.25% Triton X-100 samples. The phase stability is seen at the 0.75%
concentration. The milky white layer representing phase instability is seen in the 1.0% and 2.0% samples.
In the flow sweep data, as seen in Figure 46, there is a transition from shear thinning behavior towards a
Newtonian plateau forming at low shear rates as surfactant concentration increases. The Newtonian
behavior extends to higher shear rates as surfactant concentration increases, up to 1.0% Triton X-100.

39
Figure 46. Flow sweep overlay for BA/STY latex at 0.23wt% C18-EO795 thickener with Triton-X-100
surfactant in wt%.
The complex modulus transistions as a function of surfactant loading are consistent with patterns
seen for the fully-formulated Tergitol 15-S-40 system. As surfactant concentration increases the complex
modulus linear region initially narrows within the 1% to 10% oscillation strain range. This trend is
observed in both Figure 47 and Figure 48 where the complex modulus linear region narrows from 0.0% to
0.30% with the exception of 0.40% being an outlier. As seen in Figure 48 the the linear region begins to
broaden in the transition from 0.50% to 0.70% surfactant. In Figure 47 a hardening peak is seen at
concentrations between 0.62% and 0.70% surfactant concentration. Possibly due to batch-to-batch
differences, the hardening peak was not observed for Figure 49. Furthermore, a significant decrease in
hardening is seen for 2.0% as is similar for the Tergitol 15-S-40 system.

40
Figure 47. Complex modulus as function of oscillation strain at 1 Hz for fully-formulated system with
Triton X-100 surfactant in weight percent (0.0%, 0.10%, 0.25%, 0.75%, 1.0%, 2.0%).

41
Figure 48. Complex modulus as function of oscillation strain at 1 Hz for fully-formulated system with
Triton X-100 surfactant in weight percent (0.20%, 0.30%, 0.40%, 0.50%, 0.60%, 0.62%, 0.64%, 0.66%,
0.68%, 0.70%).

42
Figure 49. Complex modulus as function of oscillation strain at 1 Hz for fully-formulated system with
Triton X-100 surfactant in weight percent (0.60%, 0.62%, 0.64%, 0.66%, 0.68%, 0.70%).
The oscillation frequency results for the fully-formulated Triton X-100 system are are alos similar
to the Tergitol 15-S-40 system with few exceptions. As the concentration of the surfactant increases a
complex modulus plateau begins to form at the 0.75% surfactant concentration as seen in Figure 50.
Additionally, in Figure 51 a plateau is seen to form at concentrations at 0.50%. Furthermore, for there is
the presence of an increase in hardening at the higher end frequencies that may represent probing of
bridigng in formulations.

43
Figure 50. Complex modulus as function of oscillation frequency at 1% strain for fully-formulated system
with Triton X-100 surfactant in weight percent (0.0%, 0.10%, 0.25%, 0.75%, 1.0%, 2.0%).

44
Figure 51. Complex modulus as function of oscillation frequency at 1% strain for fully-formulated system
with Triton X-100 surfactant in weight percent (0.20%, 0.30%, 0.40%, 0.50%, 0.60%, 0.62%, 0.64%,
0.66%, 0.68%, 0.70%).

45
Figure 52. Complex modulus as function of oscillation frequency at 1% strain for fully-formulated system
with Triton X-100 surfactant in weight percent (0.60%, 0.62%, 0.64%, 0.66%, 0.68%, 0.70%).
The phase behavior, flow sweep data, and dynamic viscoelastic data for fully-formulated TSP-16
surfactant systems are similar to fully-formulalted non-ionic Tergitol 15-S-40 and Triton X-100 systems
with some exceptions. As surfactant concentration increases, there is no observed phase stability region
as seen in Figure 37. However, there is a transition from a transparent phase instable region to a milky
white phase instable region. The transparent phase separation region can be seen at the 0.0%, 0.10%,
0.25%, and 0.75% TSP-16 levels. The milky white phase instability region is seen at the 1.0% and 2.0%
concentrations. In the flow sweep data, as seen in Figure 53, there is a transition from shear thinning
behavior towards a Newtonian plateau forming at 1.0% TSP-16 surfactant loading.

46
Figure 53. Flow sweep overlay for BA/STY latex at 0.23wt% C18-EO795 thickener with TSP-16
surfactant.
The complex modulus transistions as a function of surfactant loading are consistent with patterns
seen for the fully-formulated Tergitol 15-S-40 and Triton X-100 systems. As surfactant concentration
increases, the complex modulus linear region initially narrows within the 1% to 10% oscillation strain
range. This phenomenon is observed in both Figure 54 and Figure 55 for two different batches of fully-
formulated systems. As seen in Figure 55 the the complex modulus linear region begins to broaden in the
transition from 0.60% to 0.70% surfactant loading. There is an observed transition to a linear behavor
from concentrations 0.75% to 1.0%. There is no presence of a hardening peak for the oscillation strain
data.

47
Figure 54. Complex modulus as function of oscillation strain at 1 Hz for fully-formulated system with TSP-
16 surfactant in weight percent (0.0%, 0.10%, 0.25%, 0.75%, 1.0%, 2.0%).

48
Figure 55. Complex modulus as function of oscillation strain at 1 Hz for fully-formulated system with TSP-
16 surfactant in weight percent (0.20%, 0.30%, 0.40%, 0.50%, 0.60%, 0.70%).
The oscillation frequency results for the fully-formulated TSP-16 system are similar to Tergitol 15-
S-40 and Triton X-100 systems with few exceptions. As the concentration of the surfactant increases a
plateau begins to form at the 1.0% surfactant concentration as seen in Figure 56. Additionally in Figure 57
no plateaus are seen having sudden increases in the complex modulus as seen in the 1.0% sample.

49
Figure 56. Complex modulus as function of oscillation frequency at 1% strain for fully-formulated system
with TSP-16 surfactant in weight percent (0.0%, 0.10%, 0.25%, 0.75%, 1.0%, 2.0%).

50
Figure 57. Complex modulus as function of oscillation frequency at 1% strain for fully-formulated system
with TSP-16 surfactant in weight percent (0.20%, 0.30%, 0.40%, 0.50%, 0.60%, 0.70%).
The results for the three non-ionic surfatant (Tergitol 15-S-40, Triton X-100 and TSP-16) systems
were discussed above. Below, the results for the three anionic surfactant (TSP-16S, TSP-PE30, and
SDS) systems are discussed.
The phase behavior, flow sweep data, and dynamic viscoelastic data for fully-formulated anionic
TSP-16S surfactant systems are similar to fully-formulalted non-ionic surfactat systems. As surfactant
concentration increases, there is a transition from a transparent phase separation to a phase stable
region, and then to a phase separation that is milky white. The transparent phase separation region can
be seen in the 0.0%, 0.10%, and 0.25% TSP-16S regions. The phase stable region is seen at the 0.75%
concentration. The milky white phase instability is seen in the 1.0% and 2.0% concentrations. In the flow
sweep data, as seen in Figure 58, there is a transition from shear thinning behavior towards a Newtonian
plateau forming at low shear rates as surfactant concentration increases. The Newtonian behavior then
shifts towards the right and remains present as surfactant concentration increases.

51
Figure 58. Flow sweep overlay for BA/STY latex at 0.23wt% C18-EO795 thickener with TSP-16S
surfactant.
Interestingly, for this anionic surfactant, the complex modulus transistions as a function of
surfactant loading are consistent with patterns seen for the fully-formulated non-ionic surfactant systems,
with a few exceptions. As surfactant concentration increases the complex modulus linear region initially
narrows within the 1% to 10% oscillation strain range. This behavior is observed in Figure 59 for TSP-16S
in the range of 0.0% to 0.25%. Then the linear region begins to broaden and become more linear in the
transition from 0.25% to 0.75% surfactant. A strain hardening peak is seen at 0.75% surfactant loading.
Following this there is a siginficant decrease in complex modulus having a linear behavior at 1.0%.
Additionally, there is an increase in the complex modulus at 2.0% unlike the behavior of non-ionic Tergitol
15-S-40, Trition X-100 and TSP-16. This sample can be retested for confirmation of complex moduls
behavior.

52
The oscillation frequency results for the fully-formulated TSP-16S system are similar to the non-
ionic surfactant loaded system with few exceptions. As the concentration of the surfactant increases a
plateau begins to form at the 1.0% surfactant concentration as seen in Figure 60. Furthermore, for there
is the presence of a sudden increase in the complex moduls following the plateau at 1.0%.
Figure 59. Complex modulus as function of oscillation strain percent at 1 Hz for fully-formulated system
with TSP-16S surfactant in weight percent (0.0%, 0.10%, 0.25%, 0.75%, 1.0%, 2.0%).

53
Figure 60. Complex modulus as function of oscillation frequency at 1% strain for fully-formulated system
with TSP-16S surfactant in weight percent (0.0%, 0.10%, 0.25%, 0.75%, 1.0%, 2.0%).
The phase behavior, flow sweep data, and dynamic viscoelastic data for fully-formulated ionic
TSP-16PE30 surfactant systems are different from non-ionic and TSP-16S anionic surfactant loaded
systems. As surfactant concentration increases there is no observed phase stable region. However, there
is a transition from a transparent phase instable region to a mily white phase instable region. The
transparent phase separationscan be seen at the 0.0%, 0.10%, 0.25%, 0.75%, and 1.0% TSP-16PE30
concentrations. The milky white phase instability is seen for the 2.0% sample. In the flow sweep data, as
seen in Figure 61, the shear thinning behavior remains as surfactant concentration increases; there is no
Newtonian plateau.

54
Figure 61. Flow sweep overlay for BA/STY latex at 0.23wt% C18-EO795 thickener with TSP-16PE30
surfactant.
The complex modulus transistions as a function of surfactant loading are unique. As surfactant
concentration increases the complex modulus linear region narros within the 1% to 10% oscillation strain
range. This phenomenon is observed in Figure 62 where the complex modulus linear region continues to
narrow from 0.0% to 0.25%. Then the complex modulus linear region begins to broaden in the transition
from 0.25% to 0.75% surfactant loading; there is no presence of a strain hardening peak. Furthermore,
the complex modulus increses in magnitude significantly above the 0.0% sample unlike aformentioned
non-ionic and and TSP-16S surfactant loaded systems. Following this there is a siginficant decrease in
complex modulus magnitude having a linear behavior at 2.0%.
The oscillation frequency results for the fully-formulated TSP-16PE30 system are dissimilar to the
results for other surfactant systems discussed so far. As surfactant concentration increases a high
freqnency plateau modulus forms, following sudden increases in the complex modulus. A high frequency

55
plateau modulus forms for small concentrations of 0.10%. Furthermore, there is an exponential increase
in complex modulus that occurs for the 2.0% surfactant loaded system.
Figure 62. Complex modulus as function of oscillation strain percent at 1 Hz for fully-formulated system
with TSP-16PE30 surfactant in weight percent (0.0%, 0.10%, 0.25%, 0.75%, 1.0%, 2.0%).

56
Figure 63. Complex modulus as function of oscillation frequency at 1% strain for fully-formulated system
with TSP-16PE30 surfactant in weight percent (0.0%, 0.10%, 0.25%, 0.75%, 1.0%, 2.0%).
The phase behavior, flow sweep data, and dynamic viscoelastic data for fully-formulated anionic
SDS surfactant systems are similar to the anionic TSP-16PE30 surfactant loaded system. As surfactant
concentration increases there is no observed phase stable region. However, there is a transition from a
transparent phase instable region to a milky white phase instable region. The transparent phase
separation region can be seen in the 0.0%, 0.10%, and 0.25% SDS levels. The milky white phase
instability region is seen in the 0.75%, 1.0%, and 2.0% levels. In the flow sweep data as seen in Figure 64
the shear thinning behavior remains as surfactant concentration increases; there is no presence of a
Newtonian plateau.

57
Figure 64. Flow sweep overlay for BA/STY latex at 0.23wt% C18-EO795 thickener with SDS surfactant.
The complex modulus transistions as a function of surfactant loading are similar for TSP-16PE30.
As surfactant concentration increases the complex modulus linear region initially narrows within the 1% to
10% oscillation strain range. This phenomenon is observed in Figure 65 where complex modulus linear
region continues to narrow from 0.0% to 0.75%. Then the complex modulus decreases in magnitude
significantly in the transition from 0.75% to 1.0% surfactant levels; there is no presence of a strain
hardening peak. Furthermore, the complex modulus does not increase in magnitude significantly above
the 0.0% sample as does TSP-16PE30. Following this there is a siginficant increase in complex modulus
magnitude having a plateau behavior for 2.0%. This increase in complex moduli is similar to surfactant
TSP-16S, and should be subject to restesting to confirm behavior.
The oscillation frequency results for the fully-formulated SDS system are similar to TSP-16PE30
samples. As surfactant concentration increases there is a high freqneucy modulus plateau that forms as
seen in concnetration 0.75%, following a sudden increase in the complex modulus. However, for the higher
surfactant concnetrations a linear increase in complex modulus occurs following exponential behavior.

58
Figure 65. Complex modulus as function of oscillation strain percent at 1 Hz for fully-formulated system
with SDS surfactant in weight percent (0.0%, 0.10%, 0.25%, 0.75%, 1.0%, 2.0%).

59
Figure 66. Complex modulus as function of oscillation frequency at 1% strain for fully-formulated system
with SDS surfactant in weight percent (0.0%, 0.10%, 0.25%, 0.75%, 1.0%, 2.0%).
Prior work from latex-HEUR systems (BA-STY 25.0 vol% / C18-EO795) revealed Newtonian
plateau variances and phase instability as HEUR concentration increases [4,5]. A Newtonian plateau
begins to form around 0.05% for latex-HEUR systems at the low shear rate region as seen in Figure 67.
From 0.25% to 0.50% HEUR concentrations a Newtonian plateau remains, and additionally the system
experienced graininess as seen by optical microscopy. At concentrations of 0.75% HEUR, phase stability
resumes with no apparent syneresis. Furthermore, as concentration of HEUR increases to 1.0% the
Newtonian plateau dissapears. It is observed that the stability mechanisms of latex-HEUR systems
change as a function of HEUR concentration represented by the formation and dissapearance of the
Newtonain plateau. The presence of low shear rate Newtonian plateau and the presence of shear
thickining is evidence for a dynamic bridging network of latex and HEUR [32,33]. Surface area
calculations being conduced for the systems in Figure 67 indicate that the latex surface become saturated
with HEUR hydrophobes around 0.75 wt.% concentration [34]. The lack of a low shear Newtonian plateau

60
for 1.0% and higher concentrations of HEUR in Figure 67 implies viscosity contributions from a added
mechanism caused by the excess HEUR C18-EO795. From the data in Figure 38 in this thesis, it is clear
that the fully-formulated coating with 0.0% surfactant does not show a low shear Newtonian plateau
although the HEUR level is well below (i.e., 0.23%) compared to the levels at which Newtonian plateaus
were observed for the simpler latex-HEUR mixtures. Yet, it is assumed that the fully-formualted system
has excess HEUR beyond the level needed to saturate the available latex particle surfaces. This
assumption is reasonable given the fact that the fully formulated system is more crowded (30.47 %NVV),
and it contains TiO2 and other additiional ingredients.
Figure 67. Flow sweep data from latex-HEUR (25.0vol% BA/STY / 0.50wt% C18-EO795) experiments
[4,5].
Additionaly in previous latex-HEUR-surfactant formulation studies (25.0vol% BA/STY / 0.50wt%
C18-EO795) using identical surfactants, Newtonain plateaus were observed for increasing surfactant
concentrations [3]. As surfactant concentration increased in the latex-HEUR-surfactant mixtures the
Newtonain plateau broadened and a shear-thickening peak shifted to higher shear rates [3]. Eventually

61
the shear thickeinig peak dissapeared at higher surfactant concentratons around 2.0%. In the fully-
formulated systems a Newtonian plateau also increases in length as surfactant concentration increases.
In the fully-formulated systems, addition of Tergitol 15-S-40, Triton X-100, TSP-16, TSP-16S
surfactants first made a Newtonian plateau appear and then broadened at higher surfactant
concentrations. As mentioned before, it is likely that excess HEUR is present in the fully-formulated
system at 0.0% surfactant, beyond saturating latex particles. As surfactant is added to fully-formulated
systems, a Newtonian plateau forms for all formulations except those containing TSP-16PE30 and SDS.
In the latex-HEUR-surfactant formulations with 0.50% HEUR all surfactants had Newtonian plateaus [3].
The Figure 68 & Figure 69 present a comparison of the effect of Tergitol 15-S-40 on flow sweep results
for fully-formulated coatings and latex-HEUR-surfactant mixtures [3].
Figure 68. Flow swep overlay of Latex-HEUR-surfactant (25vol% BA/STY / C18-EO795 / Tergitol 15-S-
40) and fully-formulated 0.70% Tergitol 15-S-40 surfactant coatings [3].

62
Figure 69. Flow swep overlay of Latex-HEUR-surfactant (25vol% BA/STY / C18-EO795 / Tergitol 15-S-
40) and fully formulated 0.50% Triton X-100 surfactant coatings [3].
There are three composition ranges with different mechanisms observed for HEUR-latex and
fully-formulated systems. In the latex-HEUR system, as HEUR concentration is increased, the complex
modulus plots as function of %strain change shape. For fully-formulated systems (except for TSP-16PE30
and SDS systems), the inverse trend is observed when surfactant concentration is increased Figure 70.
The complex modulus behavior for the latex-HEUR-surfactant system follows a similar trend to the fully-
formulated system for surfactant concentration increases as well [3].

63
Figure 70. Complex modulus trends seen in oscillatory strain tests for increasing HEUR concentration in
a latex-HEUR system, and increasing surfactant concentration in a fully formulated system. These trends
are inverse of each other [4,5].
Results of an initial attempt to determine relaxation times associated with the mechanisms
discussed above is described below. Maxwell relaxation times were derived from modulus crossover (G’
and G”) as seen in using Equation 3. There is one modulus crossover point for the coating formulation
with 0.70% Tergitol 15-S-40 as seen in Figure 71. Table 15 shows relaxation times for frequency range
0.01 – 100 Hz for samples containing 0.70% Tergitol 15-S-40 and Triton X-100. Due to observed
inconsistencies in measured relaxation times as seen in Table 15, multiple oscillatory frequency tests will
be required to accurately estimate the total number of relaxation modes and relaxation times.

64
Figure 71. Oscillatory frequency sweep data example for 0.70% Tergitol 15-S-40 formulation; storage G’
and Loss G” modulus as a function of frequency (Hz).
Table 15. Precision tests in oscillatory frequency sweep data for measuring Maxwell relaxation times.
Formulation Number of Relaxation Modes
Relaxation Times (seconds)
0.70% Tergitol 15-S-40 Trial 1 2 0.036; 1.14
0.70% Tergitol 15-S-40 Trial 2 1 1.58
0.70% Triton X-100 Trial 1 1 1.28
0.70% Triton X-100 Trial 2 1 2.48
Similar analyses for the fully-formulated Tergitol 15-S-40 system shows the presence of multiple
modulus crossovers indicating that there is a spectrum of relaxation times as seen in Figure 72. The
0.75% Tergitol 15-S-40 surfactant formulation has two relaxation times present at 2.05 seconds and
0.022 seconds. This relaxation time of 2.05 seconds would be the highest relaxation time, assuming the
high relaxation time of 79.3 seconds for 0.25% concentration is an outlier. There could possibly be a

65
correlation between this maximum relaxation time of 2.05 seconds at 0.75% Tergitol-15-S-40 and phase
stability, but further experimentation and simulations would need to be carried out to verify this. The
cluster of relaxation times seen at 0.60, 0.62, 0.64, 0.66, 0.68, and 0.70 wt% surfactant levels possessed
Newtonian plateaus and strain hardening behavior like the 0.75% surfactant level that had phase stability.
Figure 72. Relaxation time as a function of Tergitol 15-S-40 surfactant wt% for fully-formulated systems.
In the Figure 73 it is realized that relaxation time decreases linearly for the Latex-HEUR-
surfactant systems [2,3]. Furthermore, the relaxation times are almost identical for both latex-HEUR-
surfactant (Tergitol-15-S-40 and Trition-X-100) systems. The fully formulated systems have more complex
relaxation times with multiple relaxation modes for surfactants. Further analysis will need to be performed
to understand the significance of these relaxation times for fully formulated coatings.

66
Figure 73. Comparison of relaxation time as a function of surfactant concentration for fully-formulated
(FF) 0.75wt% Triton-X-100 and 0.75wt%Tergitol-15-S-40 systems, Latex/HEUR/Surfactant systems, and
Latex/HEUR systems.
3.1 MECHANISTIC INTERPRETATION OF RESULTS
There are at least three mechanisms observed from the data presented in this thesis. The fully-
formulated 0.0% surfactant level system was seen to have a transparent phase separation; this
formulation has shear thinning behavior similar to a latex-HEUR system that exceeds 1.0% HEUR as
seen in Figure 67. In this latex-HEUR system, HEUR is in excess of the amount needed to completely
saturate the latex particle surfaces. It is assumed that the fully-formulated 0.0% surfactant level sample in
the current study is in this state of excess HEUR similar to the 1.0% latex-HEUR formulation. The fully-
formulated system is more crowed due to the addition of TiO2, and has less aqeous phase available than
the latex-HEUR system; the system has a NVV of 30.47% and PVC of 19.87. Therefore, it is seen that for
lower concentrations of HEUR, 0.23wt%, the fully-formulated system is demonstrating shear thinning
behavior similar to the 1.0% latex-HEUR sample as a result of being a more crowded system. It is
hypothesized that the syneresis observed at 0.0% surfactant levels can be explained by depletion

67
flocculation. Depletion flocculation is suggested because the system is more croweded. The excess
thickener can contribute to mechanisms generating enough entropy to cause depletion flocculation. In this
state of excess HEUR, for a crowded system, there are large networks of HEUR micelles associated with
a high degree of entropy. These large clusters of HEUR appear to contribute enough osmotic pressure to
drive aggregation of latex particles. The nature of HEUR interaction with TiO2 is unclear, and this can be
explored in further studies. As surfactant levels increse for the fully-formulated system, a phase stability
region occurs. The presence of a Newtonian plateau and strain hardening peak deomonstrates a change
in mechanism. All phase stable fully-formulated systems (0.75% Tergitol 15-S-40, 0.75% Trition X-100,
0.75% TSP-16S) had a Newtonian plateau in flow sweep data. Furthermore, these phase stable
formulations possessed a strain hardeining peak and high frequency plateau moduls from oscillatory
strain and frequency tests, respecitvely. The depletion mechanism is negated as surfactant is added to
the fully-formulated system. As surfactant is added, the large HEUR micelle networks begin to break up,
decreasing entropy in the system and eliminating driving force for depletion flocculation; HEUR begins to
interact with surfactant molecules to form smaller intermolecular complexes. As the depletion mechanism
is negated by increasing surfactant levels, the mechanism for stabalized bridged HEUR-latex particle
netowrks begin to dominate at low shear rates. This is evident at surfactant levels where the Newtonian
plateau, strain hardening, and high frequency plateau pheonemona were observed. The next mechanistic
change is observed when the milky white phase separation occurs. It appears, as surfactant in the fully-
formulated system is further increased, it begins to competitively adsorb to the latex particles. As a result
of competitive surfactant adsorbtion, less HEUR is adsorbed to the surface of latex particles and small
flocs of bridged latex particles are formed, causing bridging flocculation. At higher surfactant
concentrations, dramatic decreases in viscosity and complex modulus values were seen (see Figure 46
and Figure 47 as examples). This demonstrated that surfactant was saturating individual latex particles,
discouraging HEUR bridging.

68
Chapter 4:
CONCLUSIONS AND SUGGESTED FUTURE WORK
In the fully-formulated system several regions of phase stability were reached for formulations
prepared with Tergitol 15-S-40, Triton X-100, and TSP-16S. Furthermore, these regions of phase stability
were accompanied by the formation of Newtonian plateaus in flow sweeps, strain hardening in oscillatory
strain tests, and formation of high frequency plateau moduli in frequency sweeps. The TSP-16 fully-
formulated system had a Newtonian plateau but no presence of phase stability; this formulation did not
have a strain hardening peak in oscillation strain tests. It is assumed to have a phase stable region
between 0.75% and 1.0% levels and future experimental work should include examination of this
composition range.
The Maxwell relaxation times determined in this study revealed possible correlations between
relaxation times and phase stability. The highest relaxation time at 0.75% Tergitol 15-S-40 fully-
formulated systems also had phase stability, although more testing is required to confirm such
correlations.
For future experiments some critical variables to consider are, concentration (HEUR, surfactant,
dispersant, latex), particle size (latex and pigment), surface area, and hydrophobicity (HEUR
hydrophobe length, dispersant, latex, pigment).Once the effects of these critical variables are
characterized, comprehensive molecular models can be hypothesized.

69
REFERENCES
[1] R.R. Eley, Applied rheology and architectural coating performance, J. Coatings Technol. Res. 16
(2019) 263–305. https://doi.org/10.1007/s11998-019-00187-5.
[2] T.B. Smith, Syneresis and rheology mechanisms of a latex-HEUR associative thickener system, J.
Coatings Technol. Res. 14 (2017) 57–67. https://doi.org/10.1007/s11998-016-9829-x.
[3] B. Hammack, Rheological Investigations of Latex-Surfactant-Associative Thickener Aqueous
Systems, California Polytechnic State University, San Luis Obispo, 2019.
[4] G.W. Dombrowski, J.J. Rabasco, J.P. Hartnett, Patrick E. Sharpe, B.J. Shaw, T.B. Smith, R.H.
Fernando, Colloidal and Rheological Aspects of Stability of Latex Formulations, in: Coatings Sci.
Int. Conf., Amsterdam, Netherlands, 2017.
[5] T.B. Smith, D.L. Chisholm, G.W. Dombrowski, J.J. Rabasco, P.E. Harnett, R.H. Fernando, Effects
of Latex and Thickener Hydrophobicity on the Rheology and Stability of Aqueous Latex-HEUR
Mixtures, in: Am. Coatings Assoc. Conf., Indianapolis, IN, 2018.
[6] T. Tadros, Rheology of Dispersions, 2009. https://doi.org/10.1142/9789814293082_0008.
[7] L.O. Hellström, M. Samaha, K. Wang, A. Smits, M. Hultmark, Errors in parallel-plate and cone-
plate rheometer measurements due to sample underfill, Meas. Sci. Technol. 26 (2015).
https://doi.org/10.1088/0957-0233/26/1/015301.
[8] K.C. Tam, R.D. Jenkins, M.A. Winnik, D.R. Bassett, A structural model of hydrophobically modified
urethane-ethoxylate (HEUR) associative polymers in shear flows, Macromolecules. 31 (1998)
4149–4159. https://doi.org/10.1021/ma980148r.
[9] V. V. Ginzburg, T. Chatterjee, A.I. Nakatani, A.K. Van Dyk, Oscillatory and Steady Shear
Rheology of Model Hydrophobically Modified Ethoxylated Urethane-Thickened Waterborne Paints,
Langmuir. 34 (2018) 10993–11002. https://doi.org/10.1021/acs.langmuir.8b01711.
[10] L. Wang, One-Dimensional Visco-Elastic Waves and Elastic-Visco-Plastic Waves, Found. Stress
Waves. (2007) 219–264. https://doi.org/10.1016/b978-008044494-9/50006-8.
[11] F.N. Jones, M.E. Nichols, S.P. Pappas, Organic Coatings: Science and Technology, 4th ed., John
Wiley & Sons, Inc., Hoboken, NJ, USA, 2017. https://doi.org/10.1002/9781119337201.
[12] E. Kostansek, Controlling particle dispersion in latex paints containing associative thickeners, J.

70
Coatings Technol. Res. 4 (2007) 375–388. https://doi.org/10.1007/s11998-007-9037-9.
[13] J. Matusiak, E. Grządka, Stability of colloidal systems - a review of the stability measurements
methods, Ann. Univ. Mariae Curie-Sklodowska, Sect. AA – Chem. 72 (2017) 33.
https://doi.org/10.17951/aa.2017.72.1.33.
[14] T.J. Bell, R.H. Fernando, J. Ness, C. Street, K. Booth, S. Korenkiewicz, Phase diagrams for
HEUR-thickened acrylic paint systems, CoatingsTech. 12 (2015) 32–39.
[15] H. Butt, K. Graf, M. Kappl, Physics and Chemistry of Interfaces, Wiley, Cambridge, 2003.
https://doi.org/10.1002/3527602313.
[16] D.M. Mahli, M.J. Steffenhagen, L.L. Xing, J.E. Glass, Surfactant behavior and its influence on the
viscosity of associative thickeners solutions, thickened latex dispersions, and waterborne latex
coatings, J. Coatings Technol. 75 (2003) 39–51. https://doi.org/10.1007/bf02697720.
[17] S. Farrokhpay, A review of polymeric dispersant stabilisation of titania pigment, Adv. Colloid
Interface Sci. 151 (2009) 24–32. https://doi.org/10.1016/j.cis.2009.07.004.
[18] J. Clayton, Pigment/dispersant interactions in water-based coatings, JOCCA - Surf. Coatings Int.
80 (1997) 414–420. https://doi.org/10.1007/bf02699712.
[19] F.O.H. Pirrung, P.H. Quednau, C. Auschra, Wetting and dispersing agents, Chimia (Aarau). 56
(2002) 170–176. https://doi.org/10.2533/000942902777680496.
[20] M.A. Winnik, A. Yekta, Associative polymers in aqueous solution, Curr. Opin. Colloid Interface Sci.
2 (1997) 424–436. https://doi.org/10.1016/s1359-0294(97)80088-x.
[21] M. Barmar, B. Kaffashi, M. Barikani, Investigating the effect of hydrophobic structural parameters
on the thickening properties of HEUR associative copolymers, Eur. Polym. J. 41 (2005) 619–626.
https://doi.org/10.1016/j.eurpolymj.2004.10.007.
[22] J.P. Kaczmarski, J.E. Glass, Synthesis and Characterization of Step Growth Hydrophobically-
Modified Ethoxylated Urethane Associative Thickeners, Langmuir. 10 (1994) 3035–3042.
https://doi.org/10.1021/la00021a029.
[23] J.P. Kaczmarski, J.E. Glass, Synthesis and Solution Properties of Hydrophobically-Modified
Ethoxylated Urethanes with Variable Oxyethylene Spacer Lengths, Macromolecules. 26 (1993)
5149–5156. https://doi.org/10.1021/ma00071a026.

71
[24] M. Chen, W.H. Wetzel, Z. Ma, J.E. Glass, R.J. Buchacek, J.G. Dickinson, Unifying model for
understanding HEUR associative thickener influences on waterborne coatings: I. HEUR
interactions with a small particle latex, J. Coatings Technol. 69 (1997) 73–80.
https://doi.org/10.1007/bf02696149.
[25] M.S. Ibrahim, S. Rogers, N. Mahmoudy, M. Murray, A. Szczygiel, B. Green, B.D. Alexander, P.C.
Griffiths, Surfactant modulated interaction of hydrophobically modified ethoxylated urethane
(HEUR) polymers with impenetrable surfaces, J. Colloid Interface Sci. 539 (2019) 126–134.
https://doi.org/10.1016/j.jcis.2018.12.059.
[26] T. Chatterjee, M. Linsen, V. V. Ginzburg, D.A. Saucy, A.I. Nakatani, A.K. Van Dyk, Influence of the
first normal stress differences on model hydrophobically modified ethoxylated urethane-thickened
waterborne paints brush drag, Prog. Org. Coatings. 135 (2019) 582–590.
https://doi.org/10.1016/j.porgcoat.2019.06.029.
[27] E. Kostansek, Associative polymer/particle dispersion phase diagrams III: Pigments, J. Coatings
Technol. Res. 3 (2006) 165–171. https://doi.org/10.1007/BF02774506.
[28] R.H. Fernando, W.F. McDonald, J.E. Glass, The influence of associative thickeners on coatings
performance: III. Variation in percent non-volatiles, JOCCA - Surf. Coatings Int. (1986) 263–272.
[29] S. Wang, R.G. Larson, Multiple relaxation modes in suspensions of colloidal particles bridged by
telechelic polymers, J. Rheol. (N. Y. N. Y). 62 (2018) 477–490. https://doi.org/10.1122/1.4995306.
[30] K. Beshah, A. Izmitli, A.K. Van Dyk, J.J. Rabasco, J. Bohling, S.J. Fitzwater, Diffusion-weighted
PFGNMR study of molecular level interactions of loops and direct bridges of HEURs on latex
particles, Macromolecules. 46 (2013) 2216–2227. https://doi.org/10.1021/ma400114v.
[31] B. Hammack, D. Chisholm, A. Cheng, B. Bonilla, J. Ortiz Salazar, G. Dombrowski, J. Rabasco, P.
Hartnett, R.H. Fernando, Influence of Surfactants on the Rheology of HEUR-Thickened
Waterborne Latex Systems, in: Am. Coatings Assoc. Conf., San Luis Obispo, CA, 2020.
[32] Y. Otsubo, Nonlinear elastic model for shear thickening of suspensions flocculated by reversible
bridging, Langmuir. 15 (1999) 1960–1965. https://doi.org/10.1021/la9811362.
[33] F.A. Santos, T.J. Bell, A.R. Stevenson, D.J. Christensen, M.R. Pfau, B.Q. Nghiem, C.R. Kasprzak,
T.B. Smith, R.H. Fernando, Syneresis and rheology mechanisms of a latex-HEUR associative

72
thickener system, J. Coatings Technol. Res. 14 (2017) 57–67. https://doi.org/10.1007/s11998-016-
9829-x.
[34] J.A.O. Salazar, R.H. Fernando, Results from ongoing research at California Polytechnic State
University, 2020.