Reyes-Bermudez, Alejandro (2009) Cellular mechanisms of ...eprints.jcu.edu.au/8084/3/01whole.pdf ·...
149
This file is part of the following reference: Reyes-Bermudez, Alejandro (2009) Cellular mechanisms of coral calcification. PhD thesis, James Cook University. Access to this file is available from: http://eprints.jcu.edu.au/8084
Transcript of Reyes-Bermudez, Alejandro (2009) Cellular mechanisms of ...eprints.jcu.edu.au/8084/3/01whole.pdf ·...

This file is part of the following reference:
Reyes-Bermudez, Alejandro (2009) Cellular mechanisms of coral calcification. PhD thesis, James
Cook University.
Access to this file is available from:
http://eprints.jcu.edu.au/8084

To Sebastian…

Cellular Mechanisms of Coral Calcification
Thesis submitted by
Alejandro Reyes-Bermudez Bsc (Hons) U.J.T.L.
in September 2009
Thesis submitted in partial fulfillment of the requirements for the Degree of Doctor of
Philosophy in the Department of Biochemistry and Molecular Biology at James Cook
University of North Queensland

“Nunc qouque curaliis eadem natura remansit, duritiem tacto capiant ut ab aere;
quodque vimen in aequore erat, fiat super aequora saxum”
The Metamorphoses. (IV). Publius Ovidius Naso (43 BC – 17 AD)
“A pesar que parte de la naturaleza del coral permanece, endurece en contacto con el
aire; lo que vigoroso dentro del mar fue, fuera del agua en roca se convertira”.
Translation by Alejandro Reyes
“Although some of its characteristics remain, coral hardens in contact with air; what
was vigorous in the sea becomes like a rock out of water”.
Translation by Alejandro Reyes and David Miller

STATEMENT OF ACCESS
I, the undersigned author of this work, understand that James Cook University will make this thesis available for use within the University Library and, via the Australian Digital Theses network, for use elsewhere. I understand that, as an unpublished work, a thesis has significant protection under the Copyright Act and; I do not wish to place any further restriction on access to this work Or I wish this work to be embargoed until Or I wish the following restrictions to be placed on this work: _____________________________________ ______________ Signature Date

ii
STATEMENT ON SOURCES DECLARATION
DECLARATION
I declare that this thesis is my own work and has not been submitted in any form for
another degree or diploma at any university or other institution of tertiary education.
Information derived from the published or unpublished work of others has been
acknowledged in the text and a list of references is given.
Alejandro Reyes-Bermudez

iii
ACKNOWLEDGEMENTS
First I would like to thank my supervisor Prof. David Miller for the opportunity to
work in his lab and learn the basic molecular biology techniques that allowed me to
start my PhD thesis. Thanks David for your support during these years and for
introducing me to coral cellular biology. I would also like to thank Prof. James
Burnell for the chance to work in his lab while waiting for my scholarship as well as
for his vast knowledge of metabolic pathways. Thanks Jim for all your laboratory
assistance -all that looking over my shoulder really polished my lab skills-. I thank
Prof. David Yellowlees for the support during the scholarship application process.
Prof. Bette Willis for bringing the marine biology and fieldwork expertise to
Magnetic Island. Dr. Madeleine van Oppen among other things for teaching me how
to set up a PCR reaction and Dr. Kirsten Heimann for allowing me to work in her lab
with my coral larvae and teaching me how to do fluorescence microscopy.
I would like to thank Dr. Eldon Ball for having me in Canberra at ANU and
introducing me to some of the old calcification literature and showing me how to
properly photograph coral embryos. Dr. David Hayward for his friendship, lunch-time
soccer, endless lab tricks and pump master skills. I thank Dr. Lauretta Grasso for
assistance with microarray experiments at ANU and fieldwork in Orpheus Island
collecting larvae for microarray experiment. I thank Zhiyi Lin and others members of
Eldon’s Lab at ANU for 1) characterizing a third galaxin gene which strengthen the
galaxin paper/chapter, 2) repeating and validating the expression patterns of the
galaxing genes shown in the thesis and 3) editing and reviewing the first draft of the
galaxin chapter.
I thank assistant professor Monica Medina at UC Merced for the opportunity to work
in her lab and learn how to do microarray analysis and for editing the first drafts of
chapter 1 and 2. Thanks Monica for the chance to work in Mexico with Caribbean
coral species and for that “Alejandro no sabes escribir” it really helped me to improve
my writing. I thank Mickey DeSalvo for our Montastrea array paper, friendship and
support during my time in Merced. Thanks Mickey for editing and commenting on
the first draft of the Calmodulin chapter. I thank Dr. Chris Voolstra for annotating the
sequences used in the microarray chapter. I thank all members of the Medina Lab at

iv
UCM for all their help and assistance during my time at UCM. I also would like to
thank Prof. Denis Allemand and Dr. Sylvie Tambutté from the Monaco Scientific
center for commenting on a first draft that served as a templete for chapter 1.
I would like to thank present and past members of the Miller laboratory for sharing
the day-by-day endeavours in this cold and quiet environment ideal for protein
purification. I think this is the closest I get to an Antartic expedition. I thank Nikki
Hislop and Danielle De Jong for sharing protocols during the early stages of my PhD.
Chuya Shinzato for sharing the latest findings in transcription factors expression
patterns, Akira Iguchi for the fertilization lecture during the 2006 coral spawning, the
Miso soups and the blues performances. I thank Victor Hugo Beltran Ramirez for
“Los Gallos clandestinos” y el melodrama Mejicano. I hope the time machine you are
working on takes you places “güey”. I also want to thank Prof. Michael Ridd and
Prof. Beverley Glass for our weekly meetings that helped David to read my thesis and
Barbara Pennach for all the assistance with scholarship and postgraduate matters.
Finally I would like to thank my family and friends especially Kirsty Hewitt for the
support and patience over the PhD years, Lene Noreng for sharing her liver pate and
Norwegian caviar here in Townsville and for having me in Oslo on my way to
Bergen, Jillian Grayson for helping me to format the thesis, pivot table tutorials and
diving experiences. I thank the undersea explorer for an ACRS student award that
allowed me to observed in Osprey reef the exuberant repercussions of coral
calcification. I thank NGED for a laboratory exchange award that allowed me travel
to ANU to learn how to do microarray hybridisations and JCU for a JCUVC
scholarship. Finally, I would like to thank the Latin American truck drivers, without
them I would have not made it to Australia and a big thanks to “los chamanes de la
Amazonia” without them I would have not had the energy and focus to study the
cellular mechanisms of coral calcification.
Townsville, August 6th 2009.

v
ABSTRACT
Calcification is a basic process by which the controlled deposition of calcium salts
provides the basis of supportive structures in both vertebrate and invertebrate
organisms. While vertebrates use calcium phosphate in their skeletons, many
invertebrates use calcium carbonate in the form of calcite and/or aragonite. It is
assumed that vertebrates and invertebrates calcifying structures evolved separately
and represent discontinuous evolutionary systems. However, the fact that some
components of the calcification repertoire such as carbonic anhydrases and calcium
homeostasis mechanisms have an ancestral origin suggests that while extracellular
components of calcifying matrices have been recruited independently in different
taxa, basic cellular ion homeostasis and transport mechanisms are likely to be
conserved.
It has been suggested that calcification in corals evolved from an ancestral calcium
sink mechanism. As well as being a successful evolutionary strategy, the evolution of
scleractinian exoskeletons has had important ecological consequences, as corals
constitute the framework of tropical reef ecosystems. Corals are the only anthozoan
group in which settlement and tissue reorganization during metamorphosis correlates
with the deposition of a juvenile skeleton. While the oral ectoderm retains the
columnar organization seen in planulae, the aboral ectoderm is transformed from a
columnar epithelium into a squamous calcifying cell type known as the “calicoblast”.
This cell type secrets and matures an organic matrix that regulates the nucleation of
calcium carbonate crystals.
This study focuses on metamorphosis and the early stages of calcification in the
scleractinian coral Acropora millepora, and focuses on proteins of the galaxin family
and EF-hand calcium sensors as potential regulators of larval morphogenesis and
skeleton deposition. In parallel, primary cell cultures were established from five key
developmental stages and gene expression microarray analysis was used to investigate
changes in gene expression during metamorphosis and post-settlement life. Although
the results reported here reveal a high level of complexity, they will facilitate the
elucidation of the gene networks involved in processes such as lineage specific cell
differentiation and juvenile calcification.
vi
TABLE OF CONTENTS
STATEMENT OF ACCESS....................................................................................... i STATEMENT ON SOURCES DECLARATION...................................................... ii ACKNOWLEDGEMENTS...................................................................................... iii ABSTRACT.............................................................................................................. v TABLE OF CONTENTS ......................................................................................... vi TABLE OF FIGURES.............................................................................................. ix LIST OF TABLES ................................................................................................... ix CHAPTER 1. GENERAL INTRODUCTION. .................................................... 10
1. 1. Biomineralization......................................................................................... 10 1. 2. Coral calcification........................................................................................ 11 1. 3. Coral metamorphosis: the calicoblastic ectoderm. ........................................ 13 1. 4. The organic matrix: biological control over mineral deposition. ................... 14 1. 5. Calcium and carbonate: Sources and transport mechanisms.......................... 17 1. 6. Carbonate ions: The divalent anion. ............................................................. 18 1. 7. Calcium signaling: Calcium mediated calcium carbonate deposition. ........... 19 1. 8. Calcification and photosynthesis: Light-enhanced calcification. ................... 20 1. 9. References. .................................................................................................. 23
CHAPTER 2. In vitro culture of cells derived from larvae of the staghorn coral Acropora millepora................................................................................................. 29
2.1. ABSTRACT…… ......................................................................................... 29 2. 2. INTRODUCTION. ...................................................................................... 29 2. 3. MATERIAL AND METHODS.................................................................... 30
2. 3. 1. Collection of embryos. ......................................................................... 30 2. 3. 2. Cell culture........................................................................................... 30 2. 3. 3. Monitoring the nature of cells in culture. .............................................. 31 2. 3. 4. Polymerase chain reaction (PCR). ........................................................ 31 2. 3. 5. DNA sequencing. ................................................................................. 32 2. 3. 6. Microscopy. ......................................................................................... 32
2. 4. RESULTS and discussion. ........................................................................... 32 2. 4. 1. Cell cultures originated from planula tissues gave higher PCR yields than those started from early stages. ........................................................................ 32 2. 4. 2. Thraustochytrids are recurrent contaminants of coral cell cultures. ....... 35
2. 5. CHAPTER FIGURES AND TABLES. ........................................................ 36 2. 6. REFERENCES ............................................................................................ 39
CHAPTER 3. Differential expression of three galaxin-related genes during settlement and metamorphosis in the scleractinian coral Acropora millepora. ... 40
3. 1. ABSTRACT. ............................................................................................... 40 3. 2. INTRODUCTION. ...................................................................................... 40 3. 3. MATERIAL AND METHODS.................................................................... 43
3. 3. 1. Fixation and storage. ............................................................................ 43 3. 3. 2. In situ hybridization and image capture. ............................................... 43 3. 3. 3. Sequencing........................................................................................... 43 3. 3. 4. RACE. ................................................................................................. 43 3. 3. 5. Virtual northern blots. .......................................................................... 44
3. 4. RESULTS.................................................................................................... 44 3. 4. 1. Identification of three galaxin-related genes in Acropora ..................... 44 3. 4. 2. Structure of the predicted galaxin-related proteins from Acropora ........ 44

vii
3. 4. 3. The Amgalaxin-like proteins are related but divergent.......................... 45 3. 4. 4. Expression analysis of A. millepora galaxin-related genes.................... 46
3. 5. DISCUSSION.............................................................................................. 47 3. 5. 1. The Amgalaxin-like proteins combine characteristics of two distinct protein families involved in mollusc calcification. ........................................... 48 3. 5. 2. What is the function of the Amgalaxin-like proteins? ........................... 50 3. 5. 3. Amgalaxin and the mesenteries: fiber-like calcification. ....................... 51 3. 5. 4. Galaxins as examples of functional convergence after secondary recruitment?..................................................................................................... 52
3. 6. CHAPTER FIGURES.................................................................................. 54 3. 7. REFERENCES. ........................................................................................... 60
CHAPTER 4. An atypical calmodulin and a neuronal calcium sensor protein as potential targets of CaM regulation during development of the coral Acropora millepora................................................................................................................. 63
4. 1. ABSTRACT. ............................................................................................... 63 4. 2. INTRODUCTION. ...................................................................................... 63 4. 3. MATERIALS AND METHODS. ................................................................ 65
4. 3. 1. Collection of larvae. ............................................................................. 65 4. 3. 2. RNA extraction. ................................................................................... 65 4. 3. 3. RNA quantification. ............................................................................. 66 4. 3. 4. Preparation of cDNA for Virtual Northern Blotting. ............................. 66 4. 3. 5. Southern blotting and hybridisation. ..................................................... 66 4. 3. 6. Generation of radioactive probes. ......................................................... 67 4. 3. 7. Fusion-protein expression..................................................................... 67 4. 3. 8. Glutathione Sepharose affinity purification. ......................................... 67 4. 3. 9. Ni-NTA affinity purification. ............................................................... 68 4. 3. 10. Polyacrylamide gel electrophoresis..................................................... 68 4. 3. 11. Affinity chromatography. ................................................................... 68 4. 3. 12. Western blotting. ................................................................................ 69 4. 3. 13. Inmunoprecipitation. .......................................................................... 70
4. 4. RESULTS.................................................................................................... 70 4. 4. 1. Identification of three Acropora millepora EF-hand proteins. ............... 70 4. 4. 2. Calcium signalling during coral development: conserved and specific calcium dependent pathways............................................................................ 72 4. 4. 3. Both AmCaM-like and AmNC interact with AmCaM in vitro. ............. 72
4. 5. DISCUSSION.............................................................................................. 74 4. 5. 1. Acropora millepora’s EF-hand proteins................................................ 74 4. 5. 2. Acropora Calmodulins: AmCaM and AmCaM-like.............................. 75 4. 5. 3. Acropora Neurocalcin: AmNC. ............................................................ 75 4. 5. 4. AmCaM mediated signalling transduction mechanisms: target specificity and availability. ............................................................................................... 76 4. 5. 5. AmCaM mediated signal transduction during settlement and metamorphosis................................................................................................. 78 4. 5. 6. In vitro AmCaM interactions: AmNC and AmCaM-like putative AmCaM targets during settlement and metamorphosis. .................................................. 78
4. 6. CHAPTER FIGURES.................................................................................. 81 4. 7. REFERENCES. ........................................................................................... 85
viii
CHAPTER 5. cDNA microarray analysis of metamorphosis and the early stages of calcification in the scleractinian coral Acropora millepora. ............................. 88
5.1. ABSTRACT…. ............................................................................................ 88 5. 2. INTRODUCTION. ...................................................................................... 88 5. 3. MATERIAL AND METHODS.................................................................... 90
5. 3. 1. Collection of samples ........................................................................... 90 5. 3. 2. RNA extraction and amplification ........................................................ 91 5. 3. 4. Microarray hybridisation and array description..................................... 91 5. 3. 5. Experimental design and microarray data analysis................................ 92
5. 4. RESULTS.................................................................................................... 93 5. 4. 1. Cluster I. Genes down-regulated after settlement: highest expression in planulae. .......................................................................................................... 93 5. 4. 2. Cluster II. Genes up-regulated after settlement: highest expression in calcifying stages. ............................................................................................. 95 5. 4. 3. Cluster III. Genes up-regulated after settlement but stable or down-regulated in adult: highest expression in juvenile settled stages. ....................... 96 5. 4. 4. Cluster IV. Genes stable or differentially expressed in juvenile stages but up-regulated in adult: highest expression in adult tips. ..................................... 98
5. 5. DISCUSSION............................................................................................ 100 5. 5. 1. Differential gene expression profiles were identified between larval, juvenile and adult stages during the life history of A. millepora. .................... 100 5. 5. 2. Planula larvae: a connection with Bilateria. ........................................ 102 5. 5. 3. Genes down-regulated after settlement: Initiation of morphogenesis, calcium signalling and lipid metabolism related molecules. ........................... 103
5. 5. 3. 1. Initiation of morphogenesis: BMP signalling. ............................ 105 5. 5. 3. 2. Calcium signalling and lipid metabolism. ................................... 107
5. 5. 4. Genes up-regulated in settled juvenile and calcifying stages: Morphogenesis of adult structures and skeleton deposition related molecules. 110
5. 5. 4. 1. Calcification related molecules. .................................................. 110 5. 5. 4. 2. Morphogenesis of adult structure related molecules. ................... 111
5. 5. 5. Cluster IV. Genes with highest expression in adult tips: asexual reproduction and genes associated with responses to environmental conditions....................................................................................................................... 114
5. 6. CHAPTER FIGURES AND TABLES. ...................................................... 118 5. 7. REFERENCES. ......................................................................................... 130
CHAPTER 6. GENERAL DISCUSSION........................................................... 138 6. 1. Coral metamorphosis and the calicoblastic ectoderm.................................. 138 6. 2. Coral calcification and the organic matrix. ................................................. 140 6. 3. Final remarks and future outlook................................................................ 142 6. 4. References. ................................................................................................ 143

ix
TABLE OF FIGURES
Figure 2. 1. Cell aggregates and PCR identification of cultured cells. ...................... 36 Figure 2. 2. Thraustochytrids overgrow coral cells in culture. .................................. 37 Figure 2. 3. Cell diversity during coral development................................................ 38 Figure 3. 1. Inferred protein sequences of Amgalaxin and the Amgalaxin-like
molecules......................................................................................................... 54 Figure 3. 2. Alignments of the Cys rich repeats of the three proteins........................ 55 Figure 3. 3. Virtual northern blots of the three genes arranged in the order in which
they are expressed............................................................................................ 56 Figure 3. 4. Developmental expression of Amgalaxin-like 1..................................... 57 Figure 3. 5. Developmental expression of Amgalaxin-like 2..................................... 58 Figure 3. 6. Developmental expression of Amgalaxin. ............................................. 59 Figure 4. 1. AmEF-hand proteins: Primary structure. ............................................... 81 Figure 4. 2. Temporal expression of EF-hand proteins. ............................................ 82 Figure 4. 3. AmCaM interacts in vitro with AmCaM-like and AmCaM proteins. ..... 83 Figure 4. 4. AmCaM co-precipitates with AmCaM-like and AmCaM. .................... 84 Figure 5. 1. Experimental design. .......................................................................... 118 Figure 5. 2. Cluster I: DEGs downregulated after settlement.................................. 119 Figure 5. 3. Cluster II: DEGs upregulated after settlement. .................................... 120 Figure 5. 4. Cluster III: DEGs with highest expression in juvenile settled stages. ... 121 Figure 5. 5. Cluster IV: DEGs with highest expression in Adult tips. ..................... 122
LIST OF TABLES
Table 2. 1. PCR markers for cell identification. ....................................................... 37 Table 5. 1. Cluster and expression patterns summary. ............................................ 123 Table 5. 2. Functional annotation and expression values for DEGs of interest........ 124

10
CHAPTER 1. GENERAL INTRODUCTION.
1. 1. Biomineralization.
Biomineralization is the formation of minerals by living organisms ranging from
metal crystals in bacteria to mineral structures in unicellular and multicellular
eukaryotes (Wang et al., 2008; Wilt, 2005). Animal calcification is one of many
biomineralization processes by which controlled deposition of calcium salts produce
supportive structures in both vertebrate (i.e. bones, teeth) and invertebrate species (i.e.
molluscan shells, coral skeletons). Calcification is a fundamental process that occurs
in multiple animal groups ranging from basal metazoans such as sponges and corals to
deuterostomes such as echinoderms and chordates (Marin et al., 2008). While
vertebrates use calcium phosphate in the form of hydroxyapaptite to build their
skeletons, many invertebrates use calcium carbonate in the form of calcite and/or
aragonite (Fukuda et al. 2003; Taylor et al., 2008).
It is thought that vertebrates and invertebrates calcifying structures evolved separately
and constitute discontinuous evolutionary systems (Marin et al., 2008). The fact that
calcifying matrix proteins in both sea urchins (Livingston et al., 2006) and vertebrates
(Kawasaki and Weiss, 2006) belong to small gene families and are found tightly
clustered in their respective genomes suggests ‘recent’ independent origins by gene
duplication (Kawasaki and Weiss, 2006). The finding that 85% of the secreted
proteins involved in shell formation in the mollusc Haliotis asinina are unknown
novel proteins (Jackson et al., 2006) supports this idea. However, both calcifying
groups (invertebrates and vertebrates) use proteins with similar biochemical
properties, which suggests convergence in their biochemical strategies for
calcification (Ettensohn, 2009).
On the other hand, several lines of evidence support the idea that some components of
the calcification repertoire have an ancestral origin. Lowenstam and Margulis (1980)
suggested that a tuning of ancestral intracellular calcium homeostasis and fluxes
mechanisms that allowed the control deposition of calcium salts, preceded the
initiation of calcification in the early Cambrian. For example, the enzyme carbonic
anhydrase which ancestral function is to that catalyze the reversible conversion of

11
carbon dioxide into bicarbonate (one of the precursor ions for calcification) has been
linked to calcification in a wide range of organisms such as sponges (Jackson et al.,
2007), corals (Isa and Yamazato, 1984) and vertebrates (Rajachar et al., 2009).
One intriguing hypothesis suggests that calcifying matrices originated from changes
in pre-existing ancestral epithelial mucus secretions (Marin et al., 1996). The central
idea is that non-calcifying precursors, for example mucins of the secretory system,
gave rise to proteins able to regulate calcification. Mucins are heavily glycosylated
and sulphated proteins that have characteristic tandem repeat organization able to
form disulfide bonds through cross-linking of cysteine (Cys) enriched domains
(Marin et al. 2000). In an attempt to test this hypothesis, Puverel et al., (2005) used
antibodies against the coral organic matrix in immunocytochemical analysis, but these
did not label mucus-producing cells. Circumstantial evidence does, however, lend
some support to the Marin hypothesis; proteins with mucin-like characteristics have
been identified in calcifying and non-calcifying matrices from a diverse range of
invertebrates (Fukuda et al. 2003; Marin et al. 2000).
Another piece of evidence that supports the idea of an ancestral calcification “tool kit”
is the regulatory role of growth factors such as BMP-2 in mollusc shell formation
(Matsushiro and Miyashita, 2004) and vertebrate ossification (Wonzney et al., 1988).
Furthermore the finding of a BMP-2/4 ortholog in corals (Hayward et al., 2002) and
its localization in the calcifying epithelium (Zoccola et al., 2009) suggests an
ancestral function for this family of proteins in calcification. Together these
observations imply that extracellular matrix proteins may have been recruited on
multiple occasions to roles in controlling calcification, as have carbonic anhydrases;
calcification has evolved on multiple occasions but has been constrained in its choice
of starting materials, blurring the distinction between conservation and convergence.
1. 2. Coral calcification.
The exoskeleton of scleractinian corals has been a particularly successful evolutionary
innovation, and constitutes the framework of tropical reef ecosystems (Veron, 2000;
Gunderson, 2007). Scleractinian corals originated and played a major reef-building
role during the Triassic period (i.e. 248 mya) (Veron, 2000). This initial event in the
12
evolution of coral reefs was followed by periods of low abundance of scleractinian
skeletons in the fossil record. Modern reefs have been dominated by scleractinians
since the early Oligocene (33.7 mya) (Grigg, 1988).
Coral reefs contribute about 0.05% of net carbon dioxide (CO2) fixation in the global
oceans (Crossland et al. 1991). They are the most extensive biological structures on
the planet, covering between 280-600 thousand square kilometers of the Earth’s
surface (Veron, 2000). This marine ecosystem, considered one of the most productive
(Gunderson, 2007), is built upon a framework of scleractinian exoskeletons, which
support a diverse community of organisms (Hatcher, 1997). Although coral reefs
represent the net accumulation of calcium carbonate (CaCO3) by both coral colonies
and coralline algae (Kleypas et al., 1999), scleractinian polyps are responsible for
much of this CaCO3 deposition. Scleractinian CaCO3 deposition is estimated to be
approximately 10 kg of CaCO3 m2/year, representing approximately half of the
world’s CaCO3 production (Chave et al. 1975).
This elevated calcification rate is, in great part, the consequence of a symbiotic
relationship between scleractinian corals and photosynthetic dinoflagellate algae from
the genus Symbiodinium (Veron, 2000, Stanley, 2006). The algae use CO2 and
nitrogenous waste originated from coral metabolism while supplementing 90% of the
host nutrition by translocating glycerol, sugars and amino acids (reviewed in Trench
1979). This symbiosis restricts coral reef distribution to shallow tropical waters due
to the requirements for light availability for photosynthesis (Stanley, 2006; Veron,
2000) and to tropical and subtropical waters where temperature would allow the high
calcification rates necessary for reef formation (Standley, 2006).
Coral reefs worldwide are in decline and are predicted to face even greater risks in the
future due to decreased calcification rates as a consequence of ocean acidification
(Kleypas et al. 1999; Hoegh-Guldberg et al., 2007). Thus, a more detailed description
of the cellular basis of coral calcification is urgently needed in order to more
accurately predict and manage the future of coral reefs. Recent observations (Kleypas
et al. 1999; Hoegh-Guldberg et al., 2007), in combination with palaentological data
(Lowenstein et al., 2003; Ries et al. 2006), suggests that current trends on climate
change will likely affect the distribution of coral reefs and their composition. A better
13
understanding of the coral biomineralization process is not only timely but also
feasible given new molecular and genomic approaches being introduced into coral
reef research.
In order to understand the mechanisms behind coral calcification, it is essential to
examine the cellular biology of the calcifying cell (i.e. the calicoblast), including the
genetic pathways that lead to: 1) calicoblast differentiation, and 2) calicoblast
interactions with neighboring cell populations involved in ion transport and
production of organic matrix precursors. So far there have been few attempts to
examine the genetic pathways involved in calicoblast differentiation and/or secretion
of organic matrix precursors during skeletogenesis in corals.
1. 3. Coral metamorphosis: the calicoblastic ectoderm.
Scleractinian corals are the only anthozoan group in which settlement and tissue
reorganization during metamorphosis correlates with the deposition of a juvenile
skeleton (Le Tessier, 1998; Clode and Marshall, 2004). During metamorphosis, coral
planulae go through an oral endodermal tissue rearrangement that gives rise to the
mesenteries and more extensive changes in the aboral ectoderm that give rise to the
calcifying tissue; while the oral ectoderm retains the columnar organization seen in
the planula, the aboral ectoderm is transformed from a columnar epithelium into a
squamous calcifying cell type known as the “calicoblast” (Vandermeulen, 1975;
Clode and Marshall 2004).
This newly formed epithelium secretes a macromolecular network of proteins, lipids
and polysaccharides known as the organic matrix (OM) which controls mineral
deposition by organizing CaCO3 nucleation and determining the type of polymorph,
as well as crystal size and shape (Fukuda et al. 2003; Clode and Marshall, 2003;
Watanabe et al. 2003). Only calicoblastic cells in direct contact with the skeleton
appear to be responsible for the synthesis and secretion of OM components (Puverel
et al. 2005).
After settlement, the coral polyp secretes an early exoskeleton that is the precursor to
adult colony morphology. The early skeleton differs from adult skeletons in both

14
structure and crystal type. While the early skeleton is lightly mineralised with smaller
randomly oriented crystals of both calcite and aragonite (Vandermeulen and Watabe,
1973; Le Tessier, 1988), adult skeletons display a fibrous parallel growth that allows
massive deposition of aragonite calcification (Vandermeulen and Watabe, 1973; Cuif
and Dauphin, 2005).
In the coral Pocillopora damicornis, the basal plate and protosepta are the first
skeletal elements to be formed (Vandermeuden and Watabe 1973). The basal plate
has horizontally oriented crystals that are not present in adult skeletons, and its
deposition involves the formation of spherulitic crystals that will subsequently fuse
together (Vandermeuden, 1975). In P. damicornis, the parallel growth characteristic
of adult calcification is evident 72 hours after settlement, co-incident with formation
of the mesenteries (Vandermeuden and Watanabe, 1973).
Thus it is reasonable to think that: 1) early skeleton deposition is correlated with the
aboral ectodermal transition from columnar cells to calicoblasts (Vandermeulen and
Watabe, 1973; Le Tissier, 1988) and 2) while the base of the polyp is likely to be
responsible for the first calcite- and aragonite-containing skeletal elements (i.e. basal
septa & protosepta) the mesenteries may be responsible for the fiber-like calcification
observed in coral colonies.
1. 4. The organic matrix: biological control over mineral deposition.
Organisms exert great control over mineral deposition for support structures. This
biological control is reflected by the diversity of morphologies observed in calcified
structures such as the variety of coral skeletons as well as in the different CaCO3
polymorphs deposited by calcifying organisms. Scleractinian exoskeletons are
composed predominantly of aragonite, in contrast to the spicules of alcyonarian soft
corals, which are mostly composed of calcite (Rahman et al. 2006). In other well-
studied groups there are also variations in CaCO3 polymorph composition. For
example, mollusc shells are most commonly composed of aragonite, but in some
cases calcite predominates, and in other groups both calcite and aragonite crystals are
present (Adaddi et al. 2006).

15
In scleractinian corals, as in other biomineralizing organisms, the OM is composed of
proteins, lipids and polysaccharides (Cuif and Dauphin, 2005; Puverel et al. 2005a)
and it has been shown that matrix biosynthesis, rather than calcium deposition may be
the limiting factor controlling coral skeletogenesis (Allemand et al., 1998). OM
components are secreted to the extracellular space by the calcifying cells prior to
mineralization (Goldberg 2001, Clode et Marshall 2002); this diverse network of
organic molecules (Cuif and Dauphin, 2005; Puverel et al. 2005b) drives species-
specific regulation of the biomineralization process. Each of the OM components
fulfils a specific role such as control of crystal growth or construction of the matrix
framework (Watanabe et al. 2003; Addadi et al. 2006; Nudelman et al. 2006). The
presence of two types of vesicles in calicoblastic cells from the coral G. fascicularis
suggests that OM precursors might be concentrated and transported in vesicles before
being discharged to the mineralization site (Clode and Marshall, 2002b).
Data on scleractinian OM proteins is rather limited since only one protein, known as
Galaxin, has been well characterized (Fukuda et al., 2003). Galaxin was isolated from
the OM of Galaxea fascicularis (Fukuda et al. 2003), and contains a Cys rich region
arranged in tandem repeats with conserved di-Cys motifs, two putative N-
Glycosylation sites and a N-terminal signal peptide sequence. The presence of these
motifs has led some authors to suggest that the role of this protein in the OM is to
form a macromolecular framework (Fukuda et al. 2003, Watanabe et al. 2003) as
glycoproteins arranged in tandem repeat with conserved Cys residues are commonly
found in many types of both extracellular matrix and cell surface receptor proteins
(Gotliv et al. 2005; Bhattacharya et al. 2002; Pearsall et al. 2002). It is thought that
tandem repeat structures allow the repeats to interact with each other or with other
OM macromolecules (Gotliv et al. 2005; Sarashina & Endo, 2001).
Acidic calcium-binding proteins rich in Asp residues have been identified in both
molluscs (Gotliv et al. 2005) and corals (Puverel et al. 2005), and have been
implicated in calcification in both groups. Their calcium-binding activity, which is to
date the only type observed in invertebrate matrix proteins, is related to the negatively
charged carboxyl groups on Asp or Glu residues (Puverel et al. 2005; Rahman et al.
2006a). Furthermore, acidic proteins have been reported to control mineralization by
interacting with calcium salts (Fu et al. 2005), and Poly-L aspartate molecules are
16
known to promote the precipitation of calcite rather that aragonite in alcyonarians
(Rahman et al. 2006b). In the calcification literature, acidic matrix proteins are often
associated with calcite deposition, although in some mollusc acidic proteins are able
to nucleate aragonite (Nudelman et al. 2006).
Post-translational modifications of structural matrix proteins could arguably be a key
factor determining coral colony morphology. Biosynthesis of N-linked glycoproteins
appears to be a prerequisite for skeleton formation as reduced calcification rates were
observed after inhibition of N-glycosylation (Allemand et al., 1998). Proteins that are
highly phosphorylated are thought to be involved in the inhibition of CaCO3
nucleation due to their ability to interact with either calcium ions or CaCO3 crystals
as, for example, in the case of the crayfish protein, CAP-1 (Inoue et al. 2001). This is
consistent with the idea that inorganic molecules, particularly phosphate and its
derivates, are strong inhibitors of calcification (Simkiss, 1964).
Acidic polysaccharides have also been reported as major components of the OM in
several marine invertebrates. Sulphated and acidic polysaccharides have been
reported from the matrices of both scleractinians (Watanabe et al. 2003; Puverel et al.
2005) and alcyonarians (Cuif and Dauphin, 2005). Due to their dense negative
charges, roles have been suggested for these molecules in both calcium transport
during calcification and in positioning the matrix for the attachment of calcium
binding proteins (Goldberg, 2001). In a similar way, it has also been suggested that
fibrillar structures in the OM associated with sulphur may come from calcium binding
polysaccharides and glycoproteins (Clode and Marshall, 2003). A core of carboxylate
groups from Asp rich proteins surrounded by a ring of sulphate groups has been
reported in the nacre nucleation sites of the cephalopod Nautilus (Adaddi et al. 2006;
Nudelman et al. 2006). The putative function of the sulphate groups is to attract
calcium ions to the calcification zones (Adaddi et al. 2006; Nudelman et al. 2006).
Different types of N-glycoproteins, as well as O-glycoproteins, have been in the
control of calcification in the sea urchin OM (Ameye et al. 2001). N-glycoproteins are
thought to be localized in amorphous subregions of the skeleton, whereas some O-
glycoproteins are localized in subregions were skeletal growth is inhibited. O-
glycoproteins contain sialic acid, which is known to interact with calcium. These

17
observations suggest that nucleation of CaCO3 crystals during coral calcification is
may also be regulated via glycosylation and phosphorylation of structural matrix
proteins, which is consistent with Adaddi’s (2006) idea that for controlled nucleation
to occur, the OM must contain nucleation sites that will induce crystal formation more
effectively than other charged locations. Despite this, the role of specific anion-cation
interactions in calcification is not well understood.
1. 5. Calcium and carbonate: Sources and transport mechanisms.
Scleractinian polyps must exert control over the sources of ions in order to store and
direct ions to the mineralization site to allow for CaCO3 precipitation and
crystallization. To achieve this, calcium and carbonate ions must be concentrated and
isolated from the cellular environment. Two hypotheses have been postulated
regarding calcium transport mechanisms to the calcification site: 1) calcium transport
occurs via an active transcellular route across the oral epithelium to the calcification
site (Tambutté et al., 1996; Clode and Marshall, 2002b) and/or 2) calcium reaches the
mineralization site via a paracellular route by passive diffusion of calcium ions
(Tambutté et al., 1995).
According to Clode and Marshall, (2002b), oral ectodermal mucus secretions may
facilitate intracellular calcium uptake by oral cell population. This might be achieved
by allowing higher calcium ion concentrations within the mucus matrix than in the
surrounding seawater. The observation that, in A. millepora embryos, the oral pore
differs from the surrounding ectodermal tissue and is composed almost exclusively of
secretary cells (Ball et al. 2002) is consistent with this idea. However, concentration
of calcium ions by oral mucus secretions is as yet unproven, and the fact that the
concentration of calcium in seawater is already 105 fold higher that that of cytoplasm
suggests that mucus is unlikely to play an important role in calcium concentration
(Allemand, per. comm.).
Tambutté et al., (1996) have demonstrated that calcium uptake by coral tissue is a
prerequisite for skeletogenesis, and suggest a transcellular route involving a L-type
voltage-dependent Ca2+ channel (Zoccola et al. 1999) and a plasma-membrane
calcium pump (PMCA) (Zoccola et al. 2004). Under this model, transport of calcium

18
across calicoblastic cells is mediated by calcium-binding proteins and is dependent on
the cytoskeleton. Intracellular vesicles identified in the calicoblastic ectoderm of a
variety of scleractinian corals may be involved in packaging of calcium and organic
matrix precursors prior secretion to the calcification site (Clode and Marshall, 2002).
1. 6. Carbonate ions: The divalent anion.
Whilst the only available source of the calcium ions required for skeleton deposition
is the external medium, inorganic carbonate could theoretically be acquired either
from the surrounding seawater (as bicarbonate or carbonate) or from coral respiration
(in the form of CO2 ) (Allemand et al. 2004). Erez (1978) and Furla et al. (2000) have
shown that metabolic CO2 is the major source of carbon for calcification. The finding
of high numbers of mitochondria in calicoblastic cells (Clode and Marshall, 2002;
Allemand et al. 2004) is consistent with this idea. CO2 can diffuse across cell
membranes passively, whereas HCO-3 and CO3
2- require specific protein carriers to do
so (Allemand et al. 2004).
The enzyme carbonic anhydrase (CA) catalyses the reversible interconversion of CO2
and HCO-3, the latter being one of the substrates necessary for CaCO3 deposition
(Tambutté et al. 1996; Allemand et al. 2004). CA has been demonstrated in the
skeletogenic cell layer of the azooxanthellate coral Tubastrea aurea (Tambutté et al.
2007) and in the calicoblastic ectoderm of the zooxanthellate coral Stylophora
pistillata (Moya et al, 2008). Furthermore, CA activity has been reported in the
calicoblastic ectoderm of Acropora hebes (Isa and Yamazato, 1984) and a role for CA
in skeletogenesis has been demonstrated in the coralline demosponge Astrosclera
willeyana (Jackson et al. 2007).
Moya et al., (2008) have proposed that CO2 diffusing out of the calicoblastic cells as a
consequence of the high pH of this calcifying region (Al-Horani et al., 2003) may be
converted into HCO3 by the secreted CA. The protons produced at the site of
calcification could be removed by the Ca-ATPase present within the calicoblastic
epithelium (Zoccola et al, 2004). In addition to the passive movement of CO2 it has
also been proposed that HCO3- is transported by the calicoblastic cells to the
calcifying site (Furla et al., 2000). Given that mammalian HCO3–/Cl– exchangers are

19
known whose role is to compensate for increases in intracellular pH by exporting
HCO-3 ions (Phillips et al. 2002), intracellular pH regulation mechanisms might also
have roles in HCO-3 transport to the calcification site. However, very little is known
about cellular pH regulation in cnidarians and more research is nessesary to
understand whether metabolic CO2 rather that HCO3- is the main carbon source
during calcification.
1. 7. Calcium signaling: Calcium mediated calcium carbonate deposition.
Calcium is the most versatile and widely used secondary messenger in eukaryotes;
some of its signaling mechanisms are conserved across phylogenetically distant
groups (Haeseleer et al. 2002, Hofer and Brown, 2003). Due to its particular
flexibility as a ligand, changes in intracellular calcium concentration regulate a
variety of cellular processes ranging from fertilization to apoptosis (Carafoli, 2005;
Parekh, 2006), and these processes generally involve calcium sensor proteins, the best
known of which is calmodulin. Since calcification is a process involving ion channel
regulation, vesicle trafficking and the synthesis of OM precursors, it is likely that
calcium sensor proteins and their signaling pathways play important roles in coral
skeletogenesis.
Calcium dynamics, homeostasis and signaling are regulated by calcium itself via
calcium binding proteins known as calcium sensors. These proteins are able to bind
calcium depending on the intracellular calcium concentration. As a result of this
interaction, these molecules experience topological changes that allow them to
interact with target proteins located downstream in the signaling cascade (Burgoyne
and Weiss. 2001). Eukaryotic cells require calcium in the cytosol as a second
messenger to regulate a large number of processes. To enable these processes, cells
must maintain a low intracellular concentration (~ 0.1 µM) so that elevations in
concentration (10-20 fold) can be used to regulate cellular functions (Lee and Klevit,
2000), thus avoiding abnormal increases in cytosolic calcium concentration, which
may lead to cell death (Carafoli, 2003). These observations reveal a key role of
calcium as a potent activator of gene transcription (Berridge et al. 2003) and suggest
an important role for this secondary messenger during coral calcification.

20
It appears that calcium ion uptake/exit by the calicoblastic ectoderm in Stylophora
pistillata is facilitated by Ca2+ channels (Zoccola et al., 1999) and Ca2+ ATPases
(Zoccola et al., 2004) respectively. According to (Zoccola et al., 1999), scleractinian
corals have two distinct cell types with respect to sensitivity to Ca2+ channel
inhibitors. The first type includes calcium-transporting cells that belong to the
calicoblastic epithelium and contain L-type voltage dependent Ca2+ channels. The
second type includes all other cells that do not transport calcium actively and lack L-
type voltage dependent Ca2+ channels (Zoccola et al. 1999). Despite this, it remains
unclear whether calcium reach the calcification site as ions or insolubilized by
attaching to OM precursors such as lipids or proteins. However, the fact that L-type
voltage dependent Ca2+ channels are present in calicoblastic cells suggests that this
cell population is actively involved in sequestering calcium during skeletogenesis.
The calcium channels identified in cnidarians (jellyfish and coral; Zoccola et al. 1999;
Jeziorsky et al. 1998) are members of the metazoan L-type family of channels. The
α1 subunit is an integral membrane protein, which directs the permeation of calcium
in a voltage-dependent manner (Walker and Waard, 1998 and Jeziorsky et al. 2000).
This protein has been isolated along with a calcium ATPase from the coral S.
pistillata that localizes to the calicoblast ectoderm (Zoccola et al. 2004).
Studies of calcium signaling in cnidarians have focused specifically on calcium
channels (Zoccola et al., 1999; Jeziorsky et al. 1998) and ATPases (Zoccola et al.,
2004), one of the few exceptions to this being the identification of a novel calcium
sensor in the sea anemone Anthopleura elegantissima (Hauck et al., 2007). Very little
is known about calcium transduction mechanisms in cnidarians or their calcium
sensor complements (Haeseleer et al., 2002). Given their likely significance in
regulation of processes such as metamorphosis and calcification, a survey of calcium
sensor proteins is likely to yield insights into many aspects of coral biology.
1. 8. Calcification and photosynthesis: Light-enhanced calcification.
High rates of calcium carbonate deposition in the oceans are generally associated with
high rates of photosynthesis (Gattuso et al., 1995). This link is established via

21
symbiotic relationships between photosynthetic algae and organisms such as
foraminiferans (reviewed in Lee et al., 1979), giant clams (Fitt et al., 1986) and
scleractinian corals (Goreau, 1959). Scleractinian calcification accounts for most of
the CaCO3 precipitation on tropical reefs. This rapid growth and calcification rate in
a nutrient-deficient environment can be explained by the photosynthetic activity of
dinoflagellates from the genus Symbiodinium (Stanley, 2006).
It has been known for some time that photosynthesis enhances the ability of a coral to
calcify (Goreau, 1959; Chalker and Taylor 1975). Le Tissier (1988) reported that
whereas adult skeleton formation normally follows a diurnal cycle, under constant
light conditions, light-enhanced calcification appears to be dependent largely on the
light regime (Le Tissier 1988, Moya et al., 2006).
In Stylophora pistillata the production of metabolic CO2 is at least six times higher
during the day than is required for calcification (Furla et al., 2000). The use of
metabolic CO2 requires carbonic anhydrase (CA) activity. Moya et al., (2008) have
shown that the expression of CA is twice higher in the dark than in the light and
suggest that a secreated CA may then help to sustain the CO2 hydration rate in the
dark where the sub-calicoblastic medium is more acidic than in the light. However
since CA expression is enhanced in the dark and not in the light, it is likely not to be
directly involved in light-enhanced calcification (LEC).
One role for zooxanthellae in the LEC process may be secretion of OH- during
photosynthesis, which could buffer the protons produced during calcification
(Allemand et al., 1998). Indeed the kinetics of OH- production during light/dark and
dark/light transitions (Furla et al., 2000) are consistent with the lag-phase necessary to
switch between light/dark and dark/light values of calcification (Moya et al., 2006).
The kinetics for OM synthesis between dark and light conditions (Allemand et al.,
1998) are also consistent with the lag-phase necessary to switch between dark and
light calcification values (Moya et al., 2006).
The interaction between photosynthesis and calcification is not simple; not only is
there photosynthesis-enhanced CaCO3 deposition, but also there are suggestions that
calcification might enhance photosynthesis (Mcconnaughey, 1994). Hence the
22
cellular mechanisms regulating coral calcification must be correspondingly complex.
Respiration, calcification and photosynthesis are processes that must be tightly linked
in symbiotic scleractinian corals, and disentangling the interactions between these
cellular processes is key to understanding skeletogenesis in reef building corals.
This thesis focuses on late developmental stages in the reef-building staghorn coral
Acropora millepora, which span metamorphosis, settlement and the initiation of
skeletogenesis. Early calcification in A. millepora represents an ideal system to study
the cellular mechanisms underlying skeleton deposition in scleractinian corals as it is
not enhanced or modified by Symbiodinium sp photosynthesis (due to the
aposymbiotic nature of A. millepora larvae) while providing direct access to the
calicoblastic ectoderm without the complications associated to a massive adult
skeleton.
Using an ongoing EST project on different developmental stages of A. millepora, we
focused on identifying and characterising both calcifying matrix components from the
Galaxin family as well as calcium sensors proteins potentially able to regulate and
translate the calcium signal during settlement and metamorphosis. Three Galaxin
related genes were identified, whose expression patterns overlap during development
and are consistent with roles in early and adult calcification (Chapter 3). In a similar
way, a novel and coral-specific calcium sensor protein was identified that interacts
with calmodulin in vitro and is expressed during settlement and early stages of
skeleton deposition (Chapter 4).
In parallel, primary cell cultures were established from five key developmental stages;
the technique reported here will allow the isolation of embryonic coral cell
populations and should thus facilitate the dissection of cell differentiation pathways
and cell lineages in corals (Chapter 2). Finally, microarray analysis was used to
investigate changes in gene expression during the early post-settlement phase during
which calcification is initiated (Chapter 5).
Although the results reported here are preliminary and reveal a high level of
complexity, hopefully they will facilitate the elucidation of the gene networks
involved in processes such as lineage specific cell differentiation, the initiation of

23
skeleton deposition and the establishment of symbiosis. In particular, the expression
data reported for 1189 differentially expressed genes through the early post-settlement
time window should provide a valuable resource for understanding the calicoblast
differentiation and early skeletogenesis in the scleractinian coral A. millepora.
1. 9. References.
Addadi L, Joester, D., Nudelman, F. and Weiner, S. (2006) Mollusk Shell Formation: A Source of new concepts for understanding biomineralization processes. Journal of European chemistry 12: 980-987 Al-Horani F, Al-Mograbi, S. M., and De Beer, D (2003) Microsensor study of photosynthesis and calcification in the scleractinian coral Galaxea fascicularis: active internal carbon cycling. J. Exp. Mar. Biol. Ecol. 288 Allemand D, Tambutt EE, Girard JP, Jaubert J (1998) Organic matrix synthesis in the scleractinian coral stylophora pistillata: role in biomineralization and potential target of the organotin tributyltin. J Exp Biol 201 (Pt 13): 2001-2009 Allemand D, Ferrier-Pages, Christine., Furla, Paola., Houlbreque Fanny., Paverel, Sandrine., Reynaud Sttephanie., Tambutte, Eric., Tambutte, Sylvie and Zoccola Didier. (2004) Biomineralization in reef-building corals: from molecular mechanisms to environmental control. General Palaentology 3: 453- 467 Ameye L, De Becker G, Killian C, Wilt F, Kemps R, Kuypers S, Dubois P (2001) Proteins and saccharides of the sea urchin organic matrix of mineralization: characterization and localization in the spine skeleton. J Struct Biol 134: 56-66 Ball EE, Hayward DC, Reece-Hoyes JS, Hislop NR, Samuel G, Saint R, Harrison PL, Miller DJ (2002) Coral development: from classical embryology to molecular control. Int J Dev Biol 46: 671-678 Berridge MJ, Bootman MD, Roderick HL (2003) Calcium signalling: dynamics, homeostasis and remodelling. Nat Rev Mol Cell Biol 4: 517-529 Bhattacharya G, Miller C, Kimberling WJ, Jablonski MM, Cosgrove D (2002) Localization and expression of usherin: a novel basement membrane protein defective in people with Usher's syndrome type IIa. Hear Res 163: 1-11 Burgoyne RD, Weiss JL (2001) The neuronal calcium sensor family of Ca2+-binding proteins. Biochem J 353: 1-12 Carafoli, E. (2003). Historical review: mitochondria and calcium: ups and downs of an unusual relationship. Trends Biochem Sci 28, 175-81. Carafoli E (2005) Calcium--a universal carrier of biological signals. Delivered on 3 July 2003 at the Special FEBS Meeting in Brussels. Febs J 272: 1073-1089 Chalker BE, and D.L. Taylor. (1975) Light-enhanced calcification, and the role of oxidative phosphorylation in calcification of the coral Acropora cervicornis. Proceedings of the Royal Society of London 190 Chave KE, Smith S. V. and Roy, K. J (1975) Carbonate production by coral reefs. Mar. Geol 12: 123-140 Clode PL, Marshall AT (2002a) Low temperature FESEM of the calcifying interface of a scleractinian coral. Tissue Cell 34: 187-198 Clode PL, Marshall AT (2002b) Low temperature X-ray microanalysis of calcium in a scleractinian coral: evidence of active transport mechanisms. J Exp Biol 205: 3543-3552
24
Clode PL, Marshall AT (2003) Calcium associated with a fibrillar organic matrix in the scleractinian coral Galaxea fascicularis. Protoplasma 220: 153-161 Clode PL, Marshall AT (2004) Calcium localisation by X-ray microanalysis and fluorescence microscopy in larvae of zooxanthellate and azooxanthellate corals. Tissue Cell 36: 379-390 Crossland C, Hatcher, G. and Smith, V. (1991) Role of coral reefs in global ocean production. Coral Reefs 10: 55-64 Cuif JP, Dauphin Y (2005) The two-step mode of growth in the scleractinian coral skeletons from the micrometre to the overall scale. J Struct Biol 150: 319-331 Erez J (1978) Vital effect on the stable-isotope composition seen in foraminifera and coral skeletons. Nature 273: 199-202 Ettensohn CA (2009) Lessons from a gene regulatory network: echinoderm
skeletogenesis provides insights into evolution, plasticity and morphogenesis. Development 136:11-21
Fitt WK, Fisher, C.R., and Trench, R.K. (1986) Contribution of the symbiotic dinoflagellate Symbiodinium microadriaticum to the nutrition, growth and survival of larval and juvenile tridacnid clams. Aquaculture 55: 5-22 Fu G, Valiyaveettil S, Wopenka B, Morse DE (2005) CaCO3 biomineralization: acidic 8-kDa proteins isolated from aragonitic abalone shell nacre can specifically modify calcite crystal morphology. Biomacromolecules 6: 1289- 1298 Fukuda I, Ooki S, Fujita T, Murayama E, Nagasawa H, Isa Y, Watanabe T (2003) Molecular cloning of a cDNA encoding a soluble protein in the coral exoskeleton. Biochem Biophys Res Commun 304: 11-17 Furla P, Galgani I, Durand I, Allemand D (2000) Sources and mechanisms of inorganic carbon transport for coral calcification and photosynthesis. J Exp Biol 203: 3445-3457 Gattuso J-P, M. Pichon, and M. Frankignoulle. (1995) Biological control of the air- sea CO2 fluxes: effect of photosynthetic and calcifying marine organisms and ecosystems. Marine Ecology Progress Series. 129: 307-312 Goreau TF (1959) The physiology of skeleton formation in corals. I. A method for measuring the rate of calcium deposition by corals under different conditions. Biol. Bull. 116: 59-75 Gotliv BA, Kessler N, Sumerel JL, Morse DE, Tuross N, Addadi L, Weiner S (2005) Asprich: A novel aspartic acid-rich protein family from the prismatic shell matrix of the bivalve Atrina rigida. Chembiochem 6: 304-314 Grigg RW (1988) Paleoceanography of Coral Reefs in the Hawaiian-Emperor Chain. Science 240: 1737 Gunderson L (2007) Ecology: a different route to recovery for coral reefs. Curr Biol 17: R27-28 Haeseleer F, Jang GF, Imanishi Y, Driessen CA, Matsumura M, Nelson PS, Palczewski K (2002) Dual-substrate specificity short chain retinol dehydrogenases from the vertebrate retina. J Biol Chem 277: 45537-45546 Hatcher BG (1997) Coral Reefs ecosystems: how much greater is the whole than the sum of the parts? Coral Reefs 16: S77-S91 Hauck LL, Phillips, W. S. and Weis V. M. (2007) Characterization of a novel Ef-hand homologe, CnidEf, in the sea anemone Anthopleura elegantisima. Comp Biochemestry and Physiology Part B: 551-559
25
Hayward DC, Samuel G, Pontynen PC, Catmull J, Saint R, Miller DJ, Ball EE (2002) Localized expression of a dpp/BMP2/4 ortholog in a coral embryo. Proc Natl Acad Sci U S A 99:8106-8111
Hoegh-Guldberg O, Mumby PJ, Hooten AJ, Steneck RS, Greenfield P, Gomez E, Harvell CD, Sale PF, Edwards AJ, Caldeira K, Knowlton N, Eakin CM, Iglesias-Prieto R, Muthiga N, Bradbury RH, Dubi A, Hatziolos ME (2007) Coral reefs under rapid climate change and ocean acidification. Science 318:1737-1742
Hofer AMaB, E. M. (2003) Extracellular calcium sencing and signalling. Nature Reviews 4 Inoue H, Ozaki N, Nagasawa H (2001) Purification and structural determination of a phosphorylated peptide with anti-calcification and chitin-binding activities in the exoskeleton of the crayfish, Procambarus clarkii. Biosci Biotechnol Biochem 65: 1840-1848 Isa YaY, K. (1984) The distribution of carbonic anhydrase in a staghorn coral Acropora hebes (Dana). Galaxea 3: 25-36 Jackson DJ, McDougall C, Green K, Simpson F, Worheide G, Degnan BM (2006) A
rapidly evolving secretome builds and patterns a sea shell. BMC Biol 4:40 Jackson DJ, Macis L, Reitner J, Degnan BM, Worheide G (2007) Sponge paleogenomics reveals an ancient role for carbonic anhydrase in skeletogenesis. Science 316: 1893-1895 Jeziorsky MC, Greenberg, R. M., Clark, K. S. and Anderson, P. A. V. (1998) Cloning and Functional Expression of a Voltage-gated Calcium Channel _1 Subunit from Jellyfish. The Journal of Biological Chemistry 273: 22792-22799 Kawasaki K, Weiss KM (2006) Evolutionary genetics of vertebrate tissue
mineralization: the origin and evolution of the secretory calcium- binding phosphoprotein family. J Exp Zoolog B Mol Dev Evol 306:295-316
Kleypas JA, Buddemeier RW, Archer D, Gattuso JP, Langdon C, Opdyke BN (1999) Geochemical consequences of increased atmospheric carbon dioxide on coral reefs. Science 284: 118-120 Le Tissier M (1988) Patterns of formation and the ultrastructure of the larval skeleton of Pocillopora damicornis. Marine Biology 98: 493-501 Lee, J., Kahn, E. G., and Schuster, F. L. (1979) Symbiosis and the Evolution of Larger Foraminifera. Micropaleontology 25: 118-140 Lee SYaK, R. E. (2000) The Whole Is Not the Simple Sum of Its Parts in Calmodulin from S. cerevisiae. Biochemestry 39: 4225-4230 Livingston BT, Killian CE, Wilt F, Cameron A, Landrum MJ, Ermolaeva O,
Sapojnikov V, Maglott DR, Buchanan AM, Ettensohn CA (2006) A genome-wide analysis of biomineralization-related proteins in the sea urchin Strongylocentrotus purpuratus. Dev Biol 300:335-348
Lowenstam HA, Margulis L (1980) Evolutionary prerequisites for early Phanerozoic calcareous skeletons. Biosystems 12:27-41
Lowenstein TK, Hardie, L. A., Timofeeff, M. N., and Demicco, R. V. (2003) Secular variation in sea water chemistry and the origin of calcium chloride basinal brines. Geology 31: 857-860 Marin F, Luquet G, Marie B, Medakovic D (2008) Molluscan shell proteins: primary
structure, origin, and evolution. Curr Top Dev Biol 80:209-276 Marin F, Corstjens P, de Gaulejac B, de Vrind-De Jong E, Westbroek P (2000) Mucins and molluscan calcification. Molecular characterization of mucoperlin, a novel mucin-like protein from the nacreous shell layer of the fan
26
mussel Pinna nobilis (Bivalvia, pteriomorphia). J Biol Chem 275: 20667- 20675 Marin F, Smith M, Isa Y, Muyzer G, Westbroek P (1996) Skeletal matrices, muci, and the origin of invertebrate calcification. Proc Natl Acad Sci U S A 93: 1554-1559 Matsushiro A, Miyashita T (2004) Evolution of hard-tissue mineralization:
comparison of the inner skeletal system and the outer shell system. J Bone Miner Metab 22:163-169
McConnaughey TA (1994) Calcification, photosynthesis, and global carbon cycles. In Past and Present Biomineralization Processes. Considerations about the Carbonate Cycle.: 137-162 McConnaughey TA and W, J.F., (1997) Calcification generates protons for nutrient and bicarbonate uptake. Earth Sciences Reviews 42: 95-117 Moya A, Tambutte S, Bertucci A, Tambutte E, Lotto S, Vullo D, Supuran CT,
Allemand D, Zoccola D (2008) Carbonic anhydrase in the scleractinian coral Stylophora pistillata: characterization, localization, and role in biomineralization. J Biol Chem 283:25475-25484
Moya A, Tambutte S, Tambutte E, Zoccola D, Caminiti N, Allemand D (2006) Study of calcification during a daily cycle of the coral Stylophora pistillata: implications for 'light-enhanced calcification'. J Exp Biol 209: 3413-3419 Nudelman F, Gotliv BA, Addadi L, Weiner S (2006) Mollusk shell formation: mapping the distribution of organic matrix components underlying a single aragonitic tablet in nacre. J Struct Biol 153: 176-187 Parekh AB (2006) Cell biology: cracking the calcium entry code. Nature 441: 163- 165 Pearsall N, Bhattacharya G, Wisecarver J, Adams J, Cosgrove D, Kimberling W (2002) Usherin expression is highly conserved in mouse and human tissues. Hear Res 174: 55-63 Phillips KP, Petrunewich, M. F., Petrunewich, J. L and Baltz, J. M. (2002) The intracellular pH-regulatory HCO3 /Cl- exchanger in the mouse oocyte is inactivated during first meiotic metaphase and reactivated after egg activation via the MAP kinase pathway. MBC 10.1091/mbc.E02-04-0242 Puverel S, Eric, Tambutte., Zoccola, Didier., Domart-Coulon, Isabelle., Bouchot, Andre., Lotto, Severine., Allemand, Denis and Tambutte Sylvie. (2005a) Antibodies against the organic matrix in scleractinians: a new tool to study coral biomineralization. Coral Reefs 24: 149-156 Puverel S, Tambutte E, Pereira-Mouries L, Zoccola D, Allemand D, Tambutte S (2005b) Soluble organic matrix of two Scleractinian corals: partial and comparative analysis. Comp Biochem Physiol B Biochem Mol Biol 141: 480- 487 Rahman MA, Isa Y, Uehara T (2006a) Studies on two closely related species of octocorallians: biochemical and molecular characteristics of the organic matrices of endoskeletal sclerites. Mar Biotechnol (NY) 8: 415-424 Rahman MA, Isa Y, Takemura A, Uehara T (2006b) Analysis of proteinaceous components of the organic matrix of endoskeletal sclerites from the alcyonarian Lobophytum crassum. Calcif Tissue Int 78: 178-185 Ries JB, Stanley, S. M., and Hardie, L. A. (2006) Scleractinian corals produce calcite, and grow more slowly in artificial Cretaceous seawater. Geologycal Society of America. 30: 525-528

27
Sarashina I, Endo K (2001) The complete primary structure of molluscan shell protein 1 (MSP-1), an acidic glycoprotein in the shell matrix of the scallop Patinopecten yessoensis. Mar Biotechnol (NY) 3: 362-369 Simkiss K (1964) Phosphates as Crystal Poisons of Calcification. Biol Rev Camb
Philos Soc 39:487-505 Stanley GD, Jr. (2006) Ecology. Photosymbiosis and the evolution of modern coral reefs. Science 312: 857-858 Tambutté É, Allemand, D., Bourge, I., Gattuso, J.-P., Jaubert, J. (1995) An improved 45Ca protocol for investigating physiological mechanisms in coral calcification. Mar. Biol. 12: 453-459 Tambutte, Eacute, Eacute, Allemand D, Mueller E, Jaubert J (1996) A compartmental approach to the mechanism of calcification in hermatypic corals. J Exp Biol 199: 1029-1041 Tambutté S, Tambutté, E., Zoccola D., Caminiti, N., Lotto, S., Moya, A., Allemand, D., and Adkins, J. (2007) Characterization and role of carbonic anhydrase in the calcification process of the azooxanthellate coral Tubastrea aurea. Marine Biology 151: 71-83 Taylor P, Kudryavtsev, D., Anatoliy, B., and S. J. William (2008) Calcite and aragonite distributions in the skeletons of bimineralic bryozoans as revealed by Raman spectroscopy. Invertebrate Biology 127: 87-97 Trench RK (1979) The Cell Biology of Plant-Animal Symbiosis. Annual Review of Plant Physiology 30: 485-531 Vandermeulen JH (1975) Studies on Coral Reefs.III. Fine Structural Changes of Calicoblast Cells in Pocillopora damicornis during Settling and Calcification. Marine Biology 31: 69-77 Vandermeulen JH, Watabe N (1973) Studies on Reef Corals. I. Skeleton Formation by Newly Settled Planula Larva of Pocillopora damicornis. Marine Biology 23: 47-57 Veron J (2000) Corals of the world. Australian Institute of Marine Sciences, Townsville Walker DaW, M. D. (1998) Subunit interaction sites in voltage-dependent Ca2+ channels: role in channel function. Trends Neurosci. 21: 148-154 Wang X, Liang L, Song T, Wu L (2008) Sinusoidal magnetic field stimulates
magnetosome formation and affects mamA, mms13, mms6, and magA expression in Magnetospirillum magneticum AMB-1. Can J Microbiol 54:1016-1022
Watanabe T, Fukuda I, China K, Isa Y (2003) Molecular analyses of protein components of the organic matrix in the exoskeleton of two scleractinian coral species. Comp Biochem Physiol B Biochem Mol Biol 136: 767-774 Wilt FH (2005) Developmental biology meets materials science: Morphogenesis of
biomineralized structures. Dev Biol 280:15-25 Wozney JM, Rosen V, Celeste AJ, Mitsock LM, Whitters MJ, Kriz RW, Hewick RM,
Wang EA (1988) Novel regulators of bone formation: molecular clones and activities. Science 242:1528-1534
Zoccola D, Tambutte E, Kulhanek E, Puverel S, Scimeca JC, Allemand D, Tambutte S (2004) Molecular cloning and localization of a PMCA P-type calcium ATPase from the coral Stylophora pistillata. Biochim Biophys Acta 1663: 117-126

28
Zoccola D, Tambutte E, Senegas-Balas F, Michiels JF, Failla JP, Jaubert J, Allemand D (1999) Cloning of a calcium channel alpha1 subunit from the reef-building coral, Stylophora pistillata. Gene 227: 157-167 Zoccola D, Moya A, Beranger GE, Tambutte E, Allemand D, Carle GF, Tambutte S
(2009) Specific expression of BMP2/4 ortholog in biomineralizing tissues of corals and action on mouse BMP receptor. Mar Biotechnol (NY) 11:260-269

29
CHAPTER 2. In vitro culture of cells derived from larvae of the staghorn coral
Acropora millepora.
2.1. ABSTRACT.
Previous attempts to culture cells from corals or other cnidarians have been
unsuccessful. These efforts have, however, generally made use of adult tissue as
starting material. Early developmental stages are potentially more appropriate for the
initiation of cell cultures, as the expectation is that a greater proportion of the cell
population is undifferentiated and may have the intrinsic ability of unlimited cell
renewal. To explore this idea, cell cultures were initiated from five key stages of
coral development, and the presence of coral cells monitored by polymerase chain
reaction (PCR) using coral-specific primers. After four weeks, semi-quantitative PCR
implied that coral cells were better represented in cultures initiated from planulae than
in those derived from earlier developmental stages. Coral cells were detected in
cultures initiated from planulae for up to ten weeks, but after this time extensive
contamination by the protist Thraustochytrium sp was observed.
2. 2. INTRODUCTION.
Despite the ecological importance of corals and widespread concern regarding the
threats posed to coral reefs by global climate change, little is known about the
molecular bases of many aspects of their biology such as metamorphosis, symbiosis
and calcification. The size and complexity of coral colonies complicate empirical
analyses, and cell lines derived from corals would greatly facilitate molecular
analyses of many aspects of their biology. A few studies have focused on the use of
primary cultures of differentiated cells derived from adult colonies to perform short-
term assays (Domart-Coulon et al. 2001, 2004; Helman et al, 2008). Previous
attempts to establish stable coral cell lines have been hampered by contamination or
short-term survival of isolated cells and low cell division rates (Frank et al. 1994;
Kopecky and Ostrander 1999).
In these previous studies, coral cells were identified and characterised on the basis of
morphology, but the appearance of cells in vitro does not necessarily correspond to

30
that in vivo (Frank et al. 1994). Molecular markers can potentially assess the nature of
cultured cells as well as discriminate between different cell types and some
preliminary attempts have been made to apply these approaches. Puverel et al. (2005)
developed antibodies against the organic matrix of Stylophora pistillata and used
these to identify putative calicoblast cells in culture and Helman et al. (2008) used
universal 18S rDNA primers to assess the nature of cultured cells employed for the
study of the production of coral extracellular matrices in vitro.
In this study, coral specific markers were employed to monitor the presence of coral
cells in primary cultures derived from a variety of embryonic and larval
developmental stages. The results imply that an embryonic cell type present in
planulae may be the most appropriate starting material for cell cultures. The methods
described should greatly facilitate the dissection of cell differentiation pathways in
corals.
2. 3. MATERIAL AND METHODS.
2. 3. 1. Collection of embryos.
Acropora millepora mature colonies were collected during the 2005-spawning event
at Magnetic Island (Lat: 19° 7' 60 S, Long: 146° 49' 60 E, Queensland, Australia).
Following spawning, gametes from several colonies were mixed to facilitate
fertilisation, and the resulting embryos maintained in containers containing fresh
seawater for 2h. At 15 hours post-fertilization, embryos selected for cell culture were
transferred to 190mm petri dishes containing 0.2µm filtered seawater (FSW) at
densities no higher than 600 embryos per dish. They were washed 5 times with 0.2µm
FSW. Water was changed 2 times per day. Developing embryos selected for cell
cultures were maintained at 23°C and on a 12-hour light/12-hour dark cycle.
2. 3. 2. Cell culture.
Prior to initiation of cell cultures, individual coral embryos/larvae (50 per each stage)
were treated for 15 minutes in 5 ml aliquots of sterile seawater containing ampicillin
(270µg/ml), streptomycin (135µg/ml), and chloramphenicol (27 µg/ml). This process

31
was repeated three times. Single embryos/larvae were transferred to 5 ml of cell
culture medium (10% DMEM GIBCO, 5%FBS GIBCO, 3% Antibiotics/antimycotics
SIGMA, 2% marine enrichment F/2 SIGMA and 80% 0.2µm FSW) in individual
wells on a 6 well culture plate, and incubated at 23°C in the dark. Coral
embryos/larvae dissociated spontaneously after the addition of
antibiotics/antimycotics (Fig 1A). After a week of incubation, embryos / larvae were
totally dissociated irrespective of developmental stage of the starting material, and
individual cells were observed in each well. The nature of the cells in culture was
monitored every two weeks, and subculturing carried out when cells approached
confluence.
Subculturing was achieved by harvesting the cells from 5ml cultures by centrifugation
at 1200 rpm followed by resuspension of the resulting cell pellets in 2 ml aliquots of
fresh medium. Pellets were washed 3X with 2 ml aliquots of fresh media. 0.5 ml
volumes of the ultimate suspension were used to inoculate 4.5 ml aliquots of fresh
media in a new cell culture plate. In each case the residual volume (1.5 ml) was used
for DNA extraction.
2. 3. 3. Monitoring the nature of cells in culture.
Total DNA was extracted (DNeasy Tissue; QIAGEN) from cultures, and used as
template in PCR using the primers described in Table 1. The universal primer pair
(nuclear ribosomal small subunit – universal18s) was used to detect contaminating
eukaryotic organisms. The remaining primers were coral-specific, and amplify either
a 500bp-600bp fragment from the Pax-C intron (van Oppen et al. 2001) or a 250bp
fragment from an exon of a Red Fluorescent Protein (RFP). PCR products were
subjected to DNA sequencing using the amplification primers to enable identification
of contaminating organisms and/or verify the presence of Acropora cells in culture.
2. 3. 4. Polymerase chain reaction (PCR).
PCR reactions contained in a total volume of 20 µl : 1µl of primers (10mM), 2.5 µl
dNTP’s (2mM each), 2µl MgCl2 (25mM), 2µl 10x Taq Buffer, and 0.1-0.5 Units of

32
Taq polymerase. Cycling-conditions involved denaturing and annealing times of 30
seconds and extension time of 60 seconds, followed by a final extended extension
incubation time of 2 minutes. Generally 30 cycles was sufficient for the amplification
DNA. Annealing temperatures used were 3 to 5°C below the melting temperature of
the primers involved (Table 1). PCR products were run on 1% agarose gels and
amplified bands recovered (Gel extraction Kit QIAGEN) for sequencing. Genomic
DNA extracted from sperm derived from spawning A, millepora colonies was used
for positive controls.
2. 3. 5. DNA sequencing.
Template for DNA sequencing was prepared in a thermocycler using the ET Dye
Terminator Sequencing Kit from Amersham Biosciences. The cycle sequencing
protocol for the DYEnamic™ ET Dye kit used was: 95°C for 20 seconds, 50°C for 15
seconds, 60°C for 3 minutes (35 cycles). Reactions were analysed on a
MegaBACE™ 1000 DNA Analysis System (Amersham Biosciences) via a laser
induced fluorescence capillary system. Sequences were manually checked and
assembled with Sequencher Version 3.1or 4.0.
2. 3. 6. Microscopy.
Differential interference contrast (DIC) microscopy was carried out using an Olympus
BX51 microscope fitted with a CCD camera Olympus DP70.
2. 4. RESULTS AND DISCUSSION.
2. 4. 1. Cell cultures originated from planula tissues gave higher PCR yields than
those started from early stages.
Movement and migration of specific cell populations during gastrulation gives rise to
the two germ layers present in cnidarians (i.e. ectoderm and endoderm) and a variety
of tissue specific cell types (Hyman 1940; Ball et al. 2002). In hydrozoans, an
interstitial population of undifferentiated cells (I-cells) in a constant mitotic cycle is

33
also founded during gastrulation (Hyman 1940; Martin and Archer 1997; Bode 1996).
This cell population migrates and differentiates into tissue specific cell types during
metamorphosis, asexual reproduction and/or regenerative processes (Hyman 1940;
Martin 1990; Bode 1996). The characteritistics of pluripotent cell types such as I-cells
suggest that, under appropriate conditions, they may be capable of founding cell
cultures.
To test the idea that a stem cell-like population is present throughout early coral
development, cell cultures were initiated from five key developmental stages: 1) pre-
gastrulation stage “prawnchip” (PC), 2) gastrulating embryo “donut” (D), 3) late
gastrula “sphere” (S), 4) early planula “pear” (Per) and 5) planula larva (Pla).
After 4 weeks, cell cultures initiated from the late stages of coral development
characteristically gave higher yields in semi-quantitative PCR with all 3 primer pairs
than those started from early stages, with planula giving overall highest yields (Fig
1D-F). In most cases amplified products matched in size and sequence those obtained
from a coral genomic DNA positive control (+), Pax-C intron (∼500 bp product), RFP
(∼250 bp product) and coral 18S rDNA (∼250 bp product). However, four-week
cultures derived from the prawnchip stage material were acidic and yielded an 18S
rDNA amplification product, which differed in size from that expected (Fig 1F) and
was assumed to indicate contamination. At this time, cultures initiated from planula
larvae were selected for longer-term analysis, and those initiated from other stages
discarded.
Coral signal was detected (with each of the 3 primer sets) for approximately ten
weeks in cultures initiated from planula tissue (1D-F). After 12 weeks, however, no
coral specific PCR products could be obtained and only a ~2000bp product was
amplified with the universal 18S rDNA primers (Fig 2 A-B). Comparison of the
sequence of this product with the NCBI nucleotide database identified it as derived
from Thraustochytrium sp. BS2 (86% identity, E-value = 0.0), a parasitic marine
protist (Labyrinthulida: Stramenopiles) that is a recurrent contaminant of coral cell
cultures (Rinkenvich 1999) (Fig 2C).

34
Microscopy conducted on prawnchip (Fig 3A-B) and post-gastrulation stage (Fig 3C-
H) identified a small rounded cell type whose morphology resembles that of
interstitial cells from hydrozoans (Hyman 1940). Cells with this same morphology
were observed in primary cultures for the period during which coral cells were known
to be present based on PCR analysis. These cells are assumed to be of coral origin and
appeared to be actively dividing, forming aggregates that mainly remained in
suspension and did not attach to the culture substrate (1B-C). Although no attempts
were made to count the cell present, the fact that one round of subculturing every two
weeks was necessary to reduce cell numbers implies that these cells were dividing.
Whilst cultures derived from post-gastrulation material were initially heterogenous
(Fig 3C-H), after four weeks in culture the only cell type that could be recognised was
a small rounded cell population that formed cell aggregates. We cannot discern
whether this cell population corresponds directly to those cells with the same
morphology in larval material. There is evidence that some cnidarian cells in culture
are capable of transdifferentiation (Schmid and Reber-Muller 1995), potentially
complicating comparison of in vivo and in vitro morphology. In the case of Hydra,
stem cell markers have been developed (Mochizuki et al. 2000) and a similar
approach could be useful in investigating the nature of the coral cells in culture.
The interstitial cell lineage of hydrozoans is relatively well characterised (Martin and
Archer 1997; Bode 1996). Martin (1990) described a mechanism in the hydrozoan
Pennaria tiarella, by which aboral interstitial endodermal cells initiated neuronal
differentiation in the endoderm to then migrate to the ectoderm where differentiation
is complete at the time of settlement and metamorphosis. This interstitial cell
population increases in number during development, reaching its peak at the planula
stage (Martin and Archer 1997).
Although the literature describing I-cells in anthozoans is limited and has focused
mainly in gametes differentiation (Gaino et al, 2008), several lines of evidence imply
that a corresponding pluripotent cell type is present. For example, without a stem cell-
like precursor it is difficult to account for the adult specific cell types (i.e.
calicoblasts), which appear only after metamorphosis. In addition, all of the cell types
known to be derived from I-cells in hydrozoans (gland cells, neurons, nematocysts

35
and gametes; Bode 1996) are present in anthozoans (Hyman 1940). These results
suggest the presence in coral larva of a cell population whose number increases
during late development and which is capable of founding cell cultures.
The extent to which cellular differentiation mechanisms in corals resemble those
described for hydrozoans and the role of stem cells as precursors of adult specific cell
types remain unclear. In any case the ability to maintain cells derived from coral
planulae in culture for long periods of time should facilitate the study of many diverse
aspects of coral biology.
2. 4. 2. Thraustochytrids are recurrent contaminants of coral cell cultures.
Despite extensive washing of embryonic and larval coral material prior to the
establishment of cell cultures, PCR analysis indicated that cultures initiated from
prawnchip (PC) material had become contaminated. Although DNA sequence data
were not obtained, this product at approximately ∼ 700 bp was substantially different
in size from that of the expected coral product i.e. ∼ 250 bp (Fig 1F). It is likely that,
as in the case of the 12 weeks planula-derived cultures, the contaminant is
Traustochytrium. Thraustochytrid protists appear to be a persistent problem in
establishing cell cultures from corals (Rinkevich, 1999) and other marine
invertebrates (Frank et al., 1994). Thraustochytrids have also been identified in
epithelial mucus secretions from the scleractinian coral Fungia granulosa. It has been
suggested that this group of protists may provide nutritional sources to the coral host
(Harel et al., 2008).
Due to both the diversity of marine protozoans present in seawater, and the flexibility
of coral tissues to establish parasitic and/or symbiotic relationships with other marine
unicellular organisms, the identification of cultured cells originated from coral tissues
needs to be carefully assessed. Cell identity can be tested by PCR with coral specific
markers as showed in this study and cultured cells could be sorted according to size,
mitotic cycle or fluorescent probes using cell sorting (FACS) technology. The three-
month period in which coral cells dominated the cultures provide a period in which
short-term experiments can be performed and coral cell isolation achieved.

36
2. 5. CHAPTER FIGURES AND TABLES.
Figure 2. 1. Cell aggregates and PCR identification of cultured cells. Coral embryos/larvae dissociated spontaneously after the addition of antibiotics. Single cultures were initiated from one embryo/larvae for each developmental stage (A). After a month, cultures formed cell aggregates that remained in suspension (B-C). After 4 weeks, cells cultures initiated from planula larvae (Pla) gave consistently higher PCR yields than did any other stage (D to F). Positive control (+). Negative control (-). Primer dimers (white arrow heads). DNA markers (asterisks). Prawnchip (PC), Donut (D), Sphere (S), Pear (Per), Planula (Pla).

37
Figure 2. 2. Thraustochytrids overgrow coral cells in culture. After 3 months of culture, coral-specific primers gave negative results, and a ~ 2000bp (double arrow) product was amplified with universal 18S rDNA primers (A and B). This band was identified as derived from Thraustochytrium sp (C). Numbers 1 to 6 represent single 3 month-old cultures originated from Planula larva. Positive control (+). Negative control (-). Primer dimers (white arrow heads). DNA markers (asterisks).
Table 2. 1. PCR markers for cell identification.
Marker Direction Sequence Tm oC
Uni18s Fwd:
Rev:
5’CGAATTCAACCTGGTTGATCCTGCCAGT3’
5’CCGGATCCTGATCCTTCTGCAGGTTCACCTAC3’ 61
65
Pax-C
Intron
Fwd:
Rev:
5’TCCAGAGCAGTTAGAGATGCTGG3’
5’GGCGATTTGAGAACCAAACCTGTA3”
60
56
RFP Fwd:
Rev:
5’GGAGAGCAGACAGAGAAGC3’
5’GGAATCATTGGTGACAGTACA3’.
53
50

38
Figure 2. 3. Cell diversity during coral development. Prior to gastrulation, coral embryos consist predominantly of a single morphological cell type (a-b) (black arrows) surrounding lipid-containing vesicles (asterisk). After gastrulation, a range of cell morphologies can be observed; these cell types can be identified at least until the planula stage (c-h). Elongated columnar cells (c), flagellated cells (d), nematocystes (e-f), and small round cells (g) were observed after establishment of the tissue layers (h). Endoderm (En), Ectoderm (Ec). Flagellum (red arrow).

39
2. 6. REFERENCES
Ball EE, Hayward DC, Reece-Hoyes JS, Hislop NR, Samuel G, Saint R,. Harrison PL, and Miller DJ (2002) Coral development: from classical embryology to molecular control. Int J Dev Biol 46:671-8
Bode HR (1996) The interstitial cell lineage of hydra: a stem cell system that arose early in evolution. J Cell Sci 109 :1155-64
Domart-Coulon IJ, Elbert DC, Scully EP, Calimlim PS, and Ostrander GK (2001) Aragonite crystallization in primary cell cultures of multicellular isolates from a hard coral, Pocillopora damicornis. Proc Natl Acad Sci U S A. 98:11885-90
Domart-Coulon IJ, Tambutte S, Tambutte E, Allemand D (2004) Short term viability of soft tissue detached from skeleton of reef building corals. J Exp Mar Biol Ecol 309:199-217
Frank U, Rabinowitz C, Rinkevich B (1994) In vitro establishment of continuous cell cultures and cell lines from ten colonial cnidarians. Mar Biol 120:491-499
Gaino E, Bo M, Boyer M, Scoccia F (2008) Sperm morphology in the black coral Cirrhipathes sp. (Anthozoa, Antipatharia). Invert Biol 127:249-258
Harel M, Ben-Dov E, Rasoulouniriana D, Siboni N, Kramarsky-Winter E, Loya Y, Barak Z, Wiesman Z, Kushmaro A (2008) A new Thraustochytrid, strain Fng1, isolated from the surface mucus of the hermatypic coral Fungia granulosa. FEMS Microbiol Ecol 64: 378-387 Helman Y, Natale F, Sherrell RM, Lavigne M, Starovoytov V, Gorbunov MY, and
Falkowski PG (2008) Extracellular matrix production and calcium carbonate precipitation by coral cells in vitro. Proc Natl Acad Sci USA 105:54-8
Hyman LH (1940) The invertebrates:Protozoa through Ctenophora. McGraw-Hill, New York and London, 726 pp
Kopecky EJ, Ostrander GK (1999) Isolation and primary culture of viable multicellular endothelial isolates from hard corals. In Vitro Cell Dev Biol Anim 35:616-24
Martin VJ (1990) Development of the nerve cells in Hydrozoan planulae: III. Some interstitial cells transverse the ganglionic pathway in the endoderm. Biol Bull 178:10-20
Martin V, Archer W (1997) Stages of larval development and stem cell population changes during metamorphosis of a hydrozoan planula. Biol Bull 192:41-52
Mochizuki K, Sano H, Kobayashi S, Nishimiya-Fujisawa C, Fujisawa T (2000) Expression and evolutionary conservation of nanos-related genes in Hydra. Dev Genes Evol 210:591-602
Puverel S, Tambutte E, Zoccola D, Domart-Coulon I, Bouchot A,, Lotto S, Allemand D, Tambutte S (2005) Antibodies against the organic matrix in scleractinians: a new tool to study coral biomineralization. Coral Reefs. 24:149-156
Rinkevich B (1999) Cell cultures from marine invertebrates: obstacles, new approaches and recent improvements. J Biotechnol 70:33-153
Schmid V, Reber-Muller S (1995) Transdifferentiation of isolated striated muscle of jellyfish in vitro: the initiation process. Semin Cell Biol 6:109-16
van Oppen MJ, McDonald BJ, Willis B, Miller DJ (2001) The evolutionary history of the coral genus Acropora (Scleractinia, Cnidaria) based on a mitochondrial and a nuclear marker: reticulation, incomplete lineage sorting, or morphological convergence? Mol Biol Evol 18:1315-29

40
CHAPTER 3. Differential expression of three galaxin-related genes during
settlement and metamorphosis in the scleractinian coral Acropora millepora.
3. 1. ABSTRACT.
The coral skeleton consists of CaCO3 deposited upon an organic matrix primarily as
aragonite. Currently galaxin, from Galaxea fascicularis, is the only soluble organic
matrix component that has been characterized from a coral. Three genes related to
galaxin were identified in the coral Acropora millepora. One of the Acropora genes
(Amgalaxin) encodes a clear galaxin ortholog, while the others (Amgalaxin-like 1 and
Amgalaxin-like 2) encode larger and more divergent proteins. All three proteins are
predicted to be extracellular and share common structural features, most notably the
presence of repetitive motifs containing dicysteine residues. In situ hybridisation
reveals distinct, but partially overlapping, spatial expression of the genes in patterns
consistent with distinct roles in calcification. Both of the Amgalaxin-like genes are
expressed exclusively in the early stages of calcification, while Amgalaxin continues
to be expressed in the adult, consistent with the situation in the coral Galaxea.
3. 2. INTRODUCTION.
Although calcification – the deposition of calcium salts, usually to provide a form of
skeletal support - is a widespread trait among animals, scleractinian corals are
distinguished by the scale on which they carry out this process. In contrast to the
internal skeletons of tetrapods and bony fish, which are based on calcium phosphate
in the form of hydroxyapatite, many invertebrate skeletons are composed of CaCO3.
This may take the form of either calcite or aragonite, which have distinct structural
properties. Both forms are known in cnidarians and molluscs, with the massive
exoskeletons of extant scleractinian corals consisting predominantly of the latter.
Scleractinians are responsible for the underlying framework of coral reefs and are the
most obvious calcifying animals in warm shallow waters of the tropics and sub-
tropics. Calcification by corals is known to be strongly enhanced by light (e.g.
Muscatine et al, 2005; Moya et al., 2006) and is therefore assumed to be driven

41
indirectly by photosynthesis in their dinoflagellate symbionts, but very little is known
of the mechanism of calcification or the nature of the organic matrix on which the
CaCO3 of the skeleton is deposited.
The difference in the type of CaCO3 polymorph used to build the wide range of
invertebrate support structures reflects the biological control exerted by the organism
during mineral deposition. This is achieved via a macromolecular network of proteins,
lipids and polysaccharides (Cuif and Dauphin, 2005; Puverel et al., 2005, Helman et
al., 2008) known as the skeletal organic matrix (SOM). Prior to mineralization, this
matrix is secreted to the extracellular space by the calcifying cells and there induces
CaCO3 nucleation, determining the type of polymorph as well as size and shape of
crystals (Allemand et al, 1998: Goldberg, 2001; Fukuda et al., 2003; Clode and
Marshall, 2002a; Clode and Marshall, 2003; Watanabe et al., 2003).
Although the process of calcification and the nature of the calcifying matrix have
been extensively studied in molluscs (Adaddi et al., 2006; Fu et al. 2005; Gotliv et al.,
2005), there have been relatively few corresponding studies on corals. To date, the
only protein to have been fully characterised from the calcifying matrix of
scleractinian corals is galaxin, which was originally identified from the coral Galaxea
fascicularis (Fukuda et al., 2003). Most studies carried out to date have focussed on
soluble components of adult coral SOMs, despite the fact that calcification is initiated
immediately after settlement (Vandermeuden, 1975).
The presence of the massive skeleton, however, complicates analysis of the process of
calcification, whereas the period immediately following settlement is likely to be
more tractable. The initiation of larval skeleton deposition correlates with the aboral
ectodermal transition that gives rise to the calicoblastic ectoderm (Le Tessier, 1988;
Vandermeulen, 1975; Clode and Marshall, 2004, Hirose et al., 2008). Larval skeleton
deposition does not require the presence of zooxanthellae, but generates a template for
the skeleton of the initial polyp (Vandermeulen, 1975; Le Tessier, 1988; Cuif and
Dauphin, 2005). Both the organization and orientation of calcium carbonate differs
between larval and adult calcification; larval skeletons are more lightly mineralised
and may contain amorphous calcium carbonate, calcite and aragonite crystals.

42
When the latter are present they are in the form of smaller crystals that are randomly
orientated whereas adult skeletons are exclusively composed of aragonite crystals
organized in parallel fibres (Vandermeulen and Watabe, 1973). It is unclear whether
this apparent difference between larval and adult calcification patterns represents two
distinct types of calcification, or ontogenetic stages in the development of a largely
aragonite skeleton as is the case in molluscs (Weiss et al, 2002). In either case, the
immediate post-settlement period is the only time during the life cycle of the coral
that calcification, and the role of the SOM can be studied in isolation and it thus
presents a unique opportunity to investigate the molecular bases of coral calcification.
An ongoing EST project on the staghorn coral Acropora millepora has allowed the
identification of genes encoding candidate calcifying matrix components. Here we
report the sequences and expression patterns of three genes encoding galaxin-related
molecules in Acropora. Based on these data, we suggest distinct roles for the three
gene products during the two characteristic phases of calcification observed during
the coral life cycle. This paper is particularly topical given the current concern over
the effects of rising levels of atmospheric CO2 on the acidity of the oceans, and
consequently on the ability of marine organisms to lay down their CaCO3 skeletons.
Note that some of the results presented in this chapter were obtained by others, but are
included here to provide context for the work that I did. The Galaxin-like2 gene was
cloned by David Hayward, and the in situs presented were obtained by Zhiyi Lin and
Eldon Ball, after extensive trouble shooting by the Ball laboratory. In situ
hybridisation analysis of the galaxins was a particularly challenging undertaking, and
required modifications to the standard protocol.

43
3. 3. MATERIAL AND METHODS.
3. 3. 1. Fixation and storage.
Acropora embryos and larvae were fixed for 15-60 min in 3.7% formaldehyde in
Millipore-filtered seawater (MPFSW) buffered to pH8.0 with Hepes buffer. Fixed
material was washed repeatedly in MPFSW, dehydrated through a graded methanol series
and stored in absolute methanol at –20oC until needed.
3. 3. 2. In situ hybridization and image capture.
Riboprobe synthesis and in situ hybridisation were performed as reported by
(Hayward, et al. 2001). Following development embryos were washed in PBT and
gradually dehydrated to 70% glycerol in which they were stored. They were mounted
on microscope slides in 90% glycerol for photography. Digital images were captured
with a Spot Camera mounted on a Wild Photomakroskop. Micrographs of embryos
of varying stages were moved to a common white background and color and contrast
adjusted for better visualization of staining patterns.
3. 3. 3. Sequencing.
DNA sequencing was performed using Big Dye Terminator v. 3.1 (Applied
BioSystems) with vector and internal primers. Reactions were run on an ABI 3730
sequencer at the Biomolecular Resource Facility (JCSMR, ANU). Sequence anaysis
was carried out using MacVector 9.5.2 (Accelrys) and Lasergene (DNASTAR).
3. 3. 4. RACE.
A 520 bp sequence with similarity to galaxin was identified in a screen for genes
which are differentially expressed during metamorphosis (unpublished). 5’ and 3’
RACE was carried out with primary polyp RNA following the Clontech SMART
RACE cDNA Amplification kit procedure. The primers used were: 5’RACE:
5’GATGGTGCTGTTTTTGGTGAGGAC3’; 3’RACE:
5’CTGCTGTAGTGGTCGTGTCCTCAC3’. The PCR products were ligated into
pGEM-T Easy (Promega). The predicted cDNA sequence was assembled from the

44
overlapping 5’ and 3’ sequences using SeqMan (DNASTAR). The existence of the
predicted transcript was confirmed by using the following 5’ UTR and 3’ UTR
primers to generate a product of the predicted size and sequence: 5’UTRprimer:
5’AACAGAGGAGATAGCTAGTGT3’; 3’UTRprimer:
5’GTCCTCCTCGAGGTTACATCAC3’.
3. 3. 5. Virtual northern blots.
"Virtual northern blots" were made using the Clontech SMART cDNA Synthesis Kit,
according to the manufacturer's instructions using RNA from the stages indicated.
3. 4. RESULTS.
3. 4. 1. Identification of three galaxin-related genes in Acropora
Two unigenes identified during EST analyses of Acropora millepora gave strong
matches with Gfgalaxin, the gene coding for a soluble protein identified as a major
component of the exoskeleton of the coral Galaxea fascicularis (Fukuda et al., 2003,
Watanabe et al., 2003). One of these (Amgalaxin) is assumed to be the Acropora
ortholog of Gfgalaxin, as the predicted proteins had 58% identity and 73% similarity
overall (BlastP significance = 1e-105). The second unigene, Amgalaxin-like 1, encodes
a larger protein with much lower overall identity to Gfgalaxin (BlastP significance =
7e-19). An additional related unigene, Amgalaxin-like 2, was identified in a screen for
genes differentially regulated at the time of settlement, and has a BlastP significance
against Gfgalaxin of 2e-33.
3. 4. 2. Structure of the predicted galaxin-related proteins from Acropora
The Acropora and Galaxea galaxins are very similar in most structural characteristics.
Like its Galaxea counterpart, Amgalaxin is cysteine-rich (12.4% overall, compared to
13.4% in Gfgalaxin). The 338 AA Acropora predicted protein (Fig. 1A) consists of an
N-terminal signal peptide of 23 AA, the bulk of the rest of the protein consisting of
tandem repeats, each of around 30 AA and containing two di-Cysteine motifs (Fig
2A). Both proteins have a dibasic recognition site for processing endoproteases giving

45
predicted mature proteins of 298 amino acids (Gfgalaxin) and 292 amino acids
(Amgalaxin).
The proteins are also similar in terms of predicted isoelectric points; for the mature
proteins, pI values of 4.52 (Amgalaxin) and 4.53 (Gfgalaxin) were calculated.
Gfgalaxin is a glycoprotein (Fukuda et al., 2003); however, only one of the two
potential N-glycosylation (i.e. N-X-S/T motif) sites identified in Gfgalaxin is
conserved in the Acropora protein (Asn178). The high content of threonine and serine
residues (14% and 8.9 % in Gfgalaxin and Amgalaxin, respectively) suggests that O-
glycosylation may be more significant. However, NetOGly
(http://www.cbs.dtu.dk/services/NetOGlyc/) predicts only two positions with
significant likelihood of O-glycosylation in Amgalaxin and a single potential site in
Gfgalaxin.
3. 4. 3. The Amgalaxin-like proteins are related but divergent
The cDNAs encoding both of the Amgalaxin-like proteins are larger than that
encoding Amgalaxin, as are the predicted proteins themselves; Amgalaxin-like 1 is
predicted to be 660 AAs and Amgalaxin-like 2 is 582 AAs. The Amgalaxin-like
precursor proteins have a common domain structure that differs from the galaxins by
the presence of a domain rich in acidic amino acid residues (Fig. 1B and C). As in the
case of the galaxins, signal peptides (24 and 16 AA in Amgalaxin-like 1 and 2
respectively) and Cys-rich repeat regions are present. Although the repeat units in the
Cys-rich domain of Amgalaxin-like 1 are approximately the same size (29 AAs) as
those in the galaxins, one difference that is potentially significant with respect to
protein folding and higher order structure is the spacing of the cysteine residues.
Whereas the galaxin proteins have two di-Cys motifs per repeat unit, Amgalaxin-like
1 has only one. The other two cysteine residues in each repeat are separated by three
amino acids. The basic repeat unit in Amgalaxin-like 2 is 41 amino acids long and
contains three di-Cys motifs. As in the case of Amgalaxin-like 1, the repeats in
Amgalxin-like 2 are more similar to each other than are the Amgalaxin repeats.
When the consensus sequences of the Cys-rich repeats of the three proteins are
compared it is apparent that Amgalaxin-like 2 and Amgalaxin share the greatest

46
similarity (Fig. 2). Although consensus sequences can be constructed for the galaxin
and Amgalaxin-like repeats there is little similarity between the proteins apart from
the arrangement of the dicysteine residues.
Amgalaxin and Amgalaxin-like 2 are both predicted to be moderately acidic proteins
(pIs of 4.52 and 4.6 respectively for the mature proteins), whereas the mature
Amgalaxin-like 1 protein is more basic (predicted pI of 9.09). The mature Amgalaxin-
like proteins contain 13% and 16% Aspartic (Asp) and Glutamic (Glu) acid residues,
predominantly located in one part of the protein, the acidic domain (Fig. 1B).
NetNGlyc (http://www.cbs.dtu.dk/services/NetNGlyc/) predicts N-glycosylation at
Asn48 in Amgalaxin-like 1 with high probability, but does not predict glycosylation
at the single N-X-S/T site in Amgalaxin nor at either of the potential sites in the
Galaxea protein. NetOGlyc (http://www.cbs.dtu.dk/serv.ices/NetOGlyc/) does not
predict any likely O-glycosylation sites in Amgalaxin-like 1. The mature Amgalaxin-
like 2 protein contains three potential N-glycosylation sites and several potential sites
for O-linked glycosylation.
3. 4. 4. Expression analysis of A. millepora galaxin-related genes.
Virtual northern analysis shows that the Amgalaxin and Amgalaxin-like genes each
have distinct temporal expression patterns (Fig. 3). We will therefore consider these
genes in the order in which they are expressed. Amgalaxin-like 1 is expressed strongly
in pre-settlement planulae and primary polyps, but the mRNA was not detected in
adult colonies (Fig. 3A). Amgalaxin-like 2 expression is restricted to post-settlement
polyps (Fig. 3B). By contrast, as in the case of its Galaxea counterpart (Fukuda et al.,
2003), Amgalaxin is expressed in both of the post-metamorphosis stages examined:
weakly in primary polyps, but strongly in adult colonies (Fig 3C). In the case of
Amgalaxin, two transcripts were detected on virtual northern blots (Fig 3C). The
strong upper band, with an apparent size of approximately 2Kb, corresponds to the
sequence shown; the lower (~1.7Kb) band is assumed to correspond to an
alternatively spliced product.
Amgalaxin-like 1 spatial expression is first detected in a subset of aboral ectodermal
47
cells of the mid-late planula (Fig 4A-C, arrows), in a region previously described for a
variety of Anthozoarians known as the “apical organ” which is believed to be
involved in substrate recognition (Vandermeulen, 1974; Chia and Koss, 1979).
During settlement and metamorphosis, Amgalaxin-like 1 expression remains restricted
to this ectodermal cell population (Fig 4D-I). At this time, changes in the overall
morphology of the larva can be observed as it flattens down onto the substratum and
mesenteries are formed. After the larva has flattened (Fig 4D), the Amgalaxin-like 1
expression domain expands radially from the former aboral end of the planula to near
the edge of the now flat primary polyp (Fig 4H-I). This outer, sub-marginal ring of
expression on the aboral side persists until about the 12-septum stage before gradually
dissipating. Throughout this time the expressing cells are distinct from one another
and maintain a columnar morphology (Fig 4 A-H).
Consistent with the developmental virtual northern blot (Fig. 3B), Amgalaxin-like 2
expression is not present in the pre-settlement planula larva (Fig. 5A-B), first
appearing as the spindle-shaped planula shortens into a sphere (Fig. 5C-D) before
flattening against the substratum (Fig. 5E-J;). Thereafter, expression is localized to an
expanding ring in the aboral ectoderm (Fig 5C-J), in its final stages (Fig 6H-J)
resembling the expression of Amgalaxin-like 1 (Fig 5I).
Although virtual northern blot analysis showed that Amgalaxin expression was much
stronger in the adult, expression was also present in immediate post-settlement stages.
This finding is consistent with in situ hybridization results, which show expression
beginning in an aboral ring resembling those seen for Amgalaxin-like 1 and 2 (Fig
6A). However, there is one marked difference between Amgalaxin and the galaxin-
like transcripts in that Amgalaxin is expressed along the calcifying septa from shortly
after their initiation (Fig 6B-F) and was still apparent there at the twelve septum stage
in the oldest polyp which we attempted to stain (Fig 6F).
3. 5. DISCUSSION.
All three of the Acropora galaxin-related proteins contain cysteine-rich domains
including tandemly repeating di-Cys motifs (Fig. 1-2). The presence of these domains
is consistent with these proteins having a structural role in the organic matrix, as

48
framework proteins are frequently Cys-rich (Shen et al., 1997; Gotliv et al., 2005) and
tandem repeats with conserved Cys residues are commonly found in many types of
extracellular matrix and cell surface receptor proteins (Shen et al., 1997; Bhattacharya
et al., 2002). Double Cys motifs may form intramolecular cross-links via disulfide
bonds (Shen et al., 1997). However, in vitro studies with synthetic peptides indicate
that dicysteine motifs may efficiently form cyclo-cystine loops (Liff and Zimmerman
1998), limiting their ability to form intra- (or inter-) molecular cross links (Watanabe
et al., 2003). Fukuda et al. (2003) suggest that therefore only the two terminal Cys
residues may be available for intermolecular disulfide bonds.
Although only distantly related to the scleractinian galaxins, proteins with similar
properties have been identified as components of the organic matrix of molluscs. For
example, di-Cys motifs are found in lustrin A from Haliotis rufescens (Shen et al.,
1997), the N14 protein from Pinctada maxima (Kono et al, 2000) and in pearlin from
Pinctada fucata (Miyashita et al., 2000). These similarities raise the possibility of
common functions in biomineralization (Fukuda et al., 2003; Watanabe et al., 2003),
either in establishing an overall structural framework onto which other matrix
components may be deposited or in actively controlling crystal nucleation and
development.
3. 5. 1. The Amgalaxin-like proteins combine characteristics of two distinct
protein families involved in mollusc calcification.
Although Amgalaxin-like 1, Amgalaxin-like 2 and Amgalaxin are clearly related, one
major difference is the presence of an acidic domain in the galaxin-like molecules that
is absent from both the Acropora and Galaxea galaxin proteins. Proteins rich in acidic
amino acid residues are important components of the organic matrices of a number of
taxonomically diverse calcifying invertebrates. For example, Gotliv et al., (2005)
identified a family of Asp-rich proteins associated with the mineral component of the
bivalve Atrina rigida and suggested roles in controlling mineralization.
Ameye et al., (1999) identified an acidic N-glycoprotein in the organic matrix of
spicules from the sea urchin Paracentrotus lividus and Rahman et al. (2005; 2006a,b)
found acidic proteins that bind calcium in the organic matrix of spicules of the

49
alcyonarians Sinularia polydactyla and Lobophytum crassum and reported that both
species possess aspartic acid rich matrices. Although there are no direct precedents
from scleractinians, Puverel et al. (2005) found that matrices of both Stylophora
pistillata and Pavona cactus were high in acidic amino acids (45.9 and 65.5% acidic
amino acids, respectively) and obtained an internal sequence from S. pistillata that
contained a long (36 residue) poly-Asp domain.
While the overall pI value for Amgalaxin-like 1 mature protein is 9.09, charged amino
acid residues are distributed in a non-uniform way: the values for the acidic and Cys-
rich regions are 3.21 and 12.39, respectively, and the Amgalaxin-like 2 protein has a
similar bipartite structure. The pIs of the acidic domains are in the same range as
those reported for some acidic protein components of molluscan matrices (Gotliv et
al., 2005), while the pIs of the Cys-rich regions resemble those of a family of matrix
proteins from the pearl oyster Pinctada fucada (pI values of 9.5 and 9.8; Zhang et al.,
2006a).
The Amgalaxin-like proteins therefore combine characteristics that in molluscs reside
in two distinct families of matrix proteins; an Asp-rich family of proteins (Gotliv et
al., 2005) which might actively control mineralization (Fukuda et al., 2003), and a
family of basic proteins that could be involved in linking hydrophilic molecules to the
framework of the organic matrix, or binding carbonate (Zhang et al., 2006).
The acidic domains found in the AmGalaxin-like proteins are likely to control basal
plate deposition by actively binding calcium. Gotliv et al., (2005) reported a calcium-
binding domain similar to that from Calsequestrin in the Asp-rich proteins and
mentioned that this type of calcium-binding activity is related to the negatively charge
carboxyl groups from Asp or Glu residues. Furthermore, Addadi et al., (2006)
reported that acidic domains were occluded into the crystal phases of mollusc shells
and Nudelman et al., (2006) reported areas rich in carboxyl groups from Asp and Glu
side chains underlying newly form CaCO3 crystals while crystal growth areas
contained few acidic functional groups. Although Gotliv et al., (2005) mentioned that
to date only acidic matrix proteins are associated with calcite deposition, Nudelman et
al., (2006) reported and assemblage of acidic proteins in the OM from Nautilus
pompilius that are able to nucleate aragonite.
50
3. 5. 2. What is the function of the Amgalaxin-like proteins?
Although the galaxin-like proteins have an overall structural similarity, they are
otherwise dissimilar at the primary amino sequence level, and may be expected to
fulfill somewhat different functions during calcification. Their sequential expression
during development (Fig 3) is consistent with this suggestion.
Deposition of the coral skeleton is thought to occur as a two-step process; the first
step is the formation of early mineralization zones characterized by the presence of
randomly oriented grains of CaCO3, followed by a second step characterized by
crystal-like fibers of aragonite. This pattern of mineralization has been described in
newly settled Pocillopora damicornis (Vandermuelen and Watabe, 1973) and Porites
porites (Goreau and Hayes, 1977) and in axial polyps of Acropora cervicornis
(Gladfelter, 1982). Although these two kinds of calcification probably both occur
throughout the coral life cycle (Cuif and Dauphin, 2005), several lines of evidence
suggest that granular calcification predominates during early coral development,
whereas calcification may be largely of the fibrous type in adult colonies. However, it
is only in newly settled polyps that the two processes can be studied in isolation.
Goreau and Hayes (1977) describe the beginnings of skeleton formation as the
secretion of "mucoid substances" which serve to cement the settling planula to the
substratum and it is possible that this could be the function of the Amgalaxin-like 1
protein. In contrast, in their descriptions of the early post-settlement stages
Vandermulen and Watabe (1973) and Le Tissier (1988) concentrated on the calcified
elements of the early skeleton, perhaps because of the preparation techniques that they
used. The earliest post settlement stage of Pocillopora shown by Le Tissier (1988,
Fig. 2a) has a complete circular rim of calcified material on the basal plate with
scattered areas of calcification within this circle, while in Porites Goreau and Hayes
(1977, Fig. 4-2) show a portion of the rim of the plate as calcified with scattered areas
of calcification on the plate.
Clode and Marshall (2004) measured intracellular calcium in pre- and post-settlement
larvae of Pocillopora damicornis using Calcium Orange fluorescence and found that

51
levels of intracellular calcium were lowest in a small area at the aboral end of pre-
settlement and immediate post-settlement planulae. This area corresponds extremely
well to areas of Amgalaxin-like 1 expression shown in Fig. 4A-E. Whether there is a
functional relationship between the two patterns remains to be investigated.
The expression of Amgalaxin-like 2, in contrast, essentially demarcates the outer
limits of the low Ca2+ area seen in Pocillopora. So, based on their respective
distributions we suggest that the two Amgalaxin-like proteins are engaged
respectively in laying down the organic matrix in advance of calcification and in the
process of calcification itself in the case of Amgalaxin-like 2. Another possibility is
that transiently expressed proteins such as the Amgalaxin-like molecules may actually
be inhibiting the formation of aragonite fibers in the basal plate while inducing calcite
deposition. Indeed, there is an invertebrate precedent for such an action of acidic
proteins since Addadi and Weiner (1985) established that they could alter the
morphology of calcite crystals by adding an acidic matrix protein from the bivalve
mollusc Mytilus.
3. 5. 3. Amgalaxin and the mesenteries: fiber-like calcification.
Following its initial expression in an aboral ring resembling those seen for the
Amgalaxin-like transcripts (Fig 6A-B), Amgalaxin is expressed along the calcifying
septa in a pattern distinct from the Amgalaxin-like transcripts. The close
correspondence between the appearance of mesenteries (and the implied initiation of
septal mineralization) and the initiation of Amgalaxin expression is consistent with
involvement of Amgalaxin-like in deposition of the basal plate and protosepta,
Amgalaxin could thus be involved in the fiber-like calcification characteristic of
mesenteries.
The strong expression of Amgalaxin in adult Acropora and the abundance of the
corresponding protein in mature Galaxea colonies (Fukuda et al., 2003) imply that
galaxins may be involved in controlling the fiber-like aragonite deposition
characteristic of adult skeletons. According to Vandermeulen and Watabe (1973) the
basal plate of Pocillopora contains a mixture of calcite and aragonite, so neither the
circular expression pattern nor septal expression is inconsistent with the idea that the

52
Amgalaxin-like molecules are associated with granular calcification and Amgalaxin
with aragonite. Aragonite deposition greatly predominates in the adult coral and only
Amgalaxin expression persists into that stage.
As in the case of mucoperlin, a component of the mollusc organic matrix (Marin et
al., 2000), galaxins resemble mucins in that they have a high serine content with
consequent glycosylation potential and have a tandem repeat structure. This structure
is consistent with the idea that these and other ECM genes may have evolved from a
mucin-type ancestor (Marin et al., 1996). However, the experiments of Fukuda et al.
(2003) indicate that Gfgalaxin does not bind Ca2+, so the exact role of all of the
galaxin-related proteins remains to be established.
3. 5. 4. Galaxins as examples of functional convergence after secondary
recruitment?
Massive calcification is a widespread trait across the animal kingdom; obvious
examples are found among echinoderms, molluscs, vertebrates and corals. Many lines
of evidence indicate that the trait has evolved independently in these lineages despite
the involvement of some common classes of molecules (e.g. carbonic anhydrases).
Although the coral galaxins and the mollusc lustrin A/N14/pearlin proteins may have
separate evolutionary origins, their structural similarity suggests common function.
Likewise the galaxin-like proteins may combine the functions of two distinct classes
of mollusc proteins – the acidic proteins that are thought to actively control
mineralisation, and basic proteins that either bind bicarbonate or form links with the
organic matrix.
Although proteins containing multiple di-Cys motifs are widely distributed, clear
orthologs of galaxin are so far known only from scleractinians. However, there are
predicted proteins in the non-calcifying cnidarians Nematostella (e.g. EDO38853.1)
and Hydra (XP_002169304; “usherin-like”) having moderate degrees of similarity to
the scleractinian galaxins, and a “galaxin” has been reported in the vestimentiferan
tubeworm Riftia pachyptila (Sanchez et al., 2007). There are also database entries
annotated as either “similar to galaxin” or “galaxin-related” from Ciona and
Oikopleura (AAS21342), respectively.
53
The product of the Ciona (“similar to galaxin”) gene ci0100148033 gives a BlastP
score of 2e-31 against Amgalaxin (for comparison, BlastP similarity between
Amgalaxin and Amgalaxin-like 1 is 4e-29) and the gene is expressed throughout the
epidermis at the late tailbud stage (Aniseed database: http://aniseed-ibdm.univ-
mrs.fr/insitu.php?id=2732806), while the Riftia “galaxin” was identified as body-wall
specific in differential display experiments (Sanchez et al., 2007). Together with the
Acropora data, these various lines of evidence suggest that the ancestral galaxins may
have been structural ECM proteins that were secondarily recruited to roles in
skeletogenesis during the Triassic, when scleractinians first appear in the fossil
record. Comparison of sequences and expression data across a broad range of
cnidarians and other animals will be required to clarify the evolution of this protein
family.

54
3. 6. CHAPTER FIGURES.
Figure 3. 1. Inferred protein sequences of Amgalaxin and the Amgalaxin-like molecules. Amgalaxin differs from the galaxin-like molecules in that it lacks an acidic domain. The signal peptide is marked in green, the acidic domain in yellow, and the di-Cys repeats in red. Potential N-linked glycosylation sites in Amgalaxin and Amgalaxin-like-2 are shown in blue.

55
Figure 3. 2. Alignments of the Cys rich repeats of the three proteins. Numbers on the left indicate the position in the predicted protein. A consensus sequence for the repeats from each protein is shown beneath the alignments. Residues are included in the consensus if they are represented in at least 50% of the repeats.

56
Figure 3. 3. Virtual northern blots of the three genes arranged in the order in which they are expressed. The various stages represented on each blot are labelled across the bottom of the blot. Amgalaxin-like 1 expression first appears weakly even before gastrulation and is strong both before and after settlement, but is not apparent in the adult. Amgalaxin-like 2 is expressed exclusively immediately after settlement. Amgalaxin apparently has two isoforms both of which are expressed weakly immediately after settlement and more strongly in the adult. Abbreviations : PC=prawn chip, D=donut, Pre=presettlement planula larva, Post=polyp immediately after settlement.

57
Figure 3. 4. Developmental expression of Amgalaxin-like 1. (A-C) Expression begins in a zone of strong expression at the aboral end of the planula. At the margins of this zone the expressing cells are no longer contiguous (arrows). (D-F) After settlement the zone of expression on the aboral side of the polyp expands as the polyp ages. (G-H) The zone of expression then begins to fragment segmentally, eventually leaving a few traces of expression centrally as well as a submarginal ring of expression (I).

58
Figure 3. 5. Developmental expression of Amgalaxin-like 2. There is no expression in the planula larva (A-B). Expression first appears as a ring on the aboral side of the planula as it shortens to form a sphere (C-D). Expression continues aborally, sometimes in a zone (E) and sometimes in a submarginal ring (F-J) as the polyp ages. In F,H and J the polyp is viewed orally and the aboral expression is seen through the cleared tissue.

59
Figure 3. 6. Developmental expression of Amgalaxin. Expression begins as an aboral submarginal ring (A-B) Septal expression is then added (arrows) as the polyp grows older (C-F). There is also sometimes aboral granular expression between the septa (E). Septal expression continues in the oldest polyp studied (F).
60
3. 7. REFERENCES. Addadi L, Joester D, Nudelman F, Weiner S. (2006) Mollusk shell formation: A source of new concepts for understanding biomineralization processes. Chemistry-A European Journal, 12:980-987. Addadi L, Weiner S (1985) Interactions between acidic proteins and crystals: Stereochemical requirements in biomineralization. Proc Natl Acad Sci USA, 82:4110-4114. Allemand D, Tambutte E, Girard JP, Jaubert J (1998) Organic matrix synthesis in the scleractinian coral Stylophora pistillata: role in biomineralization and potential target of the organotin tributyltin. J Exp Biol, 201:2001-2009. Ameye L, Hermann R, Killian C, Wilt F, Dubois P (1999) Ultrastructural localization of proteins involved in sea urchin biomineralization. J Histochem Cytochem, 47: 1189-1200. Bhattacharya G, Miller C, Kimberling WJ, Jablonski MM, Cosgrove D (2002) Localization and expression of usherin: a novel basement membrane protein defective in people with Usher's syndrome type IIa. Hearing Res, 163:1-11. Clode PL, Marshall AT (2002) Low temperature FESEM of the calcifying interface of a scleractinian coral. Tissue Cell, 34:187-198. Clode PL, Marshall AT (2003) Calcium associated with a fibrillar organic matrix in the scleractinian coral Galaxea fascicularis. Protoplasma, 220:153-161. Clode PL, Marshall AT (2004) Calcium localisation by X-ray microanalysis and fluorescence microscopy in larvae of zooxanthellate and azooxanthellate corals. Tissue Cell, 36:379-390. Cuif JP, Dauphin Y (2005) The two-step mode of growth in the scleractinian coral skeletons from the micrometre to the overall scale. J Struct Biol, 150:319-331. Fu G, Valiyaveettil S, Wopenka B, Morse DE (2005) CaCO3 biomineralization: Acidic 8-kDa proteins isolated from aragonitic abalone shell nacre can specifically modify calcite crystal morphology. Biomacromolecules, 6:1289- 1298. Fukuda I, Ooki S, Fujita T, Murayama E, Nagasawa H, Isa Y, Watanabe T (2003) Molecular cloning of a cDNA encoding a soluble protein in the coral exoskeleton. Biochem Biophys Res Commun, 304:11-17. Gladfelter EH (1982) Skeletal development in Acropora cervicornis: I. Patterns of calcium carbonate accretion in the axial corallite. Coral Reefs, 1:45-51 Goldberg WM (2001) Acid polysaccharides in the skeletal matrix and calicoblastic epithelium of the stony coral Mycetophyllia reesi. Tissue Cell, 33:376-87. Goreau NI, Hayes RL (1977) Nucleation catalysis in coral skeletogenesis. Proc 3rd
Intl Coral Reef Symp, 439-445. Gotliv BA, Kessler N, Sumerel JL, Morse DE, Tuross N, Addadi L, Weiner S (2005) Asprich: A novel aspartic acid-rich protein family from the prismatic shell matrix of the bivalve Atrina rigida. Chembiochem, 6:304-314. Hayward DC, Catmull J, Reece-Hoyes JS, Berghammer H, Dodd H, Hann SJ, Miller DJ, Ball EE (2001) Gene structure and larval expression of cnox-2Am from the coral Acropora millepora. Dev Genes Evol, 211:10-19. Helman Y, Natale F, Sherrell RM, Lavigne M, Starovoytov V, Gorbunov MY, Falkowski PG (2008) Extracellular matrix production and calcium carbonate precipitation by coral cells in vitro. Proc Natl Acad Sci USA, 105:54-58.

61
Hirose M, Yamamoto H, Nonaka M (2008) Metamorphosis and acquisition of symbiotic algae in planula larvae and primary polyps of Acropora spp. Coral Reefs, 27: 247- 254. Kono M, Hayashi N, Samata T (2000) Molecular mechanism of the nacreous layer formation in Pinctada maxima. Biochem Biophys Res Commun, 269:213- 218. Le Tissier M (1988) Patterns of formation and the ultrastructure of the larval skeleton of Pocillopora damicornis. Mar Biol, 98:493-501. Liff MI, Zimmerman MN (1998) NMR study of crosslinking by oxidation of four- cysteine polypeptide models of the elastic network phase of wool fibre. Polym Int, 47: 375–385. Marin F, Corstjens P, de Gaulejac B, de Vrind-De Jong E, Westbroek P (2000) Mucins and molluscan calcification. Molecular characterization of mucoperlin, a novel mucin- like protein from the nacreous shell layer of the fan mussel Pinna nobilis (Bivalvia, pteriomorphia). J Biol Chem, 275:20667-20675. Marin F, Smith M, Isa Y, Muyzer G, Westbroek P (1996) Skeletal matrices, muci, and the origin of invertebrate calcification. Proc Natl Acad Sci USA, 93:1554- 1559. Miyashita T, Takagi R, Okushima M, Nakano S, Miyamoto H, Nishikawa E, Matsushiro A (2000) Complementary DNA cloning and characterization of pearlin, a new class of matrix protein in the nacreous layer of oyster pearls. Mar Biotechnol, 2:409-418. Moya A, Tambutte S, Tambutte E, Zoccola D, Caminiti N, Allemand D (2006) Study of calcification during a daily cycle of the coral Stylophora pistillata: implications for 'light-enhanced calcification'. J Exp Biol, 209:3413- 3419. Muscatine L, Goiran C, Land L, Jaubert J, Cuif JP, Allemand D (2005) Stable isotopes (delta13C and delta15N) of organic matrix from coral skeleton. Proc Natl Acad Sci USA, 102:1525-1530. Puverel S, Tambutte E, Zoccola D, Domart-Coulon I, Bouchot A, Lotto S, Allemand D, Tambutte S (2005) Antibodies against the organic matrix in scleractinians: a new tool to study coral biomineralization. Coral Reefs, 24:149-156. Puverel S, Tambutte E, Pereira-Mouries L, Zoccola D, Allemand D, Tambutte S (2005) Soluble organic matrix of two Scleractinian corals: partial and comparative analysis. Comp Biochem Physiol B Biochem Mol Biol, 141:480- 487. Rahman MA, Isa Y, Uehara T (2005) Proteins of calcified endoskeleton II partial amino acid sequences of endoskeletal proteins and the characterization of proteinaceous organic matrix of spicules from the alcyonarian, Synularia polydactyla. Proteomics, 5:885-893. Rahman MA, Isa Y, Takemura A, Uehara T (2006a) Analysis of proteinaceous components of the organic matrix of endoskeletal sclerites from the alcyonarian Lobophytum crassum. Calcif Tissue Int, 78:178-85. Rahman MA, Isa Y, Uehara T (2006b) Studies on two closely related species of octocorallians: biochemical and molecular characteristics of the organic matrices of endoskeletal sclerites. Mar Biotechnol (NY), 8:415-424.

62
Sanchez S, Hourdez S, Lallier FH (2007) Identification of proteins involved in the functioning of Riftia pachyptila symbiosis by subtractive suppression hybridization. BMC Genomics, 8:337. Shen X, Belcher AM, Hansma PK, Stucky GD, Morse DE (1997) Molecular cloning and characterization of lustrinA, a matrix protein from shell and pearl nacre of Haliotis rufescens. J Biol Chem, 272:32472-32481 Vandermeulen JH (1975) Studies on coral reefs. III. Fine structural changes of calicoblast cells in Pocillopora damicornis during settling and calcification. Mar Biol , 31:69-77. Vandermeulen JH, Watabe N (1973) Studies on reef corals. I. Skeleton formation by newly settled planula larva of Pocillopora damicornis. Mar Biol, 23:47-57. Wallace C (1999) Staghorn Corals of the World. Melbourne. CSIRO. Watanabe T, Fukuda I, China K, Isa Y (2003) Molecular analyses of protein components of the organic matrix in the exoskeleton of two scleractinian coral species. Comp Biochem Physiol B Biochem Mol Biol, 136:767-774. Weiss IM, Tuross N, Addadi L, Weiner S (2002) Mollusc larval shell formation: amorphous calcium carbonate is a precursor phase for aragonite. J Exp Zool, 293:478-491. Zhang C, Xie L, Huang J, Liu X, Zhang R (2006) A novel matrix protein family participating in the prismatic layer framework formation of pearl oyster, Pinctada fucata. Biochem Biophys Res Commun, 344:735-40.

63
CHAPTER 4. An atypical calmodulin and a neuronal calcium sensor protein as
potential targets of CaM regulation during development of the coral Acropora
millepora.
4. 1. ABSTRACT.
Changes in cytosolic calcium concentration regulate a wide variety of processes in
eukaryotes including apoptosis, cell differentiation and the secretory pathway. Many
of the mechanisms of calcium regulation are conserved across distant phylogenetic
groups, as are a number of the proteins involved in calcium homeostasis. Calmodulin
(AmCaM) and neurocalcin (AmNC) orthologs were identified in Acropora millepora;
these, and a coral specific calcium sensor protein (AmCaM-like) were expressed
through early development, indicating potential roles in regulating coral
metamorphosis and early stages of calcification. The AmNC and AmCaM-like
proteins contain internal CaM-binding sites and were shown to interact in vitro with
AmCaM. These results suggest that both conventional calcium dependent signalling
pathways and coral specific modifications of a common scheme might regulate coral
specific processes such as metamorphosis and skeleton deposition.
4. 2. INTRODUCTION.
Eukaryotic organisms use changes in intracellular calcium concentration as a
secondary messenger to regulate a variety of cellular signalling pathways such as
fertilization, cell division, metamorphosis, and apoptosis (Haeseleer et al., 2002;
Carafoli, 2004). This is due to both the calcium ion’s capacity to coordinate multiple
molecules and the fact that its concentration gradient is 10,000 fold larger in the
extracellular space than inside eukaryote cells (Carafoli, 2005; Parekh, 2006).
Extracellular calcium enters the cell via voltage-gated, ligand–operated, and
capacitative calcium channels. These intracellular calcium influxes are used to trigger
different signalling pathways or to replenish depleted intracellular stores (Carafoli,
2004).
To avoid toxicity cytosolic free calcium concentration needs to be carefully regulated
i.e. ∼100-200nM (Carafoli, 2003). This is achieved by secreting excess calcium back

64
to the extracellular space, or stored it within membranes via calcium ATPases and
sodium/calcium and hydrogen/calcium exchangers (Carafoli, 2004). Most of the
calcium used to regulate cellular processes by eukaryote cells is released from cellular
stores (Carafoli, 2004); this control mechanism allows the increase of calcium
concentration in localized cellular regions for a limited period of time, which is a
critical factor determining the initiation of specific intracellular signalling pathways
(Carafoli, 2003).
Calcium homeostasis and signalling of precise cellular processes requires a number of
intracellular control mechanisms able to regulate and coordinate cellular activity. This
is achieved via calcium itself, which controls and auto-regulates the transcription and
activity of its own transporters and channels via calcium binding proteins (Carafoli et
al., 1999; Carafoli, 2004). There are two types of calcium binding proteins: those that
transport or buffer calcium, and those that are able to translate its signal. Most
buffering proteins are acidic and have low calcium affinity, whereas those that
translate calcium signals known as “calcium sensors” have high calcium affinity and
experience topological changes that allow them to interact with target proteins
(Carafoli, 2003).
According to Gerhart (1999), signalling pathways have been conserved during
evolution, an idea supported by the presence of orthologs for most key vertebrate
calcium signalling and homeostasis molecules in the Acropora millepora EST
database. Furthermore, it is believed that modern CaM molecules evolved in the stem
of eukaryotes from an ancestral CaM gene from which subsequent duplications
allowed the diversification of calcium binding proteins and calcium dependent
cellular pathways among eukaryotes (Baba et al., 1984; Haeseleer et al., 2002). CaM
coding genes have been previously characterized in other Cnidarians (Jamieson et al.,
1980; Yuasa et al., 2001) and are found in Hydra capillata and Nematostella vectensis
EST databases.
Thus, is reasonable to think that coral CaM as well as specific calcium sensors are to
some extent responsible for coral-specific process such as exocytosis of organic
matrix precursors and the calcium transport/storage mechanisms necessary for
skeleton deposition (Clode and Marshall, 2002; Puverel et al., 2005) as well as tissue

65
rearrangement and calicoblast differentiation during metamorphosis (Vandermeulen,
1974; Clode and Marshall, 2004).
Hermatypic corals are responsible for much of the calcium carbonate deposition in
coral reefs (Chave et al. 1975), one of the most productive ecosystems on earth
(Gunderson, 2007); they belong to the class Anthozoa (Hexacorallia: Scleractinia),
the most basal lineage within the phylum cnidaria, which is considered the sister
group to Bilateria (Dunn et al., 2008; Medina et al., 2001). According to this, the
study of calcium dependent cellular pathways in the coral A. milllepora not only will
provide valuable information for the management and conservation of coral reefs in
response to climate change and rising levels of CO2, it also represents an ideal model
to study the evolution and diversification of calcium dependent cellular pathways in
the animal kingdom.
This study focuses on the characterization of EF-hand calcium sensors in the reef
building coral A. millepora with emphasis on putative AmCaM interactions likely to
coordinating vesicle transport and metamorphosis during settlement and early stages
of coral calcification.
4. 3. MATERIALS AND METHODS.
4. 3. 1. Collection of larvae. Acropora millepora colonies were collected from Magnetic Island, Queensland,
Australia. Mature colonies were placed in large containers of seawater on the shore
before dusk prior to spawning. After spawning, egg and sperm bundles were removed
from the surface and mixed in containers containing fresh seawater. Fertilization
lasted 2h. Developing embryos were maintained until reaching the desired
developmental stage, at which time embryos were removed and frozen in liquid
nitrogen for RNA extraction and cDNA synthesis. Every 12h, dead embryos and
resulting surface lipids were removed and the water exchanged to allow for continued
development.
4. 3. 2. RNA extraction.

66
Total RNA was extracted from Acropora millepora embryos collected at various
stages of development. Extraction of RNA was achieved using Ambion RNAwiz™
RNA isolation reagent and associated protocols.
4. 3. 3. RNA quantification.
RNA quantification was determined spectrophotometrically using the BIORAD Smart
Spec™ spectrophotometer at a wavelength of 260nm where an absorbance of 1.0 =
40µg/mL RNA.
4. 3. 4. Preparation of cDNA for Virtual Northern Blotting.
‘Virtual’ northern blots were used to assess the developmental expression pattern of
the genes of interest due to the scarcity of material available to make repeated batches
of RNA. First strand cDNA was synthesized using the BD Biosciences SMART PCR
cDNA synthesis kit according to the manufacturers specifications.
4. 3. 5. Southern blotting and hybridisation.
cDNA was transferred from agarose gels to nylon membranes as described in
Sambrook et al. (1989) and Amersham membrane protocols. The DNA of interest
was electrophoresed on an agarose gel and transferred to Nytran-N (Schleicher &
Scheull) or Hybond-N, -N+ or -NX (Amersham) using the capillary blot transfer
method overnight in 20xSSC or 0.4M sodium hydroxide (Hybond-N+). DNA was
covalently linked to membranes by baking at 80°C for 2h.
Following fixation of DNA, membranes were prepared for hybridisation by
incubating in 100 ml of DNA hybridisation solution at 60°C for 2 - 3 h. The DNA
was hybridized to the membrane at 60 - 65°C for at 12 - 16 h, after which it was
washed (2 x 15 min) with 200 ml of low stringency wash solution (2xSSC; 0.1%
SDS) at 60 - 65°C. Membranes were monitored with a Geiger counter and exposed to
Phosphorimager screens for 3 - 5 h. Screens were scanned using a Phosphorimager
(Molecular Dynamics) and images were processed using ImageQuant software
(Molecular Dynamics).

67
4. 3. 6. Generation of radioactive probes.
Radioactive probes were prepared by random oligonucleotide-primed synthesis
(oligolabelling) using α-32P dATP (Geneworks; 10 mCi/ml, specific activity ~3000
Ci/mmol). Generally, 25 ng of linear DNA recovered from agarose gel fragments
were radioactively labelled using the Megaprime (Amersham Biosciences) or Prime-
a-Gene (Promega) oligolabelling kits as described in the accompanying protocols.
After labelling, unincorporated α-32P-dATP was separated from the labelled probe by
spermine precipitation. Precipitation of the labelled probe was achieved by adding
spermine to a final concentration of 7.5 µM and incubating on ice for 20 min before
centrifugation at 15,000 g for 15 min. The supernatant containing unincorporated
label was removed and the probe resuspended in 100 µl probe resuspension solution
(10 mM EDTA; 0.5% SDS). Prior to use, the labelled probe was denatured at 100°C
for 5 min and placed on ice to prevent re-annealing. Following the ice incubation,
probes were immediately added to the hybridisation solution.
4. 3. 7. Fusion-protein expression.
BL21 E. coli competent cells were transformed with either pGex-DMZ+1.8 or
pProEXb expression plasmids containing the selected coral cDNA. Once positive
transformants where identified by PCR, restriction enzyme digestion and sequencing,
the selected clones were used to initiate small-scale overnight bacterial cultures. The
following morning, 2.5 ml of the overnight culture were used to inoculate 250 ml of
fresh LB medium + Ampicillin (100µg/ml) and cultured until the optical density at
600nm reached 0.5-0.8. At this stage protein expression was induced by adding IPTG
to a final concentration of 1mM and incubated for 3 hours. Cultures were then
harvested by centrifugation at 40C at 4000 rpm/15min. Pellets were suspended in
10ml of ice cold PBS and lysed by sonication. Cell debris were pelleted at
10.000x/5min and supernatants subjected to protein purification.
4. 3. 8. Glutathione Sepharose affinity purification.

68
Equilibrated 50% Glutathione Sepharose 4B suspension beads (Pharmacia Biotech)
were added (0.25ml) to recovered supernatants and purification carried out according
to the manufacturer’s manual. The mixture was incubated at room temperature for
30min with gentle rotation after which mixtures were loaded into purification
columns and washed 3x with 5ml ice-cold PBS. Fusion-proteins were eluted by
addition of 0.5ml of 10mM reduced glutathione in 50mM Tris-HCL buffer (pH 8.0).
Eluted samples were subjected to standard protein electrophoresis.
4. 3. 9. Ni-NTA affinity purification.
250 µl of Ni-NTA resin were added to recovered supernatants and purification carried
out according to the manufacture’s manual (QIAGEN). Mixtures were incubated at
40C for 1 hour with gentle shaking and then loaded onto purification columns.
Samples were washed 3x with wash buffer and eluted by adding 0.5 ml of elution
buffer. Both wash and elution buffers were supplied by the manufacturer (QIAGEN).
Eluted samples were subjected to standard protein electrophoresis.
4. 3. 10. Polyacrylamide gel electrophoresis.
After protein purification, 20ul of sample were mixed with 20ul of loading buffer
(50mM Tris-HCL pH 6.8, 100mM dithiothreitol, 2% SDS, 0.1% bromophenol blue,
10% Glycerol) and fractioned in a 10%- 12% acrylamide (acrylamide:N,N’-
methylene-bis-acrylamide=29:1)/0.5x TBE (Tris-borate-EDTA) gel according to
Sambrook et al., (1989). Gels were stained with Coomassie brilliant blue and
photographed. Fusion-protein size was estimated by using standard commercial
protein markers.
4. 3. 11. Affinity chromatography.
GST-calmodulin fusion protein was expressed and purified in the presence of 1mM
CaCl2 and 5mM EGTA in both wash and elution buffers. Putative coral calmodulin-
interacting His fusion-proteins were expressed and purified as descried previously.
GST-AmCaM fusion protein-soluble sonicated samples were incubated with either

69
purified His-AmCaM-likeB or His-AmNC fusion proteins and Glutathione Sepharose
matrix in the presence of 5mM EGTA and 1mM CaCl2 for one hour at 4°C shaking.
After this time mixtures were loaded onto a protein purification column and the flow
through collected. Once the Glutathione Sepharose matrix was washed 3x with PBS
containing either 5mM EGTA or 1mM CaCl2 the GST-AmCaM fusion protein was
eluted with reduced glutathione buffer containing either 5mM EGTA or 1mM CaCl2.
Eluted and flow through samples were ran on a standard 10% SDS-PAGE to test for
co-localization of AmCaM and its putative His-Tagged target fusion protein.
In a similar way, sonicated soluble samples containing His-tagged putative targets
fusion-proteins were incubated with GST-AmCaM and Ni-NTA resin in the presence
of 5mM EGTA and 1mM CaCl2 for one hour at 4°C with shaking. After this time
mixtures were loaded onto a purification column and the flow through collected. Ni-
NTA resin matrix was washed 3x with PBS buffer containing either 5mM EGTA or
1mM CaCl2, and His-tagged fusion proteins were eluted with buffer containing 250
mM Imidazole and either 5mM EGTA or 1mM CaCl2. Once again eluted and flow
through samples were subjected to standard protein electrophoresis in order to test for
co-localization of calmodulin and its putative target proteins within the same fraction.
4. 3. 12. Western blotting.
Commercial rabbit polyclonal antibodies raised against amino acids 1-149
representing full-length human calmodulin I (CaMI) were purchased from Santa Cruz
biotechnology and tested against coral calmodulin. Purified GST-calmodulin, GST-
CaM-like fusion-proteins and coral CaM putative target proteins were run on two
10% protein gels with a similar loading pattern at 200-250 volts until the dye front
reached the bottom of the gel. One of the gels was stained with Coomassie brilliant
blue and photographed, while proteins resolved on the other were transferred from the
polyacrylamide gel to a nylon membrane by electrophoretic transfer (Sambrook et al.,
1989). After transfer the polyacrylamide gel was stained with Coomassie brilliant
blue in order to assess transfer efficiency.
70
Nylon membranes were washed 3X with tris-buffered saline (TBS) and sealed in a
bag with 0.5% non-fat powder milk as blocking agent in 10ml of TBS for one hour.
After that time 10µl of human CaMI antibody from a 200µg/ml stock solution were
added to the sealed bag and incubated at room temperature over night with gentle
shaking. The following morning membranes were washed 3x with TBS for 15min to
remove unbound antibody.
Remaining primary antibody was blotted using rabbit-anti-mouse horseradish
peroxidase (HRP) conjugated IgG. Unbound secondary antibody was removed by
washing 3X for 30 minutes with TBS. Antibodies were detected using a
chemiluminescent substrate that reacts with HRP to produce light in the visible
spectrum after incubation for 5 minutes. The released light was detected by exposure
of X-ray film, which was developed using traditional techniques.
4. 3. 13. Inmunoprecipitation.
Recovered supernatants from sonicated GST-AmCaM expression cultures were
incubated with both purified putative His-AmCaM-like and His-AmNC fusion-
proteins. Samples were incubated in the presence of 5mM EGTA and 1mM CaCl2 at
4°C for one hour with gentle shaking. After this time 50µl of human CaMI agarose
(25%) conjugated antibody from a 500µg/ml stock solution (Santa Cruz) were added
to the protein mixtures and incubated for one hour at 4°C shaking. Samples were
centrifuged and pellets washed 3x with 0.5ml of PBS containing either 1mMCaCl2 or
5mM EGTA. Both pellets and subsequent washed samples were subjected to standard
protein electrophoresis in order to identify co-precipitation of putative AmCaM target
His-fusion proteins and GST-AmCaM in the same fraction.
4. 4. RESULTS.
4. 4. 1. Identification of three Acropora millepora EF-hand proteins.
A predicted protein set derived from early stage A. millepora cDNA libraries was
scanned for the presence of EF hand domains (Pfam Id: PF00036), resulting in the
identification of three cDNAs encoding putative calcium sensor proteins. Two of

71
these clearly correspond widely distributed proteins - a classic calmodulin protein,
designated as AmCaM (Fig 1A) and a member of the neurocalcin (NC) family,
known here as AmNC. The third calcium sensor protein is a divergent member of the
calmodulin family, known here as AmCaM-like, and appears to be coral specific.
AmCaM, encodes an acidic protein of 149 amino acids with a predicted isoelectric
point (pI) of 4.15 and a molecular weight (MW) ∼17 kDa (Fig 1A). Similar to other
CaM molecules the AmCaM protein contains four putative active EF-hand motifs
(∼13 amino acids long) evenly distributed along the full length of the molecule. Two
EF-hand motifs are located in the N-terminal half of the protein and the remaining
two are located in the C-terminal half. The protein is rich in acidic amino acids, i.e.
Glutamate (14.8%) and Aspartate (10.7%)(Fig 1A).
In a similar way, the AmNC protein resembles other NC molecules (Fig 1C); it
encodes a protein of 176 amino acids with a MW of ∼20 kDa, has a predicted pI of
5.02 and is rich in acidic residues i.e. Glu (10.8%) and Asp (6.8%). In addition,
similar to other NC orthologs AmNC possess only one N-terminal EF-hand and two
C-terminal EF-hand motifs (Fig 1C). However, contrasting with its orthologs and
based on conserved domain sequence similarity (Prosite) the last EF-hand in the
AmNC protein is likely to be inactive. Despite this, AmNC showed high sequence
identity with both vertebrate (76%) and invertebrate NC sequences, including that
from the related anthozoarian Nematostella vectensis (82%). As a typical member of
the Neuronal Calcium Sensor (NCS) family of proteins (Haeseleer et al., 2002;
Burgoyne, 2007), AmNC possesses a N-terminal myristoylation site likely to regulate
the cellular localization of the protein in a calcium-dependent manner (Burgoyne and
Weiss, 2001; Burgoyne, 2007).
Although AmCaM-like encodes an acidic protein of 150 amino acids with a predicted
pI of 4.54 and a MW ∼17 kDa that resembles AmCaM, conserved domain sequence
similarity (Prosite) predicted that only the second EF-hand is likely to bind calcium.
This prediction is based on substitutions in the EF-hand loop specially the 9th residue.
These changes can affect calcium-binding affinity up to 1000 fold (Burgoyne and
Clague, 2003).
72
As indicated above, AmCaM-like has no clear orthologs in any organism, and at this
stage is coral specific (1B).
4. 4. 2. Calcium signalling during coral development: conserved and specific
calcium dependent pathways.
To investigate the temporal expression patterns of the A. millepora EF-hand proteins
reported here, virtual northern analysis was carried out (Fig 2). Results indicated that
the AmCaM and AmCaM-like transcripts were both ∼ 1500bp (Fig 2B and 2C),
whereas the AmNC transcript was larger (~2500 bp; Fig 2D). Each gene differed with
respect to temporal expression pattern. AmCaM transcripts appeared to be present at a
relatively uniform level across the range of developmental stages examined (Fig 2B);
the relatively high levels present at the prawn chip stage imply a significant maternal
contribution, as has been reported for various other animals (Floyd et al., 1986;
Hanson-Painton et al., 1992; Knott et al., 2006).
The AmCaM-like transcript was first detected at the gastrulation stage, and its
abundance appeared to increase throughout development, reaching its peak after
settlement (Fig 2C). AmNC expression was first detected at late gastrulation, but was
relatively constant from the pear stage through to post settlement (Fig 2D). These
results indicate stage specific calcium dependent signalling pathways during coral
development which function could vary from the canonical calcium homeostasis and
house keeping roles and extend to stage specific processes such as metamorphosis and
skeleton deposition.
4. 4. 3. Both AmCaM-like and AmNC interact with AmCaM in vitro.
Use of the Calmodulin Target Database (www.calcium.uhnres.utoronto.ca) allowed
the identification of potential calmodulin-binding sites in both the AmCaM-like and
AmNC proteins. In both cases 12 AA binding sites were predicted between EF-hand
motifs. While the predicted binding site in AmCaM-like is between EFIII and EFIV
(Fig 1B), that in AmNC is predicted between EFI and EFII (Fig 1C).

73
The presence of predicted calmodulin-biding sites, and the fact that their expression
temporally overlaps during the period of coral development spanning metamorphosis
and the initiation of skeleton deposition, suggests AmCaM-like and AmNC might be
subject to calmodulin-mediated regulation. To investigate their potential interactions
in vitro, recombinant Acropora proteins carrying either GST or His-tags at their N-
termini were produced by expression in E. coli BL21 cells and purified using the
appropriate affinity ligand (glutathione agarose or Ni-agarose). In each case, the
observed size of the fusion proteins on SDS-PAGE corresponded well with predicted
values (Fig 3A).
Affinity chromatography and immunoprecipitation techniques were used to evaluate
the ability of AmCaM to interact in vitro with AmCaM-like and AmNC in the
presence of free calcium (1mM CaCl2) or in its absence (5mM EGTA). Despite the
series of washes (3X) performed to the loaded Ni-NTA resin/fusion-proteins
complexes, when the immobilized His-tagged proteins were eluted in the presence of
calcium from the Ni-NTA resin, GST-AmCaM was found in the eluted fractions with
both His-tagged proteins (Figs 3B-3C). In the absence of calcium GST-AmCaM came
out with the flow through and only His-AmCaM-like was observed in the eluted
fraction (Fig 3B). On the other hand, in the absence of calcium His-AmNC failed to
bind to the Ni-NTA resin matrix (Fig 3C).
In contrast with the affinity chromatography experiments using immobilized His-
tagged proteins, when both His-AmCaM-like and His-AmNC fusion proteins were
incubated (separate) with the gluthathione sepharose matrix and GST-AmCaM (1
hour at 4°C shaking) prior loading the mixtures into a purification column; neither
His-AmCaM-like nor His-AmNC eluted together with GST-AmCaM from the
glutathione sepharose matrix in either treatment (data not shown). These results
suggest that the binding of the GST fraction (∼25 KDa) of the GST-AmCaM fusion
protein (∼42 KDa) to the glutathione sepharose matrix during the incubation period is
likely to destabilizes the GST-AmCaM / His-tagged Acropora protein complexes and
disables the interactions observed using the Ni-NTA resin matrix.

74
To confirm the results obtained by affinity chromatography both Acropora His-tagged
proteins were incubated (separate) with GST-AmCaM in the presence of an agarose-
conjugated human CaMI antibody (1 hour at 4°C shaking). Western blots demonstrate
that human anti-CaMI is specific for AmCaM as neither GST nor His-tagged
AmCaM-like/AmNC were detected in the blots (Fig 4A). Despite a series of washes
carried out on the agarose-conjugated complexes (3X), His-AmNC co-precipitated
with GST-AmCaM and the agarose-conjugated CaMI antibody in both treatments
(Fig 4B). Contrasting with these results, the CaMI antibody failed to bind to GST-
AmCaM in both treatments during the His-AmCaM-like inmunoprecipitation
experiments. Neither GST-CaM nor His-AmCaM-like fusion proteins were present on
the pellets with the agarose-conjugated antibody but were observed together in the
washes (Fig 4B-C).
4. 5. DISCUSSION
4. 5. 1. Acropora millepora’s EF-hand proteins.
The EF-hand family of proteins is the most studied group of intracellular molecules
that bind calcium either to translate its signal or to buffer its cytosolic concentration
(Carafoli, 2002; Bahler and Rhoads, 2002). EF-hand proteins bind calcium with high
affinity via a helix loop helix motif (the EF-hand), which can be present between 2 to
12 times depending on the protein and its function (Haeseleer et al., 2002; Carafoli,
2003).
While four EF-hand domains were identified in the AmCaM related molecules, only
three were present in AmNC (Fig 1). Despite amino acid (AA) substitutions within
the EF-hand domains, all EF-hand motifs present in the Acropora proteins were ∼13
AA long. This variation in EF-hand AA composition might be responsible for the
ability and affinity of the motifs to bind calcium. The residue located in the 9th
position of the EF-hand loop can affect calcium-binding affinity up to 1000 fold
(Burgoyne and Clague, 2003).
This is consistent with the “inactive” status designated to EF-hands I, III and IV in
AmCaM-like and EF-hand III in AmNC. Protein alignments of both AmCaM-like and
75
AmNC against AmCaM showed AA substitutions and a high degree of dissimilarity
between the “inactive” domains versus the putative “active” AmCaM EF-hand motifs.
On the other hand, “active” EF-hands in AmCaM-like and AmNC showed a high
degree of AA conservation with those of AmCaM (Fig 1D). Calcium-binding assays
are necessary in order to confirm the predictions from sequences analyses and to
characterize the calcium affinity of these A. millepora calcium sensors.
4. 5. 2. Acropora Calmodulins: AmCaM and AmCaM-like.
Primary structure analysis of both AmCaM and AmCaM-like revealed that similar to
most EF-hand proteins, two calcium-binding motifs are close together forming N-
terminal and C-terminal EF-hand pairs. This structural organization is believed to be
responsible for the ability of some calcium sensors to interact with target proteins as a
whole or as independent N-terminal or C-terminal subunits (Vetter and Leclerc,
2003). Furthermore, this structural organization might resemble the organization of an
ancestral CaM molecule.
According to Baba et al., (1984), modern CaM molecules evolved in the stem of
eukaryotes from an ancestral CaM gene that was conserved and evolved at a slower
rate than the subsequent gene duplication products due to its ability to regulate vital
and multiple signalling pathways. Molecules originating from duplication of this
ancestral gene evolved faster and thus established specific calcium mediated
functions, which allowed for the diversification of calcium binding proteins and
calcium dependent cellular activity among eukaryotes (Haeseleer et al., 2002).
The discovery of a novel cDNA encoding an EF-hand named CnidEF in the sea
anemone Anthopleura elegantissima (Hauck et al., 2007) and a large variety of CaM-
like coding genes in the vertebrate retina (Haeseleer et al., 2002) supports these ideas
and suggests common ancestry for the EF-hand family of proteins.
4. 5. 3. Acropora Neurocalcin: AmNC.
Neurocalcins belong to the Neuro Calcium Sensor (NCS) family of proteins, a group
of molecules that regulate a variety of calcium dependent pathways (Burgoyne, 2007).

76
The main difference between NCSs and CaMs is a central, flexible linker region
present only in CaM molecules that allows the independent interaction of both N and
C terminals with target proteins. This observation is consistent with the primary
structure of both AmCaM and AmNC. While AmCaM and AmCaM-like possess a
central linker region of ∼23-24 AAs, AmNC lacks this region (Fig 1). This
observation suggests that comparable to other members of the NCS family, AmNC
functions as a whole unit (Haeseleer et al., 2002).
Similar to its orthologs, a putative myristoylation site that displayed the canonical
MGK motif was identified at the N-terminal end of the AmNC protein. Myristoyl tails
are acyl chains of 14 carbons commonly present in NCS proteins. This fatty acid post-
translational modification is mainly used as a calcium-dependent membrane anchor.
(O’callaghan and Burgoyne, 2003). Vertebrate Neurocalcins belong to the class NCS-
B, a group of molecules that expose their myristoyl group upon calcium binding. This
topological change known as the “calcium myristoyl switch” (MSM) (Burgoyne and
Weiss, 2001; Burgoyne, 2007) directs them to subcellular compartments where they
interact reversibly with their targets in a calcium-dependent manner.
In most molecules displaying the MSM, the first N-terminal EF-hand is inactive and
functions as a hydrophobic pocket that interacts with the myristoyl group in the
absence of calcium (O’callaghan and Burgoyne, 2003; Burgoyne et al., 2004). The
finding of only one “active” EF-hand motif in the N-terminus of the AmNC protein,
together with the observation of a N-terminal region with high variation in AA
composition aligning with the first EF-hand motif in the AmCaMs (Fig 1D), suggest
that similar to its vertebrates counterparts, AmNC is likely to experience the MSM.
Results from the Nickel affinity chromatography experiments are consistent with the
theory presented above. In the absence of calcium, His-AmNC bound weakly to the
Nickel affinity column (Fig 3C) thus removed with the series of washes prior elution.
This suggests that under these conditions topological changes that resemble the MSM
of NCS-B type proteins (Burgoyne et al., 2004) might be responsible for the
sequestration of the N-terminal His-tag and thus weak binding to the column.
4. 5. 4. AmCaM mediated signalling transduction mechanisms: target specificity
and availability.

77
CaM is s a highly soluble acidic intracellular calcium-binding molecule conserved in
all eukaryotes (Benain and Villalobo, 2002). Due to its role as a calcium sensor that
regulates essential cellular processes such as cell cycle and calcium homeostasis its
sequence is more that 90% identical (Cyert, 2001; Carafoli, 2005) among animals,
plants, fungi and protozoans (Vetter and Leclerc, 2003; Haeseleer et al., 2002).
In addition, CaM is considered the most versatile EF-hand calcium sensor as it
regulates cytoskeleton activity, cellular metabolism, cell differentiation, proliferation,
apoptosis, and metamorphosis (Benain and Villalobo, 2002; Klee and Means, 2002);
and a diversity of calcium dependent secretory pathways (Dolman and Tepikin,
2006). These cellular processes are likely to play important roles during coral
metamorphosis as well as during transport and secretion of organic matrix precursors
necessary for skeleton deposition (Puverel et al., 2005; Allemand et al., 1998; Clode
and Marshal, 2004).
CaM is able to interact with target molecules in both the presence and absence of
calcium ions, which allows the regulation of different cellular processes in a calcium
dependent and independent manner (Burgoyne and Clague, 2003). The calcium free
state of CaM is known as Apo-CaM (Cyert, 2001; Haeseleer et al., 2002). Apo-CaM
interactions occur at low or basal cytosolic calcium levels and in some cases Apo-
CaM is pre-bound to targets molecules modifying them as soon as calcium
concentration rises (Bahler and Rhoads, 2001; Burgoyne and Clague, 2003).
However, most of CaM interactions occur when intracellular calcium concentration
reaches high µM levels (Burgoyne and Clague, 2003).
Calcium binding to CaM generates a reorganization of the helix loop helix EF-hand
motifs and causes a topological change that will expose previously hidden
hydrophobic residues (Ishida et al., 2002). These hydrophobic amino acids in
particular Methionine (Met) residues are responsible for the interaction with target
molecules and recognition of CaM binding sites (Ishida et al., 2002; Vetter and
Leclerc, 2003). CaM regulated molecules need CaM to alter their structure and
enhance/inhibit their activity in a calcium dependent manner (Vetter and Leclerc,
2003).

78
Despite the fact that CaM’s sequence is highly conserved and identical among distant
phylogenetic groups, CaM-binding regions in target proteins are very diverse. This
indicates independent target evolution and diversification of calcium dependent CaM-
mediated signalling pathways (Bahler and Rhoads, 2001).
4. 5. 5. AmCaM mediated signal transduction during settlement and
metamorphosis.
The AmCaM temporal expression profile suggests stage specific AmCaM mediated
signalling pathways, which are likely to regulate stage specific developmental
processes. This could be achieved by changes on the multiple variables that control
the CaM mediated translation of the calcium signal such as cytosolic calcium
concentration, type of calcium oscillations, availability of target molecules as well as
CaM phosphorylation profiles. It has been shown that CaM is phosphorylated in vivo
and in vitro by multiple kinases. This has physiological important consequences as
diverse phosphorylated CaM species have different functions (Benain and Villalobo,
2002).
Since CaM is a key molecule able to control cell differentiation, apoptosis and a
diversity of calcium dependent secretory pathways (Klee and Means, 2002; Dolman
and Tepikin, 2006), we postulate that CaM might regulate 1) morphogenesis during
Acropora metamorphosis (Clode and Marshall, 2004), 2) transport of organic matrix
precursors and 3) transport of calcium ions during late stages of larval development
and early calcification. There is evidence demonstrating that coral CaM interacts with
a calcium ATPase and that this interaction might be relevant during skeleton
deposition (Zoccola el al., 2004). The identification of CaM specific targets during
metamorphosis and early stages of mineralization would contribute to the
identification of the CaM-mediated cellular pathways underlying morphogenesis and
skeletogenesis in scleractinian corals.
4. 5. 6. In vitro AmCaM interactions: AmNC and AmCaM-like putative AmCaM
targets during settlement and metamorphosis.

79
Protein-protein interaction experiments demonstrated that at least under in vitro
conditions GST-AmCaM is able to bind both His-AmNC in a calcium dependent and
independent manner (Figs 3C-4B) and His-AmCaM-like in a calcium dependent
manner (Fig 3B). These observations together with the temporal expression profile of
the three Acropora EF-hand proteins postulate AmNC and AmCaM-like as putative
AmCaM targets during settlement and metamorphosis.
The lack of AmCaM-like orthologs among the available cnidarian or vertebrate
databases suggests that AmCaM-like might be a coral specific gene and that its
function according with its temporal expression profile might be related to coral
specific processes such as metamorphosis and skeleton deposition. These
observations are consistent with the idea that diversification of CaM-like molecules
from a CaM ancestral gene increased the number of calcium dependent cellular
processes establishing specific calcium mediated functions and pathways (Baba et al.,
1984; Haeseleer et al., 2002).
Although functional analogy with vertebrate NC orthologs indicates a role for AmNC
in vesicle transport, as they are known to interact with cytoskeleton proteins as well as
with the Clathrin heavy chain, which is a major constituent of some vesicles coats
(Ivings et al., 2002; Haynes et al., 2006); there is evidence demonstrating that
Neurocalcin interacts with mRNA and the cytoskeleton and is able to control
intracellular levels of cGMP in a calcium dependent manner (Burgoyne and Weiss,
2001). Functional studies are necessary to understand whether these AmCaM
interactions occurs in vivo and represent specific AmCaM mediated transduction
mechanisms regulating key developmental processes such as metamorphosis and
larval skeleton deposition.
The fact that during immunoprecipitation neither AmCaM nor AmCaM-like co-
precipitated with the agarose conjugated CaM antibody but were found together in the
second wash (Fig 4C); suggest that the nature of the interaction between GST-
AmCaM and His-AmCam-like hide AmCaM’s epitopes necessary for the recognition
and subsequent binding by the human CaM antibody. This result is consistent with the
CaM “wrap-around” model in which cooperative folding between the N and C-

80
terminal domains are necessary for CaM interaction with target molecules (Haeseleer
et al., 2002; Carafoli, 2004).
The fact that the putative CaM-BS in both AmNC and AmCaM-like is located in
between putative calcium binding sites in the target proteins (Fig 1B-C) suggests a
cooperative coordination between AmCaM and EF-hands motifs in the putative target
proteins. There is evidence demonstrating that in some cases CaM coordination is
necessary to bind calcium or to induce exposure of hydrophobic residues in areas of
inactivated calcium binding EF-hands (Ishida et al., 2002; Haeseleer et al., 2002).

81
4. 6. CHAPTER FIGURES.
Figure 4. 1. AmEF-hand proteins: Primary structure. Several cDNA’s encoding EF-hand proteins were identified in the A. millepora EST data set. Two proteins belonging to the CaM family included an Acropora CaM ortholog (A) and one CaM-like protein likely to be coral specific were identified (B). An Acropora Neurocalcin ortholog that belongs to the NCS family of proteins was also found, this molecule contained a putative N-terminal myristoylation sites (C). All proteins contain EF-hand motifs. Active EF-hands (red boxes/lines). Inactive EF-hands (green boxes). Putative CaM-binding site (yellow boxes). Putative myristoylation site (black box).Numbers represent AA length. 9th position within EF-hand domains (Black arrow).

82
Figure 4. 2. Temporal expression of EF-hand proteins. Following fertilization Acropora embryos develop into a modified blastula know as prawnchip (PC). After gastrulation (S) the two germ layers present in cnidarian (i.e endoderm and mesoderm) and the oral pore (O) are formed. A progressive oral-aboral axis elongation follows until embryos acquire a pear like shape (Per). By the time coral larva acquire the typical planula (Pla) morphology it is ready to settle and metamorphose into a calcifying, sessile polyp (Post) upon finding of exogenous settlement clues (A). AmCaM is expressed consistently during development, metamorphosis and post settlement stages (PC-Post)(B). AmCaM-like is low expressed during axis elongation stages (Per,-Pla) reaching its peak after settlement (Post)(C). AmNC is expressed during all axis elongation and post-settlement stages (Per to Post)(D). Asterisk (DNA markers).

83
Figure 4. 3. AmCaM interacts in vitro with AmCaM-like and AmCaM proteins. To test for interactions with GST-AmCaM, both AmCaM-like and AmNC were expressed as His-tagged fusion proteins (A). GST-AmCaM (black arrow) eluted together with His-AmCaM-like (blue arrow) (B) and and HisAmNC (red arrow) (C) only in the presence of calcium during affinity chromatography experiments. Flow through (F), Elution 1 (E1), Elution 2 (E2). Protein markers (Asterisks).

84
Figure 4. 4. AmCaM co-precipitates with AmCaM-like and AmCaM. Anti human polyclonal CaMI (FL-149) antibody is specific for AmCaM (black arrow) as neither GST-AmCaM-like (double blue arrow) nor His-AmCaM-like (red arrow)/His- AmNC (blue arrow) proteins were detected by western blots (A). His-AmNC (red arrow) co-precipitated with GST-AmCaM in both the presence and the absence of calcium (B). Neither GST-AmCaM nor His-CaM-likeB co-precipitated with the Anti human CaM antibody in the prescence or absence of calcium. Both proteins were present together in the second wash (C). First wash (1). Second wash (2). Protein markers (Asterisks).
85
4. 7. REFERENCES. Allemand, D., Tambutte, E. E., Girard, J. P. and Jaubert, J. (1998). Organic matrix synthesis in the scleractinian coral stylophora pistillata: role in biomineralization and potential target of the organotin tributyltin. J Exp Biol 201 (Pt 13), 2001-9. Baba, M. L., Goodman, M., Berger-Cohn, J., Demaille, J. G. and Matsuda, G. (1984). The early adaptive evolution of calmodulin. Mol Biol Evol 1, 442-55. Bähler, M. a. R., A. (2002). Calmodulin signalling via the IQ motif. FEBS Letters 513, 107-113. Barclay, J. W., Morgan, A. and Burgoyne, R. D. (2005). Calcium-dependent regulation of exocytosis. Cell Calcium 38, 343-53. Benaim, G. and Villalobo, A. (2002). Phosphorylation of calmodulin. Functional implications. Eur J Biochem 269, 3619-31. Burgoyne, R.D. (2007). Neuronal calcium sensor proteins: generating diversity in neuronal Ca2+ signalling. Nat Rev Neurosci. 8:182-93. Burgoyne, R. D. and Clague, M. J. (2003). Calcium and calmodulin in membrane fusion. Biochim Biophys Acta 1641, 137-43. Burgoyne, R. D. and Weiss, J. L. (2001). The neuronal calcium sensor family of Ca2+-binding proteins. Biochem J 353, 1-12. Burgoyne, R. D., O'Callaghan, D. W., Hasdemir, B., Haynes, L. P. and Tepikin, A. V. (2004). Neuronal Ca2+-sensor proteins: multitalented regulators of neuronal function. Trends Neurosci 27, 203-9. Carafoli, E. (2002). Calcium signaling: a tale for all seasons. Proc Natl Acad Sci U S A 99, 1115-22. Carafoli, E. (2003). Historical review: mitochondria and calcium: ups and downs of an unusual relationship. Trends Biochem Sci 28, 175-81. Carafoli, E. (2004). Calcium-mediated cellular signals: a story of failures. Trends Biochem Sci 29, 371-9. Carafoli, E. (2005). Calcium--a universal carrier of biological signals. Delivered on 3 July 2003 at the Special FEBS Meeting in Brussels. Febs J 272, 1073-89. Carafoli, E., Genazzani, A. and Guerini, D. (1999). Calcium controls the transcription of its own transporters and channels in developing neurons. Biochem Biophys Res Commun 266, 624-32. Clode, P. L. and Marshall, A. T. (2004). Calcium localisation by X-ray microanalysis and fluorescence microscopy in larvae of zooxanthellate and azooxanthellate corals. Tissue Cell 36, 379-90. Dolman, N. J. and Tepikin, A. V. (2006). Calcium gradients and the Golgi. Cell Calcium 40, 505-12. Floyd EE, Gong ZY, Brandhorst BP, Klein WH (1986) Calmodulin gene expression
during sea urchin development: persistence of a prevalent maternal protein. Dev Biol 113:501-511
Gorlach, A., Klappa, P. and Kietzmann, T. (2006). The endoplasmic reticulum: folding, calcium homeostasis, signaling, and redox control. Antioxid Redox Signal 8, 1391-418. Haeseleer, F., Jang, G. F., Imanishi, Y., Driessen, C. A., Matsumura, M., Nelson, P. S. and Palczewski, K. (2002). Dual-substrate specificity short chain retinol dehydrogenases from the vertebrate retina. J Biol Chem 277, 45537-46.

86
Hanson-Painton O, Randolph V, Saugstad JA, Oh SK, Tobin SL (1992) Developmental expression of the Drosophila melanogaster calmodulin gene. Int J Dev Biol 36:343-351
Haynes, L. P., Fitzgerald, D. J., Wareing, B., O'Callaghan, D. W., Morgan, A. and Burgoyne, R. D. (2006). Analysis of the interacting partners of the neuronal calcium-binding proteins L-CaBP1, hippocalcin, NCS-1 and neurocalcin delta. Proteomics 6, 1822-32. Holland, P. W. H. (1999). The future of evolutionary developmental biology. Nature 402, C41-C44. Hauck, L.L., Phillips, W. S. and Weis V. M. (2007). Characterization of a novel Ef- hand homologe, CnidEf, in the sea anemone Anthopleura elegantisima. Comp Biochemestry and Physiology. Part B:551-559. Ishida, H., Nakashima, K., Kumaki, Y., Nakata, M., Hikichi, K. and Yazawa, M. (2002). The solution structure of apocalmodulin from Saccharomyces cerevisiae implies a mechanism for its unique Ca2+ binding property. Biochemistry 41, 15536-42. Ivings, L., Pennington, S. R., Jenkins, R., Weiss, J. L. and Burgoyne, R. D. (2002). Identification of Ca2+-dependent binding partners for the neuronal calcium sensor protein neurocalcin delta: interaction with actin, clathrin and tubulin. Biochem J 363, 599-608. Klee, C. B. and Means, A. R. (2002). Keeping up with calcium: conference on calcium-binding proteins and calcium function in health and disease. EMBO Rep 3, 823-7. Knott JG, Gardner AJ, Madgwick S, Jones KT, Williams CJ, Schultz RM (2006)
Calmodulin-dependent protein kinase II triggers mouse egg activation and embryo development in the absence of Ca2+ oscillations. Dev Biol 296:388-395
Nakazawa, T., Nakajima, A., Seki, N., Okawa, A., Kato, M., Moriya, H., Amizuka, N., Einhorn, T. A. and Yamazaki, M. (2004). Gene expression of periostin in the early stage of fracture healing detected by cDNA microarray analysis. J Orthop Res 22, 520-5. Ng, K.W., Speicher, T., Dombrowski, C., Helledie, T., Haupt, L.M., Nurcombe, V., and Cool, S.M. (2007). Osteogenic Differentiation of Murine Embryonic Stem Cells Is Mediated by Fibroblast Growth Factor Receptors. Stem Cells and Development. 16:305-317. O'Callaghan, D. W. and Burgoyne, R. D. (2003). Role of myristoylation in the intracellular targeting of neuronal calcium sensor (NCS) proteins. Biochem Soc Trans 31, 963-5. Parekh, A. B. (2006). Cell biology: cracking the calcium entry code. Nature 441, 163- 5. Puverel, S., Eric, Tambutte., Zoccola, Didier., Domart-Coulon, Isabelle., Bouchot, Andre., Lotto, Severine., Allemand, Denis and Tambutte Sylvie. (2005). Antibodies against the organic matrix in scleractinians: a new tool to study coral biomineralization. Coral Reefs 24, 149-156. Sambrook, J. F., E.F. and Maniatis, T. (1989). Molecular Cloning: A laboratory manual. Cold Spring Harbour, New York.: Cold Spring Harbour Press.
87
Takasaki, A., Hayashi, N., Matsubara, M., Yamauchi, E. and Taniguchi, H. (1999). Identification of the calmodulin-binding domain of neuron-specific protein kinase C substrate protein CAP-22/NAP-22. Direct involvement of protein myristoylation in calmodulin-target protein interaction. J Biol Chem 274, 11848-53. Tambutte, E. E. Allemand, D., Mueller, E. and Jaubert, J. (1996). A compartmental approach to the mechanism of calcification in hermatypic corals. J Exp Biol 199, 1029-41. Vandermeulen, J. H. (1974). Studies on Reefs Corals.II. Fine Structure of PlanktonicPlanula Larva of Pocillopora damicornis, with Emphasis on the Aboral Epidermis. Marine Biology 27, 239-249. Vetter, S. W. and Leclerc, E. (2003). Novel aspects of calmodulin target recognition and activation. Eur J Biochem 270, 404-14.
88
CHAPTER 5. cDNA microarray analysis of metamorphosis and the early stages
of calcification in the scleractinian coral Acropora millepora.
5.1. ABSTRACT.
To elucidate the molecular mechanisms underlying metamorphosis and the early
stages of calcification in the complex scleractinian coral Acropora millepora, gene
expression cDNA microarray analysis was performed between aposymbiotic planulae,
flat and primary polyps as well as symbiotic adult tips. The most highly up-regulated
genes in planulae are involved in calcium signalling, lipid metabolism and
developmentally regulated signalling pathways. Transcripts up-regulated in post-
settlement juvenile stages are predominantly implicated in tissue morphogenesis, cell
division and responses to oxidative stress, whereas transcripts that showed the highest
expression in adult polyps are likely to have roles in responses to abiotic stimuli,
asexual reproduction and growth. Transcripts up-regulated in all settled stages
included carbonic anhydrases and molecules involved in O-glycosylation and organic
matrix synthesis, thus presumably reflecting roles in skeleton deposition.
Additionally, our results suggest that an overlap of intracellular secondary messengers
that mediate metamorphosis in Acropora is likely to occur between planulae and
settled juvenile polyps. While calcium and lipid signalling might play important roles
in the regulation of cellular activity at the planula stage, ROS signalling seems to be a
key regulator during morphogenesis of adult structures. Finally, our results are
consistent with the idea that differential expression of organic matrix components is
responsible for the two types of calcification observed in corals 1) basal plate
formation and 2) the fiber-like calcification characteristic of adult polyps.
5. 2. INTRODUCTION. As in the case of many marine invertebrates, the larvae of scleractinian corals undergo
metamorphosis - a dramatic morphological transformation during the settlement
process. At this time, planula larvae transform from non-calcifying, demersal, motile
organisms into sessile, calcifying, benthic juvenile polyps. Metamorphic
morphogenesis in scleractinian corals is a distinctive process that differs from the
gradual metamorphosis experienced by the closely related anthozoan N. vectensis

89
(Hand and Uhlinger, 1992). A unique change during metamorphosis of coral planulae
involves the reorganization of the aboral ectoderm from a columnar epithelium into a
squamous calcifying tissue known as the calicoblastic ectoderm (Vandermeulen,
1974; Clode and Marshall, 2004). This newly formed cell population secretes an
organic matrix able to induce and control skeleton deposition (Puverel et al., 2005)
allowing the formation of coral reefs.
Scleractinian corals play an important ecological role, as their skeletons constitute the
framework for coral reefs, one of the most productive ecosystems on earth
(Gunderson, 2007). Despite this, very little is known regarding the molecular
mechanisms and gene networks underlying metamorphic morphogenesis and skeleton
deposition in reef-building corals. Gene expression microarray analyses represent a
powerful tool to characterize such gene networks due to their ability to examine
transcription levels for a high number of genes simultaneously. This approach has
been used to characterize gene expression profiles during key transitions in the life
cycle of a diverse range of organisms (Hill et al. 2000; Arbeitman et al. 2002;
Baldessari et al. 2005; Wei et al. 2006; Azumi et al. 2007).
Regarding marine invertebrates, Williams et al. (2009) studied the gene expression
changes underlying settlement and metamorphosis in the abalone Haliotis asinine
using a cDNA platform. Although several groups have described metamorphosis in
scyphozoans (Yuan et al. 2008; Nakanishi et al. 2008), hydroids (Katsukura et al.
2003) and non-calcifying anthozoans (Hand and Uhlinger, 1992), there have been few
microarray analyses of the process. Recently, Grasso et al. (2008) compared gene
expression profiles between four key stages during the development of Acropora
millepora and Reyes-Bermudez et al., (in press) compared changes in the
transcriptome between planulae, primary and adult polyps during settlement and
metamorphosis in the Caribbean robust coral Montastraea faveolata.
In both cases the cDNA platforms represented only a fraction of the transcriptome -
5081 and 1310 unigenes for Acropora and Montastraea respectively- thus limiting the
scope of the approach. In this study we compare changes in the transcriptome
between Acropora millepora planulae, flat, primary and adult polyps using a new

90
generation cDNA array representing 8606 unigenes. Furthermore, the fact that two
consecutive juvenile stages- flat and primary polyps- were selected for this study will
increase the resolution of the analysis focusing of the gene networks underling
settlement and memamorphosis as well as complementing previous analyses.
Microarray analysis during late stages of coral development will allow the
identification of convergent and/or ancestral molecular pathways regulating
morphogenetic changes not only among reef-building corals but also across the
Cnidaria. Furthermore, studies concerning the molecular basis of coral calcification
are necessary as they are likely to provide information valuable for the management
and conservation of coral reefs.
5. 3. MATERIAL AND METHODS.
5. 3. 1. Collection of samples
Acropora millepora mature colonies were collected during the 2005-spawning event
at Magnetic Island (Lat: 19° 7' 60 S, Long: 146° 49' 60 E, Queensland, Australia).
Following spawning, gametes from several colonies were mixed to facilitate
fertilisation, and the resulting embryos maintained in containers containing fresh
seawater for 2h. Embryos were maintained in 1µm filtered seawater, with water
changes several times per day, until they reached the planula stage. At this point, a
subset of planula larvae was collected and preserved in liquid nitrogen. Remaining
larvae were transferred to 190mm petri dishes and allowed to metamorphose and
settle.
After 2 days, a subset of settled larvae that had totally flattened down along the oral-
aboral axis were collected and preserved in liquid nitrogen. The remaining settled
larvae were kept and allowed to further develop until they reached the characteristic
primary polyp morphology; at this stage samples were collected and transferred to
liquid nitrogen. Adult tips were obtained by braking off small fragments from the
collected colonies selected for spawning. Fragments were frozen in liquid nitrogen.
All samples were kept in liquid nitrogen prior transport to ANU for posterior RNA
extraction and microarray hybridizations.
91
5. 3. 2. RNA extraction and amplification
Total RNA from frozen coral tissues was isolated using Qiazol lysis reagent (Qiagen)
following product specifications. Both adult and larval tissues were homogenized
using a pre-chilled mortar and pestle. Frozen coral powder was transferred directly to
Qiazol. Two chloroform extractions were performed, followed by isopropanol
precipitation and two washes in 80% ethanol. RNA pellets were re-dissolved in
nuclease-free water. Due to the insufficiency of planula and polyp RNA, all RNA
samples were amplified using the MessageAmp II aRNA kit (Ambion) with 1ug of
total RNA as input.
5. 3. 4. Microarray hybridisation and array description.
The array used in this experiment consisted of 16.000 spots representing 8606
unigenes. Array description and specification have been previously described in Bay
et al., (2009). All of the material used for making the libraries came from Nelly Bay,
Magnetic Island, Queensland, Australia (19°08’S 146°50’E). Generation and spotting
of cDNAs as well as EST analyses are previously described in (Grasso et al., 2008).
Prior to hybridization, microarrays were post-processed by: 1) UV crosslinking at 60
mJ; 2) a “shampoo” treatment (3x SSC, 0.2% SDS at 65oC); 3) blocking with 5.5g
succinic anhydride dissolved in 335mL 1-methyl-2-pyrrilidinone and 15mL sodium
borate; and 4) drying via centrifugation. Five micrograms of aRNA per sample were
primed with 5ug/uL random nonamer for 10 min at 70oC. Reverse transcription (RT)
lasted for 2 hr at 50oC using a master mix containing a 4:1 ratio of aminoallyl-dUTP
to TTP. Following RT, single-stranded RNA was hydrolyzed by incubating the RT
reactions in 10 uL 0.5 M EDTA and 10 uL 1 M NaOH for 15 min at 65oC. After
hydrolysis, RT reactions were cleaned using MinElute Reaction Purification columns
(Qiagen). Cy3 and Cy5 dyes (GE Healthcare) were dissolved in 12 uL DMSO, and
the coupling reactions lasted for 2 hr at room temperature in the dark. Dye-coupled
cDNAs were cleaned (MinElute columns), and appropriate Cy3 and Cy5 labeled
cDNAs were mixed together in a hybridization buffer containing 0.25 % SDS, 25 mM
HEPES, and 3x SSC. The hybridization mixtures were boiled for 2 min at 99oC then

92
allowed to cool at room temperature for 5 min. The cooled hybridization mixtures
were pipetted to the printed arrays and left overnight at 63 oC. Microarrays were
washed twice in 0.6x SSC and 0.01 % SDS followed by a rinse in 0.06x SSC and
dried via centrifugation. Slides were immediately scanned using a GenePix 4200A
scanner.
5. 3. 5. Experimental design and microarray data analysis
To understand the molecular mechanisms underlying skeleton deposition in A.
millepora gene expression was compared between 1) aposymbiotic non-calcifying
planulae, 2) aposymbiotic calcifying flat polyp, 3) aposymbiotic calcifying primary
polyp and 4) symbiotic adult tips. The experiment followed a loop design in which all
life stages were directly compared against each other. Hybridizations were performed
in duplicate (n=2 for each developmental stage and included dye swapping between
technical replicates (Fig 5.1).
While pre-processing of microarray intensity data was performed using Spot
http://www.csiro.au/products/ps1ry.html all further analyses were carried out using
the limma package (Smyth, 2005) for the R system http://www.r-project.org/. Print-
tip loess normalisation (Smyth and Speed, 2003) was performed on each slide.
Quantile normalisation was applied to mean log-intensities in order to make the
distributions essentially the same across arrays. The methodology used for statistical
analysis is described in Smyth (2004). The prior probability of differential expression,
for each pair of comparisons between stages, was taken as 0.1. The Benjamini and
Hochberg method (Benjamini and Hochberg, 1991) was used to adjust the sequence-
wise p-values, so that a choice of sequences for which the adjusted p-value is at most
0.01 identifies a set of differentially expressed genes in which 1% may be falsely
identified as differentially expressed.
To visualize the temporal expression of DEGs, K-means clustering was performed
using the TIGR TMEV 4.0 package within the TM4 software suite. To assess over-
representation of Gene Ontology (GO) terms in the lists of significant genes, default
values in GOEAST (Zheng and Wang 2008) were used and GO categories selected
based on p-values (p = <0.05). GOEAST identifies significantly enriched GO terms

93
among a list of genes by calculating the hypergeometric probability that a particular
GO term was represented in a given set of DEGs by more microarray features than
would be expected by chance. We viewed GOEAST results with caution and only
focused on over-represented categories that contained two or more genes.
5. 4. RESULTS
To better understand the molecular mechanisms regulating the early stages of
calcification in the scleractinian coral Acropora millepora, cDNA microarray analysis
was used to compare changes in the transcriptome between planula (Pla), flat polyp
(F), primary polyp (Po) and symbiotic adult tips (T) (Fig 5.1). From the 8606
unigenes printed on the array, a total of 1189 were identified as differentially
expressed genes (DEGs) between any two stages (p = <0.01). While 52% of DEGs
had annotated hits according to BLASTx (E-value ≤ 1x 10⁻⁵) the remaining 48% did
not have significant database matches.
DEGs were clustered in four groups that represented major expression profiles. DEGs
were further grouped into cluster-specific expression patterns (EPs) within each
cluster depending on the common stages in which they were up or down-regulated.
Although some EPs from different clusters displayed similar overall expression
patterns (i.e. up or downregulated in similar stages) the expression levels (values) for
DEGs within those groups differed drastically from one another thus establishing
independent and distinct gene expression profiles. While table 5.1 summarized data
for all clusters and their expression patterns, table 5.2 summarized the functional
annotations, clone ID and expression data for all DEGs mentioned below. Table S1
contains expression values for all DEGs and table S2 summarized the functional
annotations (GO and KEGG pathways) for all DEGs with significant BLASTx hits.
5. 4. 1. Cluster I. Genes down-regulated after settlement: highest expression in planulae.
Cluster I (CI) consists of 547 unigenes (46% of DEGs) from which 284 were
annotated and represented 45% of all annotated sequences. Absolute fold changes

94
(FCs) in CI were as high as ∼10-fold. CI DEGs were distributed in 8 distinct EPs
named here CI-EP1 to CI-EP8 (Fig 5.2).
CI-EP1 contains 158 unigenes that were down-regulated up to ∼10-fold in F, Po and T
in comparison to Pla. CI-EP-2 consists of 16 unigenes that were down-regulated up
to ∼ 4-fold in F and T but remained stable in Po when compare to Pla. CI-EP3 has 137
DEGs down-regulated up to ∼ 4-fold in T but stable in F and Po relative to Pla. CI-
EP4 contains only 2 genes that were up-regulated up to ∼ 2-fold in F but were down-
regulated up to ∼ 3-fold in Po and T when compared to Pla. CI-EP5 groups 87
unigenes that were down-regulated up to ∼ 4-fold in Po and T but remained stable in
F when compared to Pla. CI-EP6 contains 41 genes that were down-regulated up to ∼
4-fold in F and Po but were stable in T relative to Pla. CI-EP7 has 77 genes that were
only down-regulated up to ∼ 3-fold in Po but were stable in F and T when compare to
Pla. Finally, CI-EP8 contains 29 genes that were down-regulated up to ∼ 3-fold in F
but remained stable in Po and T in relation to Pla (Fig 5.2).
Statistically over-represented GO categories in CI include: bioluminescence
(GO:0008218) in CI-EP1, positive regulation of apoptosis (GO:0043065) in CI-EP15-
7, larval development (GO:0002164) in CI-EP6, identical protein binding
(GO:0042802) in CI-EP7, regulation of transport (GO:0051049) in CI-EP8 and
phospholipid biosynthetic process (GO:0008654) in CI-EP6. This last category is
consistent with the down-regulation after settlement of 16 DEGs that mapped to
KEGG pathways involved in lipid metabolism (Table 5.2). Although lipid
metabolisms seems to be the main energy source at the planula stage, dowregulation
after settlement of a number of genes involved in carbohydrate metabolisms (PATH:
ko00051, PATH: ko00010, PATH: ko00030) indicates that lipids are not the only
source of energy for planula larvae.
Consistently with the over-representation of GO category GO:0051049 (regulation of
transport), the identification of four genes involved in the regulation of the actin
cytoskeleton (PATH: ko04810) that were down-regulated after settlement suggests
active intracellular transport in planulae tissues. This is consistent with down-
regulation after settlement of coral orthologs of calumenin (C_mge-C006-A6-
95
pre40_T3 and C_mge-A044-E12-post92) and calreticulin (C_MGE-A022-E1-post4-
T3) known to regulate transport from the ER and signal transduction in vertebrates
(Honore and Vorum, 2000; Jung et al., 2006; Vallar et al., 1999; Tran et al., 2002).
Down-regulation after settlement of three DEGs encoding proteins involved in the
neuroactive ligand-receptor interaction pathway (PATH: ko04080) suggests that these
molecules might be involved in the transduction of external stimuli into cellular
activity during settlement and metamorphosis.
In a similar way, down-regulation after settlement of components of the TGF-beta
(PATH: ko04350), Notch (PATH: ko04330) and MAPK (PATH: ko04010), signaling
pathways (Table 5.2), which are conserved mechanisms able to regulate apoptosis,
cell differentiation, proliferation and migrations across metazoa (Gerhart, 1999)
suggests that settlement and metamorphosis in A. millepora is regulated by conserved
signal transduction mechanisms. Furthermore, down-regulation in postsettlement
stages of a number of DEGs encoding calcium-binding proteins from the EF-hand
family indicates that calcium signalling plays and important role during
metamorphosis and settlement in A. millepora. Finally, down-regulation after
settlement of an Aristaless (S_mge-C015-G2-pre14_T3) and a number of bone
morphogenetic protein (S_MGE-A049-C6-post42-T3, C_mge-B022-H10-prawn79
and S_MGE-B025-B6-prawn41_T3) orthologs suggests that these molecules might
establish morphogenetic borders in Acropora planulae as they do during development
in other better characterized biological systems.
5. 4. 2. Cluster II. Genes up-regulated after settlement: highest expression in calcifying stages.
Cluster II (CII) contains 84 unigenes (7% of DEGs) from which 38 were annotated
and represented 6% of all annotated sequences. Absolute FCs in CII were as high as
∼14-fold. CII DEGs were distributed in 4 distinct expression patterns termed CII-EP1
to CII-EP4 (Fig 5.3).
CII-EP1 contains only 1 unigene (S_MGE-A023-D8) encoding a major yolk protein
ortholog that was stable in F and up-regulated up to ∼9-fold in Po and T in
comparison to Pla. CII-EP-2 groups 52 unigenes that were up-regulated up to ∼ 14-

96
fold in all three stages relative to Pla. CII-EP3 has 2 non-annotated DEGs that were
up-regulated up to ∼ 7-fold in F and T but up-regulated up to ∼ 2 fold in T when
compare to Pla. CII-EP4 contains 29 DEGs that were up-regulated up to ∼ 12-fold in
F and Po but remained stable in T relative to Pla.
Statistically over-represented GO categories in CII include: hydrolyzing O-glycosyl
compounds (GO:0004553), carbohydrate binding (GO:0030246), and lyase activity
(GO:0016829), which included two types of carbonic anhydrases and a carbonic
anhydrase inhibitor in CII-EP2 and metalloendopeptidase activity (GO:0004222) in
CII-EP4 (Table 5.2). All molecules belonging to the GO category GO:0004553
(hydrolyzing O-glycosyl compounds) mapped to the O-Glycan biosynthesis KEGG
pathway (PATH: ko00512). These results are likely to reflect the OM synthesis and
carbonate chemistry mechanisms underlying skeleton deposition. Consistently, up-
regulation in CII-EP2-4 of a dynein light chain 2 (C_MGE-A027-C11-post82) and a
tubulin alpha-1 chain (C_mge-A048-D1-post3-T3) orthologs indicates active
intracellular transport possibly of OM precursors.
In a similar way, up-regulation of a bone morphogenetic protein ortholog (S_mge-
A048-B3) that mapped to the TGF-beta signaling pathway (PATH: ko04350) as well
as a dual specificity phosphatase 7 ortholog (C_D019-G3_23) which is involved in
the MAPK signaling pathway (PATH: ko04010) indicates that these signal
transduction mechanisms might regulate calcification-specific processes such as
calicoblast differentiation and production of the OM.
5. 4. 3. Cluster III. Genes up-regulated after settlement but stable or down-regulated in adult: highest expression in juvenile settled stages.
Cluster III (CIII) contains 243 unigenes (20% of DEGs) from which 132 were
annotated and represented 21% of all annotated sequences. Absolute FCs in CIII were
as high as ∼4-fold. CIII DEGs were distributed in 7 distinct expression patterns
referred here as CIII-EP1 to CIII-EP7 (Fig 5.3).
CIII-EP1 contains 52 DEGs that were up-regulated up to ∼ 4-fold only in Po and
remained stable in F and T when compared to Pla. CIII-EP-2 groups 75 unigenes that

97
were up-regulated up to ∼ 2-fold only in F and remained stable in P and T when
compared to Pla. These two EPs might reflect the regulation of stage specific
processes such as basal plate formation and morphogenesis of adult structures. CIII-
EP3 has 27 DEGs that were up-regulated up to ∼ 2-fold in F but remained stable in Po
and were down-regulated up to ∼ 3 fold in T relative to Pla. CIII-EP4 contains 59
DEGs that were up-regulated up to ∼ 3-fold in F and Po but remained stable in T
relative to Pla.
CIII-EP5 consists of 4 unigenes all up-regulated up to ∼ 2-fold in all three stages
relative to Pla. The only annotated gene in this EP encodes a coral ortholog of a
heterogeneous nuclear ribonucleoprotein a-b (C_D045-F12_94). CIII-EP6 groups 12
DEGs that were up-regulated up to ∼ 3-fold in F and Po and down-regulated up to ∼
4-fold in T when compared to Pla. Finally, CIII-EP7 contains 14 DEGs that were
stable in F, up-regulated up to ∼ 2-fold in Po and down-regulated up to ∼ 3-fold in T
in relation to Pla.
Statistically over-represented GO categories in CIII include: sequence-specific DNA
binding (GO:0043565) in CIII-EP1, cellular carbohydrate metabolic process
(GO:0044262), aerobic respiration (GO:0009060) and positive regulation of cell
differentiation (GO:0045597) in CIII-EP2, oxidoreductase activity (GO:0016491) and
response to oxidative stress (GO:0006979) in CIII-EP3-7 and transcription factor
activity (GO:0003700), embryonic development ending in birth or egg hatching
(GO:0009792), regulation of anatomical structure morphogenesis (GO:0022603),
cation transport (GO:0006812) and anion transport (GO:0006820) in CIII-EP4.
These results suggest that although F and Po are distinct transcriptional stages they
both express a common subset of DEGs that might regulate morphogenesis of adult
structures (GO:0009792 and GO:0022603) and ion transport (GO:0006812 and
GO:0006820) able to control larval skeleton deposition. Up-regulation in F (CIII-
EP3) of the novel extracellular matrix protein Galaxin-like (C_MGE-A006-D10-
28975-T), likely to be involved in basal plate formation together with up-regulation in
Po (CIII-EP1-7) of two extracellular matrix glycoproteins: 1) Echinonectin (S_mge-
A030-F6-post45-T3) and 2) E-selectin (S_MGE-A004-H2-pstH9715-T3) suggests

98
overlapping of extracellular matrix proteins that might differentially regulate skeleton
deposition and/or cell adhesion during morphogenesis of adult structures.
Furthermore, up-regulation in F (CIII-EP2) of bone morphogenetic protein type 1b
(S_MGE-A023-C10-post74-T3) and a nemo-like kinase (C_mge-B027-F10-prawn77)
suggests that similar to Drosophila sp an antagonic mechanisms involving nemo
kinase regulation of BMP signalling (Zeng et al., 2007), is mediating cell
differentiation during metamorphosis in Acropora.
Up-regulation in CIII-EP2 of two unigenes (S_mge-A030-E5-post36-T3 and S_mge-
A037-A6-post40-T3) which orthologs are known to regulate dorso-ventral axial
formation (formin 2 and modulator of activity of ets genes) (PATH: ko04320) in
bilaterians suggests that cell differentiation and morphogenesis into adult structures is
initiated in F. In a similar way, up regulation of two DEGs C_mge-B021-H10-
prawn79 and S_MGE-A017-E2-post12-T3) in CIII-EP1, which encode orthologhs of
cyclin b3 and polymerase delta 4 and mapped to cell cycle (PATH: ko041100) and
DNA replication (PATH: ko03030) pathways respectively suggest that in Po cell
division is actively occurring.
DEGs involved in oxidative stress response (GO:0006979) were also up-regulated in
both juvenile settled stages which is consistent with the up-regulation of a number of
genes involve in carbohydrate and lipid metabolic pathways able to stimulate aerobic
respiration (GO:0009060) in F. These DEGs encode coral orthologs of an isocitrate
lyase (C_mge-B045-B10-prawn73) that mapped to the KEGG PATH: ko00630, an
aldehyde dehydrogenase a1 (S_MGE-A050-D9) that mapped to the KEGG PATH:
ko00010 and an acyl-coenzyme ac-4 (C_mge-B044-C1-prawn2_T) that mapped to the
KEGG PATH: ko00071.
5. 4. 4. Cluster IV. Genes stable or differentially expressed in juvenile stages but up-regulated in adult: highest expression in adult tips.
Cluster IV (CIV) contains 315 DEGs (27% of DEGs) from which 172 were annotated
and represented 28% of all annotated sequences. Absolute FCs in CIV were as high as
∼20-fold. CIV DEGs were distributed in 7 distinct expression patterns named here
CIV-EP1 to CIV-EP7 (Fig 5.4).

99
CIV-EP1 contains 244 DEGs that were up-regulated up to ∼ 20-fold only in T but
remained stable in F and Po relative to Pla. CIV-EP2 groups 26 unigenes that were
up-regulated up to ∼ 9-fold in F and T but and remained stable in Po when compared
to Pla. CIV-EP3 also contains 26 genes that were stable in F and up-regulated up to ∼
4-fold in Po and T in relation to Pla. CIV-EP4 has 12 genes that were up-regulated to
∼ 10-fold in all three stages when compare to Pla. CIV-EP5 groups only 3 DEGs that
were down-regulated up to ∼ 2-fold in F and Po but up-regulated up to ∼ 2-fold in T
relative to planula. The only two annotated sequences in this EP encode coral
orthologs of an ADAM metallopeptidase (S_MGE-A006-B9-28965-T3) and a
frizzled-related protein (C_D045-C10_75).
CIV-EP6 includes only 3 genes that were down-regulated up to ∼ 2-fold in F, stable in
Po and up-regulated up to ∼ 2-fold in T relative to Pla. All three DEGs in this group
were annotated and encode Acropora orthologs of a calmodulin-like molecule
(C_MGE-B015-F1-prawn5_T), an epididymal secretory protein e1 (C_MGE-A021-
A1-post0-T3) and a n-myc downstream regulated protein (C_D003-B10). CIV-EP7
consists only of 1 non-annotated gene which expression was stable in F, down-
regulated ∼ 2-fold in Po and up-regulated ∼ 2-fold in T relative to Pla.
Statistically over-represented GO categories in CIV include: translation
(GO:0006412), pattern specification process (GO:0007389) and regulation of cell
differentiation (GO:0045595) in CIV-EP1. This is consistent with the up-regulation in
the same expression patter of a number of components of conserved signal
transduction pathways known to regulate cell differentiation, proliferation and
migration across metazoa and a number of molecules able to regulate the actin
cytoskeleton. In a similar way, statistically over-represented GO categories also
include: transcription regulator activity (GO:0030528) and responses to abiotic
stimulus (GO:0009628) in CIV-EP2, skeletal-system development (GO:0001501),
extracellular matrix production (GO:0044420) and defence response (GO:0006952) in
CIV-EP3. The only statistically over-represented GO category in CIV-EP4 was
anatomical structure development (GO:0048856) (Table 5.2).

100
Components of of conserved signal transduction pathways included: 1) a coral snail 1
ortholog (S_mge-A045-D10-post75-T3) that mapped to the KEGG pathway PATH:
ko04520, 2) a beta-catenin ortholog (S_GS01vA0) that mapped to the Wnt signaling
pathway (PATH: ko04310), 3) a Notch-like protein (S_MGE-A023-F2) which
mapped to the Notch signaling pathway (PATH: ko04330) and 4) a heat shock protein
70 (S_MGE-A017-H8) that mapped to the MAPK signaling pathway (PATH:
ko04010). The regulators of the actin cytoskeleton (PATH: ko04810) included: 1) a
profilin (C_D006-B2), 2) an alpha 1 (C_mge-A043-F1-post5-T3), 3) an actin
(C_MGE-A049-H4-post31-T) and 3) a Gelsolin (C_D009-C6) Acropora orthologs.
The extracellular matrix proteins included two Alpha-1 type collagen-coding genes
(C_GS01AD12 and C_mge-A045-C3), and a coral protein containing a collagen triple
helix repeat (C_MGE-A012-H12-86595-T), this molecules also mapped to the KEGG
ECM-receptor interaction pathway (PATH: ko04512). Upregulation of two
calmodulin-like genes in CIV-EP3 (C_mge-B027-E12-prawn92) and 6 (C_MGE-
B015-F1-prawn5_T) suggest a diversification of calcium sensors that could mediate
specific calcium dependent cellular pathways.
5. 5. DISCUSSION.
5. 5. 1. Differential gene expression profiles were identified between larval, juvenile and adult stages during the life history of A. millepora.
Gene expression microarray analysis identified four main expression profiles between
the four developmental time points compared in this study. From the 8606 unigenes
assayed on the chip, a total of 1189 (14%) were differentially expressed (p = <0.01).
52% of all DEGs (623) were annotated sequences. While 547 DEG’s (46%) had the
highest expression at the planula stage (CI), 315 (27%) had the highest expression in
adults (CIV), 243 (20%) were highest expressed in settled juvenile stages (CIII) and
the remaining 84 (7%) were up-regulated after settlement and had the highest
expression in calcifying stages (CII)(Table 5.1). These results suggest that the
contrasting physiological and ecological conditions experienced by Acropora during
its life history correlates with the use of precise gene networks likely to control stage-
specific responses to their environment.

101
While the free-swimming planula is aposymbiotic and non-calcifying, sessile juvenile
polyps remain aposymbiotic but have switched to a calcifying life style and are
experiencing the morphogenetic changes that will lead to the formation of adult
structures. On the other hand, adult Acropora are colonies of symbiotic polyps
supporting high levels of calcification and interacting with a diverse range of
microrganisms as well as Symbiodinium spp., establishing the biological entity known
as the coral holobiont (Miller and Bassler, 2001; Schwarz et al., 2008; Siboni et al.,
2008; Marhaver et al., 2008; Harel et al., 2008). Both the ecological and
physiological discrepancies observed between the different Acropora life stages
suggest that planulae, juvenile polyps and adult tips are transcriptionally distinct
stages in which changes in the transcriptome reflect responses to differing
physiological and ecological conditions.
Consistent with this, Grasso et al., (2008) identified stage-specific (prawnchip,
planula, polyp, adult) transcription profiles during A. millepora development for 1084
DEGs using and array that contained 5081 unigenes. In a similar way, Reyes-
Bermudez et al., (in press) reported stage-specific gene expression patterns for
planulae, primary polyp and adult colonies during the life cycle of the “Robust” coral
Montastraea faveolata. Furthermore, five temporal gene expression profiles were
reported during metamorphosis and settlement of the abalone Haliotis asinine
(Williams et al., 2009) and Azumi et al., (2007) reported changes in the transcriptome
for most C. intestinalis genes during its life history. The fact that 66% of all DEGs
(CI and CIII) were differentially expressed in larval and juvenile stages, suggests that
although some of these genes might have a physiological role it is likely that this
subset of genes regulate the morphogenetic processes underlying settlement and
metamorphosis in Acropora. This is consistent with the observation that 77% of all
DEGs were differentially expressed between larval and juvenile stages during late
development in M. faveolata (Reyes-Bermudez et al., in press). Likewise, Azumi et
al., (2007) reported that 72% of all assayed genes were differentially expressed during
development of C. intestinalis.
On the other hand, the 34% (399 DEGs) that showed the highest expression in adult
(CIV) and calcifying stages (CII) are likely to be involved in adult-specific processes
such as sexual reproduction, responses to the environment, symbiosis and skeleton

102
deposition. Azumi et al., (2007) suggested that adult gene expression in C. intestinalis
responds to pollutant chemicals, physiological stress and bacterial and viral
infections. The fact that the percentage of DEGs with highest expression in adult
stages drastically differed between this experiment (27%) and the previous Acropora
developmental microarray study (4%) could be explained by the low proportion of
adult material printed in the chip containing 5081 unigenes used by Grasso et al.,
(2008) rather than to biological conditions.
In contrast with the results reported by Azumi et al., (2007) and Reyes-Bermudez et
al., (in press) in which 72% and 66% of genes examined were differentially expressed
at some stage during the life histories of C. intestinalis and M. faveolata respectively;
the 1189 DEGs identified in this study only accounts for 14% of the total number of
genes (8606) on the array. Although this number (14%) is comparable to that (21%
of 5081 unigenes) reported by Grasso et al., (2008), the different size of the arrays,
the proportions of printed transcripts from each developmental stage and the
abundance of particular transcripts in the EST libraries, complicate direct comparison
of overall expression patterns. Furthermore, in all of these cases the number of
unigenes on the arrays represents only a fraction of the species’ transcriptome, thus
complicating direct comparisons between datasets.
5. 5. 2. Planula larvae: a connection with Bilateria.
The higher proportion of annotated sequences differentially expressed in larval and
juvenile stages (CI, 45% and CIII, 21%) is consistent with the results obtained for the
“Robust” coral M. faveolata; while 45% of differentially expressed unigenes with
annotation were in the planula stage and 39% in juvenile polyps, only 16% were in
the adult cluster (Reyes-Bermudez et al., in press). Likewise, Azumi et al., (2007),
reported a high number of annotated sequences among the genes that were up-
regulated in early developmental stages during C. intestinalis life cycle and Grasso et
al., (2008) reported that 89% of the genes up-regulated in prawnchip had matches in
the databases. However, it is also possible that the higher porortion of annotated
sequences is due to the overrepresentation of developmental genes in the databases.

103
Recent phylogenetic analysis, suggest that both cnidarians and bilaterians evolved
from a common ancestor that resembled modern planula larvae and was to some
extent bilaterally symmetric (Baguna et al., 2008). Furthermore, it has been proposed
that similar groups of genes control morphological transitions across metazoans with
biphasic life cycle (Hayland and Moroz, 2006) and there is evidence showing that
developmental signalling pathways such as notch, wnt, hedgehog, and TGF-β have
been conserved during metazoan evolution (Matus et al., 2008; Matus et al., 2007;
Gordon et al., 2008). According to this it is reasonable to think that coral planula and
juvenile gene expression might reflect the common ancestry of developmental
mechanisms.
On the other hand, the high number of uncharacterised DEGs (48%) might represent
cnidarian or scleractinian-specific genes likely to be involved in the regulation of
cnidarian/scleractinian-specific functions, such as symbiosis and calcification.
According to Williams et al., (2009) conserved signaling pathways regulate the
expression of taxon-specific genes during Haliotis asinina metamorphosis thus is
likely that in corals conserved pathways not only regulate basic morphogenetic
processes such apoptosis, protein synthesis, and cell migrations, they are also likely to
control the expression of taxon-specific molecules responsible for taxon-specific
variations. Despite this, it is possible as suggested by Grasso et al., (2008) that the
number of taxon-restricted genes reflects the lack of genomic data for a vast range of
non-model organisms and that some of these molecules have a wider distribution.
By contrast with the low annotation rate of transcripts differentially expressed in M.
faveolata adults (16%)(Reyes-Bermudez et al., in press), the percentage of annotated
genes (from all annotated DEGs) in the adult Acropora cluster was 28%, which
corresponded to 55% of all DEGs with in the cluster (CIV). This trend was observed
in all clusters, while 52% of all sequences in CI were annotated, 44% were annotated
in CII and 54% were annotated in CIII.
5. 5. 3. Genes down-regulated after settlement: Initiation of morphogenesis, calcium signalling and lipid metabolism related molecules.

104
Environmental cues are known to induce metamorphosis in a diverse range of marine
invertebrate larvae (Hadfield et al, 2000); in most cases “inducers” are chemical
compounds produced by marine microorganisms (Woollacott and Hadfield, 1996;
Bonar and Fitt, 1990; Johnson and Giddins, 1991). It has been suggested that in
corals, lectins may act as cell surface receptors to “inducers” (Grasso et al., 2008)
thus likely to represent the first step in the signalling cascade that will lead to
metamorphosis in coral planula. Substrate recognition and initiation of
metamorphosis in some anthozoans is achieved via a nerve-rich region located in the
aboral pole of planulae known as the apical organ (Chia and Koss, 1979). This region,
which contains a highly elaborate nerve network consisting of chemosensory neurons
(Pang et al., 2004) and three different types of sensory cells (Chia and Koss, 1979), is
responsible for metamorphosis in the sea anemone Nematostella vectensis (Matus et
al., 2007; Rentzsch et al., 2008) and the coral Pocillopora damicornis
(Vandermeulen, 1974).
Furthermore, there is evidence of RFamide-positive neurons in the aboral end of
Acropora millepora larvae (Hayward et al., 2001), and LWamide, another
neuropeptide known to mediate metamorphosis in cnidarians (Katsukura et al., 2003
and 2004) was up-regulated in M. faveolata planulae (Reyes-Bermudez et al., in
press). It is known that planula migration and metamorphosis in the hydroid
Hydractina echinata is regulated by an antagonistic mechanism involving the
neuropetides LWamide and RFamide (Katsukura et al., 2003 and 2004). According to
this, is reasonable to think that metamorphosis in scleractinian corals is likely to be
regulated by conserved mechanisms that resemble that described for hydrozoan
cnidarians, and that neuropeptides such as RFamide and LWamide are involved in the
translation of the signal, downstream the binding of metamorphosis “inducers” to
specific aboral-ectodermal planulae extracellular receptors.
The role of neurotransmitters as signalling molecules of metamorphosis is consistent
with the up-regulation in Acropora planula of three molecules likely to act as
extracellular neuroactive ligand-receptors (PATH: ko04080)(Table 5.2). In cnidarians
the integration of external stimuli to cellular activity is likely to be achieved via a
complex network of neuronal interactions involving diverse neurotransmitters (Kass-
105
Simon and Pierobon, 2007) therefore, neurotransmitters and neuronal ligands up-
regulated at the planula stage are candidate molecules to regulate and integrate the
overall metamorphosis signal upon binding of specific extracellular “inducers”. These
observations suggest that aboral sensory neurons regulate settlement and/or
metamorphosis in corals by releasing endogenous neurotransmitters as secondary
massagers in response to binding of environmental cues to cell surface receptor
proteins.
5. 5. 3. 1. Initiation of morphogenesis: BMP signalling.
The finding that 46% of all DEGs were down-regulated after settlement indicates that
during metamorphosis and settlement gene expression changes rapidly due to intrinsic
developmental signaling pathways likely to regulate both morphogenesis of adult
structures and physiological responses to the new environment. The subset of genes
that showed highest expression at the planula stage are likely to be involved in
planula specific metabolic pathways such as lipid metabolisms (Table 5.2), as well as
in the initiation of the morphogenetic changes experienced by Acropora larvae during
the transition from a demersal, swimming, non-calcifying stage to a benthic,
calcifying, sessile life style.
Metamorphosis is a morphogenetic process similar to gastrulation; in both cases
tissues are reorganized and cell populations migrate and differentiate (Magie and
Martindale, 2008). Grasso et al., (2008) found that 52% of all DEGs were down
regulated after A. millepora embryogenesis, which is consistent with the finding that a
high percentage (46% of all DEGs) were down-regulated after settlement and the
initiation of metamorphosis in this study. Among those DEGs we found an
overrepresentation of positive regulators of apoptosis (GO:0043065) and larval
development (GO:002164) as well as a number of components of conserved
signalling pathways known to regulate apoptosis, cell differentiation, migration and
proliferation across the Metazoa (Table 5.2). These results suggest that although the
morphogenesis of adult structures is more evident after settlement, the regulation of
metamorphic transitions might be modulated by transcripts generated at the planula
stage and to some extend adult structures such as mesenteries are formed before

106
settlement (Vandermeulen, 1974; Babcock and Heyward, 1983; Szmant-Froelich et
al., 1980).
Another interesting finding is the up-regulation in planulae of unigenes encoding
Acropora orthologs of BMP-1 and BMP-1a molecules (Table 5.2). BMP-1 proteins
belong to a small group of zinc and calcium dependent proteinases which activity is
essential for tissue patterning and extracellular matrix assembly (Berry et al., 2009).
In vertebrates, they are involved in the biosynthetic processing of extracellular matrix
(ECM) precursors such as fibrillar collagens (Unsold et al., 2002; Medech et al.,
2003) and proteoglycans (Scott et al., 2000; Ge et al., 2004) as well as in the
regulation of the related family members BMP-2/4 (Jasuja et al., 2007), which induce
osteoblast differentiation (Wozney et al., 1988) and their gradients are known to
specified ventral and dorsal tissues (Dale and Wardle, 1999). By analogy with their
vertebrate counterparts, it is reasonable to hypothesise roles for Acropora BMP-1
orthologs in processing ECM proteins and/or activating grow factors such as BMP-
2/4 during coral metamorphosis. Cell-cell and cell-ECM interactions are fundamental
processes regulating morphogenesis among metazoans (Magie and Martindale, 2008).
Components of the BMP signalling transduction pathway have been identified in
Acropora (Samuel et al., 2001; Hayward et al., 2002) and the sea anemone
Nematostella (Finnerty et al., 2004; Rentzsch et al., 2006). In both anthozoans, BMP
signalling components are expressed asymmetrically in both the primary (oral-aboral
axis as well as in a secondary axis perpendicular to this one known as the directive
axis (Rentzsch et al., 2006). Although these results have led to the suggestion of roles
in dorso-ventral patterning in cnidarians (Hayward et al., 2002; Rentzsch et al., 2006),
roles in cell differentiation and the establishment of morphogenetic borders also have
been considered (Hayward et al., 2002). The roles of BMP signalling in vertebrate
skeletal formation are well characterized (Wozney et al., 1988; Kobayashi et al.,
2005); ossification requires both activation of BMP-2/4 and processing of calcifying
ECM proteins by BMP-1 (Ge and Greenspan, 2006). These observations suggest that
as in the case of vertebrate skeletogenesis, BMP signaling might play an important
role during calicoblast differentiation and coral skeleton deposition. The localization
of a coral BMP-2/4 ortholog in the calcifying epithelium (Zoccola et al., 2009) is

107
consistent with this idea. Up-regulation in planula (CI-EP7) of molecules involved in
protein dimerization (GO:0042802) might reflect BMP activity because dimerization
of matured BMP peptides is necessary to generate active ligands (Reber-muller et al.,
2006). Functional studies are necessary to test this idea.
There is evidence that in vertebrates wnt signaling regulates BMP-2 during
chondrocyte differentiation (Gaur et al., 2006) and that coordinate activation of notch,
wnt and TGF-β signaling is necessary for BMP-2 mediated osteogenesis (Sciaudone
et al., 2003; Zamurovic et al., 2004). The fact that components of some of these
conserved signal transduction systems are up-regulated in planula larvae (Table 5.2)
suggests that to some extent calicoblast differentiation pathways might resemble those
described for the calcifying vertebrate cell lineages. This idea is consistent with the
up-regulation of notch signaling components and regulators of BMP-2/4 activity
during metamorphosis in the “robust” coral M. faveolata (Reyes-Bermudez et al., in
press). Functional assays need to be performed in corals to understand whether the
roles and interactions between these conserved signaling systems resembled the ones
described for vertebrates.
5. 5. 3. 2. Calcium signalling and lipid metabolism.
Eukaryotic organisms use changes in the concentration of intracellular calcium to
regulate a diverse range of cellular processes (Haeseleer et al., 2002; Carafoli, 2004).
Differential cytosolic calcium concentrations are translated into cellular activities via
calcium binding proteins known as calcium sensors. These molecules, upon calcium
binding, are able to interact and activate target proteins, which activate specific
calcium-dependent signaling cascades (Carafoli, 2003). Up-regulation in planulae of a
number of EF-hand calcium sensors such as calmodulin, calumenin, calbindin,
calreticulin and calcineurin (Table 5.2) suggest that calcium signalling is a key
regulator during Acropora settlement and metamorphosis. These results are consistent
with the up-regulation of calmodulin, calumenin and calreticulin orthologs in planula
larvae of the coral M. faveolata (Reyes-Bermudez et al., in press).
Up-regulation of calcium sensors in the planula larvae of two species that represents
the two major scleractinian lineages (Kerr, 2005) suggest conserved calcium

108
dependent signalling pathways underlying the metamorphic transition across reef
building corals. Calmodulin is a highly conserved calcium sensor known to regulate
cytoskeleton organization, cellular metabolism, cell differentiation, proliferation,
apoptosis and metamorphosis in eukaryotes (Cyert, 2001; Benaim and Villalobo,
2002; Vetter and Leclerc, 2003) therefore it is not surprising that this versatile
calcium sensor modulates different aspects of settlement and metamorphosis across
scleractinia. Up-regulation of calumelin and calreticulin in coral planula suggests that
similar to mammalian bone homeostasis (Koga et al., 2004), calcium signalling might
regulate calicoblast differentiation and skeleton deposition in corals.
There is evidence that calumenin regulates the bone protein Osteocalcin and the
transforming growth factor BMP-2 (Wajih et al., 2004; Wajih et al., 2006), which as
mentioned before induces skeletogenesis across a wide range of organisms (Wozney
et al., 1988; Matsushiro and Miyashita, 2004) and localize to the calcifying
epithelium in corals (Zoccola et al., 2009). In the other hand, calreticulin belongs to
the group of intracellular integrin ligands (Vallar et al., 1999) and constituents of
integrin-based adhesion complexes in vertebrates (Tran et al., 2002), which suggest
calcium dependent regulation of cell-ECM signal transduction mechanisms during
coral metamorphosis. Cell migration, proliferation and differentiation are mediated by
interactions between the actin-cytoskeleton (Hotchin and Hall, 1996) and surrounding
ECM components (Magie and Martindale, 2008). This is consistent with the up-
regulation in Acropora planulae of a number of transcripts involved in the regulation
of the actin-cytoskeleton (PATH: ko04810)(Table 5.2) however; actin-cytoskeleton
activity might also reflect active transport of calcifying ECM precursors or/and
calcium ions prior skeleton deposition.
There is evidence that 1) calcium is accumulated in endodermal lipid containing
vesicles in both planula and settled larvae of the aposymbiotic corals (Clode and
Marshall, 2004) and 2) that the calcium binding fraction in the calcifying ECM of
hermatypic corals is likely to be acidic phospholipids (Isa and Okasaki, 1987;
Watanabe et al., 2003). Acidic phospholipids are degradation products from lipid
metabolism known to promote deposition of calcium salts (Khant et al. 1996). Roger
and Thomas, (2001) suggested that ancestral endodermal lipid containing cells in
cnidarians were used as physiological calcium sinks and that the coral skeleton
109
evolved from a waste removal mechanism subsequently adapted for structural
support. According to this, lipid metabolism is not only likely to provide energy for
planulae activity (Vandermeuden, 1974), acidic phospholipids produced as
degradation products might represent a mechanisms by which calcium ions are
insolubilized and transported to the calcificartion site prior skeleton deposition.
These ideas are consistent with the observed up-regulation in Acropora planulae of a
number of DEGs involved in lipid metabolism and phospholipid biosynthetic process
(GO:0008654)(Table 5.2). Microscopic observations identified putative lipid-
containing vesicles in the endoderm of Acropora planula (data not shown), and
Vandermeuden, (1974) described lipid-containing vesicles likely to be peroxisomes in
the endoderm of planulae of the scleractinian coral Pocillopora damicornis.
Peroxisomes are cellular organelles described for both animal and plant tissues, they
are calcium-containing compartments involve in fatty acid metabolism, cholesterol
synthesis, and phospholipid production (MacDonald et al., 2004; Raychaudhury et al.,
2006). Furthermore, there is evidence demonstrating that peroxisomal stored calcium
is used as a mediator towards calcium signalling (Raychaudhury et al., 2006) and it is
know that as result of lipid metabolism the secondary messengers diacyl-glycerol and
IP3 are produced (Hardie, 1991). These ideas are consistent with the up-regulation in
planulae of components of the phosphatidylinositol signalling system (Table 5.2).
These results suggest that both lipid metabolism and calcium signalling are two main
regulators of cellular activity in Acropora planulae. Calcium signalling might regulate
cell differentiation, proliferation and migration as well as transport of calcium ions
and calcifying ECM precursors during settlement and metamorphosis via a diverse
range of calcium sensors. Lipid metabolism is likely to generate signalling molecules
able to act as secondary messengers during settlement and metamorphosis as well as
degradation products able to store and transport calcium prior skeleton deposition.
Although lipid metabolisms seems to be the mayor energy source for planula activity,
up-regulation in CI (Table 5.2) of a number of DEGs involved in carbohydrate
metabolism (Table 5.2) suggests that lipids are not the only energy source in
Acropora larvae.

110
5. 5. 4. Genes up-regulated in settled juvenile and calcifying stages: Morphogenesis of adult structures and skeleton deposition related molecules.
Among the DEGs up-regulated after settlement 84 (7% of all DEGs) showed the
highest expression in calcifying stages (F, Po and T) (CII) and 243 (20% of all DEGs)
in settled juvenile stages (CIII). While the DEGs up-regulated in juvenile settled
polyps (CIII)(F and Po) reflected morphogenesis of adult structures the ones clustered
in CII are consistent with roles in calcification. Coral skeleton deposition correlates
with the aboral ectodermal transition from columnar cells to the calicoblast phenotype
(Le Tessier, 1998; Clode and Marshall, 2004). This newly formed epithelium secretes
a macromolecular network of proteins, lipids and polysaccharides known as the
calcifying organic matrix (OM). Only calicoblastic cells in direct contact with the
skeleton appear to be responsible for the synthesis and secretion of OM components
(Puverel et al., 2005).
5. 5. 4. 1. Calcification related molecules.
Calcifying OMs exert biological control over mineral deposition as they control
CaCO3 nucleation and determine the type of polymorph, as well as crystal size and
shape (Fukuda et al., 2003; Clode and Marshall, 2003; Watanabe et al., 2003). Up-
regulation in calcifying stages (CII) of a number of transcripts involved in O-Glycan
biosynthesis (GO:0004553), metalloendopeptidase activity (GO: 0004222) and
regulators of the tubulin-cytoskeleton (Table 5.2) suggest active OM synthesis.
Matrix biosynthesis, rather than CaCO3 deposition may be the limiting factor
controling coral skeletogenesis (Allemand et al., 1998). While glycosilation is a
process that appears to be a prerequisite for skeleton formation in corals (Allemand et
al. 1998) and echinoderms (Ameye et al., 2001), cytoskeleton-dependent processes
have been reported in calicoblastic cells and seem to be the mechanisms by which
OM precursors are transported to the mineralization site in the coral G. fascicularis
(Allemand et al., 1998; Clode and Marshall 2002).
Furthermore, up-regulation of two types of carbonic anhydrases (CAs) and a carbonic
anhydrase inhibitor in CII are consistent with the results reported by Grasso et al.,
(2008) and the idea that DEGs cluster in this group are likely to have a role in
skeleton deposition. Up-regulation of a CA inhibitor along side two CAs suggests that

111
CA activity is restricted to distinct cell population such as the calicoblastic epithelium
(Grasso et al., 2008). CAs catalyse the reversible conversion of CO2 to HCO-3, which
is one of the substrates necessary for CaCO3 deposition (Tambutté et al. 1996;
Allemand et al. 2004). CA activity has been link to calcification in the
azooxanthellate coral Tubastrea aurea (Tambutté et al., 2007), the calicoblastic
ectoderm of the zooxanthellate coral Stylophora pistillata (Moya et al., 2008) and in
the calicoblastic ectoderm of Acropora hebes (Isa and Yamazato, 1984). Furthermore,
a role for CA in skeletogenesis has been demonstrated in the coralline demosponge
Astrosclera willeyana (Jackson et al. 2007).
Up-regulation in the calcification cluster (CII), of components of the TGF-β and
MAPK signal transduction pathways (Table 5.2) suggest that these conserved
signalling systems are likely to regulate calicoblast differentiation or/and
transport/synthesis of OM precursors during coral skeleton deposition. Likewise,
uncharacterised molecules in this cluster (CII) are candidate molecules for roles in
calcification as structural OM components or regulators of OM synthesis.
5. 5. 4. 2. Morphogenesis of adult structure related molecules.
Although the subset of DEGs clustered in CIII might reflect the metamorphic
transition that will lead to the formation of adult polyps, expression patterns (EPs)
within the cluster revealed that F and Po have distinct transcription profiles. While
CIII-EP3, 4 and 7 contain candidate genes to regulate morphogenesis and juvenile
skeleton deposition as shown by the over representation of the GO categories:
transcription factor activity (GO:0003700), embryonic development ending in birth or
egg hatching (GO:0009792), regulation of anatomical structure morphogenesis
(GO:0022603), cation transport (GO:0006812) and anion transport (GO:0006820);
CIII-EP1 contained 52 DEGs that were only up-regulated in Po and CIII-EP-2
grouped 75 DEGs that were only up-regulated in F (Fig 5.3).
These results suggests that even though F and Po co-expressed a subset of genes
likely to regulate the morphogenetic processes that will lead to the formation of adult
structures DEGs within CIII-EP1-2 might be involved in stage specific processes. Up-
regulation in F of transcripts encoding the Galaxin-like1 protein (Table 5.2) which is

112
predicted to be extracellular and whose expression pattern is consistent with a role in
basal plate formation (chapter 3), together with up-regulation in Po of sequences
matching the ECM proteins echinonectin and E-selectin suggests overlapping
expression of extracellular matrix proteins between the two juvenile settled stages
used in this study. Whether the role of these ECM proteins is to differentially regulate
skeleton deposition and/or cell adhesion during morphogenesis of adult structures is
not clear. Functional assays are necessary to understand the function of these secreted
proteins as well as the specific role of uncharacterised transcripts up-regulated in
settled juvenile stages during Acropora metamorphosis.
Upregulation in F (CIII-EP2) of positive regulators of cell differentiation
(GO:0045597)(Table 5.2) suggests that cell differentiation into adult phenotypes is
regulated to some extent by transcripts originated in F. On the other hand, up-
regulation in Po (CIII-EP1) of two DEGs (cyclin b3 and polymerase delta), orthologs
of which have roles in cell proliferation (PATH: ko041100 and PATH: ko03030)
suggests that cell division is actively occurring in Po. According to this, is reasonable
to think that whilst morphogenesis of adult structures (i.e. mesenteries, tentacles and
the calicoblastic ectoderm) is mediated by transcripts originated in F, cell
proliferation of committed cell populations occurs in Po prior asexual reproduction
and/or growth.
In a similar way, up-regulation in F (CIII-EP2) of DEGs involved in cellular
carbohydrate metabolic processes (GO:0044262) and aerobic respiration
(GO:0009060) indicates a switch between energy metabolic pathways. While the
main energy source for planula larva is stored lipid (Vandermeulen, 1974), these
results are consistent with carbohydrate metabolism being the main energy source of
settled juvenile polyps. The switch between energy metabolic pathways between
planulae and settled juvenile polyps might also reflect a change in the concentration
of the secondary messengers regulating different aspects of Acropora metamorphosis.
While lipid metabolism is able to generate the secondary messengers such as diacyl-
glycerol and IP3 (Hardie, 1991), an increase in respiration (GO:0009060) rates due to
a boost in carbohydrate metabolism (GO:0044262) will raise the concentration of
reactive oxigen species (ROS), which are molecules able to regulate specific
signalling pathways (Finkel, 2000; Brookes et al. 2002; Dennery, 2007). Up-

113
regulation of molecules involved in oxidoreductase activity (GO:0016491), response
to oxidative stress (GO:0006979) in both F and Po that are also down-regulated in
adult polyps (CIII-EP3 and 7) are consistent with this idea.
This idea is consistent with the results reported for the coral M. faveolata (Reyes-
Bermudez et al.,in press). Over representation of GO categories: oxidoreductase
activity (GO:0016491) and response to oxidative stress (GO:0006979) in CIII-EP3-7
suggests that ROS produced by aerobic respiration (GO:0009060) are involved in the
regulation of Acropora metamorphosis in settled juvenile stages. Incomplete oxygen
reduction during the mitochondrial electron transport chain leads to the formation of
superoxide radicals which are the first molecules involved in the production of ROS
(Kang and Hamasaki, 2003; Raha and Robinson, 2000). Uncontrolled ROS
production can cause oxidative damage to cellular structures (Raha and Robinson,
2000), however ROS molecules are also able to regulate specific signalling pathways
(Finkel, 2000; Brookes et al. 2002). ROS plays a direct role as a primary or secondary
messenger during embryonic development in mammals by regulating cellular
pathways involved in cell proliferation, differentiation and apoptosis (reviewed in
Dennery, 2007).
Another result that supports this idea is the down-regulation of a subset of GFP-like
encoding transcripts following Acropora settlement (GO:0008218)(Table 5.2). Coral
GFPs have been associated to oxidative stress response due to their ability to quench
ROS (Bou-Abdallah et al., 2006; Smith-Keune and Dove, 2008), which suggests that
up-regulation of GFPs in planulae might represent one mechanism by which ROS
levels are regulated. Although there is no direct evidence that down-regulation of a
subset of GFPs after settlement leads to oxidative stress in the settled juvenile
Acropora, the fact that the GO categories oxidoreductase activity (GO:0016491) and
response to oxidative stress (GO:0006979) are up-regulated in juvenile settled stages
following down-regulation of GFPs (GO:0008218) supports this idea. Moreover, up-
regulation of a subset of GFPs in Pla relative to all stages (CI-EP1) suggests a specific
function for these molecules prior settlement and metamorphosis in Acropora.
Functional assays are necessary to understand the role of larval GFPs and their
putative role as ROS regulators.

114
In contrast with results reported for the “Robust” coral M. faveolata (Reyes-
Bermudez et al., submitted), over representation of molecules involved in responses
to oxidative stress (GO:0006979) were observed in the “Complex” coral A. millepora
in settled juvenile stages rather than in planula larvae. These observations suggest
variation in the cellular mechanisms regulating metamorphic morphogenesis across
reef-building corals that might reflect phylogenetic history. The order Scleractinia is
composed of two main clades (i.e. Robust/Short and Complex/Long) that are thought
to have diverged approximately 240-288 years ago (Kerr, 2005; Medina et al. 2006,
Romano and Palumbi, 1997). Marlow and Martindale (2007) reported different
gastrulation mechanisms between scleractinian clades, thus is not surprising that
variation in the mechanisms regulating settlement and metamorphosis exist within the
order. More research is necessary to validate these observations.
5. 5. 5. Cluster IV. Genes with highest expression in adult tips: asexual reproduction and genes associated with responses to environmental conditions.
Consistent with the idea that Acropora adult tips have a higher growth rate that other
parts of the colony (Oliver et al., 1983; Tunnicliffe et al., 1983), our results show an
over representation in CIV-EP1 of DEGs involved in translation (GO:0006412),
pattern specification process (GO:0007389) and regulation of cell differentiation
(GO:0045595) (Fig 5.5). Furthermore, up-regulation in the same EP of the coral
orthologs of snail, beta-catenin and notch-like (Table 5.2), which are known
regulators of developmental processes (Technau and Scholz, 2003; Cadigan and
Nusse, 1997; Gordon, 2008), implies that cellular differentiation is also occurring.
Up-regulation in CIV-EP1 of regulators of the actin cytoskeleton (PATH: ko04810)
such as profilin, actin and gelsolin (Table 5.2) is likely to reflect interactions between
the actin-cytoskeleton and surrounding ECM components during cell migration,
proliferation and differentiation (Hotchin and Hall, 1996; Magie and Martindale,
2008).
Over-representation of the GO category: anatomical structure development
(GO:0048856) in all post-settlement stages (CIV-EP4) suggests that this EP
represents the gene network underlying polyp morphogenesis during development,
asexual reproduction and growth. These results imply that similar regulatory gene

115
networks regulate the formation of adult structures during metamorphosis and asexual
reproduction in Acropora. Consistent with this, many genes are expressed in two
waves during Drosophila melanogaster development, larval patterns being
recapitulated in adults, where they had analogous regulatory roles (Arbeitman et al.,
2002). By analogy, the same genetic programming may be used in Acropora to
generate a polyp during metamorphosis and during asexual reproduction in the adult
colony. This idea is consistent with the results for M. faveolata metamorphosis where
the planula transcriptome resembled that of the adult (Reyes-Bermudez et al., in
press).
The fact that the developmental regulatory DEGs clustered in CIV-EP1 were not
differentially expressed in settled juvenile stages relative to planulae but were up-
regulated in adult tips might be explained by: 1) high metabolic rates characteristic of
symbiotic coral tissues (Stanley, 2006) or/and 2) modifications between the
developmental pathways that originates polyps during development and asexual
reproduction. Although more research is necessary to understand co-expressed gene
networks in contrasting life stages, these results suggest that to some extent similar
cellular mechanisms might control polyp morphogenesis during metamorphosis and
asexual reproduction.
Consistent with the idea that co-expressed gene networks are used in different life
stages during the life history of an organisms (Arbeitman et al., 2002), expression
patterns CIV-EP2, 3 and 5 clustered DEGs that had their highest expression in adults
but were also up-regulated in F, Po and Pla respectively (Fig 5.5). While the group of
DEGs that were up-regulated in both F and T (CIV-EP2) contains DEGs involved in
responses to abiotic stimuli (GO:0009628), such as heat shock proteins and
cryptochromes; the genes up-regulated in Po and T were involved in skeletal-system
development (GO:0001501), extracellular matrix production (GO:0044420) and
defence responses (GO:0006952) (Table 5.2). These results suggest that whereas
DEGs up-regulated in both F and T might reflect the physiological responses to the
sessile life style, the DEGs up-regulated in both Po and T reflect shared calcification
mechanisms between primary and adult polyps as well as immune responses likely to
be involved in the establishment of symbiosis.

116
The finding that calcification-related transcripts were up-regulated both in Po and T
(CIV-EP3) is consistent with the idea that the fiber-like CaCO3 deposition
characteristic of adult skeletogenesis (Vandermuelen and Watabe, 1973; Goreau and
Hayes, 1977; Gladfelter, 1982) begins once mesenteries are formed in the polyp stage
(chapter 3). Moreover, these results are consistent with the ideas that 1) juvenile
calcification in Acropora is a two-stage process that involves the formation of a basal
plate in F followed by septa deposition and complete corallite formation in Po and 2)
that this two stages are regulated by differential expression of OM components
(chapter 3).
In a similar way, the finding that a CaM-like molecule which appears to be coral
specific and interacts in vitro with the Acropora CaM protein (chapter 4) clustered
together with alpha type 1 collagen and fibroblast growth factor receptor coral
orthologs (CIV-EP3) (Table 5.2), suggests that CaM mediated calcium signalling
regulates calicoblast differentiation in Acropora and that the translation of the calcium
signal is mediated via a coral specific calcium sensor. Alpha type 1 collagen is one of
the major structural components of vertebrate bone (Ge and Greenspan, 2006) and
fibroblast growth factor receptor signaling mediates osteogenic differentiation in
mammals (Selfors et al., 1998; Ng et al., 2007). These observation are consistent with
the idea that diversification of calcium sensors had a crucial role in the evolution of
taxon-specific calcium mediated signaling pathways (chapter 4).
On the other hand, up-regulation in both Pla and T (CIV-EP5) of DEGs encoding
ADAM metalloproteinase and frizzled-related proteins (Table 5.2) whose vertebrate
counterparts are involved in processing ECM proteins (Greenspan, 2005; Greenspan
and Wang 2005) and Wnt signaling respectively (Cadigan and Nusse, 1997), suggest
that cell differentiation into precursors of adult cell types is occurring in both planulae
and adult tissues. While ECM components are able to mediated cell migration,
proliferation and differentiation (Hotchin and Hall, 1996; Magie and Martindale,
2008), Wnt signalling plays an important role in the specification of cells fates during
animal development (Cadigan and Nusse, 1997). Furthermore, cnidarians posses at
least eleven from the twelve Wnt subfamilies known to exist in bilaterians and the
expression patterns for these molecules revealed distinct roles during development in
the sea anemone Nematostella vectensis (Kusserow et al., 2005).
117
According to this is reasonable to think that DEGs grouped in CIV-EP5 might be
involved to some extent in the establishment of cellular fates during both
metamorphosis and asexual reproduction. Furthermore it is possible that cell
differentiation into adult phenotypes is achieved in two steps: 1) generation of
partially committed precursors of adult cell types as in the case of hydrozoans (Martin
and Archer, 1997; Bode, 1996) and 2) final differentiation into specific cell types
(chapter 2). The finding that Wnt signaling components are up-regulated both in Pla
and T, together with the fact that frizzled-related proteins are Wnt receptors known to
regulate canonical Wnt signalling during BMP-2 induced chondrocyte differentiation
in mammals (Gaur et al., 2006) suggests that calicoblast precursors are likely
originated in Acropora planulae prior to metamorphosis and that final differentiation
into the adult calcifying phenotype is achieved in Po after metamorphosis and during
asexual reproduction in T.
This idea is consistent with the over representation in both Po and T (CIV-EP3) of
DEGs involved skeletal-system development (GO:0001501) and extracellular matrix
production (GO:0044420) as well as with the up-regulation in T (CIV-EP1) of an
Acropora beta-catenin ortholog which is the downstream protein that regulates gene
expression of target genes during canonical Wnt signalling (Cadigan and Nusse,
1997). Although gene expression microarray analysis is a valuable tool to identify key
molecules and specific gene networks regulating many aspects of coral biology, the
functions and physiological interactions of the genes identified by this approach are
restricted to conceptual models based on analogous pathways in model organisms.
Functional assays are necessary to validate the models and hypothesis generated from
microarrays experiments in scleractinian corals.

118
5. 6. CHAPTER FIGURES AND TABLES.
Figure 5. 1. Experimental design.
Gene expression microarray analysis was used to compare changes in Acropora millepora transcriptome between aposymbiotic non-calcifying planula (Pla) larvae, aposymbiotic calcifying flat polyp (F), aposymbiotic calcifying primary polyp (Po) and symbiotic calcifying adult tips (T). Samples were hybridized in duplicate fallowing a loop design. Hybridizations included dye swaps between all stages in both biological replicates.

119
Figure 5. 2. Cluster I: DEGs downregulated after settlement.
Cluster I consisted of 547 unigenes (46% of DEGs) that showed the highest expression at the planula stage. Expression values are presented as the log2 intensity ratio (M-value) between all post-settlement stages and planulae (baseline). Absolute fold changes (FCs) in CI were as high as ∼10-fold (∼3.3 log2 ratio). Eight distinct expression patterns were identified within the group (CI-EP1 to CI-EP8). Expression patterns show the stage average log2 ratio for all DEGs with similar expression profiles.

120
Figure 5. 3. Cluster II: DEGs upregulated after settlement.
Cluster II consisted of 84 unigenes (7% of DEGs) that showed the highest expression in calcifying stages. Expression values are presented as the log2 intensity ratio (M-value) between all post-settlement stages and planulae (baseline). Absolute fold changes (FCs) in CIII were as high as ∼14-fold (∼3.8 log2 ratio). Four distinct expression patterns were identified within the group (CII-EP1 to CII-EP4). Expression patterns show the stage average log2 ratio for all DEGs with similar expression profiles.

121
Figure 5. 4. Cluster III: DEGs with highest expression in juvenile settled stages.
Cluster III consisted of 243 unigenes (20% of DEGs) that showed the highest expression in juvenile settled stages. Expression values are presented as the log2 intensity ratio (M-value) between all post-settlement stages and planulae (baseline). Absolute fold changes (FCs) in CIII were as high as ∼4-fold (∼2 log2 ratio). Seven distinct expression patterns were identified within the group (CIII-EP1 to CIII-EP7). Expression patterns show the stage average log2 ratio for all DEGs with similar expression profiles.
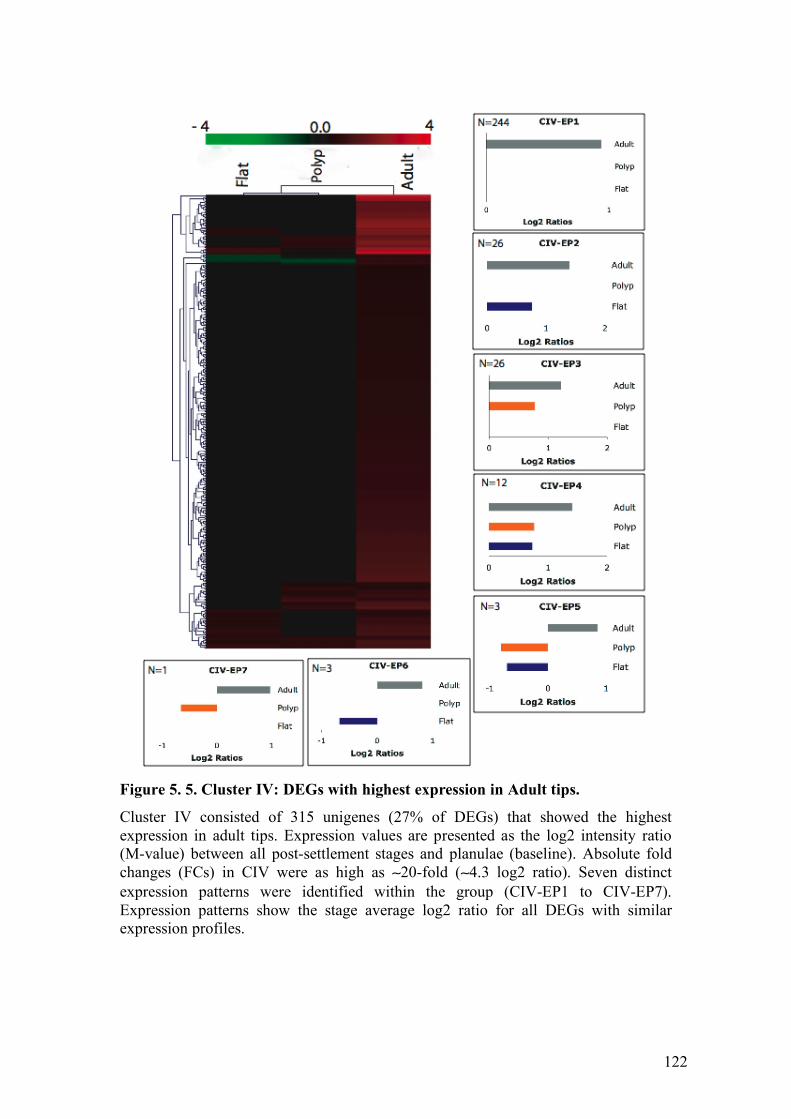
122
Figure 5. 5. Cluster IV: DEGs with highest expression in Adult tips.
Cluster IV consisted of 315 unigenes (27% of DEGs) that showed the highest expression in adult tips. Expression values are presented as the log2 intensity ratio (M-value) between all post-settlement stages and planulae (baseline). Absolute fold changes (FCs) in CIV were as high as ∼20-fold (∼4.3 log2 ratio). Seven distinct expression patterns were identified within the group (CIV-EP1 to CIV-EP7). Expression patterns show the stage average log2 ratio for all DEGs with similar expression profiles.

123
Table 5. 1. Cluster and expression patterns summary.
Cluster Assignment Expression Pattern
# of DEGs % of DEGs % of Annotated DEGs (623 genes-52% of DEGs)
CI-EP1 158 13.3 % 10.4 % (65 genes) CI-EP2 16 1.3 % 0.1 % (6 genes) CI-EP3 137 11.5 % 12.5 % (78 genes) CI-EP4 2 0.2 % 0.3 % (2 genes) CI-EP5 87 7.3 % 6.1 % (38 genes) CI-EP6 41 3.4 % 3.2 % (20 genes) CI-EP7 77 6.5 % 9.5 % (59 genes)
CI Downregulated after settlement.
CI-EP8 29 2.4 % 2.6% (16 genes) CI Total
547 46 % 45 % (284 genes)
CII-EP1 1 0.08 % 0.2 % (1 gene) CII-EP2 52 4.4 % 4 .6 % (28 genes) CII-EP3 2 0.1 % 0 %
CII Upregulated after settlement.
CII-EP4 29 2.4 % 1.2 % (8 genes) CII Total
84 7 % 6 % (37 genes)
CIII-EP1 52 4.3 % 3.6% (23 genes) CIII-EP2 75 6.3 % 7 % (44 genes) CIII-EP3 27 2 % 3 % (19 genes) CIII-EP4 59 4.9 % 5 % (31 genes) CIII-EP5 4 0.3 % 0.2 % (1 gene) CIII-EP6 12 1 % 0.8 % (5 genes)
CIII Upregulated in either/both Flat and Polyp and downregulated/stable in Adult CIII-EP7 14 1.2 % 1.4 % (9 genes)
CIII Total
243 20 % 21 % (132 genes)
CIV-EP1 244 20.5 % 21 % (133 genes) CIV-EP2 26 2.2 % 2.7 % (17 genes) CIV-EP3 26 2.2 % 2.3 % (14 genes) CIV-EP4 12 1 % 0.8 % (5 genes) CIV-EP5 3 0.3 % 0.3 % (2 genes) CIV-EP6 3 0.3 % 0.5 % (3 genes)
CIV Upregulated in Adult
CIV-EP7 1 0.08 % 0 % CIV Total
315 27 % 28 % (172 genes)
Overall Total 1189 100 % 100 %

124
Table 5. 2. Functional annotation and expression values for DEGs of interest. Unigene ID Annotation C-EP GO/KEGG Term FC-F FC-Po FC-T CI C_D050-F6_46 ef-hand domain containing 2 CI-EP1 calcium ion binding -1.65 -2.33 -1.72 C_GS01dC08 synaptic 2 CI-EP1 Biosynthesis of unsaturated fatty acids -3.41 -2.30 -2.80 C_mge-B045-G10-prawn78 glucose-methanol-choline oxidoreductase CI-EP1 Bile acid biosynthesis -2.26 -2.32 -1.86 C_mge-C006-A7-pre48_T3 Colorless GFP-like protein CI-EP1 ---NA--- -2.33 -5.16 -2.18 C_mge-C007-D6-pre43_T3 pancreatic lipase-related protein 2 CI-EP1 Glycerolipid metabolism -2.48 -3.94 -4.57 S_GS01SB11 Notch 2 (Fragment) CI-EP1 Notch signaling pathway -1.61 -1.67 -1.76 S_MGE-A049-C6-post42-T3 bone morphogenetic protein CI-EP1 ---NA--- -1.50 -2.27 -2.16 S_mge-B018-G8-prawn62_T3 family member k CI-EP1 Glycerolipid metabolism -1.74 -1.88 -1.89 S_mge-C005-A7-pre48_T3 Lipase, gastric CI-EP1 Glycerolipid metabolism -1.91 -1.51 -4.11 S_mge-C008-F10-pre77_T3 hemicentin 1 CI-EP1 Bioluminescence -2.11 -2.64 -2.30 S_mge-C008-H4-pre31_T3 paired-like homeodomain TF-2 CI-EP1 TGF-beta signaling pathway -2.22 -2.66 -2.60 S_mge-C012-B5-pre33_T3 red fluorescent protein2 CI-EP1 Bioluminescence -2.43 -6.87 -2.68 S_MGE-C018-B4-pre25_T3 Orphan G protein-coupled receptor Ren 1 CI-EP1 Neuro ligand-receptor interaction -2.06 -3.18 -3.46 S_MGE-C018-E7-pre52_T3 gdp-mannose-dehydratase CI-EP1 Fructose and mannose metabolism -1.55 -2.00 -1.56 C_GS01IG06 animal haem peroxidase CI-EP2 alpha-Linolenic acid metabolism -1.63 1.00 -1.77 S_mge-C015-H12-pre95_T3 sphingomyelin phosphodiesterase CI-EP2 Sphingolipid metabolism -1.56 1.00 -3.56 C_D012-C11_83 delta 5 fatty acid desaturase CI-EP3 Linoleic acid metabolism 1.00 1.00 -1.64 C_MGE-A022-E1-post4-T3 calreticulin CI-EP3 calcium ion binding 1.00 1.00 -1.48 S_GS01cE06 phosphatidylinositol-3-phosphate 5-kinase CI-EP3 Phosphatidylinositol signaling system 1.00 1.00 -1.53 S_MGE-A006-D4-28927-T3 acyl-oxidase CI-EP3 Fatty acid metabolism 1.00 1.00 -1.53 S_mge-A030-A4-post24-T3 ribokinase CI-EP3 Pentose phosphate pathway 1.00 1.00 -1.52 S_mge-B019-C1-prawn2_T3 rx3 protein CI-EP3 TGF-beta signaling pathway 1.00 1.00 -1.52 S_mge-B021-G8-prawn62_T3 Cytochrome P450 CI-EP3 Linoleic acid metabolism 1.00 1.00 -1.86 S_mge-C001-E10-pre76_T3 egf-like protein CI-EP3 Notch signaling pathway 1.00 1.00 -2.60 C_GS01QA12 endonuclease CI-EP5 Apoptosis 1.00 -1.67 -2.91 C_mge-A041-C3-post18-T pancreatic lipase CI-EP5 Glycerolipid metabolism 1.00 -1.67 -3.67 C_mge-B022-H10-prawn79 Bone morphogenetic protein 1a CI-EP5 ---NA--- 1.00 -1.56 -1.71 C_mge-C006-A6-pre40_T3 calumenin CI-EP5 calcium ion binding 1.00 -2.19 -8.11 C_mge-C007-E3-pre20_T3 gamma-aminobutyric acidaalpha 6 CI-EP5 Neuro ligand-receptor interaction 1.00 -1.72 -1.63

125
S_mge-A041-B5-post33-T3 triosephosphate isomerase CI-EP5 Glycolysis / Gluconeogenesis 1.00 -1.94 -1.82 S_mge-A041-F10-post77-T3 25-hydroxyvitamin D-1-alpha-hydroxylase CI-EP5 Biosynthesis of steroids 1.00 -1.55 -3.10 s_mge-b025-b6-prawn41_t3 bone morphogenetic protein 1 CI-EP5 ---NA--- 1.00 -1.55 -1.66 S_mge-C010-B6-pre41_T3 Thrombospondin 1 CI-EP5 TGF-beta signaling pathway 1.00 -1.50 -1.62 S_mge-C015-G2-pre14_T3 Aristaless CI-EP5 ---NA--- 1.00 -1.82 -1.80 C_D018-B3_18 protein disulfide isomerase CI-EP6 larval development -1.66 -1.64 1.00 C_D049-F8_62 lipocalin protein CI-EP6 larval development -1.51 -1.54 1.00 C_mge-A043-C5-post34-T phosphatidylserine decarboxylase CI-EP6 phospholipid biosynthetic process -2.35 -2.05 1.00 C_mge-C011-F7-pre53_T3 beta 10 CI-EP6 Regulation of actin cytoskeleton -2.11 -1.82 1.00 C_mge-C014-C3-pre18_T3 calbindin 2 CI-EP6 calcium ion binding -2.51 -2.11 1.00 S_mge-C001-H8-pre63_T3 phosphatidylserine decarboxylase-related CI-EP6 phospholipid biosynthetic process -2.83 -1.89 1.00 S_MGE-C017-G9-pre70_T3 pyruvate dehydrogenasealpha 1 CI-EP6 Glycolysis / Gluconeogenesis -1.53 -1.61 1.00 C_D022-B6_42 mannose-isoform cra_a CI-EP7 identical protein binding 1.00 -1.53 1.00 C_GS01KH06 arp2 3 complex 20 kd subunit CI-EP7 Regulation of actin cytoskeleton 1.00 -1.57 1.00 C_MGE-A035-E1-post4-T3 gdp-mannose-dehydratase CI-EP7 Fructose and mannose metabolism 1.00 -1.53 1.00 C_mge-A044-E12-post92- cardiac calumenin CI-EP7 calcium ion binding 1.00 -1.61 1.00 C_mge-B019-B3-prawn17_ dentin matrix protein 1 CI-EP7 ---NA--- 1.00 -1.57 1.00 S_GS01aE06 dipeptidyl-peptidase 7 CI-EP7 identical protein binding 1.00 -1.51 1.00 S_GS01HD01 heart and neural crest derivatives 2 CI-EP7 identical protein binding 1.00 -1.54 1.00 S_mge-A037-F5-post37-T3 casp8 and fadd-like apoptosis regulator CI-EP7 Apoptosis 1.00 -1.68 1.00 S_mge-A038-H1-post7-T3 mitogen-activated protein kinase 7 CI-EP7 MAPK signaling pathway 1.00 -1.79 1.00 S_mge-B016-E5-prawn36_T3 8-lipoxygenase-allene oxide synthase fusion CI-EP7 Arachidonic acid metabolism 1.00 -1.73 1.00 S_mge-C007-D7-pre51_T3 gamma glutamyl transpeptidases CI-EP7 Arachidonic acid metabolism 1.00 -1.60 1.00 S_mge-C007-F7-pre53_T3 Allatostatin G-protein coupled receptor CI-EP7 Neuro. ligand-receptor interaction 1.00 -1.58 1.00 S_mge-C009-A8-pre56_T3 alanine:glyoxylate aminotransferase CI-EP7 identical protein binding 1.00 -1.51 1.00 S_mge-C009-H2-pre15_T3 calcineurin subunit b CI-EP7 MAPK signaling pathway 1.00 -1.55 1.00 C_D003-D2 cytoplasmic actin CI-EP8 Regulation of actin cytoskeleton -1.59 1.00 1.00 C_GS01JG02 calmodulin1 CI-EP8 regulation of transport -1.86 1.00 1.00 C_GS01WD05 myl9 protein CI-EP8 Regulation of actin cytoskeleton -1.55 1.00 1.00 C_mge-B023-F9-prawn69_ protein kinasebeta CI-EP8 regulation of transport -1.63 1.00 1.00 S_mge-A041-G5-post38-T3 phosphatidylinositol 4-alpha polypeptide CI-EP8 Phosphatidylinositol signaling system -1.55 1.00 1.00 CII S_MGE-A023-D8-post59-T3 major yolk protein CII-EP1 iron homeostasis 1.00 4.14 9.06

126
C_D008-B12 hemolytic lectin cel-iii CII-EP2 O-Glycan biosynthesis 2.94 4.99 4.46 C_MGE-A009-D7-57751-T3 ricin b lectin CII-EP2 O-Glycan biosynthesis 2.83 4.51 3.78 C_MGE-A049-E7-post52-T secreted hydrolase CII-EP2 O-Glycan biosynthesis 1.84 3.14 2.01 C_mge-A043-H1-post7-T3 protein CII-EP2 carbohydrate binding 3.58 3.53 1.65 S_mge-A030-B2-post9-T3 carbonic anhydrase ii CII-EP2 lyase activity 4.99 4.26 4.89 S_mge-A047-H8-post63-T3 protein CII-EP2 lyase activity 2.39 2.27 1.70 C_D024-G1_7 carbonic anhydrase xii CII-EP2 lyase activity 1.57 2.18 3.22 C_D013-C10_75 carbonic anhydrase ii inhibitor CII-EP2 lyase activity 3.65 3.28 4.11 S_mge-A048-B3-post17-T3 bone morphogenetic proteintype ia CII-EP2 TGF-beta signaling pathway 2.48 1.99 1.81 C_D019-G3_23 dual specificity phosphatase 7 CII-EP2 MAPK signaling pathway 1.82 2.31 2.64 C_MGE-A027-C11-post82- dynein light chain 2 CII-EP2 ---NA--- 2.08 1.95 1.98 C_MGE-A009-H10-57779-T matrix metalloproteinase 2 CII-EP4 metalloendopeptidase activity 3.88 6.67 1.00 C_mge-A048-D1-post3-T3 tubulin alpha-1 chain CII-EP4 ---NA--- 2.32 2.75 1.00 CIII C_D027-F7_54 h6 family homeobox 3 CIII-EP1 sequence-specific DNA binding 1.00 1.64 1.00 C_mge-B021-H10-prawn79 cyclin b3 CIII-EP1 Cell cycle 1.00 1.73 1.00 S_MGE-A017-E2-post12-T3 polymerase (dna-directed)delta 4 CIII-EP1 DNA replication 1.00 1.82 1.00 S_MGE-A021-G4-post30-T3 mads box transcription enhancer CIII-EP1 sequence-specific DNA binding 1.00 1.57 1.00 S_mge-A030-F6-post45-T3 Echinonectin CIII-EP1 ---NA--- 1.00 1.56 1.00 C_D021-G5_39 transaldolase 1 CIII-EP2 carbohydrate metabolic process 1.64 1.00 1.00 C_MGE-A022-F4-post29-T squamous cell carcinoma antigen CIII-EP2 positive reg. of cell differentiation 1.63 1.00 1.00 C_MGE-A023-A6-post40-T phosphoenolpyruvate carboxykinase 1 CIII-EP2 aerobic respiration 2.10 1.00 1.00 C_mge-B027-F10-prawn77 Nemo like kinase CIII-EP2 ---NA--- 2.06 1.00 1.00 C_mge-B044-C1-prawn2_T acyl-coenzyme ac-4 CIII-EP2 Fatty acid metabolism 1.53 1.00 1.00 C_mge-B045-B10-prawn73 isocitrate lyase CIII-EP2 aerobic respiration 1.64 1.00 1.00 S_MGE-A005-D3-19319-T3 transketolase CIII-EP2 carbohydrate metabolic process 1.51 1.00 1.00 S_MGE-A011-E9-76868-T3 alpha3-fucosyltransferase CIII-EP2 carbohydrate metabolic process 1.61 1.00 1.00 S_MGE-A023-C10-post74-T3 bone morphogenetic proteintype 1b CIII-EP2 positive reg. of cell differentiation 1.57 1.00 1.00 S_mge-A030-E5-post36-T3 formin 2 CIII-EP2 Dorso-ventral axis formation 1.50 1.00 1.00 S_mge-A037-A6-post40-T3 modulator of activity of ets genes CIII-EP2 Dorso-ventral axis formation 2.06 1.00 1.00 S_MGE-A050-D9-post67-T3 aldehyde dehydrogenase CIII-EP2 carbohydrate metabolic process 1.72 1.00 1.00 C_MGE-A006-D10-28975-T Galaxin-like CIII-EP3 ---NA--- 1.90 1.00 -2.23 C_GS01ZF02 catalase CIII-EP3-7 response to oxidative stress 1.64 1.00 -2.05
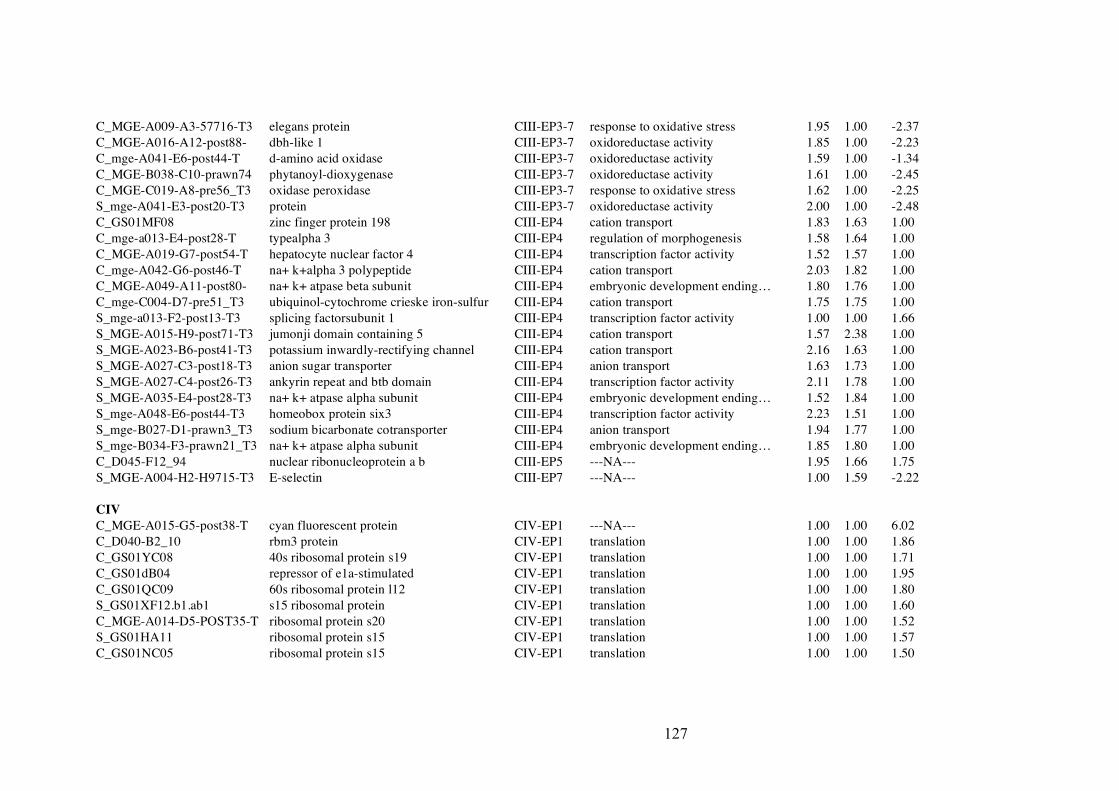
127
C_MGE-A009-A3-57716-T3 elegans protein CIII-EP3-7 response to oxidative stress 1.95 1.00 -2.37 C_MGE-A016-A12-post88- dbh-like 1 CIII-EP3-7 oxidoreductase activity 1.85 1.00 -2.23 C_mge-A041-E6-post44-T d-amino acid oxidase CIII-EP3-7 oxidoreductase activity 1.59 1.00 -1.34 C_MGE-B038-C10-prawn74 phytanoyl-dioxygenase CIII-EP3-7 oxidoreductase activity 1.61 1.00 -2.45 C_MGE-C019-A8-pre56_T3 oxidase peroxidase CIII-EP3-7 response to oxidative stress 1.62 1.00 -2.25 S_mge-A041-E3-post20-T3 protein CIII-EP3-7 oxidoreductase activity 2.00 1.00 -2.48 C_GS01MF08 zinc finger protein 198 CIII-EP4 cation transport 1.83 1.63 1.00 C_mge-a013-E4-post28-T typealpha 3 CIII-EP4 regulation of morphogenesis 1.58 1.64 1.00 C_MGE-A019-G7-post54-T hepatocyte nuclear factor 4 CIII-EP4 transcription factor activity 1.52 1.57 1.00 C_mge-A042-G6-post46-T na+ k+alpha 3 polypeptide CIII-EP4 cation transport 2.03 1.82 1.00 C_MGE-A049-A11-post80- na+ k+ atpase beta subunit CIII-EP4 embryonic development ending… 1.80 1.76 1.00 C_mge-C004-D7-pre51_T3 ubiquinol-cytochrome crieske iron-sulfur CIII-EP4 cation transport 1.75 1.75 1.00 S_mge-a013-F2-post13-T3 splicing factorsubunit 1 CIII-EP4 transcription factor activity 1.00 1.00 1.66 S_MGE-A015-H9-post71-T3 jumonji domain containing 5 CIII-EP4 cation transport 1.57 2.38 1.00 S_MGE-A023-B6-post41-T3 potassium inwardly-rectifying channel CIII-EP4 cation transport 2.16 1.63 1.00 S_MGE-A027-C3-post18-T3 anion sugar transporter CIII-EP4 anion transport 1.63 1.73 1.00 S_MGE-A027-C4-post26-T3 ankyrin repeat and btb domain CIII-EP4 transcription factor activity 2.11 1.78 1.00 S_MGE-A035-E4-post28-T3 na+ k+ atpase alpha subunit CIII-EP4 embryonic development ending… 1.52 1.84 1.00 S_mge-A048-E6-post44-T3 homeobox protein six3 CIII-EP4 transcription factor activity 2.23 1.51 1.00 S_mge-B027-D1-prawn3_T3 sodium bicarbonate cotransporter CIII-EP4 anion transport 1.94 1.77 1.00 S_mge-B034-F3-prawn21_T3 na+ k+ atpase alpha subunit CIII-EP4 embryonic development ending… 1.85 1.80 1.00 C_D045-F12_94 nuclear ribonucleoprotein a b CIII-EP5 ---NA--- 1.95 1.66 1.75 S_MGE-A004-H2-H9715-T3 E-selectin CIII-EP7 ---NA--- 1.00 1.59 -2.22 CIV C_MGE-A015-G5-post38-T cyan fluorescent protein CIV-EP1 ---NA--- 1.00 1.00 6.02 C_D040-B2_10 rbm3 protein CIV-EP1 translation 1.00 1.00 1.86 C_GS01YC08 40s ribosomal protein s19 CIV-EP1 translation 1.00 1.00 1.71 C_GS01dB04 repressor of e1a-stimulated CIV-EP1 translation 1.00 1.00 1.95 C_GS01QC09 60s ribosomal protein l12 CIV-EP1 translation 1.00 1.00 1.80 S_GS01XF12.b1.ab1 s15 ribosomal protein CIV-EP1 translation 1.00 1.00 1.60 C_MGE-A014-D5-POST35-T ribosomal protein s20 CIV-EP1 translation 1.00 1.00 1.52 S_GS01HA11 ribosomal protein s15 CIV-EP1 translation 1.00 1.00 1.57 C_GS01NC05 ribosomal protein s15 CIV-EP1 translation 1.00 1.00 1.50

128
C_mge-C002-H2-pre15_T3 ribosomal protein l26 CIV-EP1 translation 1.00 1.00 1.59 S_mge-A048-F1-post5-T3 ribosomal protein s12 CIV-EP1 translation 1.00 1.00 2.39 C_MGE-A016-C3-post18-T ribosomal protein s12 CIV-EP1 translation 1.00 1.00 1.83 C_mge-C003-E2-pre12_T3 ribosomal protein s24 CIV-EP1 translation 1.00 1.00 1.59 C_GS01ZE08 ribosomal protein l27 CIV-EP1 translation 1.00 1.00 1.60 S_GS01HE04 40s ribosomal protein s19 CIV-EP1 translation 1.00 1.00 1.55 C_MGE-A001-A12-post88- ribosomal protein s7 CIV-EP1 translation 1.00 1.00 1.55 C_D034-D7_52 ets variant gene 6 (tel oncogene) CIV-EP1 pattern specification process 1.00 1.00 2.16 C_D009-H8 transcription factor mafb CIV-EP1 pattern specification process 1.00 1.00 2.16 C_MGE-A031-G1-post6-T3 paired box protein 7 CIV-EP1 pattern specification process 1.00 1.00 20.53 C_MGE-A022-F7-post53-T sprouty homolog 3 CIV-EP1 pattern specification process 1.00 1.00 1.58 S_mge-B022-G12-prawn_T3 cytoplasmic polyadenylation CIV-EP1 pattern specification process 1.00 1.00 1.52 C_mge-B035-A4-prawn24_ sonic hedgehog CIV-EP1 pattern specification process 1.00 1.00 1.93 S_mge-A042-G5-post38-T3 snf1-like kinase CIV-EP1 regulation of cell differentiation 1.00 1.00 3.41 C_D024-A3_17 transcription factor ighm enhancer 3 CIV-EP1 regulation of cell differentiation 1.00 1.00 2.30 C_MGE-A018-C8-post58-T activating transcription factor 4 CIV-EP1 regulation of cell differentiation 1.00 1.00 2.29 C_mge-B023-C3-prawn18_ btgmember 2 CIV-EP1 regulation of cell differentiation 1.00 1.00 5.06 S_GS01vA01 beta-catenin CIV-EP1 Wnt signaling pathway 1.00 1.00 1.58 S_MGE-A023-F2-post13-T3 Notch-like protein CIV-EP1 Notch signaling pathway 1.00 1.00 1.63 S_mge-A045-D10-post75-T3 snail homolog 1 CIV-EP1 Adherens junction 1.00 1.00 1.81 S_MGE-A017-H8-post63-T3 heat shock protein 70 CIV-EP1 MAPK signaling pathway 1.00 1.00 1.54 C_D006-B2 profilin CIV-EP1 Regulation of actin cytoskeleton 1.00 1.00 1.56 C_mge-A043-F1-post5-T3 alpha 1 CIV-EP1 Regulation of actin cytoskeleton 1.00 1.00 1.63 C_MGE-A049-H4-post31-T Actin CIV-EP1 Regulation of actin cytoskeleton 1.00 1.00 2.37 C_D009-C6 Gelsolin CIV-EP1 ---NA--- 1.00 1.00 1.88 S_MGE-A034-B11-post81-T3 syntaxin 6 CIV-EP1 SNARE vesicular transport 1.00 1.00 1.68 C_D009-C9 v-jun sarcoma oncogene-like CIV-EP2 transcription regulator activity 2.22 1.00 9.13 C_MGE-A012-C12-86590-T yes-associated protein 1 CIV-EP2 transcription regulator activity 1.72 1.00 3.28 S_MGE-A031-G12-post94-T3 cryptochrome 2 CIV-EP2 response to abiotic stimulus 1.58 1.00 4.08 C_MGE-A017-B1-post1-T3 heat shock transcription factor 1 CIV-EP2 response to abiotic stimulus 1.87 1.00 2.28 S_MGE-A009-G12-57794-T3 cryptochrome 1 (photolyase-like) CIV-EP2 response to abiotic stimulus 1.64 1.00 2.57 S_mge-A044-B6-post41-T3 fgfr3 protein CIV-EP3 skeletal system development 1.00 1.54 1.89 C_mge-A045-C3-post18-T typealpha 1 CIV-EP3 skeletal system development 1.00 2.05 2.19 C_MGE-A012-H12-86595-T collagen triple helix repeat CIV-EP3 extracellular matrix part 1.00 1.74 2.93
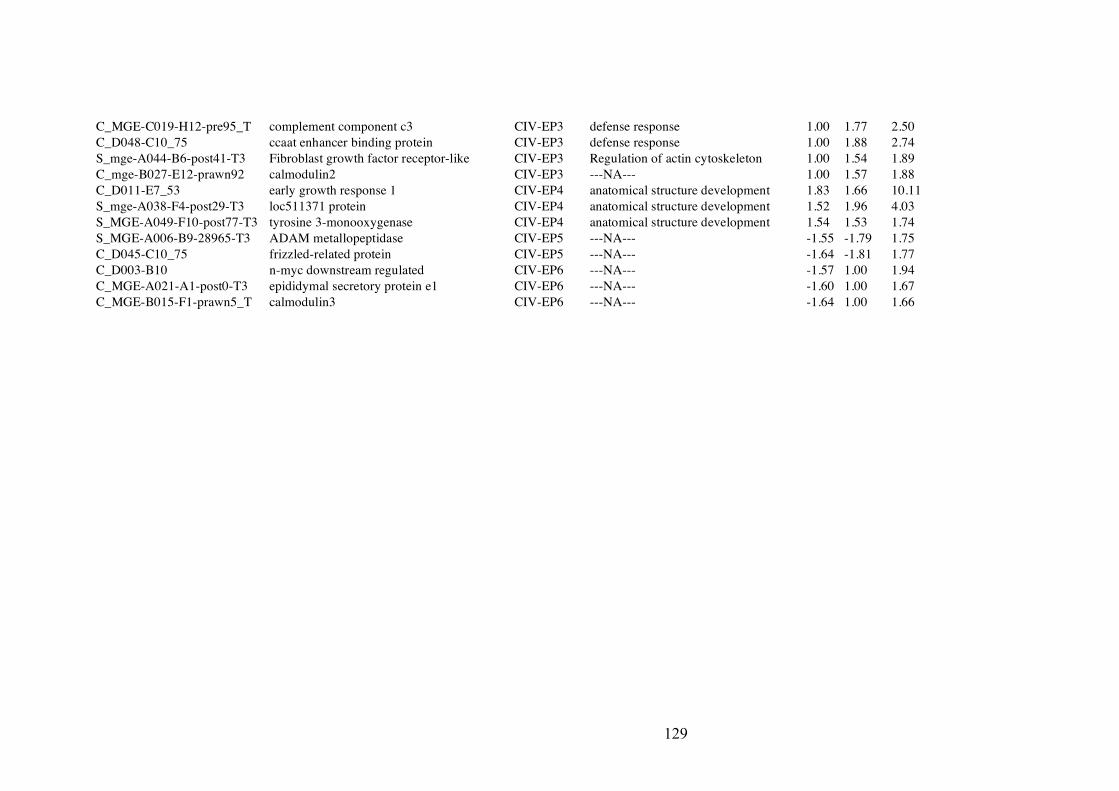
129
C_MGE-C019-H12-pre95_T complement component c3 CIV-EP3 defense response 1.00 1.77 2.50 C_D048-C10_75 ccaat enhancer binding protein CIV-EP3 defense response 1.00 1.88 2.74 S_mge-A044-B6-post41-T3 Fibroblast growth factor receptor-like CIV-EP3 Regulation of actin cytoskeleton 1.00 1.54 1.89 C_mge-B027-E12-prawn92 calmodulin2 CIV-EP3 ---NA--- 1.00 1.57 1.88 C_D011-E7_53 early growth response 1 CIV-EP4 anatomical structure development 1.83 1.66 10.11 S_mge-A038-F4-post29-T3 loc511371 protein CIV-EP4 anatomical structure development 1.52 1.96 4.03 S_MGE-A049-F10-post77-T3 tyrosine 3-monooxygenase CIV-EP4 anatomical structure development 1.54 1.53 1.74 S_MGE-A006-B9-28965-T3 ADAM metallopeptidase CIV-EP5 ---NA--- -1.55 -1.79 1.75 C_D045-C10_75 frizzled-related protein CIV-EP5 ---NA--- -1.64 -1.81 1.77 C_D003-B10 n-myc downstream regulated CIV-EP6 ---NA--- -1.57 1.00 1.94 C_MGE-A021-A1-post0-T3 epididymal secretory protein e1 CIV-EP6 ---NA--- -1.60 1.00 1.67 C_MGE-B015-F1-prawn5_T calmodulin3 CIV-EP6 ---NA--- -1.64 1.00 1.66

130
5. 7. REFERENCES.
Allemand D, Tambutte E, Girard JP, Jaubert J (1998) Organic matrix synthesis in the scleractinian coral stylophora pistillata: role in biomineralization and potential target of the organotin tributyltin. J Exp Biol 201 (Pt 13): 2001-2009 Allemand D, Ferrier-Pages, Christine., Furla, Paola., Houlbreque Fanny., Paverel, Sandrine., Reynaud Sttephanie., Tambutte, Eric., Tambutte, Sylvie and Zoccola Didier. (2004) Biomineralization in reef-building corals: from molecular mechanisms to environmental control. General Palaentology 3: 453- 467 Ameye L, De Becker G, Killian C, Wilt F, Kemps R, Kuypers S, Dubois P (2001) Proteins and saccharides of the sea urchin organic matrix of mineralization: characterization and localization in the spine skeleton. J Struct Biol 134: 56-66 Arbeitman MN, Furlong EE, Imam F, Johnson E, Null BH, Baker BS, Krasnow MA, Scott MP, Davis RW, White KP (2002) Gene expression during the life cycle of Drosophila melanogaster. Science 297: 2270-2275 Azumi K, Sabau SV, Fujie M, Usami T, Koyanagi R, Kawashima T, Fujiwara S, Ogasawara M, Satake M, Nonaka M, Wang HG, Satou Y, Satoh N (2007) Gene expression profile during the life cycle of the urochordate Ciona intestinalis. Dev Biol 308: 572-582 Baldessari D, Shin Y, Krebs O, Konig R, Koide T, Vinayagam A, Fenger U, Mochii M, Terasaka C, Kitayama A, Peiffer D, Ueno N, Eils R, Cho KW, Niehrs C (2005) Global gene expression profiling and cluster analysis in Xenopus laevis. Mech Dev 122: 441-475 Baguna J, Martinez P, Paps J, Riutort M (2008) Back in time: a new systematic proposal for the Bilateria. Philos Trans R Soc Lond B Biol Sci 363:148- 1491 Babcock RC, Heyward AJ (1986) Larval development of certain gamete-spawning scleractinian corals. Coral Reefs 5: 111-116 Benaim, G. and Villalobo, A. (2002). Phosphorylation of calmodulin. Functional implications. Eur J Biochem 269, 3619-31. Benjamini. Y., Hochberg, Y. (1991). Controlling the false discovery rate: apractical and powerful approach to multiple testing. J R Statist Soc B, 57:289-300. Berry R, Jowitt TA, Ferrand J, Roessle M, Grossmann JG, Canty-Laird EG, Kammerer RA, Kadler KE, Baldock C (2009) Role of dimerization and substrate exclusion in the regulation of bone morphogenetic protein-1 and mammalian tolloid. Proc Natl Acad Sci U S A 106:8561-8566 Bode HR (1996) The interstitial cell lineage of hydra: a stem cell system that arose
early in evolution. J Cell Sci 109 :1155-64 Bonar DB, and Fitt, W. (1990) Control of oyster settlement and metamorphosis by endogenous and exogenous cues. Bull. Marine Sci. 46: 484-498 Bou-Abdallah F, Chasteen ND, Lesser MP (2006) Quenching of superoxide radicals by green fluorescent protein. Biochim Biophys Acta 1760:1690-1695 Brookes PS, Levonen AL, Shiva S, Sarti P, Darley-Usmar VM (2002) Mitochondria: regulators of signal transduction by reactive oxygen and nitrogen species. Free Radic Biol Med 33: 755-764 Cadigan KM, Nusse R (1997) Wnt signaling: a common theme in animal development. Genes Dev 11:3286-3305

131
Carafoli, E. (2003). Historical review: mitochondria and calcium: ups and downs of an unusual relationship. Trends Biochem Sci 28, 175-81. Carafoli, E. (2004). Calcium-mediated cellular signals: a story of failures. Trends Biochem Sci 29, 371-9. Chia F.-S. and Koss, R. (1979) Fine Structural Studies of the Nervous System and the Apical Organ in the Planula Larva of the Sea Anemone Antopleura elegantissima. MORPH 160: 275-298 Clode PL, Marshall AT (2002b) Low temperature X-ray microanalysis of calcium in a scleractinian coral: evidence of active transport mechanisms. J Exp Biol 205: 3543-3552 Clode PL, Marshall AT (2003) Calcium associated with a fibrillar organic matrix in the scleractinian coral Galaxea fascicularis. Protoplasma 220: 153-161 Clode PL, Marshall AT (2004) Calcium localisation by X-ray microanalysis and fluorescence microscopy in larvae of zooxanthellate and azooxanthellate corals. Tissue Cell 36: 379-390 Cyert MS (2001) Genetic analysis of calmodulin and its targets in Saccharomyces cerevisiae. Annu Rev Genet 35: 647-672 Dale L, Wardle FC (1999) A gradient of BMP activity specifies dorsal-ventral fates in early Xenopus embryos. Semin Cell Dev Biol 10:319-326 Dennery PA (2007) Effects of oxidative stress on embryonic development. Birth Defects Res C Embryo Today 81: 155-162 Finkel T (2000) Redox-dependent signal transduction. FEBS Lett 476: 52-54 Finnerty JR, Pang K, Burton P, Paulson D, Martindale MQ (2004) Origins of bilateral symmetry: Hox and dpp expression in a sea anemone. Science 304:1335-1337 Fukuda I, Ooki S, Fujita T, Murayama E, Nagasawa H, Isa Y, Watanabe T (2003) Molecular cloning of a cDNA encoding a soluble protein in the coral exoskeleton. Biochem Biophys Res Commun 304: 11-17 Gaur T, Rich L, Lengner CJ, Hussain S, Trevant B, Ayers D, Stein JL, Bodine PV, Komm BS, Stein GS, Lian JB (2006) Secreted frizzled related protein 1 regulates Wnt signaling for BMP2 induced chondrocyte differentiation. J Cell Physiol 208:87-96 Gerhart J (1999) 1998 Warkany lecture: signaling pathways in development. Teratology 60: 226-239 Gladfelter EH (1982) Skeletal development in Acropora cervicornis: I. Patterns of calcium carbonate accretion in the axial corallite. Coral Reefs, 1:45-51 Gordon WR, Arnett KL, Blacklow SC (2008) The molecular logic of Notch signaling a structural and biochemical perspective. J Cell Sci 121: 3109-3119 Goreau NI, Hayes RL (1977) Nucleation catalysis in coral skeletogenesis. Proc 3rd
Intl Coral Reef Symp, 439-445. Grasso LC, Maindonald J, Rudd S, Hayward DC, Saint R, Miller DJ, Ball EE (2008) Microarray analysis identifies candidate genes for key roles in coral development. BMC Genomics 9: 540 Ge G, Seo NS, Liang X, Hopkins DR, Hook M, Greenspan DS (2004) Bone morphogenetic protein-1/tolloid-related metalloproteinases process osteoglycin and enhance its ability to regulate collagen fibrillogenesis. J Biol Chem 279:41626-41633 Ge G, Greenspan DS (2006) Developmental roles of the BMP1/TLD metalloproteinases. Birth Defects Res C Embryo Today 78:47-68 Greenspan DS. 2005. Biosynthetic processingof collagenmolecules. Top Curr Chem 247:149–183

132
Greenspan DS, Wang W-M. 2005. Overviewof ADAMTS proteases and ADAMTS-2 (procollagen IIIN-proteinase). In: Hooper NM, Lendeckel U, editors.The ADAMs Family of Proteases: Proteasesin Biology and Disease, vol 4.Amsterdam: Springer-Verlag. pp. 261–282. Gunderson L (2007) Ecology: a different route to recovery for coral reefs. Curr Biol 17: R27-28 Hadfield MG (2000) Why and how marine-invertebrate larvae metamorphose so fast. Semin Cell Dev Biol 11: 437-443 Haeseleer F, Jang GF, Imanishi Y, Driessen CA, Matsumura M, Nelson PS, Palczewski K (2002) Dual-substrate specificity short chain retinol dehydrogenases from the vertebrate retina. J Biol Chem 277: 45537-45546 Hand C, Uhlinger K (1992) The culture, Sexual and Asexual Reproduction and Growth of the Sea Anemone Nematostella vectensis. Biol Bull 182: 169-176 Hardie DH (1991) Bichemical Messengers. University Press, Cambridge, Cambridge (310) Harel M, Ben-Dov E, Rasoulouniriana D, Siboni N, Kramarsky-Winter E, Loya Y, Barak Z, Wiesman Z, Kushmaro A (2008) A new Thraustochytrid, strain Fng1, isolated from the surface mucus of the hermatypic coral Fungia granulosa. FEMS Microbiol Ecol 64: 378-387 Hayward DC, Catmull J, Reece-Hoyes JS, Berghammer H, Dodd H, Hann SJ, Miller DJ, Ball EE (2001) Gene structure and larval expression of cnox-2Am from the coral Acropora millepora. Dev Genes Evol 211: 10-19 Hayward DC, Samuel G, Pontynen PC, Catmull J, Saint R, Miller DJ, Ball EE (2002)
Localized expression of a dpp/BMP2/4 ortholog in a coral embryo. Proc Natl Acad Sci U S A 99:8106-8111
Heyland A, Moroz L (2006) Signaling mechanisms inderlying metamorphic transitions in animals. Integrative and Comparative Biology 46: 743-759 Hill AA, Hunter CP, Tsung BT, Tucker-Kellogg G, Brown EL (2000) Genomic analysis of gene expression in C. elegans. Science 290: 809-812 Honore B, Vorum H (2000) The CREC family, a novel family of multiple EF-hand, low-affinity Ca(2+)-binding proteins localised to the secretory pathway of mammalian cells. FEBS Lett 466: 11-18 Hotchin NA, Hall A (1996) Regulation of the actin cytoskeleton, integrins and cell growth by the Rho family of small GTPases. Cancer Surv 27: 311-322 Isa Y and Yamazato K. (1984) The distribution of carbonic anhydrase in a staghorn coral Acropora hebes (Dana). Galaxea 3: 25-36 Isa Y and Okasaki, M. (1987) Some observations on the Ca2+-binding phospholipids from scleractinian coral skeletons. Comp. Biochem. Physiol. 87B: 507-512 Jackson DJ, Macis L, Reitner J, Degnan BM, Worheide G (2007) Sponge paleogenomics reveals an ancient role for carbonic anhydrase in skeletogenesis. Science 316: 1893-1895 Jasuja R, Ge G, Voss NG, Lyman-Gingerich J, Branam AM, Pelegri FJ, Greenspan DS (2007) Bone morphogenetic protein 1 prodomain specifically binds and regulates signaling by bone morphogenetic proteins 2 and 4. J Biol Chem 282:9053-9062 Johnson CR, and Giddins, R (1991) Settlement of crown of thorns starfish: role of bacteria on surface of coralline algae and a hypothesis for deep water recruitment. Mar. Ecol. Prog. Ser. 71: 143-162

133
Jung DH, Mo SH, Kim DH (2006) Calumenin, a multiple EF-hands Ca2+-binding protein, interacts with ryanodine receptor-1 in rabbit skeletal sarcoplasmic reticulum. Biochem Biophys Res Commun 343: 34-42 Kang D, Hamasaki N (2003) Mitochondrial oxidative stress and mitochondrial DNA. Clin Chem Lab Med 41: 1281-1288 Kass-Simon G, Pierobon P (2007) Cnidarian chemical neurotransmission, an updated overview. Comp Biochem Physiol A Mol Integr Physiol 146: 9-25 Katsukura Y, Ando H, David CN, Grimmelikhuijzen CJ, Sugiyama T (2004) Control of planula migration by LWamide and RFamide neuropeptides in Hydractinia echinata. J Exp Biol 207: 1803-1810 Katsukura Y, David CN, Grimmelikhuijzen CJ, Sugiyama T (2003) Inhibition of metamorphosis by RFamide neuropeptides in planula larvae of Hydractinia echinata. Dev Genes Evol 213: 579-586 Kerr AM (2005) Molecular and morphological supertree of stony corals (Anthozoa: Scleractinia) using matrix representation parsimony. Biol Rev Camb Philos Soc 80: 543-558 Khan SR, Atmani F, Glenton P, Hou Z, Talham DR, Khurshid M (1996) Lipids and membranes in the organic matrix of urinary calcific crystals and stones. Calcif Tissue Int 59: 357-365 Kobayashi T, Lyons KM, McMahon AP, Kronenberg HM (2005) BMP signaling stimulates cellular differentiation at multiple steps during cartilage development. Proc Natl Acad Sci U S A 102:18023-18027 Koga T, Inui M, Inoue K, Kim S, Suematsu A, Kobayashi E, Iwata T, Ohnishi H, Matozaki T, Kodama T, Taniguchi T, Takayanagi H, Takai T (2004) Costimulatory signals mediated by the ITAM motif cooperate with RANKL for bone homeostasis. Nature 428: 758-763 Kusserow A, Pang K, Sturm C, Hrouda M, Lentfer J, Schmidt HA, Technau U, von Haeseler A, Hobmayer B, Martindale MQ, Holstein TW (2005) Unexpected complexity of the Wnt gene family in a sea anemone. Nature 433:156-160 Le Tissier M (1988) Patterns of formation and the ultrastructure of the larval skeleton of Pocillopora damicornis. Marine Biology 98: 493-501 Macdonald GA, Prins JB (2004) Peroxisomal fatty acid metabolism, peroxisomal proliferator-activated receptors and non-alcoholic fatty liver disease. J Gastroenterol Hepatol 19: 1335-1337 Medeck RJ, Sosa S, Morris N, Oxford JT (2003) BMP-1-mediated proteolytic processing of alternatively spliced isoforms of collagen type XI. Biochem J 376:361-368 Magie CR, Martindale MQ (2008) Cell-cell adhesion in the cnidaria: insights into the evolution of tissue morphogenesis. Biol Bull 214: 218-232 Marhaver KL, Edwards RA, Rohwer F (2008) Viral communities associated with healthy and bleaching corals. Environ Microbiol 10: 2277-2286 Marlow HQ, Martindale MQ (2007) Embryonic development in two species of scleractinian coral embryos: Symbiodinium localization and mode of gastrulation. Evol Dev 9: 355-367 Martin V, Archer W (1997) Stages of larval development and stem cell population
changes during metamorphosis of a hydrozoan planula. Biol Bull 192:41-52 Matsushiro A, Miyashita T (2004) Evolution of hard-tissue mineralization:
comparison of the inner skeletal system and the outer shell system. J Bone Miner Metab 22:163-169

134
Matus DQ, Magie CR, Pang K, Martindale MQ, Thomsen GH (2008) The Hedgehog gene family of the cnidarian, Nematostella vectensis, and implications for understanding metazoan Hedgehog pathway evolution. Dev Biol 313: 501-518 Matus DQ, Pang K, Daly M, Martindale MQ (2007) Expression of Pax gene family
members in the anthozoan cnidarian, Nematostella vectensis. Evol Dev 9: 25-38
Medina M, Collins AG, Takaoka TL, Kuehl JV, Boore JL (2006) Naked corals: skeleton loss in Scleractinia. Proc Natl Acad Sci U S A 103: 9096-9100 Miller MB, Bassler BL (2001) Quorum sensing in bacteria. Annu Rev Microbiol 55: 165-199 Moya A, Tambutte S, Bertucci A, Tambutte E, Lotto S, Vullo D, Supuran CT,
Allemand D, Zoccola D (2008) Carbonic anhydrase in the scleractinian coral Stylophora pistillata: characterization, localization, and role in biomineralization. J Biol Chem 283:25475-25484
Nakanishi N, Yuan D, Jacobs DK, Hartenstein V (2008) Early development, pattern, and reorganization of the planula nervous system in Aurelia (Cnidaria, Scyphozoa). Dev Genes Evol 218: 511-524 Ng KW, Speicher, T., Dombrowski, C., Helledie, T., Haupt, L.M., Nurcombe, V., and Cool, S.M. (2007) Osteogenic Differentiation of Murine Embryonic Stem Cells Is Mediated by Fibroblast Growth Factor Receptors. Stem Cells and Development 16: 305-317 Oliver, J. K., Chalker, B. E., Dunlap, W. C. (1983). Bathymetricadaptations of reef- building corals at Davies Reef, GreatBamer Reef, Australia, I. Long-term growth responses ofAcropora formosa (Dana 1846) J, exp. mar. Biol. Ecol. 73:11-35 Pang K, Matus DQ, Martindale MQ (2004) The ancestral role of COE genes may have been in chemoreception: evidence from the development of the sea anemone, Nematostella vectensis (Phylum Cnidaria; Class Anthozoa). Dev Genes Evol 214: 134-138 Puverel S, Tambutte E, Pereira-Mouries L, Zoccola D, Allemand D, Tambutte S (2005b) Soluble organic matrix of two Scleractinian corals: partial and comparative analysis. Comp Biochem Physiol B Biochem Mol Biol 141: 480- 487 Raha S, Robinson BH (2000) Mitochondria, oxygen free radicals, disease and ageing. Trends Biochem Sci 25: 502-508 Raychaudhury B, Gupta S, Banerjee S, Datta SC (2006) Peroxisome is a reservoir of intracellular calcium. Biochim Biophys Acta 1760: 989-992 Reber-Muller S, Streitwolf-Engel R, Yanze N, Schmid V, Stierwald M, Erb M, Seipel K (2006) BMP2/4 and BMP5-8 in jellyfish development and transdifferentiation. Int J Dev Biol 50:377-384 Rentzsch F, Anton R, Saina M, Hammerschmidt M, Holstein TW, Technau U (2006) Asymmetric expression of the BMP antagonists chordin and gremlin in the sea anemone Nematostella vectensis: implications for the evolution of axial patterning. Dev Biol 296:375-387 Rentzsch F, Fritzenwanker JH, Scholz CB, Technau U (2008) FGF signalling controls formation of the apical sensory organ in the cnidarian Nematostella vectensis. Development 135: 1761-1769

135
Reyes-Bermudez A, DeSalvo, M.K., Voolstra, C.R., Sunagawa, S., Szmant, A.M., Iglesias-Prieto, R., and Medina, M. (2009) Gene expression microarray analysis encompassing metamorphosis and the onset of calcification in the scleractinian coral Montastraea faveolata. Marine Genomics. In press. Rogers CL, Thomas MB (2001) Calcification in the planula and polyp of the hydroid Hydractinia symbiolongicarpus (Cnidaria, Hydrozoa). J Exp Biol 204: 2657- 2666 Romano SL, Palumbi SR (1997) Molecular evolution of a portion of the mitochondrial 16S ribosomal gene region in scleractinian corals. J Mol Evol 45: 397-411 Samuel G, Miller, D. and Saint, R. (2001) Conservation of a DPP/BMP signalling pathway in the nonbilateral cnidarian Acropora millepora. Evolution & Development 3: 241-250 Sciaudone M, Gazzerro E, Priest L, Delany AM, Canalis E (2003) Notch 1 impairs osteoblastic cell differentiation. Endocrinology 144: 5631-5639 Schwarz JA, Brokstein PB, Voolstra C, Terry AY, Manohar CF, Szmant AM, Coffroth MA, Miller DJ, Medina M (2008) Coral Life History and Symbiosis: functional genomic resources for two reef building Caribbean corals, Acropora palmata and Montastraea faveolata. BMC Genomics 9: 97 Scott IC, Imamura Y, Pappano WN, Troedel JM, Recklies AD, Roughley PJ, Greenspan DS (2000) Bone morphogenetic protein-1 processes probiglycan. J Biol Chem 275:30504-30511 Selfors LM, Schutzman JL, Borland CZ, Stern MJ (1998) soc-2 encodes a leucine- rich repeat protein implicated in fibroblast growth factor receptor signaling. Proc Natl Acad Sci U S A 95: 6903-6908 Siboni N, Ben-Dov E, Sivan A, Kushmaro A (2008) Global distribution and diversity of coral-associated Archaea and their possible role in the coral holobiont nitrogen cycle. Environ Microbiol Smith-Keune C, Dove S (2008) Gene expression of a green fluorescent protein homolog as a host-specific biomarker of heat stress within a reef-building coral. Mar Biotechnol (NY) 10:166-180 Smyth, G. K., and Speed, T. P. (2003). Normalization of cDNA microarray data. Methods 31, 265-273 Smyth, G. K. (2004). Linear models and empirical Bayes methods for assessing differential expression in microarray experiments. Statistical Applications in Genetics and Molecular Biology 3, No. 1, Article 3 Smyth, G. K. (2005). Limma: linear models for microarray data. In: Bioinformatics and Computational Biology Solutions using R and Bioconductor, R. Gentleman, V. Carey, S. Dudoit, R. Irizarry, W. Huber (eds.), Springer, New York, pages 397-420. Stanley GD, Jr. (2006) Ecology. Photosymbiosis and the evolution of modern coral reefs. Science 312: 857-858 Szmant-Froelich A, Yevich P, Pilson MEQ (1980) Gametogenesis and early development of the temperate coral Astrangia danae (Anthozoa: Scleractinia).Biological Bulletin 158: 257-269 Tambutte, Eacute, Eacute, Allemand D, Mueller E, Jaubert J (1996) A compartmental approach to the mechanism of calcification in hermatypic corals. J Exp Biol 199: 1029-1041 Tambutté S, Tambutté, E., Zoccola D., Caminiti, N., Lotto, S., Moya, A., Allemand, D., and Adkins, J. (2007) Characterization and role of carbonic anhydrase in

136
the calcification process of the azooxanthellate coral Tubastrea aurea. Marine Biology 151: 71-83 Technau U, Scholz CB (2003) Origin and evolution of endoderm and mesoderm. Int J Dev Biol 47: 531-539 Tran H, Pankov R, Tran SD, Hampton B, Burgess WH, Yamada KM (2002) Integrin clustering induces kinectin accumulation. J Cell Sci 115: 2031-2040 Tunnicliffe, V. (1983). Caribbean staghom coral populations: pre-hurricane Allen conditions in Discovery Bay, Jamaica.Bull. mar. Sci. 33: 132-151 Unsold C, Pappano WN, Imamura Y, Steiglitz BM, Greenspan DS (2002) Biosynthetic processing of the pro-alpha 1(V)2pro-alpha 2(V) collagen heterotrimer by bone morphogenetic protein-1 and furin-like proprotein convertases. J Biol Chem 277:5596-5602 Vallar L, Melchior C, Plancon S, Drobecq H, Lippens G, Regnault V, Kieffer N (1999) Divalent cations differentially regulate integrin alphaIIb cytoplasmic tail binding to beta3 and to calcium- and integrin-binding protein. J Biol Chem 274: 17257-17266 Vandermeulen, J. H. (1974). Studies on Reefs Corals.II. Fine Structure of PlanktonicPlanula Larva of Pocillopora damicornis, with Emphasis on the Aboral Epidermis. Marine Biology 27, 239-249. Vandermeulen JH, Watabe N (1973) Studies on Reef Corals. I. Skeleton Formation by Newly Settled Planula Larva of Pocillopora damicornis. Marine Biology 23: 47-57 Vetter, S. W. and Leclerc, E. (2003). Novel aspects of calmodulin target recognition and activation. Eur J Biochem 270, 404-14. Wajih N, Hutson SM, Wallin R (2006) siRNA silencing of calumenin enhances functional factor IX production. Blood 108: 3757-3760 Wajih N, Sane DC, Hutson SM, Wallin R (2004) The inhibitory effect of calumenin on the vitamin K-dependent gamma-carboxylation system. Characterization of the system in normal and warfarin-resistant rats. J Biol Chem 279: 25276- 25283 Watanabe T, Fukuda I, China K, Isa Y (2003) Molecular analyses of protein components of the organic matrix in the exoskeleton of two scleractinian coral species. Comp Biochem Physiol B Biochem Mol Biol 136: 767-774 Wei Z, Angerer RC, Angerer LM (2006) A database of mRNA expression patterns for the sea urchin embryo. Dev Biol 300: 476-484 Williams EA, Degnan BM, Gunter H, Jackson DJ, Woodcroft BJ, Degnan SM (2009) Widespread transcriptional changes pre-empt the critical pelagic-benthic transition in the vetigastropod Haliotis asinina. Mol Ecol 18: 1006-1025 Woollacott RM, and Hadfield, M.G. (1996) Induction of metamorphosis in larvae of sponge. Invert. Biol. 115: 257-262 Wozney JM, Rosen V, Celeste AJ, Mitsock LM, Whitters MJ, Kriz RW, Hewick RM,
Wang EA (1988) Novel regulators of bone formation: molecular clones and activities. Science 242:1528-1534
Yuan JP, Kiselyov K, Shin DM, Chen J, Shcheynikov N, Kang SH, Dehoff MH, Schwarz MK, Seeburg PH, Muallem S, Worley PF (2003) Homer binds TRPC family channels and is required for gating of TRPC1 by IP3 receptors. Cell 114: 777-789 Zamurovic N, Cappellen D, Rohner D, Susa M (2004) Coordinated activation of notch, Wnt, and transforming growth factor-beta signaling pathways in bone morphogenic protein 2-induced osteogenesis. Notch target gene Hey1 inhibits

137
mineralization and Runx2 transcriptional activity. J Biol Chem 279:37704- 37715 Zeng YA, Rahnama M, Wang S, Sosu-Sedzorme W, Verheyen EM (2007) Drosophila Nemo antagonizes BMP signaling by phosphorylation of Mad and inhibition of its nuclear accumulation. Development 134:2061-2071 Zheng Q, Wang XJ (2008) GOEAST: a web-based software toolkit for Gene Ontology enrichment analysis. Nucleic Acids Research 36: W358-W363 Zoccola D, Moya A, Beranger GE, Tambutte E, Allemand D, Carle GF, Tambutte S
(2009) Specific expression of BMP2/4 ortholog in biomineralizing tissues of corals and action on mouse BMP receptor. Mar Biotechnol (NY) 11:260-269

138
CHAPTER 6. GENERAL DISCUSSION.
6. 1. Coral metamorphosis and the calicoblastic ectoderm.
Metamorphosis in scleractinian corals is a unique process that differs significantly
from that experienced by other anthozoans. During this transition, tissue
morphogenesis gives rise to a calcifying epithelium responsible for the secretion of
the coral skeleton (Puverel et al., 2005) that forms the basis of coral reefs (Veron,
2000; Gunderson, 2007). Coral metamorphosis involves two major morphological
changes 1) an oral endodermal rearrangement that gives rise to the mesenteries and 2)
an aboral ectodermal process that generates the calcifying tissue. This latter involves
the reorganization of the aboral ectoderm, from a columnar epithelium into a
squamous calcifying cell type known as the “calicoblast” (Vandermeulen, 1974;
Clode and Marshall, 2004).
In hydrozoans, an interstitial population of undifferentiated cells (I-cells) in a constant
mitotic cycle migrates and differentiates into tissue specific cell types during
metamorphosis, asexual reproduction and/or regenerative processes (Hyman 1940;
Martin 1990; Bode 1996). In the hydroid Pennaria tiarella, this I-cell population
increases in number during development, reaching its peak at the planula stage
(Martin and Archer 1997). The identification of a small rounded cell type whose
morphology resembles that of interstitial cells from hydrozoans (Hyman 1940) in all
the Acropora stages used to originate primary cell cultures (chapter 2), together with
the result that cultures originated from planulae gave characteristically higher yields
in semi-quantitative PCR using coral specific primers, suggests that an I-cell like
population capable of founding cell cultures increases in abundance during the
development of coral larvae. I-cells in anthozoans have only been associated to
gamete differentiation (Gaino et al, 2008), however, all of the cell types derived from
I-cells in hydrozoans (gland cells, neurons, nematocysts and gametes; Bode 1996) are
present in anthozoans (Hyman 1940). In corals, pluripotent cell populations could also
be the precursors of adult specific cell types, including those that appear only after
metamorphosis such as calicoblasts and desmocytes.

139
The results of microarray analysis (chapter 5) can be interpreted with reference to this
hypothesis. The up-regulation in both planula and adult polyps of molecules involved
in pattern specification processes (GO:0007389) and the regulation of cell
differentiation (GO:0045595)(Table 5.2) supports this idea. Furthermore, up-
regulation in planulae of molecules belonging to the GO categories: positive
regulators of apoptosis (GO:0043065) and larval development (GO:002164) as well
as a number of components of conserved signalling pathways known to regulate
apoptosis, cell differentiation, migration and proliferation across the Metazoa (Table
5.2), suggest that to some extent morphogenesis of adult structures is initiated at the
planula stage. Consistent with this, there is evidence that adult structures such as
mesenteries may be formed before settlement in corals (Vandermeulen, 1974;
Babcock and Heyward, 1983; Szmant-Froelich et al., 1980).
According to this, is reasonable to think that some adult cell types may arise from
partially committed precursors that originate prior to settlement, and that these are
able to differentiate into adult specific cell types during metamorphosis, asexual
reproduction, growth and regeneration as is the case in hydrozoans. The observed up-
regulation in planulae and adult polyps of molecules whose orthologs induce
chondrocyte differentiation in mammals (chapter 5) is consistent with the idea that
calicoblast precursors originate in Acropora planulae prior to metamorphosis. On the
other hand, the finding that a coral specific CaM-like molecule that interacts in vitro
with Acropora CaM (chapter 4), alpha type 1 collagen - one of the major structural
components of bone (Ge and Greenspan, 2006) - and an FGF receptor (FGF signaling
mediates osteogenic differentiation in mammals; Selfors et al., 1998; Ng et al., 2007)
were up-regulated in primary and adult polyps suggests that calcium signaling might
regulate the final stages of calicoblast differentiation in Acropora.
The finding that a number of EF-hand calcium sensors such as calmodulin,
calumenin, calbindin, calreticulin and calcineurin (Table 5.2) were up-regulated in
planulae indicates that calcium signaling is a key regulator of planula cellular activity
and might be involved in the signaling transduction mechanisms leading to settlement
and metamorphosis. Despite this, the extent at which cellular differentiation
mechanisms in corals resemble those described in better characterised model

140
organisms and the nature of coral stem cells remain unclear. More research is needed
to test and validate these observations.
6. 2. Coral calcification and the organic matrix.
After settlement, juvenile polyps secrete a species-specific corallite that constitutes a
precursor to colony morphology. The structure of the primary corallite has been used
since the 19th century for taxonomic purposes as its structure reflects the major
scleractinian phylogenetic lineages (Le Tissier, 1988; Vandermeuden and Watabe,
1973; Cuif and Dauphin, 2005). Juvenile skeletons differ from adult skeletons in both
structure and crystal type. While juvenile skeletons are lightly mineralised with
smaller random orientated crystals of both calcite and aragonite, adult skeletons
display a fibrous parallel growth that allows massive aragonite calcification
(Vandermeuden and Watabe, 1973).
Two different calcifying regions give rise to the juvenile skeleton. The first of these is
the base of the polyp, which is responsible for the deposition of the first skeletal
elements to be formed – the basal plate and protosepta – and these contain both calcite
and aragonite crystals. The second calcifying region is the mesenteries. These are
responsible for the massive parallel aragonite growth characteristic of adult
calcification (Le Tissier, 1988; Vandermeuden, 1974; Vandermeuden and Watabe,
1973). The latter type of calcification is evident 72 hours after settlement
(Vandermeuden and Watabe, 1973; Vandermeuden, 1975; Le Tissier, 1988; Cuift and
Dauphin, 2005) and is consistent with the observed timing of mesenteries formation
in Acropora juvenile polyps.
The observation of three galaxin related molecules with distinct but partially
overlapping spatial and temporal expression patterns led us to suggest roles for this
family of proteins during basal plate deposition and mesenterial calcification (chapter
3). While both of the Amgalaxin-like genes are expressed exclusively in the early
stages of calcification and are likely to be involved in basal plate formation (Fig 3.4
and 3.5), Amgalaxin is expressed in the mesenteries (Fig 3.6) and continues to be
expressed in the adult (chapter 3). Microarray results (chapter 5) also show up-

141
regulation of Amgalaxin-like1 in the flat polyp stage (i.e. when the basal plate is
formed), and are thus consistent with the in situ and virtual northern results for this
gene. Likewise, the observed up-regulation of homologs of the ECM proteins
echinonectin and E-selectin (table 5.2) in primary polyps is consistent with the idea
that differential expression of organic matrix components is responsible for
determining crystal polymorph and growth during Acropora skeletogenesis.
Functional assays are necessary to understand the roles of these secreted proteins.
The up-regulation in all calcifying stages (CII) of transcripts involved in O-Glycan
biosynthesis (GO:0004553), metalloendopeptidase activity (GO: 0004222) and
regulators of the tubulin-cytoskeleton (Table 5.2) is consistent with the idea that
matrix biosynthesis rather than CaCO3 deposition is the limiting factor controlling
coral skeleton deposition (Allemand et al., 1998). In a similar way, up-regulation in
calcifying stages of molecules involved in O-glycosylation (GO:0004553) is
consistent with the observation that glycosylation is a prerequisite for skeleton
formation in corals (Allemand et al. 1998) as it is in echinoderms (Ameye et al.,
2001),
The fact that Amgalaxin-like1 expression was initially restricted to columnar
ectodermal cells located in the aboral end of planulae, which according to Le Tissier
(1988) is the last region to differentiate into calicoblastic cells, suggest that
Amgalaxin-like1 expression is not restricted to calicoblastic cells and lead us to
suggest that these putative secretory columnar transectodermal cells are involved in
the initial planula attachment during settlement and metamorphosis. Clode and
Marshall (2004) found that levels of intracellular calcium were lowest in this same
region - at the aboral end of planula - in Pocillopora damicornis. Whether there is a
functional relationship between Amgalaxin-like1 expression in planulae and the low
intracellular calcium concentration reported in Pocillopora larvae remains to be
investigated.
Finally, the observed up-regulation in Acropora planulae of molecules involved in
lipid metabolism and phospholipid biosynthesis (Table 5.2) might not only reflect
larval use of stored lipids as energy sources (Vandermeuden, 1974) but could also
represent a mechanism by which calcium ions are delivered to the calcification site

142
prior to skeleton deposition. Acidic phospholipids are products of lipid metabolism
that are known to promote the deposition of calcium salts (Kant et al. 1996) and there
is evidence that calcium is accumulated in endodermal lipid containing vesicles in
both planula and settled (aposymbiotic) coral larvae (Clode and Marshall, 2004).
Several authors have suggested that acidic phospholipids comprise the calcium-
binding fraction in the calcifying OM of hermatypic corals (Isa and Okasaki, 1987;
Watanabe et al., 2003). More research is necessary to characterize organic matrix
components and their respective function during both juvenile and adult Acropora
skeletogenesis.
6. 3. Final remarks and future outlook.
Although scleractinian corals are responsible for the underlying framework of coral
reefs (Veron, 2000; Gunderson, 2007), the molecular mechanisms regulating coral
calcification are still poorly understood. The results reported here focused on early
stages of Acropora calcification and suggest high levels of complexity in the
mechanisms regulating coral skeletogenesis. Calcification requires the coordination of
multiple signaling pathways involved in the transport of calcium and carbonate ions
as well as the synthesis and transport of OM precursors. Furthermore, as the initiation
of calcification correlates with the aboral ectodermal rearrangement that gives rise to
the calicoblastic ectoderm, the cellular mechanisms regulating this transition are of
great importance in understanding the biology of the calcifying cell.
The results presented here indicate the importance of characterising larval cell
population and the possible roles of pluripotent cell population as precursors of adult
cell types including the calicoblast. Likewise, the role of calcium as an intracellular
second messenger and the molecules involved in translating its signal are of vital
importance in understanding the regulatory gene networks underlying skeleton
deposition and metamorphosis in Acropora. As shown in this study, microarray
studies represent a good tool to generate hypotheses in many areas of coral biology,
however the development of these ideas is often restricted because conceptual models
are of necessity based on analogous pathways in model organisms.

143
Functional and physiological assays are necessary to elucidate the cellular localization
and physiological function of the Acropora molecules characterized in this study as
well as the roles of coral specific molecules identified by microarray analysis. This
can be achieved via cellular assays using coral cell lines, microinjection, and RNA
interference methodologies. Morpholinos have been used to knock down genes during
early stages of development (Rentzsch et al., 2008; Magie et al., 2007) and transgenic
Hydra has been generated by microinjection of early embryos (Khalturin et al., 2007).
Similar approaches could be used in coral larva to study the function and localization
of genes of interest. Further studies on coral calcification will not only provide
valuable information for the management and conservation of coral reefs but also due
to the basal nature of Scleractinia among metazoans, it will also contribute to the
understanding of the evolution of calcium dependent cellular pathways in the animal
kingdom.
6. 4. References.
Allemand D, Ferrier-Pages, Christine., Furla, Paola., Houlbreque Fanny., Paverel, Sandrine., Reynaud Sttephanie., Tambutte, Eric., Tambutte, Sylvie and Zoccola Didier. (2004) Biomineralization in reef-building corals: from molecular mechanisms to environmental control. General Palaentology 3: 453- 467 Ameye L, De Becker G, Killian C, Wilt F, Kemps R, Kuypers S, Dubois P (2001) Proteins and saccharides of the sea urchin organic matrix of mineralization: characterization and localization in the spine skeleton. J Struct Biol 134: 56-66 Arbeitman MN, Furlong EE, Imam F, Johnson E, Null BH, Baker BS, Krasnow MA, Scott MP, Davis RW, White KP (2002) Gene expression during the life cycle of Drosophila melanogaster. Science 297: 2270-2275 Babcock RC, Heyward AJ (1986) Larval development of certain gamete-spawning scleractinian corals. Coral Reefs 5: 111-116 Bode HR (1996) The interstitial cell lineage of hydra: a stem cell system that arose
early in evolution. J Cell Sci 109 :1155-64 Clode PL, Marshall AT (2004) Calcium localisation by X-ray microanalysis and fluorescence microscopy in larvae of zooxanthellate and azooxanthellate corals. Tissue Cell 36: 379-390 Cuif JP, Dauphin Y (2005) The two-step mode of growth in the scleractinian coral skeletons from the micrometre to the overall scale. J Struct Biol 150: 319-331 Gaino E, Bo M, Boyer M, Scoccia F (2008) Sperm morphology in the black coral
Cirrhipathes sp. (Anthozoa, Antipatharia). Invert Biol 127:249-258 Ge G, Greenspan DS (2006) Developmental roles of the BMP1/TLD metalloproteinases. Birth Defects Res C Embryo Today 78:47-68 Gunderson L (2007) Ecology: a different route to recovery for coral reefs. Curr Biol 17: R27-28

144
Hyman LH (1940) The invertebrates:Protozoa through Ctenophora. McGraw-Hill, New York and London, 726 pp
Isa Y and Okasaki, M. (1987) Some observations on the Ca2+-binding phospholipids from scleractinian coral skeletons. Comp. Biochem. Physiol. 87B: 507-512 Khalturin K, Anton-Erxleben F, Milde S, Plötz C, Wittlieb J, Hemmrich G and Bosch TCG (2007). Transgenic stem cells in Hydra reveal an early evolutionary origin for key elements controlling Dev. Biol. 309: 32-44 Khan SR, Atmani F, Glenton P, Hou Z, Talham DR, Khurshid M (1996) Lipids and membranes in the organic matrix of urinary calcific crystals and stones. Calcif Tissue Int 59: 357-365 Le Tissier M (1988) Patterns of formation and the ultrastructure of the larval skeleton of Pocillopora damicornis. Marine Biology 98: 493-501 Magie, C., Daly, M., and Martindale, M.Q. 2007. Gastrulation in the cnidarian Nematostella vectensis occurs via invagination not ingression. Dev. Biol., 305, 483-497. Martin VJ (1990) Development of the nerve cells in Hydrozoan planulae: III. Some
interstitial cells transverse the ganglionic pathway in the endoderm. Biol Bull 178:10-20
Martin V, Archer W (1997) Stages of larval development and stem cell population changes during metamorphosis of a hydrozoan planula. Biol Bull 192:41-52
Ng KW, Speicher, T., Dombrowski, C., Helledie, T., Haupt, L.M., Nurcombe, V., and Cool, S.M. (2007) Osteogenic Differentiation of Murine Embryonic Stem Cells Is Mediated by Fibroblast Growth Factor Receptors. Stem Cells and Development 16: 305-317 Puverel S, Tambutte E, Pereira-Mouries L, Zoccola D, Allemand D, Tambutte S (2005b) Soluble organic matrix of two Scleractinian corals: partial and comparative analysis. Comp Biochem Physiol B Biochem Mol Biol 141: 480- 487 Rentzsch F, Fritzenwanker JH, Scholz CB, Technau U (2008). FGF signalling controls formation of the apical sensory organ in the cnidarian Nematostella vectensis. Development May;135(10):1761-9. Selfors LM, Schutzman JL, Borland CZ, Stern MJ (1998) soc-2 encodes a leucine- rich repeat protein implicated in fibroblast growth factor receptor signaling. Proc Natl Acad Sci U S A 95: 6903-6908 Szmant-Froelich A, Yevich P, Pilson MEQ (1980) Gametogenesis and early development of the temperate coral Astrangia danae (Anthozoa: Scleractinia).Biological Bulletin 158: 257-269 Vandermeulen, J. H. (1974). Studies on Reefs Corals.II. Fine Structure of PlanktonicPlanula Larva of Pocillopora damicornis, with Emphasis on the Aboral Epidermis. Marine Biology 27, 239-249. Vandermeulen JH (1975) Studies on Coral Reefs.III. Fine Structural Changes of Calicoblast Cells in Pocillopora damicornis during Settling and Calcification. Marine Biology 31: 69-77 Vandermeulen JH, Watabe N (1973) Studies on Reef Corals. I. Skeleton Formation by Newly Settled Planula Larva of Pocillopora damicornis. Marine Biology 23: 47-57 Veron J (2000) Corals of the world. Australian Institute of Marine Sciences, Townsville

145
Watanabe T, Fukuda I, China K, Isa Y (2003) Molecular analyses of protein components of the organic matrix in the exoskeleton of two scleractinian coral species. Comp Biochem Physiol B Biochem Mol Biol 136: 767-774