Review Projects – 2013 Big Idea 1 Mr. Bennett. LO 1.1: The student is able to convert the data set...
31
Review Projects – 2013 Big Idea 1 Mr. Bennett
-
Upload
toby-leonard -
Category
Documents
-
view
212 -
download
0
Transcript of Review Projects – 2013 Big Idea 1 Mr. Bennett. LO 1.1: The student is able to convert the data set...

Review Projects – 2013
Big Idea 1
Mr. Bennett

LO 1.1: The student is able to convert the data set from a table of numbers that reflect a change in the genetic makeup of a population over time and to apply mathematical methods and conceptual understandings to investigate the cause(s) and effect(s) if this change.SP 1.5: The student can reexpress key elements of natural phenomena across multiple representations in the domain.SP 2.2: The student can apply mathematical routines to quantities that describe natural phenomena.Explanation: Microevolution is the process by which populations gradually change genetically. Almost all populations will undergo microevolution, otherwise known as genetic drift, since attaining Hardy-Weinberg equilibrium requires a large, isolated population with random mating, no net mutations, and no natural selection. Genetic drift can occur due to changes in gene flow from other populations, mutations, bottleneck effect from natural disasters, or just natural selection selecting for or against specific alleles for survival. Different types of natural selection include directional selection, in which the population shifts toward one extreme, disruptive selection, which favors extremes on either end, and stabilizing selection, which favors the middle with less variation.M.C. Question: In the table below, which graphs the height of a population of birds over three generations, what kind of selection is occurring?A. Stabilizing selectionB. Directional selectionC. Disruptive selectionD. No selection is occurring Generations
Traits 1 2 3Avg Height 16 in 19 in 21 in
Min Height 9 in 13 in 16 in
Max Height 23 in 25 in 28 in
FRQ/Learning Log Style Question: In the diagram to the left, name and define what happened to the population, and offer three possible explanations for what could have caused it. Also, explain how and why the new population’s genetic makeup will be different from the original population in the future.

LO 1.2: The student is able to evaluate evidence provided by data to qualitatively and quantitatively investigate the role of natural selection in evolution.SP 2.2: The student can apply mathematical routines to quantities that describe natural phenomenon.SP 5.3: The student can evaluate the evidence provided by data sets in relation to a particular scientific question.
Explanation: Darwin’s theory of natural selection is one of the main contributors to evolution of a population over time. Data from websites like Blast, a cladogram, or even Hardy-Weinberg equilibriums can show the evolution of a species based on traits that natural selection have chosen for the species. The competition for limited resources leads to the reproduction of the fittest which brings new alleles into a population. These new alleles, not only add to the gene pool’s diversity, but also allow for new traits to be favored based on the environment of a population. The higher a gene pool’s allele diversity the higher the likely hood that a population will be able to adapt to an outside stimulus. The only time a population wouldn’t evolve would be if Hardy-Weinberg’s equilibrium of 1) a large population, 2) no migration, 3) no mutations, 4) random mating, and 5) an absence of selection was achieved.
M.C. Question: At a locus with a dominant and recessive allele in Hardy-Weinberg Equilibrium, 16% of the individuals are homozygous for the recessive allele. What is the frequency of the dominant allele?
A) 0.16 B) 0.64 C) 0.84 D) 0.6 E) 0.4
Learning Log/FRQ-style Question: Surprisingly chimps and pigeons have been found to be fairly similar. How could you determine how close of relatives they are? What would this data be able to tell you? Create a graph of their evolutionary line. What other evidence is needed to determine lineage? How could natural selection play a role in their two different niches today?

• LO 1.3 The student is able to apply mathematical methods to data from a real or simulated population to predict what will happen to the population in the future
• 2.2 The student can apply mathematical routines to quantities that describe natural phenomena. Explanation: A population is a localized group of individuals that are capable of interbreeding and producing fertile offspring. A gene pool consists of all alleles at all gene loci in all individuals of the population. If only one allele exists at a particular locus in a population, that allele is said to be fixed in the gene pool, and all individuals are homozygous for that allele. But if there are two or more alleles for a particular locus in a population, individuals may be either homozygous or heterozygous. Each allele has a frequency (proportion) in the population. The Hardy-Weinberg theorem states that the frequencies of alleles and genotypes in a population’s gene pool remain constant from generation to generation, provided that only Mendelian segregation and recombination of alleles are at work. If all male-female matings are equally likely, not only will the population have the same allele frequencies from one generation to the next, but its genotype frequencies can be predicted from the allele frequencies. Such populations are in a state of Hardy-Weinberg equilibrium. Using the rule of multiplication, we can calculate the frequencies of the three possible genotypes assuming random unions of sperm and ova. We can summarize these unions of gametes in an algebraic equation: (p+q) x (p+q) = p^2 + 2pq + q^2. As with allele frequencies, all of these genotype frequencies sum to 1. If a population were in Hardy-Weinberg equilibrium and its members continued to mate randomly generation after generation, allele and genotype frequencies would remain constant.
M.C. Question: You have sampled a population in which you know that the percentage of the homozygous recessive genotype (aa) is 36%. Calculate the frequency of the homozygous dominant genotype(AA).A) 60%B) 48%C) 36%D) 40%E) 16%
Learning Log/ FRQ-Style Question: State the fiveconditions that satisfy the Hardy-Weinberg theorem. What would be the result if one or more of the conditions was not met?

LO 1.4 The student is able to evaluate data-based evidence that describes evolutionary changes in the genetic makeup of a population over time.
SP 5.3 The student can evaluate the evidence provided by data sets in relation to a particular scientific question.
Explanation: Biological evolution is any genetic change in a population that is inherited over generations; the genes, or more specifically, the alleles are changed and passed on. These changes are noticeable through the phenotypes of a population and can occur through many mechanisms of evolution such as natural selection, random changes in DNA, new gene combinations, or even human impact. The most important/obvious mechanism is natural selection. The natural environment selects for or against a particular trait. Take the peppered moth for example. Before the industrial revolution, data showed that pale/white peppered moths flourished and camouflaged well against trees. But after the revolution, pollutants killed off lichens and turned tree bark dark, thus resulting in data that showed white moths were diminishing while dark moths were flourishing. Through the data collected by scientists, it was concluded that natural selection selected against the light color because it did not allow the moth to hide from predators anymore.
MC Question: Which statement about natural selection is the most accurate?
A. It always requires genetic variation, but only requires differential reproductive success with certain species
B. Adaptations beneficial at one time should generally be beneficial during any other time as well
C. Well adapted individuals leave more offspring, and thus contribute more to the next generation’s gene pool, than do poorly adapted individuals
D. Different species that inhabit the same area will adapt to that environment by undergoing the same genetic changes
LL/FRQ Style: Suppose you have been studying a population of species for 10 years and you have noticed a nonconstancy in the species based on your recorded data. Explain how this could happen and use a real life example to support your evidence/conclusion.

L.O. 1.5: The student is able to connect evolutionary changes in a population over time to a change in the environment. SP 7.1: The student can connect phenomena and models across spatial and temporal scales
Explanation: Evolution is a process that results in changes in the genetic material of a population over time reflecting the adaptations of organisms to their changing environments. Charles Darwin introduced the process of natural selection, which states that a population can change over generations if individuals that possess certain heritable traits leave more offspring than other individuals. This means the animals best suited for their new or changing environment survive long enough to reproduce and pass on the trait to their offspring, thus changing the genetic makeup of the species to fit their environment. For example, if a bird species is isolated from their ancestors due to a flood, the bird in the new environment will have to adapt. This means with a change in food source in their new location one bird will have a more favorable trait and live longer than its neighbor to reproduce. Thus, the bird with the trait, lets say a sharper beak, will survive long enough to reproduce and pass on his genes for the sharper beak to his offspring. Over time the population of this species will have a sharper beak to fit their food source in their new environment.
M.C. Question: Look at the diagram to the right, what most likely was the cause that the lighter circles were not able to pass on their genes?A) Their genetic makeup did not allow for them to reproduceB) Natural selection did not favor their traits and they were unable to survive for reproduction in their environmentC) They were homozygous dominant and were unable to reproduce with others that were heterozygous or homozygous recessiveD) They were not the fittest of their species and therefor could not survive
Learning Log/ FRQ-style Question: Suppose you are studying giraffes and you separate one species into two different locations. One into captivity feeding off of only bushes and one feeding off of only trees. Hypothetically, over many generations you notice the neck length in the two species are different. Which giraffe would have the longer neck? What would cause the this to happen if both have the same common ancestor? Draw a diagram representing what happened in this situation, and use your diagram to explain your reasoning.

LO 1.6 The student is able to use data from mathematical models based on the Hardy- Weinberg equilibrium to analyze genetic drift and effects of selection in the evolution of specific populations.
SP 1.4 The student can use representations and models to analyze situations or solve problems quantitatively and qualitatively.SP 2.1 The student can justify the selection of a mathematical routine to solve problems.
Explanation: The Hardy- Weinberg equilibrium describes a population containing the same allelic frequencies from one generation to the next. In other words, this theorem defines the properties of gene pools that are not evolving. By using this equation as the standard for a population not affected by extrinsic factors, the allelic frequencies of living populations can be analyzed. Using this method, fluctuations from one generation to the next, known as genetic drift, can be measured in order to see the effects of selection on specific populations. The Hardy- Weinberg equation quantifies theses deviations in populations using p’s and q’s. A dominant allele of an organism is represented by the p, while the recessive allele is represented by the q. In order to calculate the total fluctuation in the gene pool of an organism, these two variables come together to make the equation p²+2pq+ q²=1, where p² is homozygous dominant, 2pq is heterozygous, and q² is homozygous recessive.
Learning Log Question: In a population of fish 396 have dwarfed fins (recessive) and 557 have normal sized fins (dominant). Calculate the allele frequencies and expected genotypes of each. In the next year if 1,245 fish are produced, how many fish would have dwarfed or normal fins? Explain.
Population of Birds
Black Feathers (BB)
Gray Feathers (Bb)
White Feathers (bb)
Population 1 30 15 3
Population 2 27 10 7
Population 3 45 11 5
M.C. Question: From the graph, which population has the highest frequency of the dominant (B) allele?A. Population 1B. Population 2C. Population 3D. There is not enough information.

LO 1.7: The student is able to justify data from mathematical models based on the Hardy- Weinberg equilibrium to analyze genetic drift and the effects of selection in the evolution of specific populations.SP 2.1: The student can justify the selection of a mathematical routine to solve problems.
Explanation: The Hardy-Weinberg formulas allow scientists to determine whether evolution has occurred. Any changes in the gene frequencies in the population over time can be detected. The law essentially states that if no evolution is occurring, then an equilibrium of allele frequencies will remain in effect in each succeeding generation of sexually reproducing individuals. In order for equilibrium to remain in effect (i.e. that no evolution is occurring) then the following five conditions must be met: 1) No mutations must occur so that new alleles do not enter the population. 2) No gene flow can occur (i.e. no migration of individuals into, or out of, the population). 3) Random mating must occur (i.e. individuals must pair by chance). 4) The population must be large so that no genetic drift (random chance) can cause the allele frequencies to change. 5) No selection can occur so that certain alleles are not selected for, or against. The Hardy-Weinberg equation is expressed as: p2 + 2pq + q2 = 1
MC Question: In a population that is in Hardy-Weinberg equilibrium, the frequency of the “r.” allele is 0.6. What percentage of the population is heterozygous for this locus?A) 2pq = .48 (p = .4 and q = .6)B) p2= .16 C) 2pq= .36 (p= .6 and q= .6)D) q2= .1
Free Response Style Question: Evolution is one of the overarching themes of biology. Evolution involves change in the frequencies of alleles in a population. For a particular genetic locus in a population, the frequency of the recessive allele (a) is 0.4 and the frequency of the dominant allele (A) is 0.6.(a)What is the frequency of each genotype (AA, Aa, aa) in this population? What is the frequency of the dominant phenotype?(b) How can the Hardy-Weinberg principle of genetic equilibrium be used to determine whether this population is evolving?(c) Identify a particular environmental change and describe how it might alter allelic frequencies inthis population. Explain which condition of the Hardy-Weinberg principle would not be met.
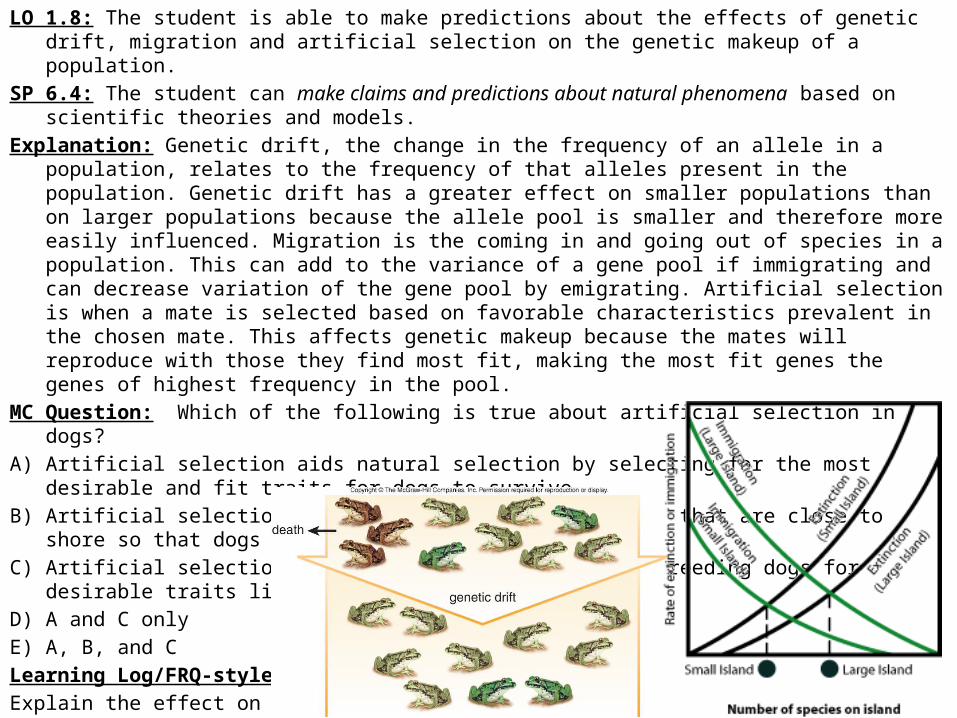
LO 1.8: The student is able to make predictions about the effects of genetic drift, migration and artificial selection on the genetic makeup of a population.
SP 6.4: The student can make claims and predictions about natural phenomena based on scientific theories and models.
Explanation: Genetic drift, the change in the frequency of an allele in a population, relates to the frequency of that alleles present in the population. Genetic drift has a greater effect on smaller populations than on larger populations because the allele pool is smaller and therefore more easily influenced. Migration is the coming in and going out of species in a population. This can add to the variance of a gene pool if immigrating and can decrease variation of the gene pool by emigrating. Artificial selection is when a mate is selected based on favorable characteristics prevalent in the chosen mate. This affects genetic makeup because the mates will reproduce with those they find most fit, making the most fit genes the genes of highest frequency in the pool.
MC Question: Which of the following is true about artificial selection in dogs?A) Artificial selection aids natural selection by selecting for the most desirable and fit traits for dogs to surviveB) Artificial selection can only occur in large islands that are close to shore so that dogs can immigrateC) Artificial selection is performed mostly by humans breeding dogs for desirable traits like size and fur colorD) A and C onlyE) A, B, and C Learning Log/FRQ-style Question: Explain the effect on a population’s gene poolbased on an island’s size and distance from shore. How do genetic drift, migration, and artificial selection play into this process?

LO 1.10: The student is able to refine evidence based on date from many scientific disciplines that support biological evolution.
SP 5.2: The student can refine observations and measurements based on data analysis.
Explanation: Evidence supporting biological evolution include homology. Despite the fact that organisms of different species have different characteristics that function differently, the structure of those characteristics can be very similar, suggesting that they have a common ancestor. An example would be the bone structure of several different species. Involved in this concept would be vestigial organs, structures of little importance to the organism. Molecular homologies reveal that species are similar at a molecular level, meaning that they have similar genetic codes and genes. Biological evolution is also supported by biogeography (distribution of species) and fossil records. Carbon dating is a tool used in order to decipher that age of these fossils, which allows us to figure out what species originated at the same time and discover how they link to modern species. In addition phylogenetic/ evolutionary trees are used to show the relationship among species based on physical, genetic characteristics and geographical distribution. Plus, allele frequencies can show how a population has evolved, this concept is embodied when a population deviates from the Hardy-Weinberg Equilibrium Theorem.
Multiple Choice Question: While looking at a fossil of an organism resembling the same structure of a snake, paleontologist saw that it also had legs and a pelvis. Also, the skeletal structure of the organism resembled that of several mammalian species. The bones of this snake-like organism would be evidence supporting the concept of…A) Homologous structures, meaning that snakes and mammalian species share a common ancestor.B) Embryology, suggesting that both snakes and mammals developed the same wayC) The bones are an example of vestigial organs, which tells us that snakes having walking ancestorsD) A and C are correctE) A, B and C are correct
Learning Log/ FRQ- Style Question: After a student analyzed the following image, he concluded that the four organisms, based on their appearances and although inhabiting different regions, shared a common ancestor. The student also decided to analyze their bone structures and noticed that these four species had a similar bone structure to those in the other image. He concluded that they must share a common ancestor as well. Is the student corrected in both his assumptions? When writing your response be sure to explain why making reference to homologous structures, biogeography and divergent evolution. If they do share a common ancestor, make a case suggesting that there must be similarities at the molecular level.

Learning objective 1.11The student is able to design a plan to answer scientific questions regarding how organisms have changed over time using information from morphology, biochemistry and geology.
SP 4.2 The student can design a plan for collecting data to answer a particular scientific question
Explanation: The act of organisms changing over time is called evolution. Evolution runs on natural selection where the organisms that exhibit favorable traits or mutations reproduce and increase that trait ratio in the gene pool. There is much evidence for evolution of species, such as the fact that all living organisms use either RNA or DNA for their genetic material and can be traced to a common ancestor. Not only that but in the majority of species use the same three letter code in translating proteins. In most domains of life not only are the genetics very similar but many anatomic parts between animal species are homologous. For example, all vertebraic animals with four limbs (tetrapods) have five digits because the ancestor of tetrapods had five digits. Although animals such as birds and some reptiles do not look like they have five digits, they do at an early stage in life.
Question: Which of the following is an evolutionary process not based on random factors?a.Genetic driftb.Natural selectionc.Mutationd.Gene flowe.Bottlenecks
FRQ: Two new islands, relatively close together, are found in the Pacific ocean. On these different individual islands, two species of birds are found. One species of bird has a long thin beak and one species has a short fat beak. Upon BLAST sequencing the DNA, researchers find that the birds share an overwhelming majority of genetic material. What are some possible explanations for this strange difference in beak structure?

LO 1.12: The student is able to connect scientific evidence from many scientific disciplines to support the modern concept of evolution.SP 7.1: The student can connect phenomena and models across spatial and temporal scales.
M.C. Question: What type of method is used when incorporating both mathematical and geological techniques to support modern evolutionary theory?A) Gene Similarity PercentagesB) Analysis of Vestigial StructuresC) Half-Life CalculationsD) Enzyme ComparisonsFRQ: There are multiple disciplines in biology that are used to
support the modern theory of evolution, including geographical, geological, physical, chemical, and mathematical disciplines.
a) Choose three of the disciplines above and explain how each can be used to support evolution.
b) Provide an example for each point in part a) that relates to what you have stated, and connect it back to supporting the theory of evolution.
c) Observe the model on the right and determine the first common ancestor between dogs and bears. Then propose one method that was likely used in constructing the diagram not mentioned in your answer for part a or b. (Assume that each labeled organism counts as a species. I.e. dogs are a species for the purposes of this question etc.)
Explanation: There are vast sources of scientific data that support the concept of evolution branching from Darwin’s theories. Forms of data come from wide spread disciplines including geographical, geological, physical, chemical, and mathematical disciplines/studies. Molecular structures like DNA are a major source of evolutionary evidence. Other major sources for evidence come from morphological studies that compare vestigial structures, etc. Fossils are also a large source of information along with carbon dating. Mathematical models and gene analysis further supports the modern concept of evolution.

LO 1.13: The student is able to construct and/or justify mathematical models, diagrams or simulations that represent processes of biological evolution. SP 1.1: The student can create representations and models of natural or man-made phenomena and systems in the domain.SP 2.1:The student can justify the selection of a mathematical routine to solve problems.
Explanation: Several organisms today share many basic processes and features; these properties provide evidence that all organisms are linked by lines of descent from common ancestry. Elements that are conserved across all domains of life are DNA and RNA as carriers of genetic information, a universal genetic code, and numerous metabolic pathways. Such evidence can be used to conclude that that present life evolved from a universal ancestor. In eukaryotes, similar features including the cytoskeleton, a nucleus, membrane-bound organelles, linear chromosomes and endomembrane systems provide evidentiary support for the concept of evolution. Analyzing the changes of a specific species over a long period of time can represent both acquired traits and those lost through evolution.
M.C. Question: According to the figure to the right, which of the following could be the correct data regarding the similarity in gene and protein make up when comparing to humans?
Species Gene Percentage Similarity Protein Percentage SimilarityHuman 100% 100%
Dog 91.30% 95.20%Hawk 76.30% 80.80%Squid 66.90% 71.30%
Butterfly 72.40% 76.70%
Species Gene Percentage Similarity Protein Percentage SimilarityHuman 100% 100%Hawk 91.30% 95.20%
Butterfly 76.30% 80.80%Squid 66.90% 71.30%Dog 72.40% 76.70%
Species Gene Percentage Similarity Protein Percentage SimilarityButterfly 100% 100%
Hawk 91.30% 95.20%Human 76.30% 80.80%
Dog 66.90% 71.30%Squid 72.40% 76.70%
Species Gene Percentage Similarity Protein Percentage SimilarityDog 100% 100%
Human 91.30% 95.20%Squid 76.30% 80.80%Hawk 66.90% 71.30%
Butterfly 72.40% 76.70%
A)
B)
C)
D)
Learning Log / FRQ-style Question: What are five indications that have led scientists to conclude that evolution has occurred? Explain and give an example of each. What are three examples of scientific evidence that evolution continues to occur? Explain.

LO 1.14: The student is able to pose scientific questions that correctly identify essential properties of shared, core life processes that provide insights into the history of life on Earth.
SP 3.1: The student can pose scientific questions.
Explanation: Organisms share many conserved core processes and features that evolved and are widely distributed among organisms today. Structural and functional evidence supports the relatedness of all domains. Major features of the genetic code are shared by all modern living systems; DNA and RNA are carriers of genetic information through transcription, translation and replication. Metabolic pathways are conserved across all currently recognized domains. Structural evidence supports the relatedness of all eukaryotes, because of linear chromosomes. Endomembrane systems, including the nuclear envelope, as well as membrane-bound organelles (mitochondria and/or chloroplasts).
M.C. Question: Which of the following statements concerning core life processes is true?
A) They are the same in animals than in plants.B) They have only DNA carriers of genetic information through Transcription.C) Linear chromosomes are present in life processes.D) Genetic code varies extremely in living systems.
Learning Log/FRQ-style Question: Illustrate the relationships between prokaryotes and eukaryotes. Then explain in terms of molecular and cellular features that are common to life.

LO 1.15: The student is able to describe specific examples of conserved core biological processes and features shared by all domains or within one domain of life, and how these shared, conserved core processes and features support the concept of common ancestry for all organisms.
SP 7.2: The student can connect concepts in and across domain(s) to generalize or extrapolate in and/or across enduring understandings and/or big ideas. Explanation: Cladograms depict patterns of shared characteristics between species. By analyzing a cladogram, one can determine the relatedness of two organisms and trace them back to a common ancestor. Shared characteristics can take the form of similar biological process, like common metabolic pathways, or homologous structures. An example of homologous structures is the forelimbs of mammalians, humans, cats, whales, and bats all have similar bone structure in their forelimbs providing evidence for a common ancestor.
M.C. Question: Which of the following is NOT an example of common ancestry?A)Similar forelimbs structures in cats and humansB)Similar metabolic processes in rodentsC)Sharks and dolphins both living in an aquatic environmentD)Post-anal tails in the human and chick embryo E)Opposable thumbs in humans and chimpanzees
Learning Log/FRQ-style Question: If you were a biologist examining a cladogram of the animal kingdom (similar to the one on the right) what relationships would you expect to see? Based on these relationships what conclusions could you draw?

LO 1.16 The student is able to justify the scientific claim that organisms share many conserved core processes and features that evolved and are widely distributed among organisms today.
SP 6.1 The student can justify claims with evidence.Explanation Organisms are linked by lines of descent from common ancestry. Organisms share many conserved core processes and features that are widely distributed among organisms today. These processes provide evidence that all organisms (Archaea, Bacteria, and Eukarya, both extant and extinct) are linked by lines of descent from common ancestry. Elements that are conserved across all domains of life are DNA and RNA as carriers of genetic information, a universal genetic code, and many metabolic pathways. The existence of these properties in organisms today implies that they were present in a universal ancestor and that present life evolved from a universal ancestor. Phylogenetic trees graphically model evolutionary history and can represent both acquired traits and those lost during evolution. In eukaryotes, conserved core elements provide evidence for evolution. These features include the presence of a cytoskeleton, a nucleus, membrane-bound organelles, linear chromosomes and endomembrane systems. Organisms share many conserved core processes and features that evolved and are widely distributed among organisms today. a. Structural and functional evidence supports the relatedness of all domains. Evidence of student learning is a demonstrated understanding of each of the following: 1. DNA and RNA are carriers of genetic information through transcription, translation and replication 2. Major features of the genetic code are shared by all modern living systems. 3. Metabolic pathways are conserved across all currently recognized domains. b. Structural evidence supports the relatedness of all eukaryotes. Illustrative examples include: 1. Cytoskeleton (a network of structural proteins that facilitate cell movement, morphological
Integrity and organelle transport) 2. Membrane-bound organelles (mitochondria and/or chloroplasts) 3. Linear chromosomes 4. Endomembrane systems, including the nuclear envelope
Multiple Choice Question Which one of these statements is incorrect?(A) All organisms, with the exception of plants, have mitochondria. (B) All eukaryotes have mitochondria.(C) All living organisms have similarities in their genetic code.(D) Answers A, B, and C are incorrect.(E) Answers A, B, and C are correct.
Free Response QuestionName and thoroughly describe 2 biological features or processes that are found in all living organisms today.

LO 1.17 The student is able to pose scientific questions about a group of organisms whose relatedness is described by a phylogenetic tree or cladogram in order to (1) identify shared characteristics, (2) make inferences about the evolutionary history of the group, and (3) identify character data that could extend or improve the phylogenetic tree.
SP 3.1 The student can pose scientific questions.Explanation: Phylogenetic trees and cladograms show evolutionary traits for different species and how closely related each species is to one another. By looking at a phylogenetic tree or a cladogram a person can better understand how closely species are related by looking at the shared evolutionary characteristics that they have. Phylogenetic trees and cladograms rely heavily on the use of living as well as fossil species, and DNA and protein sequences that have similarities in order for them to be constructed and improved upon to provide the most accurate information on evolutionary characteristics and the species that share them.
M.C. Question: Using figure A identify the most recent evolutionary characteristic that causes the primates and rodents & rabbits to be similar?
a) Four limbs
b) Amniotic egg
c) Hair
d) Bony Skeleton
Learning Log/FRQ-style Question: Explain the purpose of
the phylogenetic tree in figure A and how it allows scientists
to see how species have evolved. A new fossil has been found
Showing the characteristics of a vertebrae, bony skeleton, and
four limbs. Where on Figure A would this new species be located.
Figure A

LO 1.18: The student is able to evaluate evidence provided by a data set in conjunction with a phylogenic tree or a simple cladogram to determine evolutionary history and speciation.
SP 5.3: The student can evaluate the evidence provided by data sets in relation to a particularscientific question.
Explanation: A cladogram allows scientists to trace where there may have been a an evolution of a trait or a split of two species from a common ancestor. A cladogram can often be presented in a table with numbers, typically a one and a zero, that show the presence or the absence of a character. The numbers are then used to find common ancestors and see which organisms are most closely related and which aren’t. On a phylogram, the length of the branch reflects the number of changes that have taken place in a particular DNA sequence in that lineage.
MC Question: Which of the following does not describe the outgroup?a) The outgroup is less closely related to the ingroup members than
they are to each otherb) The outgroup is more developed than one of the ingroup membersc) The outgroup is closely related to the ingroupd) The outgroup is compared to the ingroup
FRQ Style Question: Using the figures to the right, explain the relationship that the organisms have to each other.

Learning Objective 1.19: The student is able to create a phylogenetic tree or simple cladogram that correctly represents evolutionary history and speciation from a provided data set.Science Practice 1.1: The student can create representations and models of natural or man-made phenomena and systems in the domain.Explanation: Phylogenetic trees are a type of branching diagram that show hypotheses regarding evolutionary history of species. By using the phylogenetic tree, students can represent the natural phenomena of the evolution of species and where they branch off from their common ancestors. Speciation is shown by the relatedness of any two groups, which is illustrated by looking at how recently they shared a common ancestor. Students should be able to create them by looking at information provided on the morphological similarities (looking at either living comparisons or fossils)and at what points they diverge from the common ancestor. They can look at traits which are either derived from or lost to evolution. In constructing a phylogenetic tree, a cladogram can be used to show patterns of shared characteristics – which can help when figuring out how to draw the branches of the tree, but do not necessarily show common ancestry. When drawing a cladogram, the student needs both an outgroup and an ingroup. The outgroup is a group or species which, although closely related to species in the ingroup, is known to be genetically less related to the ingroup than any of the ingroup members are to each other. It is helpful to make a character table (Figure 1. a) – a chart where species are listed on one axis, and characters on another, and a 0 in a box indicates that a character is absent in a species, while a 1 indicates a character is present. This chart can help see where characteristics diverge, so you can have the species branch off at the appropriate points on the cladogram (Figure 1.b). However, while cladograms can be helpful in building phylogenetic trees (because it shows common characteristics in species or groups), they cannot be solely relied upon because some of these characteristics may not be the result of a common ancestor (they could be analogous instead of homologous). This is why students also need information – such as genetic information (from DNA sequences and protein similarities) and information provided by fossils (they can use information from this data to figure out the time frame of the speciation). The phylogenetic trees are a good representation of the relative timeline that the characteristics developed, but are not an accurate way to determine the exact time frame in which the evolution happened. New technology in terms of computers is especially helpful when determining the relatedness among species.
M.C Question: In constructing a cladogram, there are four species you are looking at (three of which are the ingroup and one of which is the outgroup), along with a chart with their characteristics. Based on the chart provided (Figure 2), which of the species is most likely the outgroup in the cladogram?A) The gray wolf, because it has the most characteristics that the other species don’t have so it can be inferred that it is less related to the other species than they are to each other.B) The crocodile, because it is does not have fur, so it can be inferred that it is less related to the other species than they are to each other.C) The Salmon, because it does not have four legs, so it can be inferred that it is less related to the other species than they are to each other.D) The lancelet, because it doesn’t show any of the characteristics that the others have on the chart, so it can be inferred that it is less related to the other species than they are to each other.
Free Response Question: You are creating a phylogenetic tree. In constructing this diagram, you must look at the information provided to determine where each species branches off from their common ancestors. After constructing this tree, you must:
a) Indicate where in your phylogenetic tree there is a monophyletic group and explain how you know this.b) Indicate where in your tree there is a paraphyletic group and explain how you know this.c) Indicate where in your c tree there is a polyphyletic group and explain how you know this.d) Explain what a clade is, and determine which of the groups in a, b, and c classify as clades and why.Provided information:
You will be putting five species in a phylogenetic tree: leopards (Panthera pardus), gray wolves (Canis lupus), badgers (Taxidea taxus), coyotes (Canis latrans), and otters (Lutra lutra). Based on data collected from a computer on DNA sequences and protein structure, Canis latrans and Canis lupus are the most genetically similar. Taxidea taxus is less genetically similar to Canis lupus and Canis latrans than it is to Lutra lutra, but is more similar to them than Panthera pardus. Panthera pardus is the least genetically similar to any of the other species. Fossil evidence suggested that Panthera pardus’ ancestor (a member of the family Felidae) branched off from the common ancestor (part of the order Carnivora) first. Meanwhile, on the other branch was the common ancestor for both the Mustelidae (including the badger and the otter) and Canidae (including wolves and coyotes) families – which branched off from their ancestor after the Felidae had their own branch. Tasidea Taxus and Lutra lutra split from their common ancestors before Canis latrans and Canis lupus.
(Figure 1)
(Figure 2)

LO 1.20 The student is able to analyze data related to questions of speciation and extinction throughout the Earth’s history.
SP 5.1 The student can analyze data to identify patterns or relationships.
Explanation: Evolution is not goal oriented and this can be proven by the fossil record, often shown in branched evolutions where trends in evolution are apparent. Within a visual display of an evolutionary progression of a species, that display can be analyzed to determine lineages, which are based on the patterns from ancestry to intermediate forms present now. Speciation is the birth while extinction is the death, and the new species that diverge from them are the offspring, where species can undergo species selection (as individual organisms undergo natural selection, species selection pertains to species). Evolution is the result of the interactions between organisms and their current environments, and if environmental conditions change, an apparent evolutionary trend may stop or change to accommodate. As the earth’s history progressed, species evolved and some species died off, and these occurrences are displayed to show trends of speciation.
M.C. Question: Why would extracting a single evolutionary progression from the fossil record be deluding?A) It actually is not deluding because all trends can be seen from that branch.B) You would not be able to see all the adaptive radiations and the series of speciation episodes that could make the trend disappear.C) Evolution usually follows a straight trend and progresses to a fated speciation.D) Changes in that single progression would show muddled trends and lead back to the wrong lineage.Learning Log/ FRW- Style Question: In what way would“differential speciation success” play a role in macroevolution? How would this be considered to be similar to the relationship of differential reproductive success in microevolution?

LO 1.21 The student is able to design a plan for collecting data to investigate the scientific claim that speciation and extinction have occurred throughout the Earth’s history. SP 4.2 The student can design a plan for collecting data to answer a particular scientific question.
Explanation: Speciation is the evolutionary process in which new biological species arise. Extinction is the end of a species of organisms on earth. Both of these terms have been evidenced throughout the history of the planet. Two common types of speciation are sympatric and allopatric. Both of these are exemplified on the Galapagos Islands. Marine iguanas and land iguanas are only found in the Galapagos Islands. The two species have diverged through sympatric speciation. One spends a lot of time in the water and one on land despite the fact that they both inhabit the same islands. How the species of iguana came to be on the island is however allopatric speciation because a common ancestor likely arrived on the island by chance (maybe by way of a raft) and from there broke off into two subspecies. Extinction is something that very well could have happened to a species that was already inhabiting the island upon the iguanas arrival if it was a potential food source. A few random species that have ceased to be on earth are: the koala lemur (Megaladapis edwardsi, Circa 1320), Haast's Eagle (Harpagornis moorei, 16 th century), Ectopistes migratorius (Ectopistes migratorius, 1918), and Tylacine (Thylacinus cynocephalus, 1936), and the Golden Toad (Bufo periglenes, 1989). In the last hundred years extinction rate has increased dramatically. It’s no secret that many of these extinctions are due to the increasing human population. It has been determined that today 99% of the current threatened species in today’s world are because of human activities. Some of these activities are habitat destruction, overexploitation, overhunting, pollution, and introduction of exotic species. A way to collect data relating to this learning objective and science practice would be to choose a long-existing island (because it would likely show examples of not only extinction but speciation, just observing extinction could work on any land mass however) and study skeletons of currently living animals and fossils to potentially see examples of evolution. Studying fossils of extinct species would show you what animals were not fit to survive and reproduce in their environmental climate. Based on carbon dating of fossils the date of extinction can be determined and you could possibly determine cause of extinction. I line of similar occurances can likely soon be created.
Learning Log/FRQ-style Questions: De-Extinction or the bringing back to life of species of animals that have been have previously gone extinct and reintroducing them into the wild is a popular topic today. What are some potential results of reintroducing one of these formerly extinct species back into an ecosystem?
Multiple Choice Question: Which type of human-caused damage to habitats is most detrimental in terms of number of species affected? Hint: Biodiversity is keyA) HuntingB) DeforestationC) PollutionD) Exotic Species Introduction

L.O. 1.22: The student is able to use data from a real or simulated population(s), based on graphs or models of types of selection, to predict what will happen to the population in the future.
S.P. 6.4: The student can make claims and predictions about natural phenomena based on scientific theories and models.
Explanation: When organisms are able to mate and produce fertile offspring in nature, they are considered a species. The creation of a new species comes from evolution, and natural and artificial selection which favors traits beneficial to survival and reproduction. However, there are barriers which must be overcome such as pre-zygotic barriers including habitat isolation, temporal isolation, behavioral isolation, etc. If these barriers are overcome and fertilization occurs, the organism must overcome post-zygotic barriers such as reduced hybrid viability– when the offspring does not survive, reduced hybrid fertility, and hybrid breakdown. Additionally, populations can also be affected by directional selection, disruptive selection, or stabilizing selection which are triggered by various factors. Also, geographic isolation also influences the population and selection due to adaptation. This leads to allopatric speciation which is the evolution of many diversely adaptive species from a common ancestor, in some cases, populations are altered via sympatric speciation which is caused by intrinsic factors such as chromosomal changes. Thus, according to this knowledge and the knowledge of r-selected and k-selected species students are able to evaluate graphs and models of types of selection and associate it with certain characteristics that will enable changes in the population.
The graphs of the seahorse head length over time in generations (G) are measured as the deviation from the initial mean shown in the top graph. The results shown are for a population of 1,000 adults.
M.C. Question: Which of the following possibilities most likely describes the changes represented in the graphs of the seahorse head length? a) They have overcome reproductive barriers with similar species
and thus have undergone convergent evolution to two extremes.
b) Stabilizing selection has occurred. c) As a result of selective mating the species has undergone
disruptive selection, and in this case can also be classified as sympatric speciation.
d) The species has been geographically isolated , as a result, directional selection occurs.
FRQ-style Question: The seahorse population represented in the graphs has naturally undergone disruptive selection. When 50 generations have passed, scientists have the desire to maintain part of the original population. Through human interference ( via artificial selection), a new breed of seahorse is introduced that is meant to maintain those original characteristics. Despite this introduction, and several successful attempts at reproduction, there is no change in the graphs. Explain why this was the case.

LO 1.24: The student is able to describe speciation in an isolated population and connect it to change in gene frequency, change in environment, natural selection and/or genetic drift.
SP 7.2: The student is able to connect and relate knowledge across various scales, concepts and representations in and across domains.Explanation: Speciation, the origin of another species , can be the result of a change in genetic frequency in a species. Changes in genetic frequency are caused by mutations and genetic recombination, allowing for alleles to realign differently, creating different genes, and natural selection selects for the gene with the greatest chance of survival and reproduction. Environmental factors and mountain ranges, islands and other geographic barriers can cause allopatric speciation as the geographic isolation causes the speciation to occur. Reproductive isolation, where one species becomes two when it can no longer reproduce with another due to gamete incompatibility, is an example of sympatric speciation.. M.C. Question: Which is not an example of changes in genetic frequency that can cause speciation.A) recombination during meiosisB) A mutation in an allele coding for beak sizeC) Difference in allometric growthD) Gamete incompatibility
Learning Log/FRQ-style Question: Describe the two ways speciation can occur and name two factors that can cause speciation. For each factor be sure to describe how each leads to speciation.
(a) Allopatric speciation. A population forms a new species while geographically
isolated from its parent population.
(b) Sympatric speciation. A smallpopulation becomes a new specieswithout geographic separation.

LO 1.25 The student is able to describe a model that represents evolution within a population
SP 1.2 The student can describe representatives and models of natural or man-made phenomena and systems in the domain
Explanation: Evolution is a change in a gene pool of a population from generation to generation by such processes as mutation, natural selection, and genetic drift. Mutations occur and can cause a positive or negative change. Then natural selection comes into play, which favors the traits that help the species survive and reproduce in the population. Genetic drift is random changes in the frequency of alleles in a gene pool, usually of small populations. Evolution in a population changes traits to more favorable ones that are better for the certain environment. Factors that can influence evolution are temperature, water, predators, etc.
Multiple choice: Which of the following is true concerning evolution in a population?
a. Evolution only occurs through mutations.
b. An individual that is better adapted in a population will always be more successful in reproducing.
c. Species evolve according to the selective pressures of their environments to become more adapted to their environments.
d. Evolution always involves a change in the frequency of alleles in a gene pool.
e. Natural selection does not occur through evolution.
FRQ/ Learning Log Style Question: Based on the picture above, what color would you believe to be the most favorable for survival? Why? Do you believe this deduction is reliable? Why?

LO 1.26: The student is able to evaluate given data sets that illustrate evolution as an ongoing process. SP 5.3: The student can evaluate the evidence provided by data sets in relation to a particular scientific question.
Explanation: Evolution is an ongoing process, continuously acting on all species. Evolution can be proved by a plethora of scientific evidence. For example, species that are immune or resistant to certain antibiotics or pesticides as well as emergent disease arising from genetic mutations. Evolution can also been see specifically in eukaryotes as structures and processes change to more efficiently achieve a final result.
Free Response Question: a) Based off the cladogram construct a character table to demonstrate
the specific traits possessed by each organism.b) The cladogram does not include koalas add them into the diagram and
explain what traits determine their placement.c) Add koalas to the character table from part a.
M.C. Question: Based off the character table what species is the most evolved?A. Tuna B. SalamanderC. LeopardD. Turtle E. Lancelot
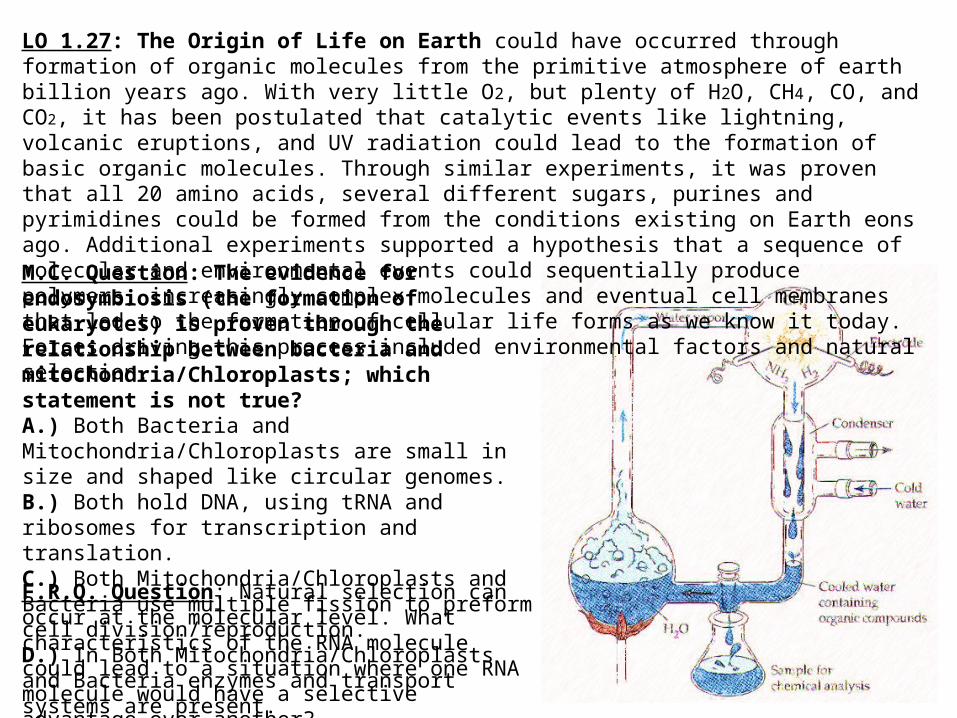
LO 1.27: The Origin of Life on Earth could have occurred through formation of organic molecules from the primitive atmosphere of earth billion years ago. With very little O2, but plenty of H2O, CH4, CO, and CO2, it has been postulated that catalytic events like lightning, volcanic eruptions, and UV radiation could lead to the formation of basic organic molecules. Through similar experiments, it was proven that all 20 amino acids, several different sugars, purines and pyrimidines could be formed from the conditions existing on Earth eons ago. Additional experiments supported a hypothesis that a sequence of molecular and environmental events could sequentially produce polymers, increasingly complex molecules and eventual cell membranes that led to the formation of cellular life forms as we know it today. Forces driving this process included environmental factors and natural selection.M.C. Question: The evidence for endosymbiosis (the formation of eukaryotes) is proven through the relationship between bacteria and mitochondria/Chloroplasts; which statement is not true?A.) Both Bacteria and Mitochondria/Chloroplasts are small in size and shaped like circular genomes. B.) Both hold DNA, using tRNA and ribosomes for transcription and translation.C.) Both Mitochondria/Chloroplasts and Bacteria use multiple fission to preform cell division/reproduction. D.) In Both Mitochondria/Chloroplasts and Bacteria enzymes and transport systems are present.
F.R.Q. Question: Natural selection can occur at the molecular level. What characteristics of the RNA molecule could lead to a situation where one RNA molecule would have a selective advantage over another?

LO 1.28: The student is able to evaluate scientific questions based on hypotheses about the origin of life on Earth.SP 3.3: The student can evaluate scientific questions. Explanation: Due to the intolerable conditions of primitive Earth, the various hypotheses of the origins of life are based on probable cause because of lacking concrete evidence from this coarse time. In order to answer the question of how life on earth began, it is acknowledged that early Earth’s atmosphere was characterized by organic molecules, making up a “primitive soup” able to sustain itself in a environment with limited oxygen. The hypotheses explains the origin of life in four stages: the abiotic synthesis of organic molecules, the joining of the organic molecules (forming polymers), the packaging of these molecules into membranes, and finally the origin of self-replicating molecules. The synthesis of monomers (amino acids, nucleotides) to form polymers (proteins, nucleic acid) also supports the hypothesis that RNA was the first genetic material as it is necessary in the protein synthesis. M.C. Question: Why is abiotic synthesis unlikely to occur today?A. Abundance of oxygen in the atmosphereB. More adapted, evolved enzymes and nucleic acids that replicate at higher ratesC. Insufficiency of light in today’s oceanic systemsD. Climate change is occurring too quickly for abiotic synthesis to be effectiveE. All of the aboveLearning Log/ FRQ-style Question: Why is it more likely that RNA was the first genetic material? Suppose it was discovered that DNA was the first genetic material. How would this effect the current hypothesis of the origin of life? How would it effect the path of evolution?

LO 1.29: The student is able to describe the reasons for revisions of scientific hypotheses of the origin of life on Earth.SP 6.3: The student can articulate the reasons that scientific explanations and theories are refined or replacedExplanation: The origin of life on Earth, for example, has been revised due to the attainment of new evidence that supports a different idea. Another reason for a replacement or revision of a hypothesis is contradicting results of an experiment and a hypothesis. One such revision of the hypothesis for the origin of life on Earth was based on the results of the Miller and Urey experiment that proved their hypothesis that early Earth favored reactions that created organic molecules from inorganic molecules. This replaced the former hypotheses for the origins of life on Earth. The hypotheses for the origin of life on Earth continue to be revised even now the Miller-Urey experimental conditions tested are being questioned and the hypothesis revised.M.C Question: Which of the following statements regarding the origins of life on Earth is false?A) All 20 amino acids needed for life can be formed from inorganic moleculesB) Primitive Earth was unable to support the development of organisms that used the process of cellular respirationC) The process of abiotic synthesis has proved to produce all monomers of life with the exception of lipidsD) The monomers necessary for life were able to evolve into polymers through an abiotic process Learning Log/FRQ-style Question: Suppose that the Miller –Urey experiment was repeated, however, the electrodes that simulated lightning in primitive Earth were excited less frequently. The results of this experiment gave some, but not all of the monomers necessary for life, the rate at which the molecules were created was also much lower than that of the original experiment. What might this mean to the lightning's role in the origin of life?

LO 1.30: The student is able to evaluate scientific hypotheses about the origin of life on Earth.
SP 6.5: The student can evaluate alternative scientific explanations
Explanation: Earth began to many by God creating it, but scientists know otherwise. They turn to the facts that Earth began with organic molecules. The organic molecules had to evolve, therefore they turned to free energy just floating around in the air and synthesized. The lack of oxygen in the air also helped these organic molecules to become more complex than they are today. The organic molecules were monomers, which is a molecule that can be bonded to another. Once they are bonded they make polymers which are more complex than monomers. Monomers are the building blocks for all of the other complex organisms. An example of a monomer is an amino acid, which is the building block of a protein. Now that monomers have evolved to polymers, the polymers can replicate and store information. Which is going to help thus further the beginning of life on earth. Now you must be wondering how could things replicate without any genes? Well the earliest signs of genetic material on earth was ribonucleic acid (RNA) thus giving scientists further proof that the earth began from organic molecules. They called this proof the RNA World hypothesis. People have differing opinions but scientists stick to the facts and that is what we have been taught to do.
M.C. Question: How is it possible that organisms from North America can also be found on Africa?A)The continents were all one big one known as Pangea B) The complex known as continental driftC) The Cambrian Explosion D) A and B onlyE) A, B, and C
Learning Log/FRQ-style Question: Explain the similarities and difference between prokaryotes and eukaryotes. Why do organelle like mitochondria have genetic material in them? Give an example of another organism with the same problem as the mitochondria.

LO 1.31 The student is able to evaluate the accuracy and legitimacy of data to answer scientific questions about the origin of life on Earth. SP 4.4 The student can evaluate sources of data to answer specific scientific questions.
Explanation: Chemical experiments show that it is possible to form complex organic molecules from inorganic molecules in the absence of life. Primitive Earth had inorganic precursors that organic molecules developed from due to the available free energy and the lack of significant amounts of oxygen. These organic molecules then served as monomers for the formation of more complex molecules like amino acids and nucleotides. When these monomers joined they were able to produce polymers with the ability to replicate, store, and transfer information. These complex reactions could have occurred in solution or as reactions on solid reactive surfaces.
M.C Question: The first genetic material was probablyA) DNA PolymerB) Protein enzymeC) RNA PolymerD) Protein
Learning Log/ FRQ-style Question: Why is Ph important to the origin of life?

LO 1.32 The student is able to justify the selection of geological, physical, and chemical data that reveal early Earth conditions.
SP 4.1 The student can justify the selection of the kind of data needed to answer a particular scientific question.
Explanation: Early earth is described as being a "reducing”, electron-adding, atmosphere, in which complex organic molecules were formed from simpler molecules. Water vapor was present back on early Earth, however, when oxygenic photosynthesis first evolved, there was not much free oxygen in the atmosphere, which caused organic molecules to not break down as fast as they do today. Even though oxygen was not used in early photosynthesis, the oxygen in the atmosphere gave rise to cellular respiration. DNA and RNA, using nucleotides and amino acids, play a huge roll in the chemical development on Earth and the physical variation it causes in all species. The main energy source came from sunlight and UV rays, which starts photosynthesis in many different autotrophs. Prokaryotes and eukaryotes begin to form and create life on Earth. Earth was divided into geological eons, eras, and periods. In each of these divisions, the change in composition of the fossil species is evident which leads into the physical data that reveal the living species that used to roam Earth 4.6 billion years ago. The student needs to be able to explain the selected data that represents early Earth in complete sentences and be able to choose what data best resembles the question asked.
M.C. Question: Which of the following best indicates that prokaryotes evolved before eukaryotes?
A) Abiotic experiments with liposomes proved prokaryotes evolved first
B) Fossilized cells closely resemble prokaryotes
C) The structure of primitive plants
D) Prokaryotes have membrane-bound organelles
Learning Log/FRQ-style Question: An isotope’s
half-life is the number of years it takes for 50% of
the original sample to decay. Explain how scientists
calculate and determine the age of a fossil based off
it’s half-life. What elements are used and produced
during the aging of fossils?