Review of UAB Athletics - Frankly Incftpcontent4.worldnow.com/wbrc/PDF/UABFinalReport.pdf ·...
97
University of Alabama at Birmingham Review of UAB Athletics UAB Task Force on Intercollegiate Athletics May 15, 2015 College Sports Solutions | May 2015 Page I 1
Transcript of Review of UAB Athletics - Frankly Incftpcontent4.worldnow.com/wbrc/PDF/UABFinalReport.pdf ·...
University of Alabama at Birmingham
Review of UAB Athletics
UAB Task Force on Intercollegiate Athletics
May 15, 2015
C o l l e g e S p o r t s S o l u t i o n s | M a y 2 0 1 5 P a g e I 1

Table of Contents
I. Introduction .......................................................................................................................................... 3
II. Interviews/Meetings ............................................................................................................................. 4
III. Executive Summary ............................................................................................................................ 10
IV. Assumptions ....................................................................................................................................... 13
V. Budget Analysis of UAB ....................................................................................................................... 15
VI. Benchmarking – Conference USA ....................................................................................................... 20
VII. Benchmarking – Division I Non-Football............................................................................................. 34
VIII. Benchmarking – Division I Other FBS Conferences ............................................................................ 42
IX. Facilities Improvement ....................................................................................................................... 47
X. Debt Service Possibilities .................................................................................................................... 49
XI. Conference Affiliation Without Football ............................................................................................ 50
XII. Research on the Effect of Having Football ......................................................................................... 52
XIII. UAB Potential Funding ........................................................................................................................ 62
XIV. Title IX/Gender Equity......................................................................................................................... 63
XV. Reference Material ............................................................................................................................. 68
XVI. Appendix A .......................................................................................................................................... 71
XVII. Appendix B .......................................................................................................................................... 74
XVIII.Appendix C .......................................................................................................................................... 77
C o l l e g e S p o r t s S o l u t i o n s | M a y 2 0 1 5 P a g e I 2

I. Introduction
College Sports Solutions (CSS) submits this report to the UAB Task Force on Intercollegiate Athletics pursuant to its engagement to perform a comprehensive review of the intercollegiate athletics financial enterprise at UAB. In response to its charge, CSS placed particular focus on (1) the sustainability of its FBS football, women's bowling and rifle programs that were discontinued in December of 2014, (2) membership in Conference USA as opposed to membership in another conference without the sport of football, (3) financial benchmarking against Conference USA and other institutional/conference peers, (4) research on the tangible and intangible effects of sponsoring intercollegiate football on a college campus, and (5) the viability of garnering additional financial support from alumni, donors, ticket holders, and friends of the University, UAB students and faculty, and the surrounding Birmingham community. The CSS team that participated in this review was composed of Jeff Schemmel (President), and consultants Jim Livengood, Rick Bay, Rudy Davalos, Heather Ould, and Kristi Dosh. Attempts were made to interview all possible UAB constituents, both internal and external to the University, in the short time frame allotted. All constituents interviewed are listed herein. In addition, the CSS team reviewed a comprehensive array of documentation and other written information. Those are also listed herein. This report reflects the information gleaned from those interviews and that documentation. We would like to thank all of the people at UAB for their incredible cooperation in setting up and participating in the interviews and providing us the requested documentation, as well as providing answers to our many questions. We would like to specifically thank Wes Smith, Chair of the Task Force, and Shannon Ealy, Interim Director of Athletics, for their tireless efforts in getting us in front of the requested people and in possession of the requested information. Finally, our stated purpose was to interview a representative cross section of people, some in favor of reinstating the affected sports, and some supportive of the decision to discontinue those sports. We must candidly admit that we were impressed by the incredible response from the many people we interviewed, from students to faculty to alumni and donors, to community leaders. With the exception of only a very few, we noted the incredible passion for UAB athletics.
C o l l e g e S p o r t s S o l u t i o n s | M a y 2 0 1 5 P a g e I 3

II. Interviews/Meetings
The following individuals and groups of people were interviewed by the CSS team during the review process. All meetings were in person unless otherwise noted.
Wednesday, April 8
Location: Birmingham, Alabama CSS Team Member: Jeff Schemmel
1. Andrew Hollis, Director of Business Systems; Assistant to University Chief Financial Officer Timothy Garner, Associate Athletic Director for Financial Affairs
2. Allen Bolton, Vice President for Financial Affairs & Administration Andrew Hollis
3. Task Force members a. Tandy Petrov, Graduate student Government President b. Anjali Wagle, Undergraduate Student Government President c. Shannon Ealy, Interim Athletic Director d. Frank Messina, Faculty Athletics Representative
4. Shannon Ealy Frank Messina
5. Shannon Ealy 6. Don Hire, UAB Task Force on Intercollegiate Athletics Member and Donor
Brad Hardekopf, Associate Athletic Director for Development
Monday, April 13
Location: Birmingham, Alabama CSS Team Members: Jeff Schemmel, Kristi Dosh, Jim Livengood, Rudy Davalos, Rick Bay
1. Facilities Tour (Shannon Ealy and Reid Adair) a. Bartow Arena
i. Locker rooms ii. Hospitality rooms (Green & Gold Room; Champion Club Room)
iii. Offices iv. Previous football locker room
b. Football facilities i. New locker room
ii. Meeting rooms iii. Offices iv. Practice Fields
c. Legion Field i. Playing surface
ii. Locker rooms iii. Press box Area
1. Suites 2. Media area
d. Don M. & Marsha Hoke Hire Academic Center (Bell Building)
C o l l e g e S p o r t s S o l u t i o n s | M a y 2 0 1 5 P a g e I 4

e. Young Memorial Field (Baseball) f. UAB Softball Field g. West Campus Field (Soccer) h. Sand Volleyball Courts i. Sports Medicine/Athletic Training (Wallace Gym) j. Strength & Conditioning Center/Weight Room (Wallace Gym) k. Wallace Gym Practice Facility l. Ullman Building
i. Offices 2. Head Coaches
a. Michelle Crews, Head Bowling Coach b. Mark Tjia, Head Women’s Tennis Coach c. Kurt Thomas, Head Track and Field Coach d. Harold Warren, Head Women’s Soccer Coach e. Kerry Messersmith, Head Volleyball Coach
3. Marla Townsend, Head Softball Coach 4. Jerod Haase, Head Men’s Basketball Coach 5. Jack Williams, State Representative
Wes Smith, Chair, UAB Task Force on Intercollegiate Athletics Clay Ryan, Attorney for UAB (Schemmel, Bay, Livengood and Davalos)
6. Anjali Wagle, Undergraduate Student Representative on Task Force (Dosh) 7. UAB Task Force on Intercollegiate Athletics
a. Don Hire b. Tandy Petrov c. Anjali Wagle d. Wes Smith e. Shannon Ealy f. Harold Jones g. Oliver Robinson h. Frank Messina
8. Football Student-Athletes (Schemmel, Livengood, Davalos, Bay) a. James Banks b. Kingsley Ejike c. Trey Grissett d. Hunter Mullins e. Dallas Noriega f. Mark Rawls g. Zach Sims
9. SAAC Leadership (Schemmel, Livengood, Davalos, Bay) a. Catherine Ragon, Women’s Tennis b. Jesse Lawley, Women’s Golf c. Jenna Mellott, Bowling d. Marissa Ferriera, Bowling
C o l l e g e S p o r t s S o l u t i o n s | M a y 2 0 1 5 P a g e I 5

e. Joanna Fallen, Softball f. Jacob Armstrong, Baseball
Tuesday, April 14
Location: Birmingham, Alabama CSS Team Members: Jeff Schemmel, Heather Ould, Jim Livengood, Rudy Davalos, and Rick Bay
1. Wes Smith 2. UAB Athletics Administrative Staff
a. Shannon Ealy b. Bill Lansden, Senior Associate Athletic Director/External c. Derita Ratcliffe, Senior Associate Athletic Director/SWA d. Timothy Garner e. Matt Wildt, Associate Athletic Director/Ticket Operations f. Mike Jones, Associate Athletic Director/Sports Medicine g. Brad Hardekopf h. Norm Reilly, Associate Athletic Director/Media Relations i. Jeff Guin, Associate Athletic Director/Academics j. Corey Bray, Associate Athletic Director/Compliance k. Reid Adair, Assistant Athletic Director/Facilities & Operations l. Jen Kost, Assistant Athletic Director/Marketing m. Molly Mackey, Director/Equipment Operations n. Mason Ellenberger, General Manager/IMG
3. Randy Norton, Head Women’s Basketball Coach Mike Getman, Head Men’s Soccer Coach
4. Derita Ratcliffe 5. Donor/Booster Group
a. Adam Cohen b. Barry Luther c. Lois Luther d. Bill Ireland, Jr. e. Charlie Nowlin f. Don Hire g. Don Huey h. Justin Craft i. Michael Pizitz j. Virginia Jones
6. Bill Clark, Head Football Coach 7. Andrew Hollis
Timothy Garner
C o l l e g e S p o r t s S o l u t i o n s | M a y 2 0 1 5 P a g e I 6
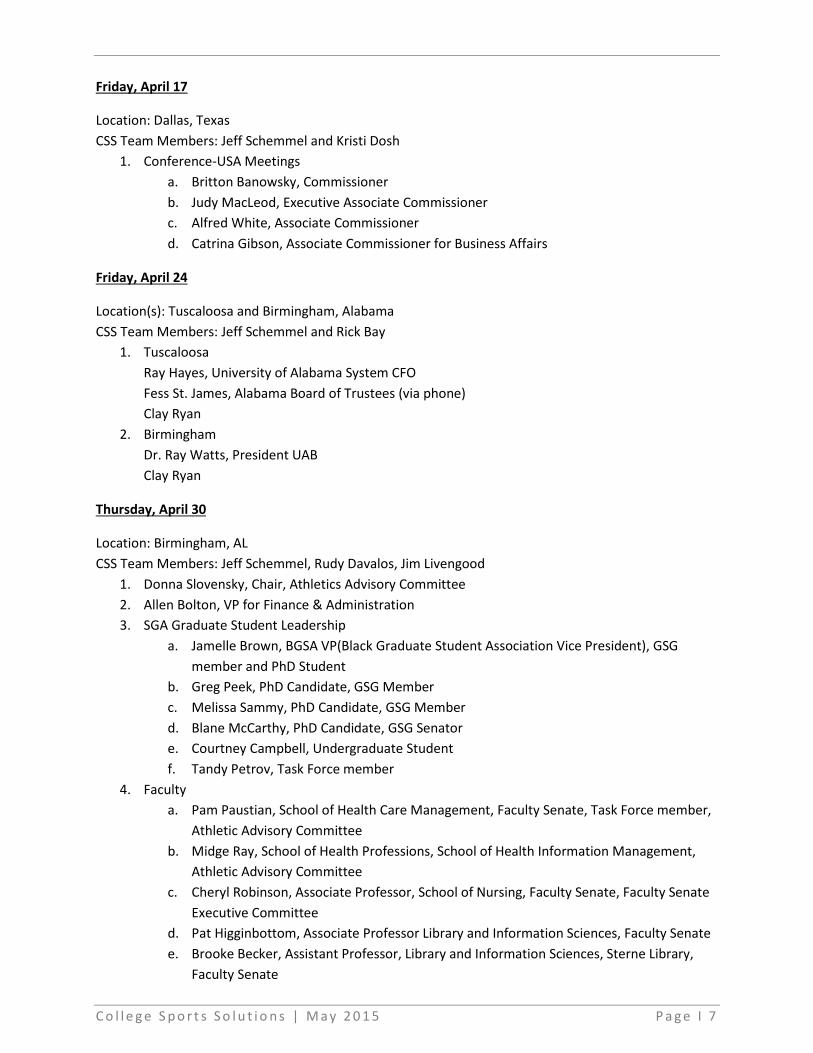
Friday, April 17
Location: Dallas, Texas CSS Team Members: Jeff Schemmel and Kristi Dosh
1. Conference-USA Meetings a. Britton Banowsky, Commissioner b. Judy MacLeod, Executive Associate Commissioner c. Alfred White, Associate Commissioner d. Catrina Gibson, Associate Commissioner for Business Affairs
Friday, April 24
Location(s): Tuscaloosa and Birmingham, Alabama CSS Team Members: Jeff Schemmel and Rick Bay
1. Tuscaloosa Ray Hayes, University of Alabama System CFO Fess St. James, Alabama Board of Trustees (via phone) Clay Ryan
2. Birmingham Dr. Ray Watts, President UAB Clay Ryan
Thursday, April 30
Location: Birmingham, AL CSS Team Members: Jeff Schemmel, Rudy Davalos, Jim Livengood
1. Donna Slovensky, Chair, Athletics Advisory Committee 2. Allen Bolton, VP for Finance & Administration 3. SGA Graduate Student Leadership
a. Jamelle Brown, BGSA VP(Black Graduate Student Association Vice President), GSG member and PhD Student
b. Greg Peek, PhD Candidate, GSG Member c. Melissa Sammy, PhD Candidate, GSG Member d. Blane McCarthy, PhD Candidate, GSG Senator e. Courtney Campbell, Undergraduate Student f. Tandy Petrov, Task Force member
4. Faculty a. Pam Paustian, School of Health Care Management, Faculty Senate, Task Force member,
Athletic Advisory Committee b. Midge Ray, School of Health Professions, School of Health Information Management,
Athletic Advisory Committee c. Cheryl Robinson, Associate Professor, School of Nursing, Faculty Senate, Faculty Senate
Executive Committee d. Pat Higginbottom, Associate Professor Library and Information Sciences, Faculty Senate e. Brooke Becker, Assistant Professor, Library and Information Sciences, Sterne Library,
Faculty Senate
C o l l e g e S p o r t s S o l u t i o n s | M a y 2 0 1 5 P a g e I 7

f. Frank Messina, School of Business, Accounting and Finance, FAR g. Tino Unlap, Associate Professor, School of Health Professionals, Biotechnology, Athletic
Advisory Committee h. Sandra Sims, Associate Professor, School of Education, Health Behavior, Athletic
Advisory Committee i. Catherine Danielon, Associate Dean, College of Arts & Sciences, Foreign Languages,
Athletic Advisory Committee j. David Schneider, Associate Professor, Medicine, Joint Health Sciences, Biochemstry &
Molecular Genetics, Faculty Senate k. Claudio Busettini, Associate Professor, School of Optometry, Vision Sciences, Faculty
Senate, Executive Committee l. Vladimir Parpura, Associate Professor, Joint Health Sciences, Neurobiology, Faculty
Senate m. Alecia Gross, Associate Professor, School of Optometry, Cell, Molecular and
Developmental Biology, Chair-Elect of Faculty Senate n. Jeanne Hutchison, Assistant Professor, Mathematics, College of Arts and Sciences,
Faculty Senate o. Joseph G. Van Matre, Professor, School of Business, Quantitative Methods, Athletic
Advisory Committee p. Jamey Worrill, Associate Professor, Accounting and Finance, School of Business, Faculty
Senate 5. SGA Undergraduate Student Leadership
a. Garrett Stephens, President, SGA b. Alinea Esensoy, Vice President, SGA c. Henry DeGroot d. Chiraz Patol e. Sarah Griffin f. Mekenzi Esensoy g. Catherine McCarty
Wednesday, May 6, 2015
Location: Phoenix, Arizona CSS Team Members: Jeff Schemmel and Jim Livengood
1. Richard Margison, former UAB Chief Financial Officer 2. Britton Banowsky, Commissioner, Conference-USA
Conference Call CSS Team Members: Jeff Schemmel, Jim Livengood, Kristi Dosh, Rudy Davalos
1. Honorable William Bell, Mayor, City of Birmingham Clay Ryan, At Wes Smith, Chair,
C o l l e g e S p o r t s S o l u t i o n s | M a y 2 0 1 5 P a g e I 8

Saturday, May 9, 2015
CSS Team Member: Jeff Schemmel Conference Call
1. Mark Ingram, Incoming Director of Athletics UAB
*Although efforts and requests were made, we were unable to meet or talk with Brian Mackin, former Director of Athletics, or Carol Garrison, former President.
C o l l e g e S p o r t s S o l u t i o n s | M a y 2 0 1 5 P a g e I 9

III. Executive Summary
This Executive Summary is provided as a guide to the information, research, analysis and recommendations contained in this report.
As mentioned in the Introduction, the CSS team was impressed by the transparency of thought and opinion, the honesty and forthrightness provided in all written and verbal responses to questions and inquiries, and the passion for UAB Athletics that was evident in almost everyone with whom we came in contact. There appears to be a genuine desire of constituents to support UAB and its athletics program in a substantial way.
We were impressed with the considerable economic engine that UAB provides within the University of Alabama system. Some reports indicated that UAB provides more than 65% of the revenue produced among the three campuses, and is the largest single employer in the State of Alabama. This signifies an economically strong university, one providing revenue and jobs to the Birmingham area and the State.
A strong message received from the people and groups with whom we spoke, including faculty, students, alumni, donors, friends and community leaders, was their desire to be given an opportunity to provide meaningful financial support for these sports, and for UAB Athletics in general – in essence to be asked to help. It appears that all of these constituent groups, without exception, have made substantive offers of support to reinstate these sports. To that end, we have been made aware anecdotally that in the past several weeks there have been fundraising initiatives from three different groups (donors, students and the City of Birmingham) that have resulted in commitments of substantial monies to help bring back these three sports. Those efforts, and other suggestions, are noted.
There is little doubt that the strong consensus among the student body (graduates and undergraduates), faculty, and staff was that the elimination of the three sports, particularly football, has been detrimental to the University. Football is often part of campus life that students and faculty envision, and has indeed been a part of campus life at UAB for more than two decades. These groups felt strongly that a well-rounded athletics program is consistently a factor in the recruitment of students and faculty. We were struck by the near unanimity of these campus groups in their opinion that the elimination of the sports was damaging to the notion of a stimulating campus environment and detrimental to UAB’s own self-respect.
The loss of football, and any subsequent move without football to another conference will substantially diminish current and future Conference distributions, starting with the “lame duck” year (2015-16) in Conference USA. We believe this loss of revenue will easily surpass two million dollars per year. Further, we believe that, with the growth of the College Football Playoff and other related Conference USA revenue streams, that gap will widen.
It is evident that the UAB expense budget for athletics overall, including football, is currently competitive within Conference USA, both as to salaries and operations. It is further evident that current university-provided financial support, through student fees and other cash subsidies, is not extraordinary within Conference USA or compared to other peer universities, as is evident in the benchmarking shown in this report.
C o l l e g e S p o r t s S o l u t i o n s | M a y 2 0 1 5 P a g e I 1 0
It is also clear that UAB has made a significant and substantial new investment in Men’s Basketball, as evidenced by the increases in salaries and operating budget, in an effort to rekindle the great tradition of UAB basketball and continue the momentum begun this past season. Those numbers are incorporated into our budget projections.
It was argued to our team, in response to reports that tuition is not an actual cost, that all students who might be lost as a result of the discontinuation of these three sports could and would be replaced by other tuition-paying students. It is nevertheless true that of the approximately $29M expense budget for UAB Athletics in the current fiscal year, more than $7M of that is paid directly back to the University in tuition, room and board, books and other fees. In addition, the percentage of UAB undergraduate student population that is from out-of-state is approximately 20%. Of the 161 student-athletes who were on the three eliminated teams this year, almost 60% were from out-of-state. Although not critical, this represents a significant loss of out-of-state tuition revenue that would not be replaced.
The indirect benefits football has on a campus as a whole are difficult to quantify, but we reviewed numerous studies herein that found applications, enrollment, state appropriations and donations can be positively impacted by the presence of an FBS football program. Although the biggest returns are seen through appearances in bowl games and national championships, the benefits begin by merely fielding a team and steadily improving on the field (something UAB was doing last season). Conversely, discontinuing football has been found to have a negative impact on the university at large, including decreased enrollment (particularly for males) and even decreased ranking of men’s basketball teams. Several universities which had previously discontinued football have restarted in recent years, and we invite UAB to reach out to those universities and discuss their experiences and reasoning.
We also found studies that suggest the largest impacts are on male enrollment and black/African American enrollment. Last year, just 289 males were declined admission to UAB, a substantive consideration when looking to replace football student athletes with other qualified applicants. Black/African American football student athletes have accounted for 12% of all black/African American males on campus, and that number has held steady for several years.
An additional negative impact of discontinuing football is the impact the announcement had on other sports with regards to recruiting and donor relations. One particular head coach provided us with emails documenting both the loss of multiple recruits/commitments and multiple donors, including a $1 million pledge (the last information we received is that relationships with these donors is being repaired).
An issue brought up by coaches and athletic administrators was an exercise called “zero-based budgeting,” which was initiated in 2013-14, wherein coaches were encouraged to embed their wish lists into the budget numbers. Those inflated numbers, the coaches felt, were then utilized to build expense budgets that showed numbers that were not sustainable. The analysis in this report is based on current budgets and their effectiveness, with benchmarking against conference and institutional peers.
Our team was made aware of, and struggled with, the logistics of the UAB Athletics fiscal year, which runs October 1 to September 30. This creates obvious, numerous and significant difficulties for a university with a semester based school year, and is inconsistent with Conference and NCAA fiscal years.
C o l l e g e S p o r t s S o l u t i o n s | M a y 2 0 1 5 P a g e I 1 1

Our understanding is that the University of Alabama, Tuscaloosa Athletic Department is on a July 1 to June 30 fiscal year. We recommend the same for UAB.
Title IX considerations should continue to be a priority, as they have in the past, under any scenario. There is a history of continuing expansion of opportunities for the underrepresented sex, but, depending on the outcomes, those considerations will change. Participation ratios and financial aid ratios are projected herein.
The purpose of this report is to provide as much meaningful information as possible relative to two financial scenarios. One scenario is for UAB to continue without these sports, and the other is to reinstate them. The financial projections for these two scenarios are substantially different, and clearly provide disparate paths for UAB and UAB Athletics. The scenario bringing back these sports includes a delta, showing the difference between current and projected funding for athletics, and the operational expenses of the department with those sports included. The opportunities to eliminate that delta are discussed herein.
We believe both scenarios are viable in very different ways. The real questions become what does UAB want to be in intercollegiate athletics, in whose company does it want to stand, and what is the best fit to match the mission and vision of the University?
We do believe that if a decision is in fact made to reinstate these sports, it would foster much good will and stimulate a substantial amount of spiritual and financial support from alumni, donors, ticket holders, friends, students, faculty and the community. It could create a unique opportunity, not only through that support, but also through unprecedented positive national attention to the University.
Finally, UAB is welcoming a new Athletic Director in Mark Ingram, and his ideas, vision and leadership will be critical as UAB moves forward. Much of the decision-making relative to issues addressed in this report will be entrusted to him and his team.
C o l l e g e S p o r t s S o l u t i o n s | M a y 2 0 1 5 P a g e I 1 2

IV. Assumptions
The following assumptions are provided based on the charge from the task force and interviews throughout the review process. They have guided CSS in its preparation of this report. In some instances, we have noted a specific interview from which a particular assumption was gleaned.
x The Board of Trustees of the University of Alabama System desires UAB to be a successful major university, and to grow in stature as a well-rounded tier one institution.
o The Board believes that intercollegiate athletics is an important part of the institution, adding to a diverse population of students and bringing a well-rounded collegiate experience to students, faculty and staff.
o The Board believes that successful intercollegiate athletics can bring positive media attention to the institution in a variety of ways.
x UAB and its President believe that a successful and vibrant intercollegiate athletic enterprise can be a source of pride to the institution, its alumni, donors, ticket holders, friends, the City of Birmingham, the surrounding communities and the State of Alabama.
x Participation in Intercollegiate Athletics as a member of NCAA Division I is consistent with the University’s Vision and Mission.
x The UAB Administration desires to sponsor intercollegiate athletics teams that consistently compete at a high level among their athletics peers, specifically within the top half of the conference. Those without conference affiliation should compete consistently for regional (if applicable) and/or national championships.
x The UAB Administration recognizes that attaining and maintaining a competitive position in the upper half of its conference within NCAA Division I requires ongoing revenue from varied sources, including departmentally-generated revenues such as ticket sales, fundraising, multi-media rights/sponsorships, radio, television, licensing, marketing, and University allocations such as student fees, and other cash and non-cash allocations.
x UAB Athletics strategic planning should support the University’s Strategic Plan. x UAB is dedicated to fostering a climate of diversity and equity for all elements of the campus
community, including intercollegiate athletics. x UAB will provide the maximum number of NCAA allowable student-athlete scholarships in all
sports that it sponsors. x Similar to many other Division I/FBS institutions, UAB has yet to determine its comprehensive
strategy relative to providing the resources for the permissible student-athlete well-being benefits outlined in the new NCAA Division I legislation, including cost of attendance.
x UAB is committed to the well-being of the student-athletes, and to providing the best overall experience possible for those student-athletes.
x The academic success of UAB student-athletes is paramount, including exceptional APR numbers, Graduation Rates, and Graduation Success Rates, and UAB is committed to providing the resources to ensure that success.
x The Board of Trustees for the University of Alabama system would look favorably upon return of football, bowling and rifle if such a return were made with sound financial considerations and plans (Trustee Fess St. John interview).
C o l l e g e S p o r t s S o l u t i o n s | M a y 2 0 1 5 P a g e I 1 3

x The UAB Administration would look favorably upon the return of football, bowling and rifle if such a return were made with sound financial considerations and plans (President Watts interview).
x The UAB Administration desires to keep University support for intercollegiate athletics at
current levels with adjustments only for inflation, tuition, cost of living, etc.
x The UAB Administration would welcome, if passed, a student referendum providing substantive additional funding for intercollegiate athletics through a designated student fee, including specific funding for the sports of football, bowling and rifle.
x The UAB Administration would welcome additional funding assistance from other sources,
including the City of Birmingham, surrounding communities, alumni/donors and ticket holders, as a source of funding to bring back the sports of football, bowling and rifle.
C o l l e g e S p o r t s S o l u t i o n s | M a y 2 0 1 5 P a g e I 1 4

V. Budget Analysis of UAB
CSS was able to review the following budget documentation provided by UAB:
x Revenue and Expense Budgets for the 2013-14 and 2014-15 years x Preliminary Estimates for Expense Budget for 2015-16
In addition, CSS researched and benchmarked revenue and expense information of other institutions in Conference-USA, Mid-American, Sun Belt, Missouri Valley, and Atlantic Ten Conferences.
Our analysis and projections regarding UAB’s future revenue and expenses are provided under two scenarios, as follows:
(1) With the three sports of football, bowling and rifle included, and
(2) With those three sports eliminated. The following methodology and assumptions were utilized:
Projected Revenue and Expense a. Including increased Men’s Basketball expenses resulting from new Letter of Intent with
Coach Haase, including: i. Salaries
ii. Travel iii. Other
b. Revenue estimates (with and without football) i. Tickets
ii. Marketing/Multi-Media Rights iii. Fundraising iv. Licensing
c. Conference and NCAA distributions 1. College Football Playoff (CFP) (C-USA only) 2. Conference Football Championship Game (C-USA only) 3. Conference Men’s Basketball Tournament 4. Conference Television 5. NCAA Men’s Basketball Tournament Units 6. Bowl Games (C-USA only) 7. NCAA Student Assistance Funds (SAF) 8. NCAA Academic Enhancement Fund 9. NCAA Conference Grants 10. NCAA Sports Sponsorship 11. NCAA Grants-in-Aid
d. University i. Student Fees
ii. Other current support e. Anticipated contract penalties from cancelled games f. Committed financial aid money for student-athletes of cancelled sports
C o l l e g e S p o r t s S o l u t i o n s | M a y 2 0 1 5 P a g e I 1 5

UAB Revenue and Expense Budget Projections With Football, Bowling and Rifle
Revenue Assumptions:
x Conference Distribution Numbers for 2017 and beyond are estimated for Conference USA. x Student Fees are increased annually by 5%, assuming a commensurate increase in tuition. x Institutional subsidy is increased annually by 3% to accommodate cost of living, etc. x Corporate Sponsorship estimates based on information provided regarding IMG renegotiations
without football for one year, then increased to previous level. x Reductions in NCAA distributions were estimated based on existing NCAA formulas as applied to
projected programs, grants-in-aid, pell grants, and numbers of student-athletes for 2016 then increased in following years when sports are fully re-instated. The NCAA student assistance fund was increased at a greater rate as this fund has grown 89% in the past seven years by the NCAA overall. Calculations reflect that rate in 2017.
x Increase in football gate receipts were included with an assumption that an outbound ticket sales staff would contribute in reaching these figures.
Revenue FY15 Budget FY16 FY17 FY18 FY19 FY20
Student Activity Fees 5,311,755$ 5,577,343$ 5,856,210$ 6,149,020$ 6,456,471$ 6,779,295$ Institutional Subsidy (excluding tuition waivers) 14,096,787$ 14,519,691$ 14,955,281$ 15,403,940$ 15,866,058$ 16,342,040$ Tuition Waivers (provided by institution) -$ -$ -$ -$ -$ -$ Corporate Sponsorships 950,000$ 475,000$ 950,000$ 950,000$ 950,000$ 950,000$ Fundraising/Donations 2,385,000$ 2,385,000$ 2,385,000$ 2,385,000$ 2,385,000$ 2,385,000$ Basketball Gate Receipts 640,000$ 700,000$ 750,000$ 800,000$ 850,000$ 900,000$ Football Gate Receipts 515,000$ -$ 600,000$ 700,000$ 800,000$ 900,000$ Basketball Guarantees 125,000$ 130,000$ 140,000$ 150,000$ 160,000$ 170,000$ Football Guarantees 1,475,000$ -$ 1,300,000$ 1,400,000$ 1,500,000$ 1,500,000$ Other Sport Guarantees & Gate Receipts 45,000$ 46,350$ 47,741$ 49,173$ 50,648$ 52,167$ Radio/TV Income (excluding Conference Distribution) -$ -$ -$ -$ -$ -$ Merchandise Sales/Programs/Concessions -$ -$ -$ -$ -$ -$ NCAA - Grant Money Grants-In-Aid 700,000$ 423,000$ 700,000$ 721,000$ 742,630$ 764,909$ Academic Enhancement -$ -$ -$ -$ -$ -$ Sports Sponsorship 180,000$ 155,454$ 180,000$ 185,400$ 190,962$ 196,691$ Conference Distribution NCAA Men's Basketball Units 350,000$ 400,000$ 400,000$ 450,000$ 500,000$ 500,000$ Conference Basketball Tournament 40,000$ 50,000$ 50,000$ 60,000$ 70,000$ 80,000$ Television 900,000$ -$ 1,000,000$ 1,000,000$ 1,000,000$ 1,000,000$ Marketing 7,000$ -$ 10,000$ 10,000$ 10,000$ 10,000$ Conference Football Championship 2,000$ -$ 2,000$ 2,000$ 2,000$ 2,000$ Bowls 40,000$ -$ 40,000$ 40,000$ 40,000$ 40,000$ Other (including CFP distribution) 1,061,000$ -$ 1,100,000$ 1,200,000$ 1,300,000$ 1,400,000$ Other Income: (List below)
Endowment and Investment Income -$ -$ -$ -$ -$ -$ Reserve/Athletic Fund Balance -$ -$ -$ -$ -$ -$ Foundation -$ -$ -$ -$ -$ -$ Facility Rental -$ -$ -$ -$ -$ -$ Facility Enhancement Fees -$ -$ -$ -$ -$ -$ Seat Options/Assessments -$ -$ -$ -$ -$ -$ Stadium Skybox Rentals/Suite Leases -$ -$ -$ -$ -$ -$ RV Parking -$ -$ -$ -$ -$ -$ Parking -$ -$ -$ -$ -$ -$ Seat Back Rentals -$ -$ -$ -$ -$ -$ Handling/Postage -$ -$ -$ -$ -$ -$ Processing Fees -$ -$ -$ -$ -$ -$ NCAA Student Assistance Fund (est. on NCAA formula) 220,000$ 120,000$ 247,940$ 279,428$ 314,916$ 354,910$ Graduate Assistant Waivers -$ -$ -$ -$ -$ -$ Licensing and Royalties 70,000$ 50,000$ 75,000$ 85,000$ 95,000$ 105,000$ Cheerleading Camp/Appearances -$ -$ -$ -$ -$ -$ University Support -$ -$ -$ -$ -$ -$ Contracts -$ -$ -$ -$ -$ Other Revenue 100,500$ 103,515$ 106,620$ 109,819$ 113,114$ 116,507$
Total Revenue 29,214,042$ 25,135,352$ 30,895,792$ 32,129,780$ 33,396,799$ 34,548,519$
With Football, Rifle, & Bowling
C o l l e g e S p o r t s S o l u t i o n s | M a y 2 0 1 5 P a g e I 1 6

Expense Assumptions:
x No reduction in Administrative Salaries and Benefits were made, a 2% annual increase is included.
x Per UAB instruction, Cost of Attendance for all student-athletes was phased in over a five year period, beginning in FY16, with the first year at $2,000 per student-athlete with cost of attendance including football, rifle, and bowling in 2017.
x Academic Year Financial Aid for 2016 included a modified figure for football, bowling, and rifle in addition to the financial aid commitment made to student-athletes that remained, as a separate line item for that year only. All student-athletes are accounted for in 2017 under Academic Year Financial Aid.
x With the exception of Men’s Basketball, which was increased pursuant to Letter of Intent, all sports operating budgets were increased by 3% each year with additional increases to football primarily. 2016 figures for football, bowling, and rifle do not include game expenditures since there will be no competition that season. Increases provided within this area which include additional support for recruiting.
UAB Expenses FY15 Budget FY16 FY17 FY18 FY19 FY20
Administration Admin Salaries 4,099,257$ 4,181,242$ 4,264,867$ 4,350,164$ 4,437,168$ 4,525,911$ Admin Expenses (Includes Benefits) 5,108,682$ 5,261,942$ 5,419,801$ 5,582,395$ 5,749,867$ 5,922,363$
Athletic Financial AidAcademic Year Aid 6,706,779$ 4,693,158$ 7,394,224$ 7,763,935$ 8,152,132$ 8,559,738$ Summer Aid 958,111$ 731,367$ 1,056,317$ 1,109,133$ 1,164,590$ 1,222,819$ Cost of Attendance 350,000$ 708,600$ 923,800$ 1,136,000$ 1,226,880$
Sport Salaries 4,991,060$ 5,866,036$ 5,983,357$ 6,103,024$ 6,225,085$ 6,349,586$ Sport Operating Expenses
Baseball 499,866$ 514,862$ 530,308$ 546,217$ 562,604$ 579,482$ Men's Basketball 1,460,645$ 2,034,375$ 2,225,000$ 2,600,000$ 2,678,000$ 2,758,340$ Women's Basketball 800,252$ 824,260$ 848,987$ 874,457$ 900,691$ 927,711$ Men's Cross CountryWomen's Cross Country, Indoor/Outdoor Track 241,257$ 248,495$ 255,950$ 263,628$ 271,537$ 279,683$ Football 2,524,734$ 1,546,575$ 3,185,000$ 3,280,550$ 3,378,967$ 3,480,335$ Men's Golf 116,370$ 119,861$ 123,457$ 127,161$ 130,975$ 134,905$ Women's Golf 95,001$ 97,851$ 100,787$ 103,810$ 106,924$ 110,132$ Men's Soccer 334,359$ 344,390$ 354,721$ 365,363$ 376,324$ 387,614$ Women's Soccer 255,836$ 263,511$ 271,416$ 279,559$ 287,946$ 296,584$ Softball 352,682$ 363,262$ 374,160$ 385,385$ 396,947$ 408,855$ Men's Tennis 78,947$ 81,315$ 83,755$ 86,268$ 88,856$ 91,521$ Women's Tennis 84,249$ 86,776$ 89,380$ 92,061$ 94,823$ 97,668$ Volleyball 310,632$ 319,951$ 329,549$ 339,436$ 349,619$ 360,108$ Bowling 80,217$ 48,000$ 83,000$ 85,490$ 88,055$ 90,696$ Rifle 26,942$ 6,713$ 32,234$ 33,201$ 34,197$ 35,223$ Sand Volleyball 88,164$ 90,809$ 93,533$ 96,339$ 99,229$ 102,206$
Game Guarantee Contract Penalties -$ 1,962,500$ -$ -$ -$ -$ Financial Aid Commitment -FB/Bowl/Rifle (Estimated) -$ 1,146,039$ -$ Total 29,214,042$ 31,183,291$ 33,808,404$ 35,391,377$ 36,710,533$ 37,948,361$
Summary FY15 Budget FY16 FY17 FY18 FY19 FY20
Revenue 29,214,042$ 25,135,352$ 30,895,792$ 32,129,780$ 33,396,799$ 34,548,519$ Expenses 29,214,042$ 31,183,291$ 33,808,404$ 35,391,377$ 36,710,533$ 37,948,361$ Difference -$ (6,047,939)$ (2,912,612)$ (3,261,596)$ (3,313,735)$ (3,399,843)$
C o l l e g e S p o r t s S o l u t i o n s | M a y 2 0 1 5 P a g e I 1 7

UAB Revenue and Expense Budget Projections Without Football, Bowling and Rifle
Revenue Assumptions:
x Conference Distribution Numbers for 2017 and beyond are estimated from Missouri Valley Conference. 2015-16 numbers are based on Conference USA bylaws and its notice to UAB.
x Student Fees are increased annually by 5%, assuming a commensurate increase in tuition x Institutional subsidy is increased annually by 3% to accommodate cost of living, etc. x Corporate Sponsorship reduced estimates based on information provided regarding IMG
renegotiations without football. x Fundraising reduced estimates based on conversations with donors and fundraisers relative to
the elimination of the three sports. x Reductions in NCAA distributions were estimated based on existing NCAA formulas as applied to
projected programs, grants-in-aid, pell grants, and numbers of student-athletes.
Revenue FY15 Budget FY16 FY17 FY18 FY19 FY20
Student Activity Fees 5,311,755$ 5,577,343$ 5,856,210$ 6,149,020$ 6,456,471$ 6,779,295$ Institutional Subsidy (excluding tuition waivers) 14,096,787$ 14,519,691$ 14,955,281$ 15,403,940$ 15,866,058$ 16,342,040$ Tuition Waivers (provided by institution) -$ -$ -$ -$ -$ -$ Corporate Sponsorships 950,000$ 475,000$ 475,000$ 475,000$ 475,000$ 475,000$ Fundraising/Donations 2,385,000$ 1,500,000$ 1,500,000$ 1,500,000$ 1,500,000$ 1,500,000$ Basketball Gate Receipts 640,000$ 700,000$ 750,000$ 800,000$ 850,000$ 900,000$ Football Gate Receipts 515,000$ -$ -$ -$ -$ -$ Basketball Guarantees 125,000$ 130,000$ 140,000$ 150,000$ 160,000$ 170,000$ Football Guarantees 1,475,000$ -$ -$ -$ -$ -$ Other Sport Guarantees & Gate Receipts 45,000$ 46,350$ 47,741$ 49,173$ 50,648$ 52,167$ Radio/TV Income (excluding Conference Distribution) -$ -$ -$ -$ -$ -$ Merchandise Sales/Programs/Concessions -$ -$ -$ -$ -$ -$ NCAA - Grant Money Grants-In-Aid 700,000$ 423,000$ 435,690$ 448,761$ 462,224$ 476,090$ Academic Enhancement -$ -$ -$ -$ -$ -$ Sports Sponsorship 180,000$ 120,000$ 123,600$ 127,308$ 131,127$ 135,061$ Conference Distribution NCAA Men's Basketball Units 350,000$ -$ 150,000$ 150,000$ 150,000$ 150,000$ Conference Basketball Tournament 40,000$ -$ 40,000$ 40,000$ 40,000$ 40,000$ Television 900,000$ -$ -$ -$ -$ -$ Marketing 7,000$ -$ 5,000$ 5,000$ 5,000$ 5,000$ Conference Football Championship 2,000$ -$ -$ -$ -$ -$ Bowls 40,000$ -$ -$ -$ -$ -$ Other 1,061,000$ -$ 30,000$ 30,000$ 30,000$ 30,000$ Other Income: (List below)
Endowment and Investment Income -$ -$ -$ -$ -$ -$ Reserve/Athletic Fund Balance -$ -$ -$ -$ -$ -$ Foundation -$ -$ -$ -$ -$ -$ Facility Rental -$ -$ -$ -$ -$ -$ Facility Enhancement Fees -$ -$ -$ -$ -$ -$ Seat Options/Assessments -$ -$ -$ -$ -$ -$ Stadium Skybox Rentals/Suite Leases -$ -$ -$ -$ -$ -$ RV Parking -$ -$ -$ -$ -$ -$ Parking -$ -$ -$ -$ -$ -$ Seat Back Rentals -$ -$ -$ -$ -$ -$ Handling/Postage -$ -$ -$ -$ -$ -$ Processing Fees -$ -$ -$ -$ -$ -$ NCAA Student Assistance Fund (est. on NCAA formula) 220,000$ 120,000$ 135,240$ 152,415$ 171,772$ 193,587$ Graduate Assistant Waivers -$ -$ -$ -$ -$ -$ Licensing and Royalties 70,000$ 50,000$ 51,500$ 53,045$ 54,636$ 56,275$ Cheerleading Camp/Appearances -$ -$ -$ -$ -$ -$ University Support -$ -$ -$ -$ -$ -$ Contracts -$ -$ -$ -$ -$ Other Revenue 100,500$ 103,515$ 106,620$ 109,819$ 113,114$ 116,507$
Total Revenue 29,214,042$ 23,764,898$ 24,801,882$ 25,643,481$ 26,516,050$ 27,421,023$
Without Football, Rifle, & Bowling
C o l l e g e S p o r t s S o l u t i o n s | M a y 2 0 1 5 P a g e I 1 8

Expense Assumptions:
x Due to the loss of the three sports, reductions of 20% in Administrative Salaries and Benefits were made in the following areas:
o Academics o Strength and Conditioning o Medical Services
x Per UAB instruction, Cost of Attendance for all student-athletes was phased in over a five year period, beginning in FY16, with the first year at $2,000 per student-athlete.
x With the exception of Men’s Basketball, which was increased pursuant to Letter of Intent, all sports operating budgets were increased by 3% each year.
x Conference entry fee of $350,000.
UAB Expenses FY15 Budget FY16 FY17 FY18 FY19 FY20
Administration Admin Salaries 4,099,257$ 3,872,903$ 3,950,361$ 4,029,368$ 4,109,955$ 4,192,154$ Admin Expenses (Includes Benefits) 5,108,682$ 5,168,341$ 5,323,392$ 5,483,093$ 5,647,586$ 5,817,014$
Athletic Financial AidAcademic Year Aid 6,706,779$ 4,153,677$ 4,361,361$ 4,579,429$ 4,808,401$ 5,048,821$ Summer Aid 958,111$ 619,631$ 650,613$ 683,143$ 717,301$ 753,166$ Cost of Attendance 303,200$ 427,800$ 549,400$ 671,000$ 721,440$
Sport Salaries 4,991,060$ 4,221,620$ 3,916,668$ 3,995,001$ 4,074,901$ 4,156,399$ Sport Operating Expenses
Baseball 499,866$ 514,862$ 530,308$ 546,217$ 562,604$ 579,482$ Men's Basketball 1,460,645$ 2,034,375$ 2,225,000$ 2,600,000$ 2,678,000$ 2,758,340$ Women's Basketball 800,252$ 824,260$ 848,987$ 874,457$ 900,691$ 927,711$ Men's Cross Country -$ 40,000$ 41,200$ 42,436$ 43,709$ 45,020$ Women's Cross Country, Indoor/Outdoor Track 241,257$ 248,495$ 255,950$ 263,628$ 271,537$ 279,683$ Football 2,524,734$ Men's Golf 116,370$ 119,861$ 123,457$ 127,161$ 130,975$ 134,905$ Women's Golf 95,001$ 97,851$ 100,787$ 103,810$ 106,924$ 110,132$ Men's Soccer 334,359$ 344,390$ 354,721$ 365,363$ 376,324$ 387,614$ Women's Soccer 255,836$ 263,511$ 271,416$ 279,559$ 287,946$ 296,584$ Softball 352,682$ 363,262$ 374,160$ 385,385$ 396,947$ 408,855$ Men's Tennis 78,947$ 81,315$ 83,755$ 86,268$ 88,856$ 91,521$ Women's Tennis 84,249$ 86,776$ 89,380$ 92,061$ 94,823$ 97,668$ Volleyball 310,632$ 319,951$ 329,549$ 339,436$ 349,619$ 360,108$ Bowling 80,217$ -$ -$ -$ -$ -$ Rifle 26,942$ -$ -$ -$ -$ -$ Sand Volleyball 88,164$ 90,809$ 93,533$ 96,339$ 99,229$ 102,206$
New Conference Entry Fee Estimate 350,000$ Game Guarantee Contract Penalties -$ 1,962,500$ -$ -$ -$ -$ Financial Aid Commitment -FB/Bowl/Rifle (Estimated) -$ 1,146,039$ 679,534$ 490,538$ 202,905$ -$ Total 29,214,042$ 27,227,630$ 25,031,931$ 26,012,093$ 26,620,232$ 27,268,822$
Summary FY15 Budget FY16 FY17 FY18 FY19 FY20
Revenue 29,214,042$ 23,764,898$ 24,801,882$ 25,643,481$ 26,516,050$ 27,421,023$ Expenses 29,214,042$ 27,227,630$ 25,031,931$ 26,012,093$ 26,620,232$ 27,268,822$ Difference -$ (3,462,732)$ (230,049)$ (368,612)$ (104,181)$ 152,201$
C o l l e g e S p o r t s S o l u t i o n s | M a y 2 0 1 5 P a g e I 1 9

VI. Benchmarking – Conference USA
Both UAB and C-USA provided the FY 2015 Conference USA Budget Survey. Analysis is provided relative to overall revenues and expenditures. Also, benchmarking for the three sports of football, rifle and bowling is provided. This analysis includes operations, athletic financial aid, and salaries. Further season ticket sales information is provided for football. The sports of rifle and bowling are not C-USA sponsored sports. However, benchmarking was available for one other C-USA member in each of those sports, and additional benchmarking information from the NCAA is provided. For C-USA comparisons, information is provided for the maximums, medians, and minimums. UAB’s rank within the conference is also provided. Information relative to specific member institutions is kept confidential and members are identified with the letters “A” through “M” on respective charts. Salaries are listed from high to low. The lettering is different for each chart and does not indicate the same institution throughout. The following definitions are used in various benchmarking areas for reference and clarity only. Sport Expenses
x Recruiting - Includes recruiting travel, off-campus and on-campus recruiting costs. x Travel - Includes all regular season costs associated with team and other travel other than
recruiting, championships, bowls and all other post season travel. x Championships, Bowls and Post Season Travel - Includes all costs associated with
championships, bowls and all other post season team travel. x Game Guarantees Paid – Includes guarantees paid to other institutions for participation in a
home contest. x Game Management Expenses - Includes officials, statisticians, security,
concessions/tickets/program sales personnel (if not on salary), band, half-time performers, etc. x Operating Expenses - Includes but is not limited to items such as phone, postage, office
equipment, furniture, TV, VCR, computers, office supplies, outside printing costs, professional/consultant services, professional memberships, storage, rental expenses (other than playing facilities), day-to-day program costs.
x Athletic Equipment - Includes items such as uniforms, shoes, practice gear, athletic supplies, equipment repair, books, periodicals.
x Facility Rental - Listed cost by sport for rental of practice and competition facilities. x Benefits – Total budgeted benefits related to compensation x Other Expenditures - Anything not listed in the above categories. x Total – Total Expense Budget per category/sport.
Financial Aid
x Academic Year Scholarships - Amount of aid budgeted for scholarships for the academic year. (Include Exhausted Eligibility, etc)
x Summer Scholarships – Amount of aid budgeted for summer school for each sport. x Total Financial Aid – Total amount of Scholarships budgeted for fiscal year (Academic Year +
Summer)
C o l l e g e S p o r t s S o l u t i o n s | M a y 2 0 1 5 P a g e I 2 0
x Total Athletic Grant Amount - Total dollar value of scholarships awarded by the athletic department. This number can be found on the team squad list form under the “Athletic Grant Amount” total.
x Total Countable Aid - This includes all types of aid awarded by the institution that is countable toward individual and team limits under NCAA rules (e.g., athletic scholarships, need-based aid, academic scholarships, other institutional scholarships). It does not include federal aid (e.g., Pell Grant). This information can be obtained from the squad list form under the “Total Countable Aid” total.
x Total Equivalencies - This number represents the total number of “full-ride” equivalencies offered. This information may be obtained from the squad list form under the “Countable Players Equivalent Award” total.
x Total Athletic Award Equivalencies – This number represents the total number of equivalencies using only athletic award money. This information may be obtained from the squad list form under the “Revenue Distribution Equivalent Award” total.
Salaries
x Salary - Base salary does not include other compensation or benefits. Benefits are included in the specific sport or administration expense Benefits Column as a lump sum.
x Other - Indicates any additional amounts included in total salary package (bonuses, automobile stipends, cell phone stipends, and all other monetary values). Does not include benefits.
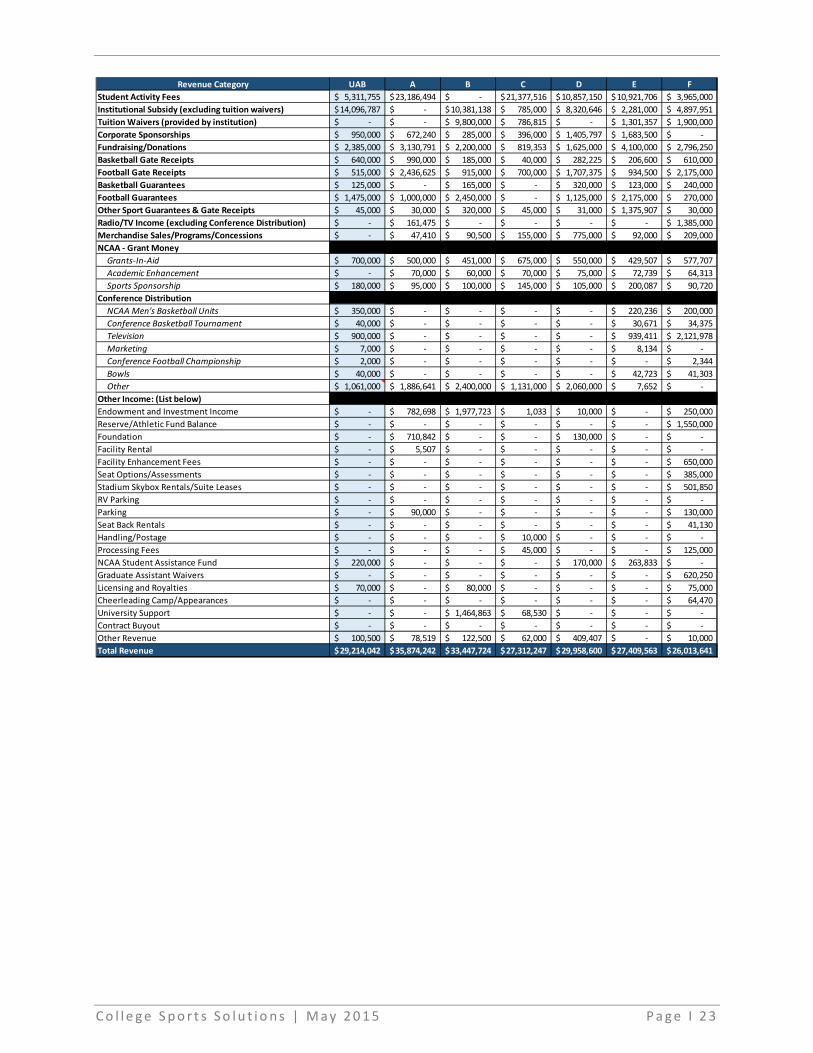
I. Revenue Budgets The C-USA budget survey includes an assessment of revenue sources. This includes both institutionally provided sources of revenue and self-generated revenue. It is important to note that each institution’s funding model is different, particularly from institutional sources. Those sources include direct subsidies, student fees, tuition reductions/waivers, assumption of costs, assumption of debt, reduced or free rent of facilities, and other cash and non-cash subsidies. Therefore it would be expected to see a variety of institutional sources of revenue throughout the Conference and the nation. UAB budgeted a total revenue of $29,214,042 for 2014-15. This total ranks fourth within the conference and nearly $4 million above the conference median. When reviewing self-generated sources of revenue, UAB ranks within the top-half of the conference for corporate sponsorships (5), fundraising/donations (7), and football guarantees (5). For ticket sales, basketball ranks fourth, while football gate receipts ranked last within the conference at $515,000. The conference median is $942,250 for football. Within conference distribution UAB has $0 noted for Academic Enhancement. The institution should receive an estimate of $72,000 in revenue annually. This funding, along with the NCAA Student Assistance Fund, goes into restricted accounts that roll the balance forward each year for UAB. Feedback received from UAB noted the department typically only budgets one of the two when a portion of the funds roll over based on the institution fiscal year. Merchandise sales/Programs/Concessions was reported at $0 for UAB. UAB athletics does not receive revenue for concessions at Legion Field or Bartow Arena. The on-campus facility concessions is overseen by the campus Business Auxiliary group.
C o l l e g e S p o r t s S o l u t i o n s | M a y 2 0 1 5 P a g e I 2 1

Within the category of conference distribution, many members note no conference distribution revenue within specific sub-categories. It is our expectation that these are new members and in future years would expect to see increases specifically in this area thus growing their respective total budgeted revenues. The “other” conference revenue category for UAB is inclusive of the $800,000 of budgeted revenue for the College Football Playoff. The actual income projected by C-USA at this time is $980K for the College Football Playoff in FY2015.
Revenue Category UAB Maximum Median Minimum Rank
Student Activity Fees 5,311,755$ 23,186,494$ 6,812,150$ -$ 10
Institutional Subsidy (excluding tuition waivers) 14,096,787$ 14,096,787$ 4,110,668$ -$ 1
Tuition Waivers (provided by institution) -$ 9,800,000$ 462,500$ -$ 9
Corporate Sponsorships 950,000$ 1,683,500$ 678,620$ -$ 5
Fundraising/Donations 2,385,000$ 5,072,016$ 2,292,500$ -$ 7
Basketball Gate Receipts 640,000$ 1,927,741$ 443,650$ 40,000$ 4
Football Gate Receipts 515,000$ 2,436,625$ 942,250$ 515,000$ 14
Basketball Guarantees 125,000$ 320,000$ 111,500$ -$ 6
Football Guarantees 1,475,000$ 2,450,000$ 1,037,500$ -$ 5
Other Sport Guarantees & Gate Receipts 45,000$ 1,375,907$ 45,450$ 30,000$ 8
Radio/TV Income (excluding Conference Distribution) -$ 1,525,000$ -$ -$ 4
Merchandise Sales/Programs/Concessions -$ 775,000$ 103,500$ -$ 12
NCAA - Grant Money
Grants-In-Aid 700,000$ 700,000$ 525,000$ 125,000$ 1
Academic Enhancement -$ 75,000$ 70,000$ -$ 14
Sports Sponsorship 180,000$ 200,087$ 126,696$ 90,720$ 4
Conference Distribution
NCAA Men's Basketball Units 350,000$ 2,100,000$ -$ -$ 3
Conference Basketball Tournament 40,000$ 40,000$ -$ -$ 1
Television 900,000$ 2,121,978$ -$ -$ 4
Marketing 7,000$ 10,000$ -$ -$ 3
Conference Football Championship 2,000$ 38,816$ -$ -$ 4
Bowls 40,000$ 500,000$ -$ -$ 5
Other 1,061,000$ 2,400,000$ 1,102,386$ -$ 9
Other Income: (List below)
Endowment and Investment Income -$ 4,325,000$ 30,000$ -$ 10
Reserve/Athletic Fund Balance -$ 1,550,000$ -$ -$ 2
Foundation -$ 947,000$ -$ -$ 5
Facility Rental -$ 50,000$ -$ -$ 3
Facility Enhancement Fees -$ 650,000$ -$ -$ 2
Seat Options/Assessments -$ 385,000$ -$ -$ 2
Stadium Skybox Rentals/Suite Leases -$ 501,850$ -$ -$ 4
RV Parking -$ 44,600$ -$ -$ 2
Parking -$ 175,500$ -$ -$ 5
Seat Back Rentals -$ 85,000$ -$ -$ 3
Handling/Postage -$ 15,000$ -$ -$ 3
Processing Fees -$ 230,555$ -$ -$ 5
NCAA Student Assistance Fund 220,000$ 263,833$ -$ -$ 2
Graduate Assistant Waivers -$ 620,250$ -$ -$ 2
Licensing and Royalties 70,000$ 100,000$ -$ -$ 4
Cheerleading Camp/Appearances -$ 64,470$ -$ -$ 2
University Support -$ 1,464,863$ -$ -$ 3
Contract Buyout -$ 500,000$ -$ -$ 2
Other Revenue 100,500$ 1,194,918$ 54,530$ -$ 5
Total Revenue 29,214,042$ 35,874,242$ 25,570,688$ 17,203,694$ 4
C o l l e g e S p o r t s S o l u t i o n s | M a y 2 0 1 5 P a g e I 2 2
Revenue Category UAB A B C D E F
Student Activity Fees 5,311,755$ 23,186,494$ -$ 21,377,516$ 10,857,150$ 10,921,706$ 3,965,000$ Institutional Subsidy (excluding tuition waivers) 14,096,787$ -$ 10,381,138$ 785,000$ 8,320,646$ 2,281,000$ 4,897,951$ Tuition Waivers (provided by institution) -$ -$ 9,800,000$ 786,815$ -$ 1,301,357$ 1,900,000$ Corporate Sponsorships 950,000$ 672,240$ 285,000$ 396,000$ 1,405,797$ 1,683,500$ -$ Fundraising/Donations 2,385,000$ 3,130,791$ 2,200,000$ 819,353$ 1,625,000$ 4,100,000$ 2,796,250$ Basketball Gate Receipts 640,000$ 990,000$ 185,000$ 40,000$ 282,225$ 206,600$ 610,000$ Football Gate Receipts 515,000$ 2,436,625$ 915,000$ 700,000$ 1,707,375$ 934,500$ 2,175,000$ Basketball Guarantees 125,000$ -$ 165,000$ -$ 320,000$ 123,000$ 240,000$ Football Guarantees 1,475,000$ 1,000,000$ 2,450,000$ -$ 1,125,000$ 2,175,000$ 270,000$ Other Sport Guarantees & Gate Receipts 45,000$ 30,000$ 320,000$ 45,000$ 31,000$ 1,375,907$ 30,000$ Radio/TV Income (excluding Conference Distribution) -$ 161,475$ -$ -$ -$ -$ 1,385,000$ Merchandise Sales/Programs/Concessions -$ 47,410$ 90,500$ 155,000$ 775,000$ 92,000$ 209,000$ NCAA - Grant Money
Grants-In-Aid 700,000$ 500,000$ 451,000$ 675,000$ 550,000$ 429,507$ 577,707$ Academic Enhancement -$ 70,000$ 60,000$ 70,000$ 75,000$ 72,739$ 64,313$ Sports Sponsorship 180,000$ 95,000$ 100,000$ 145,000$ 105,000$ 200,087$ 90,720$ Conference Distribution
NCAA Men's Basketball Units 350,000$ -$ -$ -$ -$ 220,236$ 200,000$ Conference Basketball Tournament 40,000$ -$ -$ -$ -$ 30,671$ 34,375$ Television 900,000$ -$ -$ -$ -$ 939,411$ 2,121,978$ Marketing 7,000$ -$ -$ -$ -$ 8,134$ -$ Conference Football Championship 2,000$ -$ -$ -$ -$ -$ 2,344$ Bowls 40,000$ -$ -$ -$ -$ 42,723$ 41,303$ Other 1,061,000$ 1,886,641$ 2,400,000$ 1,131,000$ 2,060,000$ 7,652$ -$ Other Income: (List below)
Endowment and Investment Income -$ 782,698$ 1,977,723$ 1,033$ 10,000$ -$ 250,000$ Reserve/Athletic Fund Balance -$ -$ -$ -$ -$ -$ 1,550,000$ Foundation -$ 710,842$ -$ -$ 130,000$ -$ -$ Facility Rental -$ 5,507$ -$ -$ -$ -$ -$ Facility Enhancement Fees -$ -$ -$ -$ -$ -$ 650,000$ Seat Options/Assessments -$ -$ -$ -$ -$ -$ 385,000$ Stadium Skybox Rentals/Suite Leases -$ -$ -$ -$ -$ -$ 501,850$ RV Parking -$ -$ -$ -$ -$ -$ -$ Parking -$ 90,000$ -$ -$ -$ -$ 130,000$ Seat Back Rentals -$ -$ -$ -$ -$ -$ 41,130$ Handling/Postage -$ -$ -$ 10,000$ -$ -$ -$ Processing Fees -$ -$ -$ 45,000$ -$ -$ 125,000$ NCAA Student Assistance Fund 220,000$ -$ -$ -$ 170,000$ 263,833$ -$ Graduate Assistant Waivers -$ -$ -$ -$ -$ -$ 620,250$ Licensing and Royalties 70,000$ -$ 80,000$ -$ -$ -$ 75,000$ Cheerleading Camp/Appearances -$ -$ -$ -$ -$ -$ 64,470$ University Support -$ -$ 1,464,863$ 68,530$ -$ -$ -$ Contract Buyout -$ -$ -$ -$ -$ -$ -$ Other Revenue 100,500$ 78,519$ 122,500$ 62,000$ 409,407$ -$ 10,000$ Total Revenue 29,214,042$ 35,874,242$ 33,447,724$ 27,312,247$ 29,958,600$ 27,409,563$ 26,013,641$
C o l l e g e S p o r t s S o l u t i o n s | M a y 2 0 1 5 P a g e I 2 3

Revenue Category G H I J K L M
Student Activity Fees 6,300,000$ 6,441,000$ 17,175,000$ 7,183,300$ 2,025,000$ 12,933,000$ -$ Institutional Subsidy (excluding tuition waivers) 1,500,000$ 10,007,896$ 101,967$ 7,994,800$ 3,378,696$ 1,198,552$ 4,842,640$ Tuition Waivers (provided by institution) 1,400,000$ -$ -$ -$ 1,665,696$ 425,000$ 500,000$ Corporate Sponsorships 1,100,000$ 504,000$ 685,000$ 650,000$ -$ 1,200,000$ 690,000$ Fundraising/Donations 5,072,016$ 131,783$ 2,174,000$ 2,041,000$ 4,114,326$ 4,300,000$ -$ Basketball Gate Receipts 460,000$ 955,000$ 500,000$ 427,300$ 1,927,741$ 60,000$ 317,452$ Football Gate Receipts 1,701,800$ 950,000$ 785,000$ 919,300$ 2,379,551$ 2,400,000$ 783,675$ Basketball Guarantees 100,000$ -$ -$ 85,000$ 55,000$ 215,000$ 200,000$ Football Guarantees 1,600,000$ 1,075,000$ 32,500$ 925,000$ 900,000$ 300,000$ 2,325,000$ Other Sport Guarantees & Gate Receipts 424,500$ 30,000$ 45,900$ 45,000$ 95,000$ 50,000$ 90,000$ Radio/TV Income (excluding Conference Distribution) -$ -$ -$ -$ 1,525,000$ -$ -$ Merchandise Sales/Programs/Concessions 726,500$ 330,000$ -$ 197,385$ -$ 50,000$ 115,000$ NCAA - Grant Money
Grants-In-Aid 327,000$ 587,000$ 125,000$ 671,608$ 650,000$ 495,344$ 471,844$ Academic Enhancement 70,000$ 71,000$ 70,000$ 72,739$ 75,000$ 72,739$ 65,000$ Sports Sponsorship 96,000$ 200,000$ 120,000$ 133,391$ 200,000$ 133,391$ 100,043$ Conference Distribution
NCAA Men's Basketball Units 387,954$ -$ 2,100,000$ -$ 320,000$ -$ -$ Conference Basketball Tournament 36,667$ -$ -$ -$ 40,000$ -$ -$ Television 1,000,000$ -$ -$ -$ 850,000$ -$ -$ Marketing 6,563$ -$ -$ -$ 10,000$ -$ -$ Conference Football Championship 38,816$ -$ -$ -$ 25,000$ -$ -$ Bowls 500,000$ -$ -$ -$ 45,000$ -$ -$ Other 400,000$ 2,100,000$ -$ 1,600,000$ 535,000$ 1,073,771$ 2,100,000$ Other Income: (List below)
Endowment and Investment Income 50,000$ -$ 332,500$ -$ -$ 50,000$ 4,325,000$ Reserve/Athletic Fund Balance -$ -$ -$ -$ -$ -$ -$ Foundation -$ 947,000$ -$ -$ -$ -$ 42,472$ Facility Rental 50,000$ -$ -$ -$ -$ -$ -$ Facility Enhancement Fees -$ -$ -$ -$ -$ -$ -$ Seat Options/Assessments -$ -$ -$ -$ -$ -$ -$ Stadium Skybox Rentals/Suite Leases -$ 252,000$ -$ -$ -$ -$ 90,000$ RV Parking -$ -$ -$ -$ 44,600$ -$ -$ Parking -$ -$ 100,000$ -$ 175,500$ -$ -$ Seat Back Rentals 85,000$ -$ -$ -$ -$ -$ -$ Handling/Postage -$ 15,000$ -$ -$ -$ -$ -$ Processing Fees -$ 25,000$ -$ -$ 230,555$ -$ -$ NCAA Student Assistance Fund -$ -$ -$ -$ -$ -$ 100,000$ Graduate Assistant Waivers -$ -$ -$ -$ -$ -$ -$ Licensing and Royalties -$ -$ -$ 100,000$ -$ -$ -$ Cheerleading Camp/Appearances -$ -$ -$ -$ -$ -$ -$ University Support -$ -$ -$ -$ -$ -$ -$ Contract Buyout 500,000$ -$ -$ -$ -$ -$ -$ Other Revenue 1,194,918$ 30,000$ -$ 47,060$ 170,000$ -$ 45,568$ Total Revenue 25,127,734$ 24,651,679$ 24,346,867$ 23,092,883$ 21,436,666$ 24,956,797$ 17,203,694$
C o l l e g e S p o r t s S o l u t i o n s | M a y 2 0 1 5 P a g e I 2 4

The following provides a total of all institutional sources of revenue. This includes areas identified previously. Finally, a total of these revenue sources referred to as “Total Allocated Revenue” is provided with a calculation of this as a percentage of total revenue. Based on the FY15 budget reported, UAB reported $19,408,542 in institutional revenue sources, representing 66% of the total athletic department budgeted revenue. In comparison to C-USA peers, UAB ranks fourth in the conference for total institutional allocated revenue. When comparing percentages of total, UAB’s 66% is slightly above the median of 64%. The highest percentage of institutional support within the conference is 84% with a low of 31%. UAB ranks first for institutional subsidy and tenth for student activity fees. UAB does not provide any additional waivers or university similar to C-USA peers.
Revenue Catgegory UAB Maximum Median Minimum Rank
Student Activity Fees 5,311,755$ 23,186,494$ 6,812,150$ -$ 10Institutional Subsidy (excluding tution waivers) 14,096,787$ 14,096,787$ 4,110,668$ -$ 1Tuition Waivers (provided by institution) -$ 9,800,000$ 462,500$ -$ 9Other Income: (List below)
Graduate Assistant Waivers -$ 620,250$ -$ -$ 2University Support -$ 1,464,863$ -$ -$ 3
Total Allocated Revenue 19,408,542$ 23,186,494$ 15,813,498$ 5,342,640$ 4
Percentage of Total Revenue 66% 84% 64% 31% 4
Revenue Catgegory UAB A B C D E F
Student Activity Fees 5,311,755$ 23,186,494$ -$ 21,377,516$ 10,857,150$ 10,921,706$ 3,965,000$ Institutional Subsidy (excluding tution waivers) 14,096,787$ -$ 10,381,138$ 785,000$ 8,320,646$ 2,281,000$ 4,897,951$ Tuition Waivers (provided by institution) -$ -$ 9,800,000$ 786,815$ -$ 1,301,357$ 1,900,000$ Other Income: (List below)
Graduate Assistant Waivers -$ -$ -$ -$ -$ -$ 620,250$ University Support -$ -$ 1,464,863$ 68,530$ -$ -$ -$
Total Allocated Revenue 19,408,542$ 23,186,494$ 21,646,001$ 23,017,861$ 19,177,796$ 14,504,063$ 11,383,201$
Percentage of Total Revenue 66% 65% 65% 84% 64% 53% 44%
Revenue Catgegory G H I J K L M
Student Activity Fees 6,300,000$ 6,441,000$ 17,175,000$ 7,183,300$ 2,025,000$ 12,933,000$ -$ Institutional Subsidy (excluding tution waivers) 1,500,000$ 10,007,896$ 101,967$ 7,994,800$ 3,378,696$ 1,198,552$ 4,842,640$ Tuition Waivers (provided by institution) 1,400,000$ -$ -$ -$ 1,665,696$ 425,000$ 500,000$ Other Income: (List below)
Graduate Assistant Waivers -$ -$ -$ -$ -$ -$ -$ University Support -$ -$ -$ -$ -$ -$ -$
Total Allocated Revenue 9,200,000$ 16,448,896$ 17,276,967$ 15,178,100$ 7,069,393$ 14,556,552$ 5,342,640$
Percentage of Total Revenue 37% 67% 71% 66% 33% 58% 31%
C o l l e g e S p o r t s S o l u t i o n s | M a y 2 0 1 5 P a g e I 2 5
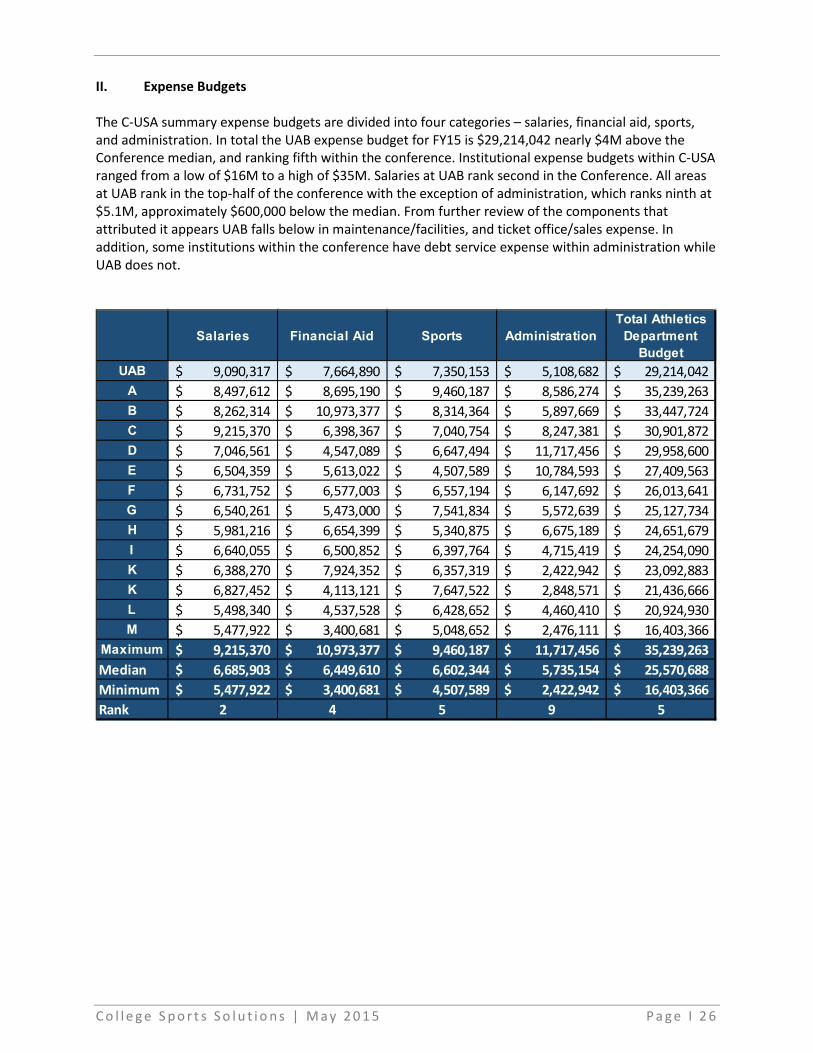
II. Expense Budgets The C-USA summary expense budgets are divided into four categories – salaries, financial aid, sports, and administration. In total the UAB expense budget for FY15 is $29,214,042 nearly $4M above the Conference median, and ranking fifth within the conference. Institutional expense budgets within C-USA ranged from a low of $16M to a high of $35M. Salaries at UAB rank second in the Conference. All areas at UAB rank in the top-half of the conference with the exception of administration, which ranks ninth at $5.1M, approximately $600,000 below the median. From further review of the components that attributed it appears UAB falls below in maintenance/facilities, and ticket office/sales expense. In addition, some institutions within the conference have debt service expense within administration while UAB does not.
Salaries Financial Aid Sports AdministrationTotal Athletics
Department Budget
UAB 9,090,317$ 7,664,890$ 7,350,153$ 5,108,682$ 29,214,042$ A 8,497,612$ 8,695,190$ 9,460,187$ 8,586,274$ 35,239,263$ B 8,262,314$ 10,973,377$ 8,314,364$ 5,897,669$ 33,447,724$ C 9,215,370$ 6,398,367$ 7,040,754$ 8,247,381$ 30,901,872$ D 7,046,561$ 4,547,089$ 6,647,494$ 11,717,456$ 29,958,600$ E 6,504,359$ 5,613,022$ 4,507,589$ 10,784,593$ 27,409,563$ F 6,731,752$ 6,577,003$ 6,557,194$ 6,147,692$ 26,013,641$ G 6,540,261$ 5,473,000$ 7,541,834$ 5,572,639$ 25,127,734$ H 5,981,216$ 6,654,399$ 5,340,875$ 6,675,189$ 24,651,679$ I 6,640,055$ 6,500,852$ 6,397,764$ 4,715,419$ 24,254,090$ K 6,388,270$ 7,924,352$ 6,357,319$ 2,422,942$ 23,092,883$ K 6,827,452$ 4,113,121$ 7,647,522$ 2,848,571$ 21,436,666$ L 5,498,340$ 4,537,528$ 6,428,652$ 4,460,410$ 20,924,930$ M 5,477,922$ 3,400,681$ 5,048,652$ 2,476,111$ 16,403,366$
Maximum 9,215,370$ 10,973,377$ 9,460,187$ 11,717,456$ 35,239,263$
Median 6,685,903$ 6,449,610$ 6,602,344$ 5,735,154$ 25,570,688$
Minimum 5,477,922$ 3,400,681$ 4,507,589$ 2,422,942$ 16,403,366$
Rank 2 4 5 9 5
C o l l e g e S p o r t s S o l u t i o n s | M a y 2 0 1 5 P a g e I 2 6

III. Football When reviewing the C-USA budgeted football expenditures, UAB had total football expenses of $2,524,734 in 2014-15. This figure ranks tenth overall within the conference and $446,002 below the median. When comparing specific expense categories, UAB is in the top-half in sports guarantees, operating expenses, facility rental, benefits, and “other” expenditures. Championship, bowl, and post season travel are $0 for UAB, which is consistent with other conference members. Only one other institution reported a facility rental budget. Areas that are not currently comparable to the top-half of C-USA include recruiting (10), regular season travel (11), game management (11), and athletic equipment (12). Game management falls the farthest below by $315,000 (although this can be attributed in large part to rental at legion field). Regular season travel falls $148,470 below the median.
UAB Maximum Median Minimum Rank
164,500$ 279,600$ 189,600$ 80,000$ 10557,570$ 1,164,300$ 706,040$ 352,800$ 11
-$ 106,000$ -$ -$ 2500,000$ 1,415,000$ 335,000$ 62,000$ 3102,000$ 847,775$ 417,000$ -$ 11381,217$ 682,120$ 253,825$ 165,600$ 5123,015$ 552,498$ 230,000$ 8,204$ 12
73,375$ 73,375$ -$ -$ 1613,057$ 2,167,977$ 447,074$ -$ 2
10,000$ 750,000$ 5,000$ -$ 72,524,734$ 3,958,623$ 2,970,736$ 1,760,010$ 10
Game Management
Football Expense
RecruitingRegular Season TravelChamp., Bowl, Post Season TravelSport Guarantees
OperatingAthletic EquipmentFacility RentalBenefitsOther
Total
UAB A B C D E F
164,500$ 279,600$ 194,200$ 190,000$ 100,000$ 189,200$ 238,000$ 557,570$ 1,164,300$ 800,320$ 515,000$ 642,947$ 970,560$ 737,080$
-$ -$ -$ -$ -$ -$ -$ 500,000$ 335,000$ 150,000$ 1,415,000$ 335,000$ 200,000$ 350,000$ 102,000$ 394,000$ -$ 793,500$ 847,775$ 95,000$ 440,000$ 381,217$ 205,000$ 170,943$ 248,000$ 393,800$ 220,105$ 321,125$ 123,015$ 390,000$ 251,977$ 181,000$ 350,000$ 85,145$ 235,000$
73,375$ -$ -$ -$ -$ -$ -$ 613,057$ 415,988$ 2,167,977$ 538,486$ 456,910$ -$ 437,238$
10,000$ 370,917$ -$ -$ 129,750$ -$ -$ 2,524,734$ 3,554,805$ 3,735,417$ 3,880,986$ 3,256,182$ 1,760,010$ 2,758,443$
Game Management
Football Expense
RecruitingRegular Season TravelChamp., Bowl, Post Season TravelSport Guarantees
OperatingAthletic EquipmentFacility RentalBenefitsOther
Total
G H I J K L M
255,000$ 80,000$ 240,000$ 189,000$ 133,000$ 275,000$ 115,000$ 921,000$ 500,000$ 352,800$ 805,000$ 901,704$ 675,000$ 600,000$
-$ -$ -$ 106,000$ -$ -$ -$ 525,000$ 335,000$ 62,000$ 260,000$ 250,000$ 400,000$ 250,000$ 499,884$ 85,000$ 614,913$ 293,183$ 645,841$ 800,000$ 118,900$ 257,650$ 467,760$ 165,600$ 384,319$ 682,120$ 250,000$ 244,350$ 263,500$ 225,000$ 207,500$ 552,498$ 190,600$ 235,000$ 8,204$
-$ -$ -$ -$ -$ 15,000$ -$ 486,589$ 480,441$ 322,829$ 381,754$ 391,000$ 319,718$ 545,151$ 750,000$ 56,918$ 150,639$ -$ -$ -$ 21,235$
3,958,623$ 2,230,119$ 2,116,281$ 2,971,754$ 3,194,265$ 2,969,718$ 1,902,840$
Game Management
Football Expense
RecruitingRegular Season TravelChamp., Bowl, Post Season TravelSport Guarantees
OperatingAthletic EquipmentFacility RentalBenefitsOther
Total
C o l l e g e S p o r t s S o l u t i o n s | M a y 2 0 1 5 P a g e I 2 7

In the area of football financial aid UAB ranks within the top-half of C-USA with the exception of summer school scholarships. UAB ranked third for academic year scholarships and fourth for total athletic award equivalent. Two institutions did not report information within some categories.
Information for football salaries is provided with benchmarking comparisons for the key positions of Head Football Coach, the combined total salaries of nine assistants, and the Director of Football Operations. The UAB head football coach salary of $500,000 is consistent with the median and ranks sixth. Total head coach compensation ranks eighth. Compensation for the nine assistant coaches at UAB is $1,064,000 in total compensation and $1,010,000 in salary. This ranks sixth and ninth respectively. The Director of Football Operations salary ranks tenth at $50,000. The additional or “other” compensation for this position places him ninth overall.
UAB Maximum Median Minimum Rank
2,498,143$ 4,274,552$ 2,029,544$ 81,482$ 3356,878$ 550,000$ 363,439$ -$ 8
2,855,021$ 4,274,552$ 2,375,566$ 91,807$ 4
1,884,665$ 4,274,552$ 1,784,216$ 1,362,892$ 61,780,635$ 3,883,719$ 1,735,425$ 1,438,912$ 578.54 83.50 76.36 72.03 683.16 85.00 80.93 69.45 4
Academic year ScholarshipsSummer ScholarshipsTotal Financial Aid
Total Athletic GrantTotal Countable AidTotal Equivalencies
Football Financial Aid
Total Athletic Award Equivalent
UAB A B C D E F
2,498,143$ 2,450,060$ 4,274,552$ 1,482,230$ 1,602,955$ 1,789,217$ 2,209,984$ 356,878$ 437,608$ -$ 503,454$ -$ 451,135$ 402,000$
2,855,021$ 2,887,668$ 4,274,552$ 1,985,684$ 1,602,955$ 2,240,352$ 2,611,984$
1,884,665$ 2,453,679$ 4,274,552$ 1,687,044$ 1,362,892$ 1,606,321$ 1,894,749$ 1,780,635$ 2,443,375$ 3,883,719$ 1,651,024$ 1,438,912$ 1,606,321$ 1,788,287$ 78.54 79.50 73.46 75.50 72.03 81.00 75.3683.16 80.00 80.93 77.50 69.45 81.00 79.86
Academic year ScholarshipsSummer ScholarshipsTotal Financial Aid
Total Athletic GrantTotal Countable AidTotal Equivalencies
Football Financial Aid
Total Athletic Award Equivalent
G H I J K L M
1,963,902$ 2,417,230$ 2,095,186$ 2,811,072$ 81,482$ 1,743,945$ 1,417,884$ 370,000$ -$ 523,796$ 550,000$ 10,325$ -$ 271,631$
2,333,902$ 2,417,230$ 2,618,982$ 3,361,072$ 91,807$ 1,743,945$ 1,689,515$
1,638,279$ 1,927,337$ $1,758,877 2,758,362$ 1,784,216$ 1,741,247$ Not Available1,491,576$ 1,882,694$ $1,758,877 Not Available 1,699,559$ 1,711,972$ Not Available76.00 76.36 74.00 83.50 81.00 82.50 Not Available82.89 77.91 74.00 85.00 84.00 83.82 Not Available
Academic year ScholarshipsSummer ScholarshipsTotal Financial Aid
Total Athletic GrantTotal Countable AidTotal Equivalencies
Football Financial Aid
Total Athletic Award Equivalent
C o l l e g e S p o r t s S o l u t i o n s | M a y 2 0 1 5 P a g e I 2 8
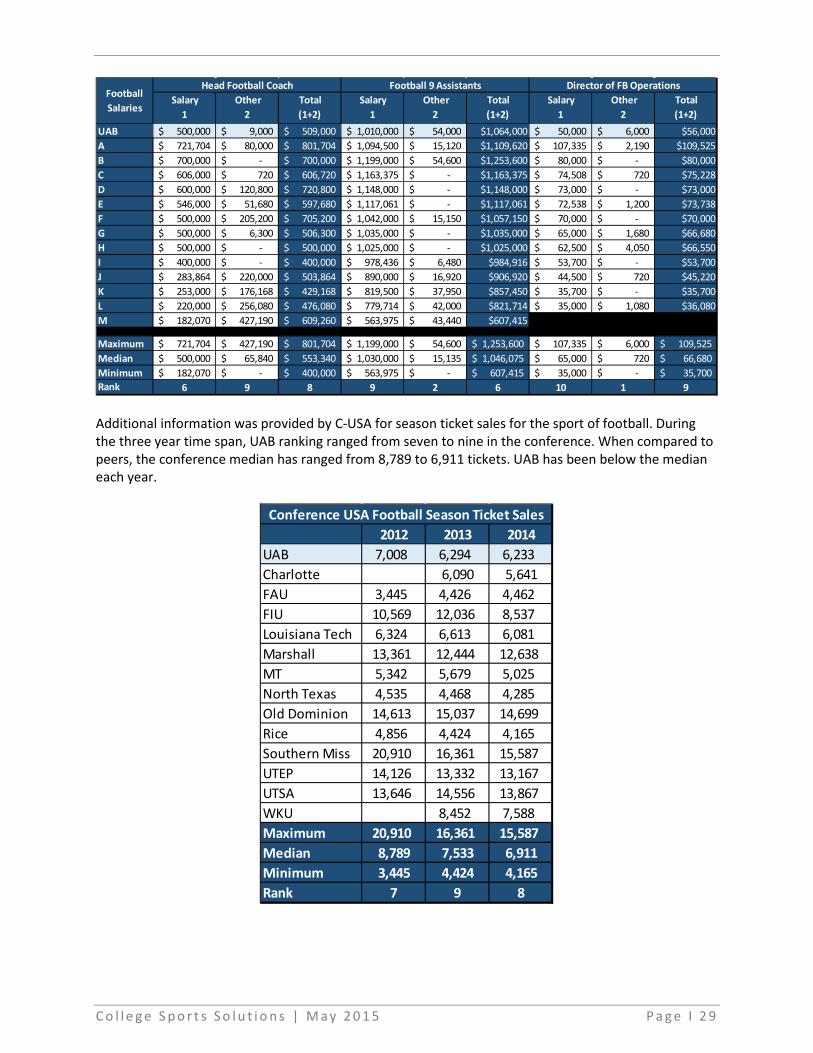
Additional information was provided by C-USA for season ticket sales for the sport of football. During the three year time span, UAB ranking ranged from seven to nine in the conference. When compared to peers, the conference median has ranged from 8,789 to 6,911 tickets. UAB has been below the median each year.
Salary
1
Other
2
Total
(1+2)
Salary
1
Other
2
Total
(1+2)
Salary
1
Other
2
Total
(1+2)
UAB 500,000$ 9,000$ 509,000$ 1,010,000$ 54,000$ $1,064,000 50,000$ 6,000$ $56,000A 721,704$ 80,000$ 801,704$ 1,094,500$ 15,120$ $1,109,620 107,335$ 2,190$ $109,525B 700,000$ -$ 700,000$ 1,199,000$ 54,600$ $1,253,600 80,000$ -$ $80,000C 606,000$ 720$ 606,720$ 1,163,375$ -$ $1,163,375 74,508$ 720$ $75,228D 600,000$ 120,800$ 720,800$ 1,148,000$ -$ $1,148,000 73,000$ -$ $73,000E 546,000$ 51,680$ 597,680$ 1,117,061$ -$ $1,117,061 72,538$ 1,200$ $73,738F 500,000$ 205,200$ 705,200$ 1,042,000$ 15,150$ $1,057,150 70,000$ -$ $70,000G 500,000$ 6,300$ 506,300$ 1,035,000$ -$ $1,035,000 65,000$ 1,680$ $66,680H 500,000$ -$ 500,000$ 1,025,000$ -$ $1,025,000 62,500$ 4,050$ $66,550I 400,000$ -$ 400,000$ 978,436$ 6,480$ $984,916 53,700$ -$ $53,700J 283,864$ 220,000$ 503,864$ 890,000$ 16,920$ $906,920 44,500$ 720$ $45,220K 253,000$ 176,168$ 429,168$ 819,500$ 37,950$ $857,450 35,700$ -$ $35,700L 220,000$ 256,080$ 476,080$ 779,714$ 42,000$ $821,714 35,000$ 1,080$ $36,080M 182,070$ 427,190$ 609,260$ 563,975$ 43,440$ $607,415
Maximum 721,704$ 427,190$ 801,704$ 1,199,000$ 54,600$ 1,253,600$ 107,335$ 6,000$ 109,525$ Median 500,000$ 65,840$ 553,340$ 1,030,000$ 15,135$ 1,046,075$ 65,000$ 720$ 66,680$ Minimum 182,070$ -$ 400,000$ 563,975$ -$ 607,415$ 35,000$ -$ 35,700$ Rank 6 9 8 9 2 6 10 1 9
Director of FB OperationsFootball 9 AssistantsHead Football CoachFootball
Salaries
2012 2013 2014
UAB 7,008 6,294 6,233Charlotte 6,090 5,641FAU 3,445 4,426 4,462FIU 10,569 12,036 8,537Louisiana Tech 6,324 6,613 6,081Marshall 13,361 12,444 12,638MT 5,342 5,679 5,025North Texas 4,535 4,468 4,285Old Dominion 14,613 15,037 14,699Rice 4,856 4,424 4,165Southern Miss 20,910 16,361 15,587UTEP 14,126 13,332 13,167UTSA 13,646 14,556 13,867WKU 8,452 7,588Maximum 20,910 16,361 15,587
Median 8,789 7,533 6,911
Minimum 3,445 4,424 4,165
Rank 7 9 8
Conference USA Football Season Ticket Sales
C o l l e g e S p o r t s S o l u t i o n s | M a y 2 0 1 5 P a g e I 2 9

IV. Bowling Information is provided using data from Conference-USA and the NCAA. CSS researched expense information using the NCAA Revenues/Expenses Division I Report (2004-2013). Median values for FY13 were available by Division I subdivision for reference. Total expenses range from a low of $156,000 for Division I FCS to $203,000 for Division I non-football playing institutions.
Bowling expenditures for UAB and one other institution were available for C-USA. When compared, UAB has more than double the expense budget at $80,217 compared to $30,978.
UAB is significantly higher than the other institution available within C-USA relative to scholarships. UAB provides athletic award equivalent of 2.47 for bowling. In addition to academic year scholarships, summer scholarships are also available with a total of $167,943 budgeted for FY 15.
For salaries, again UAB is significantly higher. Based on the salary total for the other institution, we would surmise that the other institution employs a part-time head coach. UAB reported a total of $42,565 with $36,565 of that being salary.
D-I FBS 198,000$ D-I FCS 156,000$ D-I Non FB 203,000$
FY13 Bowling
Median Sport Expense by Subdivision
UAB A
10,000$ 1,750$ 35,280$ 23,700$
-$ -$ -$ -$ -$ -$
5,720$ 4,333$ 13,000$ -$
2,000$ -$ 14,217$ 1,195$
-$ -$ 80,217$ 30,978$
Athletic EquipmentFacility RentalBenefitsOther
Regular Season TravelChamp., Bowl, Post Season TravelSport GuaranteesGame ManagementOperating
Total
Bowling Expense
Recruiting
UAB A
146,950$ 47,719$ 20,993$ 613$
167,943$ 48,332$
64,400$ -$ 64,400$ -$ 2.47 0.002.47 0.00
Total Countable AidTotal EquivalenciesTotal Athletic Award Equivalent
Bowling Financial Aid
Academic year ScholarshipsSummer ScholarshipsTotal Financial Aid
Total Athletic Grant
C o l l e g e S p o r t s S o l u t i o n s | M a y 2 0 1 5 P a g e I 3 0

Additional reference information was available for Division I median salary and benefits by subdivision. For the sport of bowling, only head coach data was reported with no supplementary assistant coaches or administrative staff. Salary and benefits ranged from a high of $51,000 at D-I FBS to a low of $28,000 for D-I non-football playing institutions. The UAB figure of $42,565 excluding benefits is comparable to the Division I FBS median.
V. Rifle For the sport of women’s rifle, expenses range from a median of $58,000 for Division I FBS to $14,000 for Division I FCS.
Rifle expenditures for UAB and one other institution were available for C-USA. When compared, UAB has a budgeted expense of $26,942, significantly lower than the benchmarked institution. The UAB operating expense line item is approximately $27,000 below the other institution. Benefits are also significantly lower, however we understand that UAB employs a part-time head coach while the other institution has a full-time position.
Salary
1
Other
2
Total
(1+2)
UAB 36,565$ 6,000$ 42,565$ A 12,480$ 12,480$
Bowling
Salaries
Head Coach
Head Coach All Assistant
Coaches Total Administrative
D-I FBS 51,000$ -$ 51,000$ -$ D-I FCS 20,000$ -$ 21,000$ -$ D-I Non FB 22,000$ -$ 28,000$ -$
FY13 Bowling Median Salary & Benefits by Subdivision
D-I FBS 58,000$ D-I FCS 14,000$ D-I Non-FB N/A
FY13 Rifle
Median Sport Expense by Subdivision
C o l l e g e S p o r t s S o l u t i o n s | M a y 2 0 1 5 P a g e I 3 1

UAB is consistently higher than the other C-USA institution for financial aid. This includes scholarship value and equivalencies. UAB offers slightly more than one financial aid equivalent more than the benchmarked institution.
For salaries, UAB is significantly below the other C-USA member. Again UAB employs a part-time head coach. UAB reported a total value of $8,240.
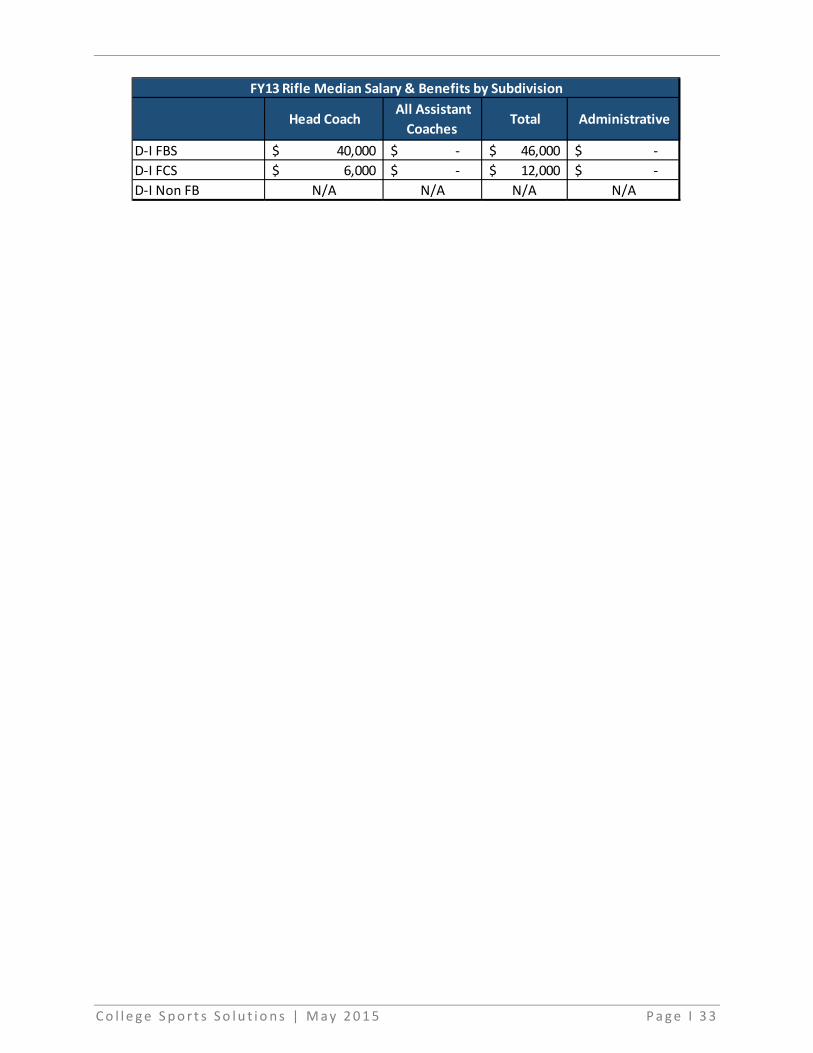
Additional reference information was available for Division I median for salary and benefits by subdivision. Only head coach data was reported with no supplementary assistant coaches or administrative staff. Median salary and benefits for the head coach position varied significantly by subdivision. This is likely attributed to full-time versus part-time status of the head coach. The UAB figure of $8,240 excluding benefits is significantly below the Division I FBS median total of $46,000 and more in alignment with D-I FCS.
UAB A
250$ 1,200$ 23,070$ 30,000$
-$ -$ -$ -$ -$ -$
1,430$ 29,000$ 1,500$ 3,000$
-$ -$ 692$ 17,000$ -$ -$
$26,942 $80,200
Athletic EquipmentFacility RentalBenefitsOther
Regular Season TravelChamp., Bowl, Post Season TravelSport GuaranteesGame ManagementOperating
Total
Rifle Expense
Recruiting
UAB A
105,803$ 65,185$ 15,115$ 9,254$
120,918$ 74,439$ 64,488$ 45,826$ 60,485$ 45,826$
3.60 2.193.82 2.19
Total EquivalenciesTotal Athletic Award Equivalent
Rifle Financial Aid
Academic year ScholarshipsSummer ScholarshipsTotal Financial Aid
Total Athletic GrantTotal Countable Aid
Salary
1
Other
2
Total
(1+2)
UAB 8,240$ -$ 8,240$ A 49,567$ -$ 49,567$
Rifle
Salaries
Head Coach
C o l l e g e S p o r t s S o l u t i o n s | M a y 2 0 1 5 P a g e I 3 2
Head Coach All Assistant
Coaches Total Administrative
D-I FBS 40,000$ -$ 46,000$ -$ D-I FCS 6,000$ -$ 12,000$ -$ D-I Non FB N/A N/A N/A N/A
FY13 Rifle Median Salary & Benefits by Subdivision
C o l l e g e S p o r t s S o l u t i o n s | M a y 2 0 1 5 P a g e I 3 3
VII. Benchmarking – Division I Non-Football
Benchmarking information is provided regarding Division I non-football playing institutions. Should UAB elect to maintain a direction without the sport of football, these figures may be valuable to ascertain medians in both revenues and expenditures within this subset of NCAA Division I. Information is provided for Division I non-football as a whole as well as information for two conferences specifically referenced by the Athletic Assessment Task Force as potential conferences – the Missouri Valley and the Atlantic 10. Summary information for Division I is based on FY13 information publicly available through the NCAA Revenues/Expenses Division I Report (2004-2013). Information for the two conferences is gleaned from current members. Information for public institutions was accessed through the USA Today’s NCAA Finances database for FY13. Private institution data is not published within this database. For those private institutions total data and athletic financial aid expenses were accessed through the EADA database. I. Division I Non-Football Median Revenues and Expenditures Within NCAA Division I, institutions without the sport of football have a median revenue of $13.13M. The median for public institutions is lower overall at $11.484M. Eighty-three percent of public institution revenue comes from allocated sources including direct and indirect institutional support, student fees, and government support. The majority of this revenue comes from direct institutional support ($3.075M) and student fees ($4.261M) at public institutions. Indirect institutional support is over $500,000 for public institutions. Per the NCAA definition, this revenue can include “The value of facilities and services provided by the institution not charged to Athletics. This may include an allocation for institutional administrative cost, facilities and maintenance, grounds and field maintenance, security, risk management, utilities, depreciation and debt service.” The median value for self-generated revenues is $2.091M for public institutions and $2.428M for all Division I non-football institutions. This self-generated revenue comes primarily from cash contributions, royalties/advertising/sponsorships, NCAA and conference distributions, guarantees, and ticket sales.
C o l l e g e S p o r t s S o l u t i o n s | M a y 2 0 1 5 P a g e I 3 4

For Division I non-football playing schools, the median number for total expenditures is $11.6M for public institutions, and $14.024M for all schools. The largest expenditures come in the areas of salaries/ benefits and athletic financial aid.
Source of RevenuePublic
InstitutionsAll Institutions
Generated Revenues:
Total Ticket Sales 157,000$ 221,000$ NCAA and conference distributions 375,000$ 432,000$ Guarantees and options 266,000$ 182,000$ Cash contributions from alumni and others 505,000$ 589,000$ Third Party Support -$ -$ Other:
Concessions/Programs/Novelties 22,000$ 21,000$ Broadcast Rights -$ -$ Royalties/Advertising/Sponsorship 234,000$ 252,000$ Sports camps 27,000$ 23,000$ Endowment/Investment Income 22,000$ 35,000$ Miscellaneous 154,000$ 106,000$ Total Generated Revenues 2,091,000$ 2,428,000$
Allocated Revenues:
Direct Institutional Support 3,075,000$ 7,394,000$ Indirect Institutional Support 529,000$ 852,000$ Student Fees 4,261,000$ 554,000$ Direct government support -$ -$ Total Allocated Revenues 9,504,000$ 10,674,000$
Total All Revenues 11,484,000 13,130,000Allocated Revenues/Total Revenue 83% 81%
Division I Institutions Without Football
Sources of Revenue - Median Values
Source: NCAA Revenue/Expenses Divison I Report 2004-2013, Table 5.7
C o l l e g e S p o r t s S o l u t i o n s | M a y 2 0 1 5 P a g e I 3 5

II. Missouri Valley Conference Information is provided for the Missouri Valley Conference using the USA Today source data for all public institutions. This sourced information is provided across all categories. Private institutions are not required to release data publically in the same manner. Therefore, private institutions were researched primarily from the most recent FY14 EADA reports. The following USA Today general definitions on the categorization of the data are utilized. Revenue Categories x Ticket sales: Sales of admissions to athletics events. Include ticket sales to the public, faculty
and students, and money received for shipping and handling of tickets. Does not include amounts in excess of face value (such as preferential seating) or sales for conference and national tournaments that are pass-through transactions.
x Contributions: Includes amounts received directly from individuals, corporations, associations, foundations, clubs or other organizations by the donor for the operation of the athletics program. Report amounts paid in excess of a ticket's value. Contributions include cash, marketable securities and in-kind contributions such as dealer-provided cars, apparel and drink products for team and staff use. Also includes revenue from preferential seating.
x Rights/Licensing: Includes revenue for athletics from radio and television broadcasts, Internet and ecommerce rights received from institution-negotiated contracts, the NCAA and conference revenue sharing arrangements; and revenue from corporate sponsorships, licensing, sales of advertisements, trademarks and royalties. Includes the value of in-kind products and services
Source of RevenuePublic
InstitutionsAll Institutions
Athletic Financial Aid (Grants-in-Aid) 2,756,000$ 3,936,000$ Guarantees and Options 24,000$ 27,000$ Salaries and Benefits – University paid 4,192,000$ 4,395,000$ Salaries and Benefits – Third Party paid -$ -$ Severance Pay -$ -$ Team travel 945,000$ 1,053,000$ Recruiting 154,000$ 211,000$ Equipment/uniforms/supplies 404,000$ 400,000$ Fundraising 204,000$ 236,000$ Game Expenses 223,000$ 249,000$ Medical 154,000$ 157,000$ Membership Dues 45,000$ 51,000$ Sports Camps 4,000$ -$ Spirit Groups 21,000$ 21,000$ Facilities Maintenance and Rental 192,000$ 190,000$ Indirect Institutional Support 529,000$ 852,000$ Other 590,000$ 598,000$ Total Operating Expenses 11,600,000$ 14,023,000$
Division I Institutions Without Football
Operating Expenses - Median Values
Source: NCAA Revenue/Expenses Division I Report 2004-2013, Table 5.9
C o l l e g e S p o r t s S o l u t i o n s | M a y 2 0 1 5 P a g e I 3 6
provided as part of the sponsorship (e.g., equipment, apparel, soft drinks, water and isotonic products).
x Student fees: Fees assessed to support athletics. x Institutional Support: Includes both direct and indirect support from the university, including
state funds, tuition, tuition waivers etc., as well as federal Work Study amounts for athletes. It also includes university-provided support such as administrative costs, facilities and grounds maintenance, security, risk management, utilities, depreciation and debt service.
x Other: All other sources of revenue including game guarantees, support from third-parties guaranteed by the school such as TV income, housing allowances, camp income, etc.; tournament/bowl game revenues from conferences; endowments and investments; revenue from game programs, novelties, food or other concessions; and parking revenues and other sources.
Expense Categories x Coaching/staff: All salaries, bonuses and benefits reported on the university's tax forms for
coaches and staff, as well as third-party contributions. x Athletic Financial Aid: Athletically-related student aid, including summer school and tuition
discounts and waivers (including aid given to student-athletes who have exhausted their eligibility or who are inactive due to medical reasons), and aid for non-athletes such as student managers.
x Buildings/grounds: Facilities costs charged to the athletics program, including debt service, maintenance, utilities and rental fees.
x Other: Includes guarantees paid to other schools, severance payments to past coaches and staff, recruiting, team travel, equipment and uniforms, game day and camp expenses, fundraising and marketing costs, spirit group support, medical expense/insurance and conference dues. It also includes expenses charged to athletics by the university, such as building maintenance.
The median revenue total value within the conference is $15,563,194. However, it is important to note that six conference members also have the sport of football that compete within the Division I Football Championship Subdivision (FCS) in either the Missouri Valley Football Conference or the Pioneer Football League (noted with an *). Thus revenues do include some football-related income. The primary sources of self-generated income are contributions ($2.252M median), rights/licensing ($2.228M median), and ticket sales ($1.278M median). Within each of those categories, Wichita State has the highest totals. Many institutions have significant revenues within the “other” category. These are likely attributed to game guarantees. Football game guarantees can be significant at the FCS level when playing an FBS institution.
C o l l e g e S p o r t s S o l u t i o n s | M a y 2 0 1 5 P a g e I 3 7

Total allocated revenues (the combination of student fees and institutional support) range from $13.1M to $6.5M with a median of $8.985M. This number is significantly lower than the current UAB allocated total of $19.4M for the FY15 budget. The allocated revenue was then calculated as a percentage of total revenue, which ranges from a low of 28% at Wichita State to a high of 75% at Indiana State, with the median at 60%. This information was available only for the public institutions within the Conference.
Expenses are divided into four categories - coaching/staff, scholarships, building/grounds, and other. The EADA does provide a total scholarship value for private institutions, and that number is included. The median value for total expenses is $15,563,194 with a high of $24,132,710 at Wichita State and a low of $10,859,234 at Evansville.
Revenue Ticket Sales ContributionsRights /
LicensingStudent Fees
Institutional
SupportOther
Total
Revenues
Bradley 14,075,359$ Drake* 15,631,326$ Evansville 10,859,234$ Illinois State* $ 1,291,798 $ 2,095,334 $ 2,584,750 $ 9,053,520 $ 3,690,273 $ 620,470 $ 19,336,145 Indiana State* $ 599,127 $ 754,198 $ 1,099,340 $ 7,671,177 $ 1,847,427 $ 790,542 $ 12,761,811 Loyola 14,340,348$ Missouri State* $ 1,312,173 $ 1,322,552 $ 2,023,470 $ - $ 8,451,702 $ 2,385,165 $ 15,495,062 Northern Iowa* $ 1,264,949 $ 2,409,164 $ 2,424,980 $ 1,491,225 $ 6,503,643 $ 2,813,112 $ 16,907,073 Southern Illinois* $ 1,232,142 $ 2,997,344 $ 2,031,792 $ 8,470,638 $ 4,663,760 $ 765,968 $ 20,161,644 Wichita State $ 4,641,633 $ 7,567,297 $ 4,436,138 $ 2,927,512 $ 3,593,164 $ 477,505 $ 23,643,249 Maximum $ 4,641,633 $ 7,567,297 $ 4,436,138 $ 9,053,520 $ 8,451,702 $ 2,813,112 $ 23,643,249
Median $ 1,278,374 $ 2,252,249 $ 2,228,386 $ 5,299,345 $ 4,177,017 $ 778,255 $ 15,563,194
Minimum $ 599,127 $ 754,198 $ 1,099,340 $ - $ 1,847,427 $ 477,505 $ 10,859,234
Missouri Valley Conference
*Institutions with the sport of football.
Allocated Revenue Student FeesInstitutional
Support
Total
Allocated
Revenue
% of Total
Revenue
Illinois State $ 9,053,520 $ 3,690,273 12,743,793$ 66% Indiana State $ 7,671,177 $ 1,847,427 9,518,604$ 75% Missouri State $ - $ 8,451,702 8,451,702$ 55% Northern Iowa $ 1,491,225 $ 6,503,643 7,994,868$ 47% Southern Illinois $ 8,470,638 $ 4,663,760 13,134,398$ 65% Wichita State $ 2,927,512 $ 3,593,164 6,520,676$ 28% Maximum $ 9,053,520 $ 8,451,702 $ 13,134,398 75%
Median $ 5,299,345 $ 4,177,017 $ 8,985,153 60%
Minimum $ - $ 1,847,427 $ 6,520,676 28%
Missouri Valley Conference
C o l l e g e S p o r t s S o l u t i o n s | M a y 2 0 1 5 P a g e I 3 8

ExpensesCoaching /
Staff
Athletic
Financial Aid
Building /
GroundsOther Total Expenses
Bradley 4,034,821$ 14,075,359$ Drake* 3,977,193$ 15,631,326$ Evansville 4,593,267$ 10,859,234$ Illinois State* $ 6,808,509 $ 5,624,496 $ 83,180 $ 7,051,012 $ 19,567,197 Indiana State* $ 4,171,659 $ 3,871,363 $ 152,057 $ 4,383,317 $ 12,578,396 Loyola 4,740,133$ 14,340,348$ Missouri State* $ 6,269,925 $ 3,690,633 $ 209,420 $ 5,487,584 $ 15,495,062 Northern Iowa* $ 5,823,050 $ 3,518,766 $ 132,451 $ 7,297,192 $ 16,771,459 Southern Illinois* $ 5,562,510 $ 5,607,067 $ 6,131,815 $ 5,707,577 $ 23,008,969 Wichita State $ 7,990,163 $ 2,732,273 $ 1,039,569 $ 12,370,705 $ 24,132,710 Maximum $ 7,990,163 $ 5,624,496 $ 6,131,815 $ 12,370,705 $ 24,132,710
Median $ 6,046,488 $ 4,006,007 $ 180,739 $ 6,379,295 $ 15,563,194
Minimum $ 4,171,659 $ 2,732,273 $ 83,180 $ 4,383,317 $ 10,859,234
Missouri Valley Conference
*Institutions with the sport of football.
C o l l e g e S p o r t s S o l u t i o n s | M a y 2 0 1 5 P a g e I 3 9

III. Atlantic 10 The median total revenue value within the A-10 conference is $22,845.289. The conference includes four public institutions. However, it is important to note that, of the conference membership, seven members also have the sport of football, six within Division I FCS, and one in FBS. Thus, revenues do include some football related income. The primary sources of self-generated income are, rights/licensing ($1.808M median), contributions ($1.586M median), and “other” revenue ($1.267M median).
Total allocated revenues range from $18.13M to $24.35M with a median of $18.53M. The allocated revenue as a percentage of total revenue ranges from a low of 68% at VCU to a high of 84% at George Mason. The median is 77%, significantly higher than the MVC median.
The median total expenses is $22,785,530 with a high of $30,731,842 at Massachusetts (an FBS football school), to a low of $9,466,416 at St. Bonaventure.
Revenue Ticket Sales Contributions Rights /
Licensing Student Fees
Institutional
Support Other
Total
Revenues
Davidson* 13,269,680$
Dayton* 23,427,927$
Duquesne* 17,292,570$
Fordham* $ 28,844,543
George Mason $ 893,246 $ 1,145,459 $ 1,289,234 $ 14,052,496 $ 4,633,154 $ 249,062 $ 22,262,650
George Washington 27,747,943$
La Salle $ 13,412,741
Massachusetts* $ 1,413,936 $ 841,873 $ 1,729,462 $ 8,004,252 $ 16,350,175 $ 1,720,937 $ 30,060,635
Rhode Island* $ 761,607 $ 2,026,827 $ 2,333,688 $ - $ 18,374,422 $ 1,393,679 $ 24,890,223
Richmond* $ 26,218,517
St. Bonaventure $ 9,466,416
Saint Joseph's $ 18,955,430
Saint Louis $ 17,035,570
VCU $ 1,622,448 $ 3,729,599 $ 1,886,641 $ 17,477,696 $ 657,155 $ 1,141,518 $ 26,515,057
Maximum $ 1,622,448 $ 3,729,599 $ 2,333,688 $ 17,477,696 $ 18,374,422 $ 1,720,937 $ 30,060,635
Median $ 1,153,591 $ 1,586,143 $ 1,808,052 $ 11,028,374 $ 10,491,665 $ 1,267,599 $ 22,845,289
Minimum $ 761,607 $ 841,873 $ 1,289,234 $ - $ 657,155 $ 249,062 $ 9,466,416
Atlantic 10 Conference
*Institutions with the sport of football.
Allocated Revenue Student FeesInstitutional
Support
Total Allocated
Revenue
% of Total
Revenue
George Mason $ 14,052,496 $ 4,633,154 18,685,650$ 84% Massachusetts $ 8,004,252 $ 16,350,175 24,354,427$ 81% Rhode Island $ - $ 18,374,422 18,374,422$ 74% Virginia Commonwealth $ 17,477,696 $ 657,155 18,134,851$ 68% Maximum $ 17,477,696 $ 18,374,422 $ 24,354,427 84%
Median $ 11,028,374 $ 10,491,665 $ 18,530,036 77%
Minimum $ - $ 657,155 $ 18,134,851 68%
Atlantic 10 Conference
C o l l e g e S p o r t s S o l u t i o n s | M a y 2 0 1 5 P a g e I 4 0

Expenses Coaching /
Staff
Athletic
Financial Aid
Building /
Grounds Other Total Expenses
Davidson* 2,942,960$ 12,121,009$
Dayton* 4,622,544$ 23,427,927$
Duquesne* 6,712,009$ 17,292,570$
Fordham* $ 12,396,496 $ 28,844,543
George Mason $ 8,098,545 $ 4,888,249 $ - $ 9,156,939 $ 22,143,733
George Washington $ 9,274,542 $ 27,747,943
La Salle $ 5,349,587 $ 13,412,741
Massachusetts* $ 9,817,716 $ 8,523,420 $ 953,512 $ 11,437,194 $ 30,731,842
Rhode Island* $ 8,595,972 $ 7,940,267 $ 376,106 $ 6,777,215 $ 23,689,560
Richmond* $ 9,476,984 $ 25,034,858
St. Bonaventure 2,965,521$ 9,466,416$
Saint Joseph's $ 5,896,838 $ 18,955,430
Saint Louis $ 4,512,218 $ 17,035,570
VCU $ 8,047,561 $ 3,898,647 $ 6,439,154 $ 7,453,764 $ 25,839,126
Maximum $ 9,817,716 $ 12,396,496 $ 6,439,154 $ 11,437,194 $ 30,731,842
Median $ 8,347,259 $ 5,623,213 $ 664,809 $ 8,305,352 $ 22,785,830
Minimum $ 8,047,561 $ 2,942,960 $ - $ 6,777,215 $ 9,466,416
Atlantic 10 Conference
*Institutions with the sport of football.
C o l l e g e S p o r t s S o l u t i o n s | M a y 2 0 1 5 P a g e I 4 1

VIII. Benchmarking – Division I Other FBS Conferences
Benchmarking information is provided regarding two additional Division I FBS conferences. The Athletic Assessment Task Force requested supplemental information for the Sun Belt Conference (SBC) and the Mid-American Conference (MAC). The conference research is based on current members with information assessed through the USA Today’s NCAA Finances database for FY13. UAB data for that same time period is compared with these conference institutions. Since all members are public institutions, no EADA data was used.
I. Sun Belt Conference (SBC)
The median total revenue within the conference is $18,114,361 with a high of $29,764,777 and a low of $9,403,112. The UAB total for FY13 of $28,159,249 would rank second in the SBC.
It is important to note, however, that multiple institutions were competing within another conference at the time of this financial reporting. Georgia State, Appalachian State, and Georgia Southern were all competing within another conference and also at that time had football playing at the Division I Football Championship Subdivision (FCS).
Furthermore, two conference members do not sponsor football and therefore have lower total revenues (noted with an *). The largest sources of self-generated income come from “other” sources ($1.677M median), followed by contributions ($1.452M median), rights/licensing ($1.391M median), and ticket sales ($865 thousand median). UAB would rank in the top-half of the SBC for all categories except student fees. It ranks first for institutional support and rights/licensing. As noted previously “other” revenue can include all other sources of revenue, including game guarantees, support from third-parties guaranteed by the school, such as TV income, housing allowances, camp income, tournament/bowl game revenues from conferences, endowments and investments; revenue from game programs, novelties, food or other concessions, and parking revenues and other sources.
Revenue Ticket Sales ContributionsRights /
LicensingStudent Fees
Institutional
SupportOther
Total
Revenues
UAB (FY13) $ 1,130,053 $ 2,456,762 $ 3,987,375 $ 4,980,820 $ 13,089,710 $ 2,514,529 $ 28,159,249 Appalachian State $ 2,334,633 $ 3,633,146 $ 2,394,380 $ 9,861,151 $ 490,389 $ 1,062,028 $ 19,775,727 Arkansas - Little Rock* $ 492,145 $ 857,466 $ 1,232,516 $ 4,260,729 $ 1,887,082 $ 673,174 $ 9,403,112 Arkansas State $ 1,398,414 $ 403,388 $ 1,435,343 $ 4,567,744 $ 4,755,747 $ 3,720,402 $ 16,281,038 Georgia Southern $ 1,179,454 $ 1,029,174 $ 1,245,040 $ 5,812,013 $ 2,508,657 $ 1,426,412 $ 13,200,750 Georgia State $ 512,759 $ 1,452,756 $ 1,280,504 $ 19,243,016 $ 3,360,013 $ 872,916 $ 26,721,964 Louisiana - Lafayette $ 2,528,760 $ 3,668,466 $ 2,148,784 $ - $ 7,680,055 $ 2,088,296 $ 18,114,361 Louisiana - Monroe $ 785,715 $ 1,801,838 $ 1,562,094 $ 313,005 $ 3,789,317 $ 2,979,342 $ 11,231,311 South Alabama $ 865,867 $ 595,499 $ 1,177,445 $ 7,500,776 $ 9,024,380 $ 1,951,595 $ 21,115,562 Texas State $ 1,674,269 $ 2,694,475 $ 2,368,454 $ 14,645,384 $ 6,387,905 $ 1,994,290 $ 29,764,777 Troy $ 622,661 $ 2,956,672 $ 1,391,685 $ 956,988 $ 11,900,270 $ 1,677,447 $ 19,505,723 UT Arlington* $ 317,440 $ 294,300 $ 554,751 $ 5,587,053 $ 4,144,417 $ 513,301 $ 11,411,262 Maximum $ 2,528,760 $ 3,668,466 $ 2,394,380 $ 19,243,016 $ 11,900,270 $ 3,720,402 $ 29,764,777
Median $ 865,867 $ 1,452,756 $ 1,391,685 $ 5,587,053 $ 4,144,417 $ 1,677,447 $ 18,114,361
Minimum $ 317,440 $ 294,300 $ 554,751 $ - $ 490,389 $ 513,301 $ 9,403,112
Rank 6 5 1 7 1 3 2
Sun Belt Conference
*Do not sponsor the sport of football
C o l l e g e S p o r t s S o l u t i o n s | M a y 2 0 1 5 P a g e I 4 2
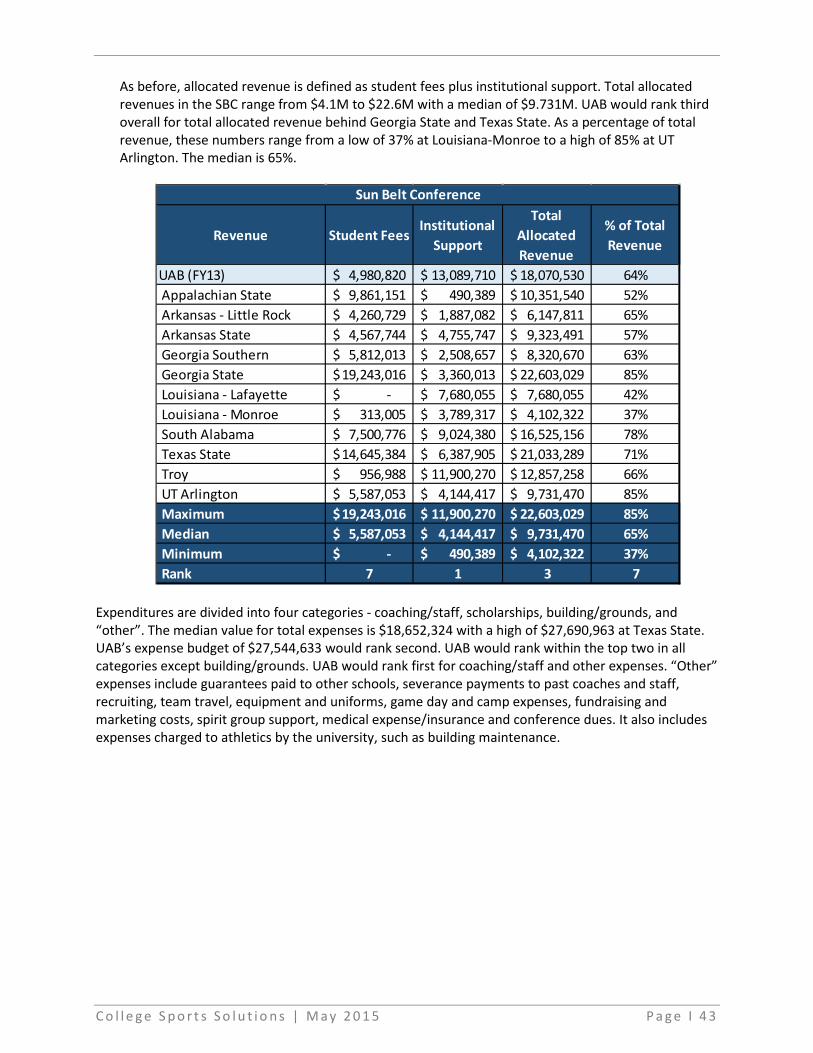
As before, allocated revenue is defined as student fees plus institutional support. Total allocated revenues in the SBC range from $4.1M to $22.6M with a median of $9.731M. UAB would rank third overall for total allocated revenue behind Georgia State and Texas State. As a percentage of total revenue, these numbers range from a low of 37% at Louisiana-Monroe to a high of 85% at UT Arlington. The median is 65%.
Expenditures are divided into four categories - coaching/staff, scholarships, building/grounds, and “other”. The median value for total expenses is $18,652,324 with a high of $27,690,963 at Texas State. UAB’s expense budget of $27,544,633 would rank second. UAB would rank within the top two in all categories except building/grounds. UAB would rank first for coaching/staff and other expenses. “Other” expenses include guarantees paid to other schools, severance payments to past coaches and staff, recruiting, team travel, equipment and uniforms, game day and camp expenses, fundraising and marketing costs, spirit group support, medical expense/insurance and conference dues. It also includes expenses charged to athletics by the university, such as building maintenance.
Revenue Student FeesInstitutional
Support
Total
Allocated
Revenue
% of Total
Revenue
UAB (FY13) 4,980,820$ 13,089,710$ 18,070,530$ 64% Appalachian State 9,861,151$ 490,389$ 10,351,540$ 52% Arkansas - Little Rock 4,260,729$ 1,887,082$ 6,147,811$ 65% Arkansas State 4,567,744$ 4,755,747$ 9,323,491$ 57% Georgia Southern 5,812,013$ 2,508,657$ 8,320,670$ 63% Georgia State 19,243,016$ 3,360,013$ 22,603,029$ 85% Louisiana - Lafayette -$ 7,680,055$ 7,680,055$ 42% Louisiana - Monroe 313,005$ 3,789,317$ 4,102,322$ 37% South Alabama 7,500,776$ 9,024,380$ 16,525,156$ 78% Texas State 14,645,384$ 6,387,905$ 21,033,289$ 71% Troy 956,988$ 11,900,270$ 12,857,258$ 66% UT Arlington 5,587,053$ 4,144,417$ 9,731,470$ 85% Maximum 19,243,016$ 11,900,270$ 22,603,029$ 85%
Median 5,587,053$ 4,144,417$ 9,731,470$ 65%
Minimum -$ 490,389$ 4,102,322$ 37%
Rank 7 1 3 7
Sun Belt Conference
C o l l e g e S p o r t s S o l u t i o n s | M a y 2 0 1 5 P a g e I 4 3
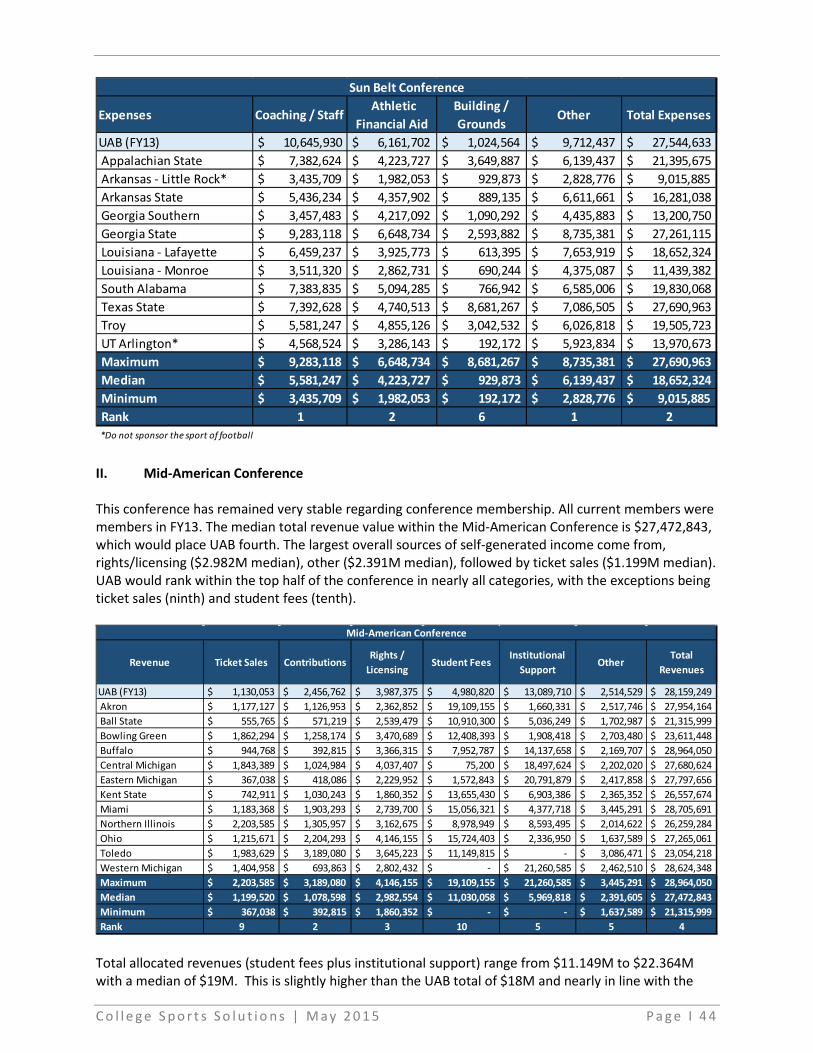
II. Mid-American Conference
This conference has remained very stable regarding conference membership. All current members were members in FY13. The median total revenue value within the Mid-American Conference is $27,472,843, which would place UAB fourth. The largest overall sources of self-generated income come from, rights/licensing ($2.982M median), other ($2.391M median), followed by ticket sales ($1.199M median). UAB would rank within the top half of the conference in nearly all categories, with the exceptions being ticket sales (ninth) and student fees (tenth).
Total allocated revenues (student fees plus institutional support) range from $11.149M to $22.364M with a median of $19M. This is slightly higher than the UAB total of $18M and nearly in line with the
Expenses Coaching / Staff Athletic
Financial Aid
Building /
GroundsOther Total Expenses
UAB (FY13) $ 10,645,930 $ 6,161,702 $ 1,024,564 $ 9,712,437 $ 27,544,633 Appalachian State $ 7,382,624 $ 4,223,727 $ 3,649,887 $ 6,139,437 $ 21,395,675 Arkansas - Little Rock* $ 3,435,709 $ 1,982,053 $ 929,873 $ 2,828,776 $ 9,015,885 Arkansas State $ 5,436,234 $ 4,357,902 $ 889,135 $ 6,611,661 $ 16,281,038 Georgia Southern $ 3,457,483 $ 4,217,092 $ 1,090,292 $ 4,435,883 $ 13,200,750 Georgia State $ 9,283,118 $ 6,648,734 $ 2,593,882 $ 8,735,381 $ 27,261,115 Louisiana - Lafayette $ 6,459,237 $ 3,925,773 $ 613,395 $ 7,653,919 $ 18,652,324 Louisiana - Monroe $ 3,511,320 $ 2,862,731 $ 690,244 $ 4,375,087 $ 11,439,382 South Alabama $ 7,383,835 $ 5,094,285 $ 766,942 $ 6,585,006 $ 19,830,068 Texas State $ 7,392,628 $ 4,740,513 $ 8,681,267 $ 7,086,505 $ 27,690,963 Troy $ 5,581,247 $ 4,855,126 $ 3,042,532 $ 6,026,818 $ 19,505,723 UT Arlington* $ 4,568,524 $ 3,286,143 $ 192,172 $ 5,923,834 $ 13,970,673 Maximum $ 9,283,118 $ 6,648,734 $ 8,681,267 $ 8,735,381 $ 27,690,963
Median $ 5,581,247 $ 4,223,727 $ 929,873 $ 6,139,437 $ 18,652,324
Minimum $ 3,435,709 $ 1,982,053 $ 192,172 $ 2,828,776 $ 9,015,885
Rank 1 2 6 1 2
Sun Belt Conference
*Do not sponsor the sport of football
Revenue Ticket Sales ContributionsRights /
LicensingStudent Fees
Institutional
SupportOther
Total
Revenues
UAB (FY13) $ 1,130,053 $ 2,456,762 $ 3,987,375 $ 4,980,820 $ 13,089,710 $ 2,514,529 $ 28,159,249 Akron $ 1,177,127 $ 1,126,953 $ 2,362,852 $ 19,109,155 $ 1,660,331 $ 2,517,746 $ 27,954,164 Ball State $ 555,765 $ 571,219 $ 2,539,479 $ 10,910,300 $ 5,036,249 $ 1,702,987 $ 21,315,999 Bowling Green $ 1,862,294 $ 1,258,174 $ 3,470,689 $ 12,408,393 $ 1,908,418 $ 2,703,480 $ 23,611,448 Buffalo $ 944,768 $ 392,815 $ 3,366,315 $ 7,952,787 $ 14,137,658 $ 2,169,707 $ 28,964,050 Central Michigan $ 1,843,389 $ 1,024,984 $ 4,037,407 $ 75,200 $ 18,497,624 $ 2,202,020 $ 27,680,624 Eastern Michigan $ 367,038 $ 418,086 $ 2,229,952 $ 1,572,843 $ 20,791,879 $ 2,417,858 $ 27,797,656 Kent State $ 742,911 $ 1,030,243 $ 1,860,352 $ 13,655,430 $ 6,903,386 $ 2,365,352 $ 26,557,674 Miami $ 1,183,368 $ 1,903,293 $ 2,739,700 $ 15,056,321 $ 4,377,718 $ 3,445,291 $ 28,705,691 Northern Illinois $ 2,203,585 $ 1,305,957 $ 3,162,675 $ 8,978,949 $ 8,593,495 $ 2,014,622 $ 26,259,284 Ohio $ 1,215,671 $ 2,204,293 $ 4,146,155 $ 15,724,403 $ 2,336,950 $ 1,637,589 $ 27,265,061 Toledo $ 1,983,629 $ 3,189,080 $ 3,645,223 $ 11,149,815 $ - $ 3,086,471 $ 23,054,218 Western Michigan $ 1,404,958 $ 693,863 $ 2,802,432 $ - $ 21,260,585 $ 2,462,510 $ 28,624,348 Maximum $ 2,203,585 $ 3,189,080 $ 4,146,155 $ 19,109,155 $ 21,260,585 $ 3,445,291 $ 28,964,050
Median $ 1,199,520 $ 1,078,598 $ 2,982,554 $ 11,030,058 $ 5,969,818 $ 2,391,605 $ 27,472,843
Minimum $ 367,038 $ 392,815 $ 1,860,352 $ - $ - $ 1,637,589 $ 21,315,999
Rank 9 2 3 10 5 5 4
Mid-American Conference
C o l l e g e S p o r t s S o l u t i o n s | M a y 2 0 1 5 P a g e I 4 4

UAB allocated total of $19.4M in FY15. Allocated revenue as a percentage of total revenue ranges from a low of 48% at Toledo to a high of 80% at Eastern Michigan. UAB would rank tenth for student fees, fifth for institutional support and eighth for overall allocated revenue. The percentage of total revenue would rank eleventh at 7% below the conference median.
Revenue Student FeesInstitutional
Support
Total
Allocated
Revenue
% of
Total
Revenue
UAB (FY13) 4,980,820$ 13,089,710$ 18,070,530$ 64% Akron 19,109,155$ 1,660,331$ 20,769,486$ 74% Ball State 10,910,300$ 5,036,249$ 15,946,549$ 75% Bowling Green 12,408,393$ 1,908,418$ 14,316,811$ 61% Buffalo 7,952,787$ 14,137,658$ 22,090,445$ 76% Central Michigan 75,200$ 18,497,624$ 18,572,824$ 67% Eastern Michigan 1,572,843$ 20,791,879$ 22,364,722$ 80% Kent State 13,655,430$ 6,903,386$ 20,558,816$ 77% Miami 15,056,321$ 4,377,718$ 19,434,039$ 68% Northern Illinois 8,978,949$ 8,593,495$ 17,572,444$ 67% Ohio 15,724,403$ 2,336,950$ 18,061,353$ 66% Toledo 11,149,815$ -$ 11,149,815$ 48% Western Michigan -$ 21,260,585$ 21,260,585$ 74% Maximum 19,109,155$ 21,260,585$ 22,364,722$ 80%
Median 11,030,058$ 5,969,818$ 19,003,432$ 71%
Minimum -$ -$ 11,149,815$ 48%
Rank 10 5 8 11
Mid-American Conference
C o l l e g e S p o r t s S o l u t i o n s | M a y 2 0 1 5 P a g e I 4 5

The median value for expense is $27,152,159, ranging from $20.701M to $28.96M. UAB would rank sixth. UAB would rank first for coaching/staff, and fourth for building/grounds. However two areas rank in the bottom-half of the conference - athletic financial aid at tenth and “other” expenses at seventh.
Expenses Coaching / Staff Athletic
Financial Aid
Building /
GroundsOther Total Expenses
UAB (FY13) $ 10,645,930 $ 6,161,702 $ 1,024,564 $ 9,712,437 $ 27,544,633 Akron $ 10,512,682 $ 6,776,068 $ 2,422,900 $ 8,696,087 $ 28,407,737 Ball State $ 8,433,133 $ 6,673,197 $ 117,997 $ 7,502,818 $ 22,727,145 Bowling Green $ 7,166,269 $ 5,442,181 $ 561,365 $ 7,531,673 $ 20,701,488 Buffalo $ 8,569,134 $ 7,277,504 $ 54,404 $ 13,193,162 $ 28,960,127 Central Michigan $ 9,195,673 $ 4,990,221 $ 5,158,043 $ 7,843,566 $ 27,187,504 Eastern Michigan $ 7,264,582 $ 7,417,412 $ 486,544 $ 12,629,118 $ 27,797,656 Kent State $ 9,118,355 $ 5,739,795 $ 517,394 $ 11,805,419 $ 27,116,813 Miami $ 10,415,792 $ 9,935,055 $ 181,568 $ 8,394,536 $ 28,926,951 Northern Illinois $ 6,374,776 $ 7,351,372 $ 433,031 $ 11,134,874 $ 25,294,053 Ohio $ 7,894,851 $ 7,068,691 $ 1,966,678 $ 10,097,330 $ 27,027,550 Toledo $ 7,302,789 $ 6,233,067 $ 948,796 $ 9,169,489 $ 23,654,141 Western Michigan $ 8,559,740 $ 7,320,233 $ 892,210 $ 11,858,102 $ 28,630,285 Maximum $ 10,512,682 $ 9,935,055 $ 5,158,043 $ 13,193,162 $ 28,960,127
Median $ 8,496,437 $ 6,922,380 $ 539,380 $ 9,633,410 $ 27,152,159
Minimum $ 6,374,776 $ 4,990,221 $ 54,404 $ 7,502,818 $ 20,701,488
Rank 1 10 4 7 6
Mid-American Conference
C o l l e g e S p o r t s S o l u t i o n s | M a y 2 0 1 5 P a g e I 4 6

IX. Facilities Improvement
The CSS team was provided a tour of existing facilities, as noted above. Particular focus was obviously centered on existing football facilities and football facility needs, if the sport were to be reinstated. Overall impressions were as follows:
I. Football Facilities a. Locker Room. This locker room, built at a cost of close to $1,000,000 within the past
two years, was impressive from both an aesthetic and functional perspective, with new lockers for all football student-athletes, and a dynamic feel of importance.
b. Coaches’ offices. These were less than impressive, situated in a building adjacent to the locker room and practice fields. This is in need of improvement.
c. Team Meeting Areas. These meeting areas, critical to success, were located inside the Coaches’ office, and were average at best. There is a strong need for more individual breakout rooms and better/larger team meeting area.
d. Outdoor Practice Area. This area was located adjacent to the locker room. The primary full 120 yard practice field is located inside the existing outdoor track, with a smaller practice area outside and next to the track. The fields are entirely grass. There is a need for at least a portion of the practice area to be replaced with artificial turf, to be utilized in wet/inclement weather. We were told that up to $750,000 had been raised by donors to buy and install such an artificial turf field.
II. New Indoor Football Practice Facility with Coaches’ Offices Much discussion with both UAB Athletic administrators and Coach Clark centered on the need for an indoor football practice facility with coaches’ offices. However, it was clear to the CSS team that this was not an essential piece needed in conjunction with the reinstatement of football – that it was a long-term desire rather than a short-term need. The best estimates we have relative to the cost for such a facility, in today’s dollars, would be approximately $12M to $15M.
III. Lease of Legion Field Our tour of Legion Field revealed a stadium, that although somewhat lacking and worn in infrastructure (locker rooms, amenities, premium seating areas), it has an exceptional grass surface and good general seating. We believe that it is probably too big for UAB, and we note in that regard that new FBS stadiums built within the last several years do not carry the capacities of previous stadiums, such as:
x University of Houston – 40,000 capacity x Tulane University – 30,000 capacity x University of Minnesota – 50,000 capacity x Stanford University – 50,000 capacity x University of Central Florida – 45,000 capacity
Finally, in our discussions with Coach Clark, he indicated that “he can win” at Legion Field. Of great importance to our team was the previous lease arrangement with the City of Birmingham, which did not provide revenue for UAB from areas such as concessions or parking. In our discussions with Mayor Bell, there was a clear indication that the City would be willing to work toward a future lease agreement that would be more financially beneficial to UAB.
C o l l e g e S p o r t s S o l u t i o n s | M a y 2 0 1 5 P a g e I 4 7
IV. New Stadium on Campus The CSS team was made aware, early in our discussions, of a previous proposed plan to build an on-campus stadium, one that could take advantage of additional and improved revenue streams in the following areas:
a. Parking b. Concessions c. Premium Seating d. Suite Revenue e. Marketing/Multi-media rights f. Other ancillary revenue opportunities
In addition, of course, an on-campus stadium would provide a multi-purpose venue for other university and non-university events that could be revenue producing. Through the course of our review, we were provided a copy of the initial feasibility report that was spearheaded by efforts of the previous UAB CFO Richard Margison. We were impressed with both the elements of the study and the revenue projections (and commitments) that emerged from that study. That study is attached to this report as Appendix C. If football were to be reinstated, we believe this report could be utilized in any subsequent study of a possible on-campus stadium.
C o l l e g e S p o r t s S o l u t i o n s | M a y 2 0 1 5 P a g e I 4 8

X. Debt Service Possibilities
Much discussion with the Task Force focused on the fact that, at this time, UAB athletics carries no debt. Our research shows that most, but not all, FBS institutions carry debt, particularly on new facilities. Debt service relative to a new stadium would of course be factored into that separate stadium pro forma, and is beyond the scope of this review. The question of whether or not there is room within the annual athletics budget for debt service payments on other investments is a critical question that must be answered prior to incurring the debt. Our projections will provide latitude to UAB in this regard, depending upon the revenue and expense path chosen.
C o l l e g e S p o r t s S o l u t i o n s | M a y 2 0 1 5 P a g e I 4 9

XI. Conference Affiliation Without Football
It was evident through our review that there was a flawed assumption that UAB could remain in Conference USA as a non-football playing member. Consequently, it appears there were no definitive discussions with other conferences regarding possible membership prior to the December 2nd announcement.
We believe that the most viable and meaningful options available to UAB relative to conference affiliation without football appear to be the following:
x Missouri Valley Conference x Sun Belt x Atlantic Ten
Our discussions with conference leadership in both the Missouri Valley Conference and the Sun Belt Conference provided us the following framework relative to admission to those conferences as a non-football playing school.
I. Missouri Valley Conference
Entry Costs
Equity Assessment New member institution(s) would be assessed an amount equal to 1/10th of the cash and non-cash assets (office building, equipment, etc.) of the MVC. This may vary, depending upon the total Conference reserves, the total cash held from annual distribution for the following year’s operating budget (as determined by the annual audit), and the estimated value of the MVC office building and other assets. Total estimated equity assessment costs of entry to MVC membership would likely be in the $350,000-$400,000 range. Investment in campus digital telecast production infrastructure Cost associated with a required campus telecast production model will include the purchase of equipment, maintenance agreement, training) – with a mandate to produce a minimum number of digital telecasts in new Conference media agreement that is pending. The number of required telecasts by each campus would rise annually to include – by 2018-19 – all home events that are not selected for inclusion in the MVC’s regional and national television packages, or by local media partners in institutional telecast packages. Men’s Basketball Scheduling Requirements Nonconference scheduling policies include low-RPI opponent restrictions and financial incentives and penalties, depending upon end-of-season RPI ranking.
Revenue Distributions
NCAA Men’s Basketball Tournament The MVC Constitution & Bylaws hold that for the first six years of league membership, new member institutions receive an equal share of the automatic-qualifier units earned by the MVC Tournament champion in each of the six NCAA Tournaments that precede entry into the MVC. Revenues from any additional units earned in those tournaments are not shared with the new member; however, all NCAA Tournament units earned after entry would be shared equally (along with the six AQ units that pre-
C o l l e g e S p o r t s S o l u t i o n s | M a y 2 0 1 5 P a g e I 5 0

dated entry by the new member). In 2016, the MVC’s NCAA Men’s Basketball Pool Distribution to a new institution would be approximately $156,000, and future distributions would include any new units earned by MVC teams subsequent to joining the membership. This distribution has historically provided 70% to 75% of the total Conference revenues generated by the league. Total Distributions The average institutional distribution over the past five fiscal years has been approximately $350,000 for member schools (that have been members for six or more years), which is inclusive of full Men’s Basketball Pool distributions. II. Sun Belt Conference Entry Costs Initial Fee The current initial fee for new members is $2,000,000, payable over the initial three years of membership. Revenue Distributions (2015-16)
x College Football Playoff ~$300,000 per non-football school x NCAA Men’s Basketball Distribution ~$165,000 per school x Television ~$91,000 per school
C o l l e g e S p o r t s S o l u t i o n s | M a y 2 0 1 5 P a g e I 5 1
XII. Research on the Effect of Having Football
Decades of research have shown that football programs impact universities beyond athletic department balance sheets. From increasing applications and enrollment to the advertising effect of games on local and national television, the qualitative factors are numerous albeit difficult to quantify. We provide herein a summary of the research that does exist in this area and the potential impact of either keeping or dropping football, and have identified key areas of concern (male undergraduate enrollment and Black/African American male undergraduate enrollment).
I. Adding/Dropping Football
Our research uncovered a published study that specifically addressed the impact adding or dropping football has on a university as whole, and we provide a summary here.
Brian Goff, a professor of economics at Western Kentucky University, included the impact of adding or dropping football on student enrollment in his 2000 study, looking at three schools that added or dropped football. Those three schools were Wichita State University and University of Texas-Arlington who dropped football in the mid-80s, and Georgia Southern University who added football.
Examining the years 1960-1993, Goff found an average decline of 600 students per year during “no football” years at Wichita State and UT Arlington. In contrast, he found an average increase of 500 students at Georgia Southern after adding football.
A report by Rascher and Schwarz in April 2015 referenced an unpublished article by Hutchinson and Rascher, which found schools that dropped football, “showed a slight (but not statistically significantly different) decline in their US News and World Report academic rankings, no change in enrollments, no change in SAT scores of incoming freshmen, and an actual statistically significant decrease in the quality of their basketball programs” (Rascher and Schwarz 2015).
UAB has expressed a goal of focusing more heavily on men’s basketball since discontinuing football. Twenty-one Division I schools dropped football from 1985 – 2010, and the Hutchinson and Rascher study found that those schools had an average ranking of 148 in the Sagarin Men’s Basketball Rankings during the five years prior to discontinuing the football program. After ending football, those twenty-one schools averaged a ranking of 176 (Rascher and Schwarz 2015).
II. Admissions and Enrollment
The “Flutie Effect” is perhaps the most widely known positive impact football can have on a university. In 1984, Boston College’s Doug Flutie threw a 48-yard touchdown pass as time expired to defeat then football powerhouse University of Miami. The game was nationally televised and the pass received extended national coverage. Flutie went on to win the Heisman Trophy and Boston College experienced a 30% increase in applications (McEvoy 2006).
Since then, the Flutie Effect has been observed at numerous universities following a winning season, particularly one that culminates in a postseason game. For example, in 1995 Northwestern had a ten-win season and appeared in the Rose Bowl, and the following year applications rose by 21%. The previous year, Penn State experienced a 15% increase in applications following its Rose Bowl appearance.
In more recent years, Boise State and TCU have both experienced the afterglow of football success. From Saturday Millionaires: How Winning Football Builds Winning Colleges (author Kristi Dosh is part of the CSS team):
C o l l e g e S p o r t s S o l u t i o n s | M a y 2 0 1 5 P a g e I 5 2

Boise State experienced spikes in applications following both its 2007 and 2010 Fiesta Bowl appearances which led to increased enrollment. A 9.1 percent increase in applications after the 2007 bowl game resulted in a 4 percent increase in enrollment the following fall, the first time enrollment had ever exceeded 19,000 students.
The story was similar after Boise State’s 2010 Fiesta Bowl win. A 5.6 percent increase in enrollment led to the largest enrollment in school history.
A study by Chung in 2013 detailed TCU’s experience, finding applications doubled from 2000 to 2008, following increased success by the football team. Chung concluded, “when a school goes from being mediocre to being great on the football field, applications increase by 18.7 percent. To attain similar effects, a school has to either decrease its tuition by 3.8 percent or increase the quality of its education by recruiting higher-quality faculty who are paid five percent more in the academic labor market.”
Smaller measures of success still produce results
Although major bowl appearances and postseason play have the largest impact (and we detail those studies herein), the more relevant research for UAB involves performance that can be more reasonably obtainable on a consistent basis.
For example, increasing the team’s winning percentage from one season to the next has been shown to increase application rates. A 1998 study found teams whose winning percentage increased by .250 over the previous season saw an average 1.3% increase in applications (Toma & Cross 1998). A more recent study in 2005 found that number to be larger when in-conference winning percentage increased. A .250 increase in conference winning percentage was associated with a 6.1% gain in applications the following year. A decrease in winning percentage was found to produce a 0.4% decrease in applications (McEvoy 2005).
A study released in mid-2012 found that a large increase in wins (ie., three wins to eight), was followed by a 5% increase in applications (Anderson 2012).
One study showed that mere membership in NCAA’s Division I increased the number of out-of-state students at a university by 2-4 percentage points (Mixon & Hsing 1994).
McCormick and Tinsley (1987) hypothesized that schools with athletic success may receive more applications, thereby allowing the school to be more selective in the quality of students they admit. They used data on average SAT scores and in-conference football winning percentages for 44 schools for the years 1981-1984 and found evidence that football success can increase average incoming student quality.
Following the McCormick and Tinsley study in 1987, several studies attempted to explore the relationship between football and basketball success and university applications, with varying results. In Devin G. Pope and Jaren C. Pope’s 2009 study they summarized the previous research in a two-page chart we have attached as Appendix A. The Popes’ 2009 study went into detail on the limitations (from the source of data used for the studies to the timing of the end of football and basketball season relative to typical admissions cycles) of the previous studies and attempted to provide an updated analysis on the relationship between sports success and applications, which we detail more fully below since it focused on high achievement on the field.
Student surveys
Some of the most interesting research comes from student surveys. The Carnegie Foundation completed extensive polling of college applicants in the late 1980s and found prospective students were greatly influenced by the athletic reputation of universities. One question asked of students enrolled at Division I schools was, “When applying to colleges for admissions, how well informed were you about the intercollegiate football and/or men’s basketball teams of the schools to which you applied?” Eighty-
C o l l e g e S p o r t s S o l u t i o n s | M a y 2 0 1 5 P a g e I 5 3

eight percent of males and 51 percent of females answered either “very well informed” or “moderately well informed.”
In contrast, when asked, “When applying to colleges for admission, how well informed were you about the undergraduate education programs of the school to which you applied?” only 39 percent of males and 42 percent of females chose the affirmative answers.
The Carnegie Foundation has not conducted a more recent survey. In 2011, however, Howell and Rascher conducted a survey of enrolling freshman at University of San Francisco that asked similar questions. Eighteen percent of enrolling freshman indicated the ability to watch college sports on campus was “very important” in their decision attend, with an additional 43% saying it was “somewhat important” (Rascher and Schwarz 2015).
National championships and ranked seasons
While UAB is obviously a considerable distance from this, research does suggest winning a national championship can have an even larger impact. Georgia Tech shared the national football title in 1990, and subsequently experienced a 28% increase in applications from 1991-1993 as compared to 1988-1990. The average increase from 1991-1994 was 34% higher than the average from 1983-1990 (Goff 2000).
The Popes’ 2009 study analyzed more recent results and ultimately concluded applications increased by 2% to 8% for the top-20 football schools and the top-16 basketball schools each year, and that the applications received are from a range of SAT scores, allowing schools to either become more selective by admitting higher-qualified applicants or allowing the school to increase enrollment and become more diverse. Additionally, the study found the impact to be more pronounced at private schools than public schools. (The Popes did further research on this issue for a study published in 2014, which we review below.)
A 2014 study by Devin G. Pope and Jaren C. Pope found a 2% increase in applications for schools with teams finishing the season in the top 20 in the AP poll results and a 5.2% increase if the team is ranked in the top ten (Pope & Pope 2014).
Impact on out-of-state students
Some of the largest impacts found by many researchers were in relation to out-of-state students. The Popes 2014 study concludes, “While a sports victory for a given school may not change the awareness of in-state students regarding its existence, the sports victory may present a significant shock in attention/awareness for out-of-state students.”
The potential to reach out-of-state students has significant value for a public institution such as UAB where out-of-state tuition is currently $472 more per credit hour, or $5,664 more per semester for out-of-state student taking a minimum full-time load of 12 credit hours.
In-State
(Alabama residents)
Out-of-State
(non-residents)
Undergraduate
$566 first credit hour - $351 subsequent
$1038 first credit hour - $823 subsequent
UAB Tuition 2014-15 (per credit hour)
Source: UAB
C o l l e g e S p o r t s S o l u t i o n s | M a y 2 0 1 5 P a g e I 5 4

Male Enrollment
The potential impact of the absence of football on male enrollment has been shown to be significant.
Male enrollment is down across the country in general. The U.S. National Center for Education Statistics reports female undergraduate enrollment increasing by 52% since 1990, while male enrollment has increased by just 43%.
At UAB, male enrollment has increased by 8.42% over the past five completed fall application cycles (compared to 17.35% for females), while the percentage of males admitted has risen by 4.34% over the same time period
The Popes 2014 study found “large and significant differences in the responsiveness of various demographic subgroups” when studying the correlation between football and basketball success and increase in applications. Specifically, males and Black/African Americans were found to be more affected by sports success in their application decisions.
Although it is impossible to predict the impact the absence of football would have on male enrollment at UAB – and we found no published studies which addressed this issue specifically at length – there is some anecdotal evidence from other schools who have previously discontinued football and recently restarted the programs (albeit not at the FBS level) at least in part due to a decrease in male enrollment at the university.
Pacific University previously sponsored football at what was then classified as Division I-A (now FBS) but discontinued the program in 1995. It is the last institution to discontinue football at this level until UAB’s decision in December 2014. However, Pacific restarted football in 2010 at the Division III level. In numerous reports (such as: http://www.oregonlive.com/news/index.ssf/2009/11/oregon_colleges_look_to_footba.html) Pacific has indicated the decision was based in part on a 2-to-1 ratio of female to male students.
"It's necessary to change the gender balance to be more representative of society," John Hayes, dean of Pacific's college of arts and sciences told The Oregonian in 2009 as the university prepared to restart the football program. "At more than 60 percent female, there is a different classroom dynamic, and I don't think the discourse is as rich."
Similarly, George Fox University and Lewis & Clark College re-established football programs in recent years.
"Our studies show that starting football brings a community of men that generally wouldn't choose your institution without it," George Fox University president Robin Baker told The Oregonian. Baker noted male undergraduate enrollment had dropped in recent years from 42 percent to 35 percent.
It should be noted that Pacific, George Fox and Lewis & Clark can be differentiated, as all three are smaller private universities that compete at the Division III level.
Another program was recently restarted at East Tennessee State University (undergraduate enrollment of ~11,550), which previously competed at the Division I FCS level in the Southern Conference and was discontinued following the 2003 season. In 2006, a task force began looking at reinstating football at ETSU, and in 2013 the Student Government Association voted in favor of a $125/semester increase in
Male Female Male Female Male Female Male Female Male Female
Fall 2014 2,293 3,417 2,004 2,889 87.40% 84.55% 747 1,001 37.28% 34.65%Fall 2013 2,214 3,475 1,944 2,990 87.80% 86.04% 697 1,035 35.85% 34.62%Fall 2012 2,458 3,588 1,828 2,610 74.37% 72.74% 709 945 38.79% 36.21%Fall 2011 2,307 3,268 1,692 2,335 73.34% 71.45% 687 891 40.60% 38.16%Fall 2010 1,952 2,715 1,635 2,212 83.76% 81.47% 689 853 42.14% 38.56%
% Change 17.47% 25.86% 22.57% 30.61% 4.34% 3.77% 8.42% 17.35% -11.55% -10.15%Source: UAB Office of Institutional Effectiveness https://www.uab.edu/institutionaSource: UAB Office of Institutional Effectiveness https://www.uab.edu/institutionaleffectiveness/student-data/enrollment
UAB First-Time Freshman Applications, Admissions and Enrollment
Total Applications Total Admitted Total Enrolled% Admitted % Enrolled
C o l l e g e S p o r t s S o l u t i o n s | M a y 2 0 1 5 P a g e I 5 5

fees to support the return of football. ETSU will field a team at the Division I FCS level, again in the Southern Conference, beginning in the fall of 2015.
Given UAB only denied admission to 289 males during the Fall 2014 application cycle, this appears to be an issue to be reviewed and considered. Black/African American Enrollment
The effect on Black/African American enrollment at UAB and the impact the absence of football would have on that segment of the student body may be significant. Black/African American football student athletes accounted for nearly 12% of all Black/African American undergraduate students at UAB in 2014-15, a percentage that has held steady over the past three years.
In addition, Black/African American football student athletes accounted for over 3% of all Black/African American graduate students at UAB in 2014-15.
III. Retention/Graduation Rates
Several studies have found that athletics has an impact on students once they are enrolled and on campus, resulting in increased retention and graduation rates.
The authors of one study describe the phenomenon as “football chicken soup”, and they surmise that football helps students “deal with the psychic costs of leaving home.” The authors say the social development encouraged by football leads students to do better in the classroom as they acclimate to university life (Mixon & Trevino 2005).
With regards to the impact of football, the study found both freshman retention rates and overall graduation rates increased commensurate with the winning percentage of the football programs over a ten-year period. For each 4 percent increase in winning percentage they found a correlating 1 percent increase in graduation rate (Mixon & Trevino 2005).
Another study found that both traditional undergraduates and student-athletes have higher graduation rates at universities with major athletic programs. The study notes the result is due in part to “superior academic resources” at those institutions (Rishe 2003).
Black/African American
Football Student-
Athletes (Undergrad)
Full-Time Enrolled
Black/African American
Students (Undergrad)
Black/African American
Football Student-
Athletes as Percentage
of Full-Time Enrolled
Undergrad Black-
African American
Students
Total Enrollment
(Undergrad)
Full-Time Black/African
American Undergrad
Students as Percentage of
Total Enrollment
2014-15 89 759 11.73% 8,472 8.96%2013-14 84 725 11.59% 8,357 8.68%2012-13 80 690 11.59% 8,270 8.34%Source: UAB Office of Institutional Effectiveness and UAB Athletic Department
Undergraduate Student Enrollment
Black/African American
Football Student-
Athletes (Graduate)
Full-Time Enrolled
Black/African American
Students (Graduate)
Black/African American
Football Student-
Athletes as Percentage
of Full-Time Enrolled
Graduate Black-African
American Students
Total Enrollment
(Graduate)
Full-Time Black/African
American Graduate
Students as Percentage of
Total Enrollment
2014-15 2 63 3.17% 2,780 2.27%
Graduate Student Enrollment
Source: UAB Office of Institutional Effectiveness and UAB Athletic Department
C o l l e g e S p o r t s S o l u t i o n s | M a y 2 0 1 5 P a g e I 5 6

IV. Donations
Multiple studies have found a link between athletic success and an increase in giving to both the athletic department and the university. As with admissions/enrollment, the more success a program sees on the field, the greater the impact.
Boise State experienced a significant impact after its first BCS bowl appearance in the Fiesta Bowl in 2007. The university announced its first comprehensive fundraising campaign shortly after the appearance and exceeded its $175 million goal by $10 million by the end of the 2011 fiscal year (Dosh 2013).
The university used coverage of its Fiesta Bowl win in USA TODAY in direct mailing efforts to support a new business building (Micron Business and Economics Building). That mailer also directly resulted in a $250,000 gift from an alumnus in California. In addition, then-head football coach Chris Peterson made a gift of $150,000 to support the new building, inspiring a donor in Salt Lake City to match his donation (Dosh 2013).
The impact on giving of a winning record, a bowl game or a playoff appearance has been analyzed in several published studies. A particular study analyzed general giving at 167 institutions from 1973 to 1990 and found a bowl appearance led to giving increases of 40-54% (Baade and Sundberg 1996). A subsequent study looked at 87 universities fielding Division I football and basketball teams and concluded alumni contributions per student rose 7.3% when the football team won a bowl game. The study went on to estimate the value of each bowl victory by taking the average alumni contribution per student for the universities in the study ($487), assessing a value of $35.55 per student for a bowl game and multiplying it across mean enrollment at the universities (24,132). The result: an additional $858,000 per football bowl victory (Rhoads and Gerking 2000).
A relationship has been found to exist absent bowl victories and national championships as well. A study in 2012 found donations increase significantly following a sharp increase in wins. Improving from three wins to eight wins correlated with a 28% increase in donations (Anderson 2012).
An additional study that focused on Clemson University from 1979 to 1993 found that every 10 percent increase in athletics giving corresponded with a 5 percent increase in general contributions (McCormick and Tinsey 1990).
V. State Appropriations
Beyond donations, studies have also found a positive correlation between college football and state appropriations for state universities. A 2003 study by Humphreys analyzed data from 570 public universities from 1976 to 1996 and found simply fielding an FBS football team produced larger appropriations. The author posited this could be because “…a big-time football program allows a universities’ administration, alumni and athletic boosters to produce political pressure more efficiently, because of the visibility of the team and the lobbying opportunities generated by home football games.”
The study also measured the impact of what the author called the “big game” – an annual or frequent game between two public universities from the same state – and found a win in that game correlated to a nearly 7% increase in appropriations, estimated at $2.1 million in 1982 dollars.
Humphreys referenced the model of competition for political influence amongst pressure groups described by Gary S. Becker in “A Theory of CompĞƚŝƚŝŽŶ�ĂŵŽŶŐ�WƌĞƐƐƵƌĞ�'ƌŽƵƉƐ�ĨŽƌ�WŽůŝƚŝĐĂů�/ŶŇƵĞŶĐĞ͕͟�published the Quarterly Journal of Economics in 1983. Humphreys says:
In states with two prominent public institutions of higher education, these two institutions and their alumni and boosters, will be continually competing for political influence in the state legislature and other bodies governing higher education. Head-to-head competition in a high profile
C o l l e g e S p o r t s S o l u t i o n s | M a y 2 0 1 5 P a g e I 5 7
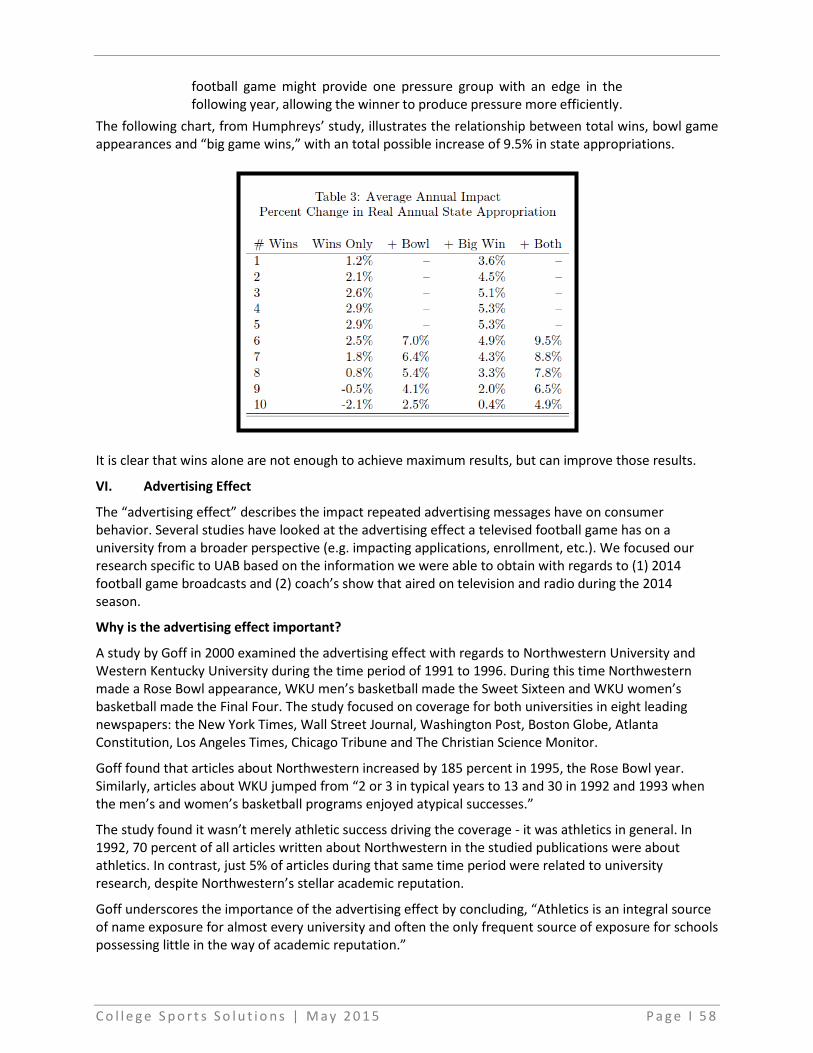
football game might provide one pressure group with an edge in the following year, allowing the winner to produce pressure more efficiently.
The following chart, from Humphreys’ study, illustrates the relationship between total wins, bowl game appearances and “big game wins,” with an total possible increase of 9.5% in state appropriations.
It is clear that wins alone are not enough to achieve maximum results, but can improve those results.
VI. Advertising Effect
The “advertising effect” describes the impact repeated advertising messages have on consumer behavior. Several studies have looked at the advertising effect a televised football game has on a university from a broader perspective (e.g. impacting applications, enrollment, etc.). We focused our research specific to UAB based on the information we were able to obtain with regards to (1) 2014 football game broadcasts and (2) coach’s show that aired on television and radio during the 2014 season.
Why is the advertising effect important?
A study by Goff in 2000 examined the advertising effect with regards to Northwestern University and Western Kentucky University during the time period of 1991 to 1996. During this time Northwestern made a Rose Bowl appearance, WKU men’s basketball made the Sweet Sixteen and WKU women’s basketball made the Final Four. The study focused on coverage for both universities in eight leading newspapers: the New York Times, Wall Street Journal, Washington Post, Boston Globe, Atlanta Constitution, Los Angeles Times, Chicago Tribune and The Christian Science Monitor.
Goff found that articles about Northwestern increased by 185 percent in 1995, the Rose Bowl year. Similarly, articles about WKU jumped from “2 or 3 in typical years to 13 and 30 in 1992 and 1993 when the men’s and women’s basketball programs enjoyed atypical successes.”
The study found it wasn’t merely athletic success driving the coverage - it was athletics in general. In 1992, 70 percent of all articles written about Northwestern in the studied publications were about athletics. In contrast, just 5% of articles during that same time period were related to university research, despite Northwestern’s stellar academic reputation.
Goff underscores the importance of the advertising effect by concluding, “Athletics is an integral source of name exposure for almost every university and often the only frequent source of exposure for schools possessing little in the way of academic reputation.”
C o l l e g e S p o r t s S o l u t i o n s | M a y 2 0 1 5 P a g e I 5 8

In Rascher and Schwarz’s April 2015 report, the authors did an analysis similar to the one done in Goff’s study with regards to coverage of UAB football, illustrative of the advertising effect UAB football has produced for the University:
Although a much more in-depth analysis could be undertaken with more resources and time, as a first pass we performed a Google News analysis of UAB media coverage during the academic year July 1 2013 – June 30 2014 reveals a heavy emphasis on football and athletics. Among more than 100,000 unique articles that year containing the word UAB, some 47% contained the word football, with 21% containing the exact phrase “UAB football”—more than double the coverage of other keywords such as business school, campus, faculty, medical school, and student. Basketball showed slightly lower levels of popularity: 44% contained the word basketball, though the exact phrases “men’s basketball” and “women’s basketball” each appeared in less than 1% of all media coverage (Rascher and Schwarz 2015).
It is difficult (if not impossible) to assign a dollar value to the media coverage received by a university, but there is little doubt of the value to the university. Below, we present evidence of the reach of football game broadcasts in 2014 and the value of the coach’s show on both television and radio for consideration.
2014 Football Game Broadcasts
Eleven of UAB’s 12 games during the 2014 season were televised, as the chart below demonstrates.
There is obvious value in the games against Mississippi State and Arkansas on Fox Sports Net and SEC Network, respectively. It appears that the Mississippi State game, which aired on Fox Sports South in Birmingham, received 27,000 household impressions. SEC Network had a reported reach of approximately 87 million households in 2014.
Date Opponent Network
8/30/2014 vs. Troy Fox College Sports9/6/2014 at Mississippi State Fox Sports Net
9/13/2014 vs. Alabama A&MAmerican Sports Network/
Siclair Broadcast Group
9/27/2014 vs. FIUAmerican Sports Network/
Siclair Broadcast Group10/4/2014 at Western Kentucky N/A
10/11/2014 vs. North TexasAmerican Sports Network/
Siclair Broadcast Group10/18/2014 at Middle Tennessee Fox College Sports10/25/2014 at Arkansas SEC Network
11/1/2014 at Florida AtlanticAmerican Sports Network/
Siclair Broadcast Group
11/8/2014 vs. Louisiana TechAmerican Sports Network/
Siclair Broadcast Group
11/22/2014 vs. MarshallAmerican Sports Network/
Siclair Broadcast Group
11/29/2014 at Southern MissAmerican Sports Network/
Siclair Broadcast Group
C o l l e g e S p o r t s S o l u t i o n s | M a y 2 0 1 5 P a g e I 5 9

Sinclair Broadcast Group, which owns and operates American Sports Network, provided household impression share numbers for each of the games it broadcast. We have provided a household impressions breakdown by market for each game on this network in Appendix B. A conservative estimate of total household impressions during this season on American Sports Network, using Nielsen DMA rankings, is 2.3 million.
American Sports Network
American Sports Network, which has a television rights contract with C-USA, televised seven UAB football games locally on Sinclair’s Birmingham-based television station, nationally on Sinclair broadcast stations, and on regional sports networks such as Comcast Sports Net (Chicago/Mid-Atlantic/Bay Area/Philadelphia), NESN, MASN, Time Warner Cable Sports Channel and Cox Sports Television.
ASN advised that the typical UAB game on ASN reached DMA’s representing 50 million to 70 million households.
In response to our request for ratings information, American Sports Network expressed its support of UAB restarting the football program, saying “UAB’s athletic program and especially its football program are very important to ASN.”
Additionally, ASN indicated that several of ASN’s best Nielsen-rated broadcasts were UAB football games, which the network said would “encourage ASN to televise more Conference USA and UAB football games in the future.”
ASN also told us in an email, “As ASN expands, Conference USA schools such as UAB will be a prime focus for live sports broadcasts and campus programming that will help raise the national profile of the university.”
Coach’s television and radio show
Bill Clark, and former UAB head football coaches, have traditionally appeared on both a weekly television and radio show during the season. This provides additional advertising opportunities for UAB.
According to Burton Advertising, which works with UAB on these shows, there are 10 football coach’s shows each season on ABC 33/40, which covers the entire Birmingham DMA, including Tuscaloosa and Anniston, stretching from the Mississippi/Alabama border into West Georgia. The reach is estimated at 710,000 homes.
ABC 33/40 donates the air time and in-studio production, so there is no cost for UAB. The cost of the air time donated is $2,500 per 30-minute window and the production is valued at $15,000 over the course of the year. The :30 ad rate during the show is $500. One way to measure advertising value is by using an ad equivalency formula wherein the :30 ad rate is multiplied by the length of the show. Using an average of 22 minutes for each coach’s show (subtracting commercial time) would put the advertising value of each coach’s show at $22,000.
UAB head football coaches have also traditionally hosted weekly one-hour radio shows on 100.5 FM approximately 14 times each season, and all UAB football games are broadcast on 107.7 FM. UAB currently spends $25,000 annually (in addition to $50,000 paid by IMG) for all of its radio buys, which includes the football and men’s basketball coach’s shows and game broadcasts, in addition to other radio advertising.
Although it is difficult to calculate an exact dollar figure, there is some advertising value in this radio exposure with regards to the coach’s show and the game broadcasts. In addition to the advertising value of the 14 hours on air each season for the coach’s show, the following revenue opportunities are also available within each show (subject to the terms of UAB’s contract with IMG, which currently provides for payment of 50% of gross revenue, as defined in the contract, over a specified annual threshold):
x The :60 ad rate within the radio show is $450 each (season-long entitlement)
C o l l e g e S p o r t s S o l u t i o n s | M a y 2 0 1 5 P a g e I 6 0

x The :30 ad rate within the radio show is $300 each (season-long entitlement)
x A live mention within the radio show is $3,450 each for the entire season (five available per show)
x A feature within the radio show is $5,850 each for the entire season (five available per show)
x The title sponsor rate for the radio show is $16,550 for the entire season
While there is no way to definitively peg the advertising value of the coach’s television and radio shows, there is clearly some value to the additional exposure given to the football program during these shows.
C o l l e g e S p o r t s S o l u t i o n s | M a y 2 0 1 5 P a g e I 6 1

XIII. UAB Potential Funding
I. Student Fees ͒
It is our understanding that the undergraduate student association has proposed a per semester fee for undergraduate students if the 3 sports are reinstated. Although this is commendable, our understanding is that much still needs to be done to actually put this into place.
II. Donor Support
It is our understanding that donors, alumni and friends have been hard at work obtaining commitments to assist with the delta if the three sports are reinstated. Again, this is commendable, but actual numbers will be borne out once those written commitments are presented.
III. New Stadium Lease at Legion Field
As cited in this report, we have noted a number of revenue opportunities that could become available to UAB with a new Legion Field Lease. Those opportunities include parking, concessions, premium seating, suites, etc. Mayor Bell indicated a willingness on behalf of the City to look at all such possibilities in a new lease. ͒In addition, we have learned that the City has passed a resolution providing increased funding on an annual basis to UAB Athletics over a 5-year period. Again, we are unsure of the validity or the number but encouraged by the public commitment.
IV. Support from other communities
It is our understanding that 54 surrounding communities have passed resolutions in support of UAB football. If each of those communities were to provide financial support for the endeavor, at least in the form of group season ticket purchases, it could be meaningful, even factoring a relatively small number of season ticket commitments from each of those communities.
V. Season Ticket Drive
It is our understanding that a substantive grass roots football season ticket drive was begun and elicited a strong response. Assuming the University wishes to continue to gauge that interest, we support that initiative.
VI. Bartow Arena Concessions
It is our understanding that UAB Athletics receives none of the concession revenue currently generated at UAB athletic events held in Bartow Arena. We suggest that this could be a substantial additional source of annual revenue.
VII. New Stadium
As mentioned in this report, we were impressed with the study done on a new on-campus stadium. If football is reinstated, we recommend a further study on the viability of an on-campus stadium.
C o l l e g e S p o r t s S o l u t i o n s | M a y 2 0 1 5 P a g e I 6 2

XIV. Title IX/Gender Equity
CSS believes it is important to provide a summary of current Title IX/Gender Equity law and practice in intercollegiate athletics as it relates to the potential impact from the removal of the three sports football, rifle, and bowling, and the addition of men’s cross country. Should UAB decide to reinstate these three sports programs, it must also determine whether to continue to sponsor the newly added sport of men’s cross country within the context of Title IX/Gender Equity. The Law and Its Interpretation Title IX measures gender equity in athletics in three distinct areas: (1) participation; (2) scholarships; and (3) other benefits, including the provision of equipment and supplies, scheduling, travel, tutoring, coaching, locker rooms, facilities, medical and training facilities and services, publicity, recruiting, and support services. Title IX requires that an institution designate at least one employee to coordinate the Title IX compliance responsibilities on campus.
I. Participation
An institution may comply with Title IX by satisfying one of three prong’s in the well-known three-part test. An institution’s athletics program will be determined to offer nondiscriminatory participation opportunities if it can demonstrate the following:
1) Its intercollegiate level participation opportunities for male and female students are “substantially proportionate” to their respective full-time undergraduate enrollments;
2) it has a “history and continuing practice of program expansion” for the under-represented sex; or
3) it is “fully and effectively” accommodating the interests and abilities of the under-represented sex.
CSS reviewed the 2013-14 EADA reporting for the institution. According to that report, full-time undergraduate enrollment at UAB is 41.7% male and 58.3% female. Conversely athletics participation was 50.4% male, 49.6% female, a difference of nearly 9%. At that time, females were the under-represented gender. However, it appears that UAB does have a history of program expansion with the most recent additions of sand volleyball and bowling.
Total % Total %
Male 3,470 41.7% 214 50.4%Female 4,842 58.3% 211 49.6%Total 8,312 425
Source: http://ope.ed.gov/athletics
Total Participants
Men's and
Women's Teams
Full-Time
Undergraduate
Enrollment
2013-14 UAB EADA Report
C o l l e g e S p o r t s S o l u t i o n s | M a y 2 0 1 5 P a g e I 6 3
With the removal of three sports – football, rifle, and bowling, UAB will likely need to utilize either prong one (proportionality) or prong three (survey to determine interest and ability). The following excerpt is taken from Equity and Title IX in Intercollegiate Athletics: A Practical Guide for Colleges and Universities — 2012 regarding proportionality. A school can demonstrate compliance with the first part of the three-part test if it can show that the athletics participation rate of the under-represented sex is substantially proportionate to the school’s full-time undergraduate enrollment. The OCR has refused to define “substantially proportionate” using concrete percentage points, but rather has stated that it is to be determined on a case-by-case basis. Accordingly, institutions are left to their own best judgment when deciding whether their numbers are “substantially proportionate.” In addition, the fact that OCR offices and courts throughout the country have interpreted this requirement in slightly different ways only continues to complicate the process. The 2005 Clarification Letter recognized that there have been differences in enforcement and pledged to enforce the law in a more uniform fashion in the future. Although federal courts have approved settlement agreements in cases with participation variances as great as 5 percent (ranging back to the 1990s), the OCR, through its 1996 Clarification, has taken a more conservative approach. It cites the following examples of substantial proportionality: (1) exact proportionality; (2) a disparity of 1 percent caused by an increase in the current year’s enrollment after a year of exact proportionality; and (3) an institution’s pursuit of proportionality over a five-year period and in the final year – when proportionality would otherwise have been reached – enrollment of the underrepresented sex increased so that there was a two percent disparity. While these examples are illustrative only, they suggest a more exacting standard than that set forth by the courts. At least one regional office stated informally that anything greater than one percent would raise red flags. Of course, percentage-point disparities represent varying numbers of actual participants depending upon the overall size of the athletics program. Where there exists a disparity that translates into a number less than that required to field a viable team (in other words – not enough who have both the interest and the ability), the law provides that the program is in compliance and that an additional team need not to be added. Finally, both the OCR and the courts have recognized that schools should be permitted to determine how they comply with this prong. Although strongly disfavored, schools may choose to implement a roster management system or eliminate programs instead of expanding opportunities to the under-represented sex. Such a practice will not, however, aid compliance under either the history or interest tests. Wherever possible, schools are encouraged to comply with the spirit of the law by adding opportunities for the underrepresented sex through the allocation of additional funding or by reallocating existing resources without eliminating viable programs for either sex. With this information in mind, CSS provides this initial look at the participant impact with the removal of the three named sports and the addition of men’s cross country. The following assumptions were used for calculation purposes. Any adjustments in these areas would inevitably modify percentages provided.
1. Undergraduate enrollment will remain relatively the same, and any removed sport participants who are no longer at the institution would be replaced with general student population.
C o l l e g e S p o r t s S o l u t i o n s | M a y 2 0 1 5 P a g e I 6 4
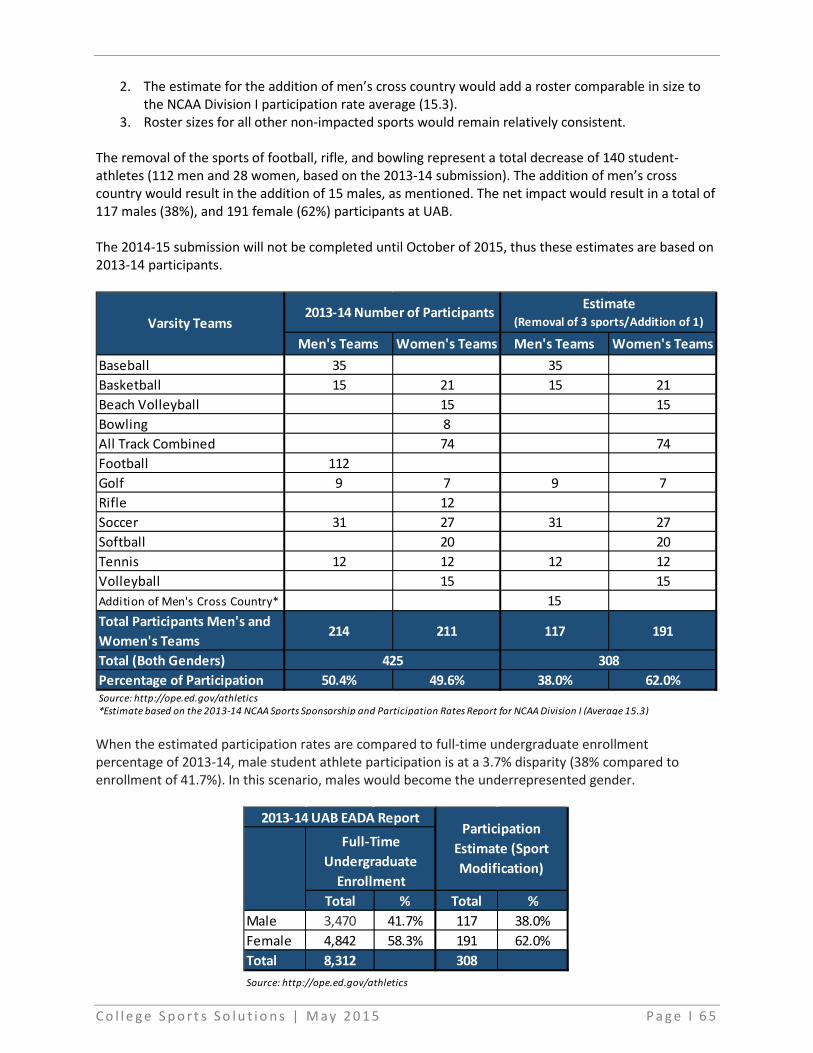
2. The estimate for the addition of men’s cross country would add a roster comparable in size to the NCAA Division I participation rate average (15.3).
3. Roster sizes for all other non-impacted sports would remain relatively consistent. The removal of the sports of football, rifle, and bowling represent a total decrease of 140 student-athletes (112 men and 28 women, based on the 2013-14 submission). The addition of men’s cross country would result in the addition of 15 males, as mentioned. The net impact would result in a total of 117 males (38%), and 191 female (62%) participants at UAB. The 2014-15 submission will not be completed until October of 2015, thus these estimates are based on 2013-14 participants.
When the estimated participation rates are compared to full-time undergraduate enrollment percentage of 2013-14, male student athlete participation is at a 3.7% disparity (38% compared to enrollment of 41.7%). In this scenario, males would become the underrepresented gender.
Men's Teams Women's Teams Men's Teams Women's Teams
Baseball 35 35Basketball 15 21 15 21Beach Volleyball 15 15Bowling 8All Track Combined 74 74Football 112Golf 9 7 9 7Rifle 12Soccer 31 27 31 27Softball 20 20Tennis 12 12 12 12Volleyball 15 15Addition of Men's Cross Country* 15Total Participants Men's and
Women's Teams214 211 117 191
Total (Both Genders)
Percentage of Participation 50.4% 49.6% 38.0% 62.0%
*Estimate based on the 2013-14 NCAA Sports Sponsorship and Participation Rates Report for NCAA Division I (Average 15.3)
Varsity Teams2013-14 Number of Participants
425 308
Source: http://ope.ed.gov/athletics
Estimate (Removal of 3 sports/Addition of 1)
Total % Total %
Male 3,470 41.7% 117 38.0%Female 4,842 58.3% 191 62.0%Total 8,312 308
Source: http://ope.ed.gov/athletics
Participation
Estimate (Sport
Modification)
Full-Time
Undergraduate
Enrollment
2013-14 UAB EADA Report
C o l l e g e S p o r t s S o l u t i o n s | M a y 2 0 1 5 P a g e I 6 5

II. Scholarships
Institutions that provide financial aid to students on the basis of their athletics ability (athletics scholarships) are required under Title IX to award “substantially proportionate” dollars to male andfemale student-athletes. The financial aid measure is based on the unduplicated head count of student-athletes in relation to the student athletic financial aid. Any award beyond a 1% disparity could be deemed disproportionate. If the disparity is greater than 1% the institution may need to provide legitimate non-discriminatory reasons for the disparity.
In 2013-14 the UAB unduplicated count of participants was 57.7% male, 42.3% female. Athletically related student aid was within 2.1% of unduplicated participants. With the net decrease of 97 males (loss of 112 in FB/addition of 15 in cross country) and 20 females (12 rifle/8 bowling) the unduplicated count of participants changes to 46.1% male and 53.9% females. UAB will need to align with this new figure for athletically related student aid.
Projections of an estimated financial aid spending in future years is difficult due to the following variables:
x Future changes including the cost of attendance adjustment now available through the NCAA. x Level of athletic financial aid support for men’s cross country as the program grows. x The varying number of in-state vs. out-of-state students in coming years by team x Potential impact of current student-athletes in the cancelled sports remaining at UAB for
multiple years. UAB Athletics has shared that 64 football, 10 rifle and 11 bowling student-athletes from the 2014-15 roster will remain next year. Of those, 37 are seniors. The remainder may elect to remain in future years with subsequent financial support.
Unduplicated Count
of Participants%
Athletically Related
Student Aid%
Male 214 57.7% 4,058,861$ 59.8% 97 117 46.1%Female 157 42.3% 2,731,142$ 40.2% 20 137 53.9%Total 371 6,790,003$ 117 254
2013-14 UAB EADA Report
Modified EstimateS-A
Change
Freshman Sophomore Junior Senior Total
Football 140 8 15 12 29 64 957,272$ Rifle 10 2 2 3 3 10 83,635$ Bowling 11 3 3 0 5 11 105,132$ Total 161 13 20 15 37 85 1,146,039$
S-A Anticipated Return by ClassHead Count
2014-15
Anticipated
Scholarship Cost
FY16
C o l l e g e S p o r t s S o l u t i o n s | M a y 2 0 1 5 P a g e I 6 6

III. Other Benefits
Institutions must “provide equal athletics opportunities for members of both sexes.” In order to determine whether a school provides equivalent athletics benefits and opportunities, the OCR will review the following “list” of treatment issues:
a. Provision and maintenance of equipment and supplies; b. Scheduling of games and practice times; c. Travel and per diem expenses; d. Opportunity to receive tutoring and assignment and compensation of tutors; e. Opportunity to receive coaching, and assignment and compensation of coaches; f. Provision of locker rooms, practice and competitive facilities; g. Provision of medical and training services and facilities; h. Provision of housing and dining services and facilities; i. Publicity; j. Support services; and k. Recruiting.
Regardless of the decision, we recommend a Title IX/Gender Equity review to provide a current analysis and establish a process to set goals and timetables, if any. This plan should include the campus Title IX coordinator, and be approved through campus administration.
C o l l e g e S p o r t s S o l u t i o n s | M a y 2 0 1 5 P a g e I 6 7

XV. Reference Material
As part of this review, CSS requested documentation from UAB including both athletic and institutional information. In addition, Conference USA provided further information. Throughout the interview process, additional documents were provided by interviewees. To supplement the documents provided, CSS also completed supplemental research. The following provides an outline of documents received and research completed as part of this report. I. Documents received from UAB through document requests/interview process
x Projected budget information for FY16 x FY12- FY15 UAB Budget Information x Zero Based budgeting exercise by sport and department x Various contracts related to:
o Self-generating revenue o Legion field o Employment o Equipment/Apparel
x Letters of support and various resolutions supporting football x Student-athlete information regarding count and financial aid for the three impacted sports x Attendance history x On-campus football stadium project financial projections x Draft documents for Title IX/Gender Equity x Previous Studies
o Previous study regarding athletics (2008) x Emails from softball head coach Tiffany Railey regarding recruiting and donor relations issues x Historical enrollment figures
II. Documents received from Conference USA
x FY15 Conference USA Budget Survey x 2014 Conference Expenses Report x Attendance analysis x Season ticket analysis x Bowl history x Television viewership including ratings, market and media share
III. The following supplemental research sources were used
x www.UABsports.com x www.UAB.edu x www.UAB.edu/institutionaleffectiveness x Revenue & Expenses: NCAA Division I Intercollegiate athletics programs report 2004-2013 x USA Today NCAA Finances Database (http://sports.usatoday.com/ncaa/finances/) x Equity in athletics data analysis cutting tool (http://ope.ed.gov/athletics/) x National Centers for Education Statistics (www.nces.ed.gov) x 2014-15 Division I Revenue Distribution Plan x Equity and Title IX in Intercollegiate Athletics: A Practical Guide for Colleges and Universities
2012 x NCAA Sports Sponsorship and Participation Report 1981-82 – 2013-14
C o l l e g e S p o r t s S o l u t i o n s | M a y 2 0 1 5 P a g e I 6 8

x Conversations and emails with Burton Advertising x Conversations and emails with American Sports Network/Sinclair Broadcast Group x Conversations and emails with NCAA
Academic Resources x Anderson, M. L. (2012). The Benefits of College Athletic Success: An Application of the
Propensity Score Design with Instrumental Variables. National Bureau of Economic Research Working Paper No. 18196 .
x Baade, R. A. and Sundberg, J.S. (1996). Fourth and down and gold to go? Assessing the link between athletics and alumni giving. Social Science Quarterly , 77 (4), 789-803.
x Chung, D.J. (2013). The Dynamic Advertising Effect of Collegiate Athletics. Marketing Science , 32 (5), 679-698.
x Dosh, K. A. (2013). Saturday Millionaires: How Winning Football Builds Winning Colleges. Nashville, TN and New York, NY: Turner Publishing Company/Wiley General Trade.
x Goff, B. (2000). Effects of University Athletics on the University: A Review and Extension of Empirical Assessment. Journal of Sport Management , 96-97.
x Humphreys, B. R. (2006). The Relationship Between Big-Time College Football and State Appropriations to Higher Education. International Journal of Sport Finance , 1 (2), 119-128.
x Joe, F. (2009, November 3). Oregon colleges look to football to draw more males to female-dominated campuses. Retrieved May 2015, from http://www.oregonlive.com/news/index.ssf/2009/11/oregon_colleges_look_to_footba.html
x McCormick, R.E. and Tinsley, M. (1990), “Athletics and academics: a model of university contributions.” In B.L. Goff and R.D. Tollison (Eds.). Sportometrics, pp. 193-206.
x McCormick, R. E. and Tinsley, M. (1987). Athletics Versus Academics? Evidence from SAT scores. Journal of Political Economy , 95 (5), 1103-1116.
x McEvoy, C. (2006). The Impact of Elite Individual Athletic Performance on University Applicants for Admission in NCAA Division I-A Football. The Sport Journal , 9 (1).
x McEvoy, C. (2005). The relationship between dramatic changes in team performance and undergraduate admissions applications. The SMART Journal , 2 (1), 17-24.
x Mixon, F.G. and Trevino, L.J. (2005). From Kickoff to Commencement: The Positive Role of Intercollegiate Athletics In Higher Education. Economics of Education Review , 24, 97-102.
x Mixon, F.G. and Hsing, Yu (1994). The Determinants of Out-of-State Enrollments in Higher Education: A Tobit Analysis. Economics of Education Review , 13 (4), 329-335.
x Pope, D.G. and Pope, J.C. (2009). The Impact of College Sports Success on the Quantity and Quality of Student Applications. Southern Economic Journal , 75 (3), 750-780.
x Pope, D.G. and Pope, J.C. (2014). Understanding College Application Decisions: Why College Sports Success Matters. Journal of Sports Economics , 15 (2), 107-131.
x Rascher, D.A. and Schwarz, A.D. (2015). The Incremental Benefits and Costs of Football, Bowling, and Rifle at the University of Alabama at Birmingham. Unpublished.
C o l l e g e S p o r t s S o l u t i o n s | M a y 2 0 1 5 P a g e I 6 9

x Rhoads, T. A. (2000). Educational Contributions, Academic Quality, and Athletic Success. Contemporary Economic Policy , 18 (2), 248-258.
x Rishe, P. (2003). A Reexamination of How Athletic Success Impacts Graduation Rates: Comparing Student-Athletes to All Other Undergraduates. American Journal of Economics and Sociology , 62 (2), 407-427.
x Toma, J.D. and Cross, M.E. (1998). Intercollegiate Athletics and Student College Choice: Exploring the Impact of Championship Seasons on Undergraduate Applications. Research in Higher Education , 39 (6), 633-661.
IV. Reporting Consistency With the extent of reference information and benchmarking used, it is common for different reports to refer to similar areas with different terminology. In an effort to remain consistent throughout the various sources, CSS used the following terminology. In some instances the wording was modified for consistency purposes when compared to the original source data.
x Self-generated revenue – Refers to revenue outside of institution allocations, student fees, and governmental support. Examples of self-generated revenue include ticket sales, contributions, rights/licensing, guarantees, etc.
x Institutional Support – Used to refer to allocated revenues by the institution this may include tuition waivers, direct or indirect support as well as tuition waivers.
x Total Allocated Revenues – Used to refer to all athletic revenue coming directly from the institution in the form of institutional support or student fees. This in some instances is also commonly referred to as an institution subsidy.
x Athletic Financial Aid – Refers to athletically related financial aid. In some areas typically referred to as athletic scholarships.
C o l l e g e S p o r t s S o l u t i o n s | M a y 2 0 1 5 P a g e I 7 0

XVI. Appendix A
C o l l e g e S p o r t s S o l u t i o n s | M a y 2 0 1 5 P a g e I 7 1

C o l l e g e S p o r t s S o l u t i o n s | M a y 2 0 1 5 P a g e I 7 2
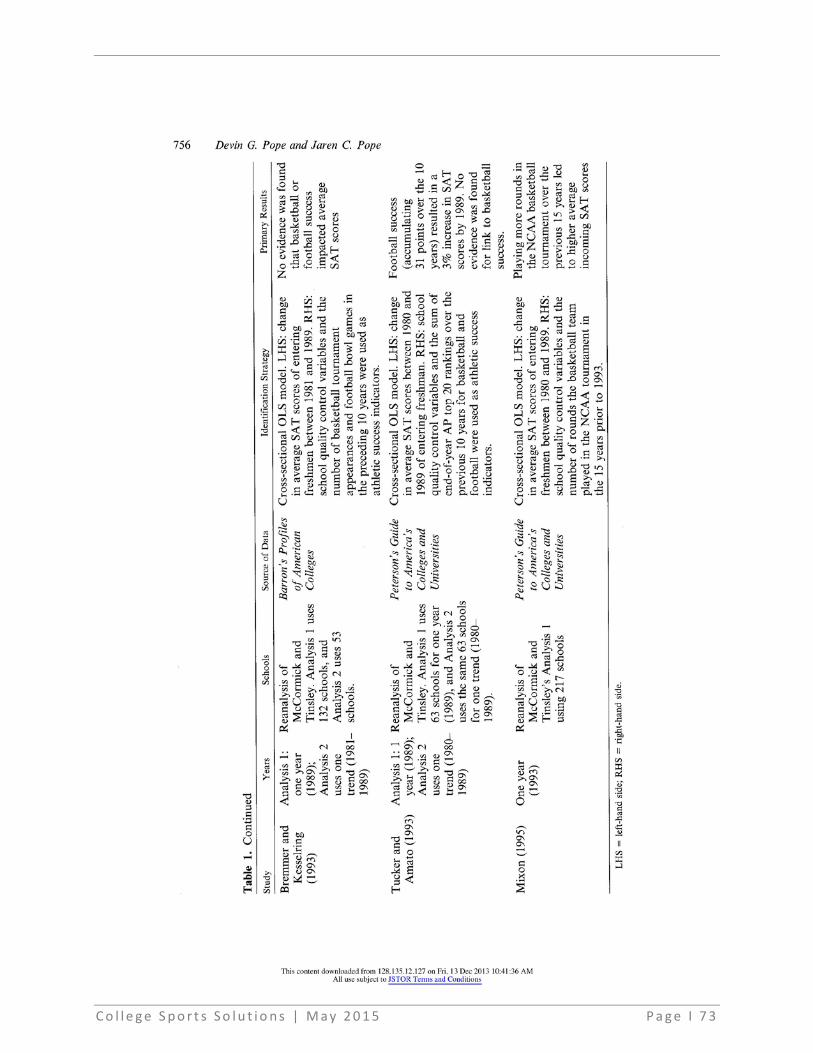
C o l l e g e S p o r t s S o l u t i o n s | M a y 2 0 1 5 P a g e I 7 3

XVII. Appendix B
C o l l e g e S p o r t s S o l u t i o n s | M a y 2 0 1 5 P a g e I 7 4

ShareTotal
ImpressionsShare
Total
ImpressionsShare
Total
ImpressionsShare
Total
ImpressionsShare
Total
ImpressionsShare
Total
ImpressionsShare
Total
Impression
s
Charlotte, NC WCCB (CW) Raleigh-Durham, NC WLFL (CW) 2.0 22,600Raleigh-Durham, NC WRDC (MyNetwork TV) 0.8 9,000 0.9 10,000 0.4 4,500 0.0 0 1.5 17,000
Asheville, NC WLOS (ABC) Asheville, NC WMYA (My Network TV) 5.1 19,000 1.7 14,000 2.2 18,000 3.1 26,000 2.5 21,000 2.0 16,000
Winston Salem, NC WXLV (ABC) Wilmington, NC WWAY (CW)
Tri-Cities, TN/NC/VA MTN 18 (Ind)Greensboro, NC WMYV (MyNetwork TV) 2.8 0.8 4,800 0.7 3,000 2.0 13,000 2.9 20,000Greensboro, NC WMYV-2 (Get TV)
West Palm Beach-Ft. Pierce, FL WPEC (CBS),West Palm Beach-Ft. Pierce, FL WTVX (The CW), West Palm Beach-Ft. Pierce, FL WTCN (My NetworkTV), 0.0 0.0 0 0.2 15,000 2.4 19,000 1.2 9,000 0.2 15,000West Palm Beach-Ft. Pierce, FL WWHB (Azteca)Miami-Ft. Lauderdale, FL WBFS (My NetworkTV) 2.6 42,000 0.2 3,000
Tampa/St. Petersburg, FL WTTA (MyNetworkTV) 0.7 12,000 0.2 3,600 1.3 23,000 2.6 46,000 4.6 83,000Pensacola, FL WEAR (ABC) Pensacola, FL WJTC (IND)Ft. Walton, FL WFGX (MyNetworkTV)
Orlando, FL WRDQ (Ind) Orlando, FL WKCF (CW) 2.4 35,000 2.4 35,000 7.5 110,000 3.4 50,000
Jacksonville, FL WJXX (Soul of the South) N/AJacksonville, FL WJXT-2 (This TV) 0.0 0.2 1,000 0.6 4,000Tallahassee, FL WTWC (NBC) Tallahassee, FL WTFL (CW Plus)
Shreveport, LA KMSS (Fox) Shreveport, LA KSHV (My Network TV)Regional (New Orleans, Baton Rouge, etc.) CST Charleston-Huntington, WV WCHS (ABC) Charleston-Huntington, WV WVAH (Fox) Charleston-Huntington, WV WCHS-2 (Get TV)
Bluefield-Beckley-Oak Hill, WV WVVA (CW)Nashville, TN WZTV (FOX) Nashville, TN WUXP (MyNetworkTV) 11.2 112,000 0.8 8,000 0.6 6,000 0.7 7,000 1.2 12,000
Knoxville, TN WATE (LiveWell)Jackson,TN WNBJ (CW)
Chattanooga, TN WTVC-2 (This TV)Chattanooga, TN WTVC (ABC)
Dallas, TX KTXA (Ind) 1.4 36,000Tyler-Longview, TX KLPN (My Network TV)
Norfolk-Portsmouth-Newport
News, VAWTVZ (MyNetworktV) 1.1 7,700 1.7 12,000 1.0 7,000 2.2 15,000 1.9 13,000
Norfolk-Portsmouth-Newport
News, VA WTVZ-2 (GetTV)
Richmond, VA WRLH (Fox)Richmond, VA WFLH-2 (My Network TV) 0.0 0 0.4 2,000 0.5 2,000 1.8 9,000 1.1 5,000
Roanoke-Lynchburg, VA WSET (ABC) Roanoke-Lynchburg, VA WSET-2 (Retro-TV) Roanoke-Lynchburg, VA WWCW (CW)
Houston, TX N/A
Regional CSNBeaumont, TX KFDM (CBS) Beaumont, TX KBTV-2 (Bounce)
Hattiesburg, MS CST (on delay)
Hattiesburg, MS WHLT (CBS) (away games)
Jackson, MS WJTV (CBS)
Jackson, MSWLOO DT (Soul of the
South)Meridian, MS WMDN (CBS)
Columbus/Tupelo, MSWCBI (CBS) (CW) (My
Network TV)Biloxi-Gulfport (Gulf Coast), MS WXXV (FOX and NBC)
Regional - (Greenwood/Greenville) CST Birmingham, AL WTTO (The CW) 9.5 66,000Birmingham, AL WABM (MyNetworkTV) 15.1 107,000 1.1 7,000 1.8 12,000 13.0 91,000 28.5 200,000 11.0 77,000
Huntsville - Decatur, AL WAMY (My Network TV) Huntsville - Decatur, AL WZDX (Fox)
Montgomery - Selma, AL WBMM-CW (CW) Montgomery - Selma, AL WBMM-NN (Heartland)
El Paso, TX KFOX (FOX) El Paso, TX KFOX-2 (Retro TV) El Paso, TX KDBC (CBS) El Paso, TX KVIA-2 (CW Plus)
Las Cruces, NM KCWF (CBS)Amarillo, TX KVII (ABC) Amarillo, TX KVII-2 (CW Plus)
Albuquerque, NM KASY (MyNetwork TV) 0.2 1,000Clovis, NM KVIH (ABC)
San Antonio, TX KABB (FOX) San Antonio, TX WOAI (NBS) 0.3 2,000San Antonio, TX KMYS (CW) 1.8 16,000 0.3 2,000 1.0 9,000San Antonio, TX WOAI-2 (Live Well)San Antonio, TX KCWX (MyNetworkTV) 1.3 11,000
Austin, TX KEYE (CBS)Corpus Christi, TX KRIS (CW)
Bryan-College Station, TX CSTHarlingen, TX KGBT (CBS)
Bowling Green, KY WKYU (PBS)
Louisville, KY WAVE (This TV)
Lexington, KY WDKY (Fox)
Lexington, KY WDKY-2 (Get TV)
Lexington, KY WTVQ (My Network TV)
C-USA Market/School Network
Ch
arlo
tte
FIU
an
d F
lori
da
Atl
an
tic
LOCAL TV - LISTED BY C-USA MARKET/SCHOOL (Household Impressions)3:30 PM
N. Texas @UAB
10/11/147:00 PM
LA T
ech
Ma
rsh
all
MT
SU
UN
TO
DU
Ric
eU
SM
UA
BU
TE
PU
TS
AW
KU
Marshall @ UAB
3:30 PM09/13/14
Alabama A&M @ UAB
3:30 PM09/27/14
FIU @ UAB
3:30 PM11/29/14
UAB @ S. Miss
11/01/14
UAB @ Florida Atlantic
12:00 PM11/08/14
LA Tech @ UAB
12:00 PM11/22/14
C o l l e g e S p o r t s S o l u t i o n s | M a y 2 0 1 5 P a g e I 7 5

ShareTotal
ImpressionsShare
Total
ImpressionsShare
Total
ImpressionsShare
Total
ImpressionsShare
Total
ImpressionsShare
Total
ImpressionsShare
Total
Impression
s
Buffalo, NY 0.1 N/A 0.3 1,000 2.1 12,000 1.16,000
Cincinnati, OH 1.8 14,000 2.2 17,000 1.3 10,000 3.7 29,000 1.612,000
Cincinnati, OH 3.3 26,000 4.3
Columbus, OH 8.9 80,000 1.7 15,000 0.3 2,000 0.1 N/A 1.0 9,000 34,000 0.00
Oklahoma City, OK 0.9 6,000 0.9 6,000 3.1 21,000 2.8 19,000 0.21,000
Pittsburgh, PA 0.0 0.1 1,000 0.6 6,000 2.1 23,000 0.66,000
Baltimore, MD 0.3 3,000 0.2 2,000 0.0 0 0.7 7,000 2.6 26,000 0.44,000
Las Vegas, NV 1.4 9,000 4.8 33,000 0.3 2,000
Portland, OR 0.0 0 0.2 2,000 0.7 7,000 0.0 0 1.011,000
Seattle, WA 0.0 0 0.5 9,000 0.9 16,000 2.9 52,000 0.00
Salt Lake City, UT 0.3 0 4.0 32,000 0.0 0 2.2 17,000 0.21,000
Non-Sinclair Stations - Outside
C-USA Footprint
Atlanta, GA WATL (My TV) 3.5 80,000 1.2 27,000Macon, GA WMUB (PBS)
Indianapolis WNDY (My Network)
Hartford & New Haven WCTX (My Network)
Hartford & New Haven WCCT (CW) 2.3 20,000 2.0 18,000Detroit WHNE (Soul of the South) N/A
Rochestr-Mason City-Austin KIMT-2 (My Network)
Providence-New Bedford WNAC-2 (My Network) 0.2 1,000
Savannah, GA WTGS (Fox)
Youngstown, OH MYTV (My TV)
TOTAL 408,300 268,600 213,800 314,500 456,000 255,000 397,000
C-USA Market/School Network
LOCAL TV - LISTED BY C-USA MARKET/SCHOOL (Household Impressions)3:30 PM
N. Texas @UAB
10/11/147:00 PM
WPMY (My TV)
Sinclair Stations - Outside C-USA Footprint
WUTB (My TV)
KVMY (My TV)
KATU-2 (Me TV)
KOMO-2 (This TV)
KMYU (My TV)
WNYO (My TV)
WSTR (My TV)
EKRC (CW)
WSYX (My TV)
KOCB (CW)
Marshall @ UAB
Source: Sinclair Broadcast Group; Nielsen 2014/15 DMA Ranks
3:30 PM09/13/14
Alabama A&M @ UAB
3:30 PM09/27/14
FIU @ UAB
3:30 PM11/29/14
UAB @ S. Miss
11/01/14
UAB @ Florida Atlantic
12:00 PM11/08/14
LA Tech @ UAB
12:00 PM11/22/14
C o l l e g e S p o r t s S o l u t i o n s | M a y 2 0 1 5 P a g e I 7 6

XVIII. Appendix C
C o l l e g e S p o r t s S o l u t i o n s | M a y 2 0 1 5 P a g e I 7 7