Review of South-West Indian Ocean Region › files › 43526_southwest.pdf · Review of South-West...
50
February 2015 Review of South-West Indian Ocean Region UNISDR Working Papers on Public Investment Planning and Financing Strategy for Disaster Risk Reduction
Transcript of Review of South-West Indian Ocean Region › files › 43526_southwest.pdf · Review of South-West...
February 2015
Review of South-West Indian Ocean Region
UNISDR Working Papers on Public Investment Planning and Financing Strategy for Disaster Risk Reduction

OECD Regional Development Working
Papers 2014/12 UNISDR Working Papers on Public Investment Planning and Financing Strategy for Disaster Risk Reduction
Review of South-West Indian Ocean Region
February 2015
Please cite this paper as:
UNISDR Working Papers on Public Investment Planning and Financing Strategy for Disaster Risk Reduction: Review of South-West Indian Ocean Region, 2015, UNISDR. Geneva.

UNISDR Working Papers on Public Investment Planning and Financing Strategy for Disaster Risk Reduction
This series is designed to make available to a wider readership selected studies on public investment planning and financing strategy for disaster risk reduction prepared for use in co-operation with Member States. Authorship is usually collective, but principal authors are named. UNISDR Working Papers should not be reported as representing the official views of the UNISDR or of its member countries. The opinions expressed and arguments employed are those of the author(s). Working Papers describe preliminary results or research in progress by the author(s) and are published to stimulate discussion on a broad range of issues on disaster risk reduction.

Contents List of Tables ........................................................................................................................................................... 4
List of Figures.......................................................................................................................................................... 4
List of Boxes............................................................................................................................................................ 4
List of Acronyms ...................................................................................................................................................... 5
Acknowledgements ................................................................................................................................................. 6
Executive Summary ................................................................................................................................................ 7
1. Introduction ......................................................................................................................................................... 9
2. Regional Structures ........................................................................................................................................... 10
A. Population .................................................................................................................................................... 10
B. Government and Political Structures ............................................................................................................ 10
C. Economic Structures .................................................................................................................................... 11
D. Public Finance .............................................................................................................................................. 13
3. Disaster Loss .................................................................................................................................................... 16
A. Overview ...................................................................................................................................................... 16
B. Disaster Loss in the IOC Region .................................................................................................................. 17
4. Disaster Risk ..................................................................................................................................................... 20
A. Overview ...................................................................................................................................................... 20
B. Probabilistic Risk Assessment in the IOC Region ........................................................................................ 23
5. Regional DRM/DRR/CCA Framework ............................................................................................................... 26
A. Institutional Structures .................................................................................................................................. 26
B. Legal structures ............................................................................................................................................ 26
C. Status of Hyogo Framework for Action ......................................................................................................... 28
6. DRR/DRM/CCA in Public Investment Planning ................................................................................................. 29
A. Current Status of Risk-Sensitive Public Investment ..................................................................................... 29
B. Contingency Finance Mechanisms ............................................................................................................... 30
C. Economic analysis to support risk sensitive public investment planning ...................................................... 32
C.1. Summary of the Risk-Sensitive Budget Review (RSBR) ....................................................................... 33
C.2. Macro-economic analysis: CATSIM ...................................................................................................... 36
C.3. Micro-economics: Cost Benefit Analysis ............................................................................................... 38
7. Conclusions and Recommendations ................................................................................................................. 40
Further challenges: Data gaps, capacity training and awareness raising toward risk layered approach ...... 40
References ............................................................................................................................................................ 42
Annex D: Workshops and Meetings in IOC region ................................................................................................ 43

List of Tables
Table 1: Population in the IOC Region .............................................................................................................. 10 Table 2: National government structure of the IOC Region (as of December 2014) ..................................... 11 Table 3: Hosting agencies of national disaster loss database........................................................................ 17 Table 4: Hazard events in the IOC (1980-2011) ................................................................................................. 17 Table 5: Mortality due to disasters in the IOC .................................................................................................. 18 Table 6: Economic loss by country ................................................................................................................... 19 Table 7: Hosting agencies for probabilistic risk assessment. ........................................................................ 22 Table 8: Absolute and Relative AAL in the IOC ................................................................................................ 23 Table 9: PML for tropical cyclonic winds .......................................................................................................... 23 Table 10: PML for earthquake ............................................................................................................................ 24 Table 11: Disaster risk Management agencies ................................................................................................. 26 Table 12: Instruments related to DRM/DRR or DM ........................................................................................... 27 Table 13: Hyogo Framework for Action progress reported by IOC countries ............................................... 28 Table 14: Key government stakeholders identified in each country .............................................................. 29 Table 15: Financial mechanisms to address recovery and reconstruction costs in the region .................. 32 Table 16: Different scopes in budget review .................................................................................................... 33 Table 17: DRM marked investments .................................................................................................................. 34 Table 18: Tagging by component of risk management (% of total DRM investment) ................................... 35 Table 19: Gap Analysis ....................................................................................................................................... 35 Table 20: CATSIM Analysis (for tropical cyclone and earthquake) ................................................................ 36 Table 21: Cost Benefit Analysis ......................................................................................................................... 39
List of Figures
Figure 1: GDP (in USD billion at 2012 prices) ................................................................................................... 12 Figure 2: GDP per capita (in USD thousand at 2012 prices) ........................................................................... 12 Figure 3: Gross capital formation (in USD billion 2012 prices) ....................................................................... 13 Figure 4: Current account balance as % of GDP .............................................................................................. 13 Figure 5: Government balance, % of GDP ........................................................................................................ 14 Figure 6: Trends of donor aid (in USD 2012 prices) ......................................................................................... 14 Figure 7: Total Economic Loss (infrastructure and agriculture) ..................................................................... 18 Figure 8: Economic Loss due to extensive events (infrastructure and agriculture) ..................................... 19 Figure 9: Key concepts of probabilistic risk assessment ............................................................................... 20 Figure 10: Loss exceedance curve .................................................................................................................... 21 Figure 11: Loss exceedance curve of SWIO region for tropical cyclonic winds ........................................... 25 Figure 12: Loss exceedance curve of SWIO region for earthquake ............................................................... 25 Figure 13: Fiscal gap and risk management strategies based on ‘risk layering approach’ ......................... 37
List of Boxes
Box 1: Donor fund uncertainty produces a gap between budget and expenditure: Case of Zanzibar ........ 15 Box 2: Good practices toward risk sensitive investment ................................................................................ 30 Box 3: Insurance in Mauritius ............................................................................................................................ 32 Box 4: Insufficient risk information limits credibility of fiscal risk assessment’: Case of Seychelles ........ 37 Box 5: Madagascar CATSIM simulation in 2012 and 2014 .............................................................................. 38 Box 6: Probabilistic CBA workshop in Madagascar ........................................................................................ 38 Box 7: Insufficient loss data limits accuracy and credibility of CBA: Zanzibar CBA case ........................... 39

List of Acronyms
AAL Annual Average Loss
CATSIM CATastrophe SIMulation
CCA Climate Change Adaptation
CAPRA Comprehensive Approach for Probabilistic Risk Assessment
CBA Cost Benefit Analysis
DRM Disaster Risk Management
DRR Disaster risk Reduction
EIA Environmental Impact Assessment
EU European Union
GAR Global Assessment Report on Disaster Risk Reduction
GDP Gross Domestic Product
GEF Global Environment Fund
GFCF Gross Fixed Capital Formation
HFA Hyogo Framework for Action
IOC Indian Ocean Commission
IIASA International Institute for Applied System Analysis
IMF International Monetary Fund
PML Probable Maximum Loss
RSBR Risk Sensitive Budget Review
SIDS Small Island Developing States
UNDP United Nations Development Programme
UNFCCC United Nations Framework Convention on Climate Change
UNISDR United Nations Office for Disaster Risk Reduction
WB World Bank

Acknowledgements
This report was produced by the United Nations Office for Disaster Risk Reduction (UNISDR) in co-operation with
the Indian Ocean Commission (IOC) under its “ISLANDS Programme for Financial Protection against Climatic and
Natural Disasters”. Special thanks are given to
Mr. Christophe Legrand and Mr. Philippe Boullé (IOC)
Mr. Rakotomanana Andrianaivo Régis, the Chief of the Macroeconomic Framework Department of the
Ministry of Finance and Budget, Madagascar
Mr. Kresh Seebundhun, Lead Analyst of Ministry of Finance and Economic Development, Mauritius
Ms. Divina Sabino, Project Officer, Division of Disaster Risk Management (DRDM) and Mr. Thesee
Damien, Controller General, Ministry of Finance, Seychelles
Colonel Ismael Mogne Daho, Director General of Civil Security and Mr. Salim Ali Soilihi, Director.
General. Adjoint of Budget, Ministry of Finance, Comoros
Mr. Faki Mwadini Faki, Deputy Account General of the Ministry of Finance, Zanzibar
All national teams’ members from the different ministries involved.
Ms. Kazuko Ishigaki (UNISDR) directed and coordinated the overall development of this report. Ms. Lezlie C.
Moriniere drafted the report. Many valuable inputs were received from Mr. Sylvain Ponserre and Ms. Mabel Cristina
Marulanda Fraume (UNISDR), Ms. Junko Mochizuki, Mr. Stefan Hochrainer, Mr Reinhard Mechler, Mr. Keith
Williges and Mr. Callahan Egan of International Institute for Applied Systems Analysis (IIASA). Overall project
including a series of workshops was coordinated by Mr. Julio Serje (UNISDR).
UNISDR is grateful to the European Commission (Directorate-General for Development and Cooperation) for its
financial contributions.

Executive Summary
In 2013, following a grant agreement signed between UNISDR and the Indian Ocean Commission, a joint
UNISDR/IOC programme was started entitled “Strengthening Capacities for Unified Climate Change Adaptation
and Disaster Risk Reduction Through the Facilitation of Risk Transfer and Financing Mechanisms”. It was
implemented within the “ISLANDS Programme for Financial Protection against Climatic and Natural Disasters”. It
also forms a part of UNISDR’s global project for around 30 countries: “Building Capacities for Increased Public
Investment in Integrated Climate Change Adaptation and Disaster Risk Reduction: 2012-2015” financed by the
European Union.
Four island countries in the Indian Ocean as well as the Government of Zanzibar participated in this joint
UNISDR/IOC programme composed of three components: the establishment of reliable disaster loss database
(Component 1), risk evaluation and probabilistic risk assessment profiles (Component 2) and incorporation of risk
management into public investment planning (Component 3). Economic analysis and policy reviews were
developed as a package. This report aims to summarize all activities implemented in the programme with a focus
on public investment planning (Component 3) while a technical report on Components 1 and 2 is also available1.
As a first step (Component1), a total of 3,235 data cards on disaster events and losses between 1980 and 2013
were registered in the national disaster loss database. Economic loss totalled USD 17.2 billion (2012 constant
price), out of which, 96% was due to intensive and extensive cyclones. In the subsequent probabilistic risk analysis
(Component2), Average Annual Loss (AAL) for tropical cyclonic wind and earthquake combined across the region
was estimated at USD 161.43 million, with a Probable Maximum Loss (PML) of USD 1,466 million for a 50-year
return period.
This loss and risk information pointed to the need to reduce tropical cyclone risk. However, in itself it did not suggest
policy guidance. Grounded in the loss and risk analysis, a thorough policy review and economic analysis were
implemented (Component 3).
CATSIM analysis developed by IIASA identified that the fiscal resource gap year (i.e. the return period at which the
government will face difficulty in raising sufficient funds for reconstruction) for tropical cyclone and earthquake
hazards in each country. The gaps for the IOC islands were between 24 (Madagascar) and 329 (Seychelles) years.
Drawing from the risk layer based approach, because of their high volume of extensive risk and their low fiscal gap
years, it was judged to be more beneficial and effective for Madagascar and Comoros to focus on risk reduction
efforts while Mauritius and Seychelles should also start to explore risk-financing mechanisms.
The following probabilistic cost benefit analysis (CBA) presents how CBA can support concrete and specific
evidence-based decision making. A specific scenario and project was examined (i.e. housing retrofitting or water
drainage) for each island using probabilistic (forward or backward looking) methods and a Net Present Value (NPV)
for each was determined. Three of the five studied efforts were determined to be cost-effective. Key variables and
updated damage and cost information were lacking to produce a more useful CBA especially in the cases that the
NPV was negative.
Based on these findings, current Disaster Risk Management (DRM) policy in the Indian Ocean region and
especially public finance (including DRR investment and risk financing mechanisms) were examined. In spite of
much progress in HFA implementation and disaster management systems, no definite and systematic DRR
investment policy exists in the IOC countries. Several sectorial ministries in all five islands make risk sensitive
investment implicitly. Cost benefit analysis, when required for large-scale projects, does not take disaster risk into
consideration. Critical infrastructure is not sufficiently protected against disaster risk. Contingency financing
mechanisms are also under-developed.
To explore the financial aspects of DRM policy, each country also estimated the current investment in disaster risk
management by applying a DRM Marker method in an examination of national budgets, proposed for the OECD
by the World Bank in partnership with UNISDR.
Results determined that between 2 and 16% of studied budgets is invested in DRM, implicitly or explicitly in any
given year, corresponding to approximately USD 457 million. Overall, more than twice as much marked effort is
categorized as “significant” (as opposed to “principle”), demonstrating that they are embedded in development
projects --mainstreamed into development. The general trend points to greater investment in preventive / mitigation
DRR action for Mauritius, Seychelles and Zanzibar; and investment in response for Madagascar and Comoros.
1 For component 1 and 2, please see UNISDR /IOC (2014). Component 1 and 2: Comoros, Madagascar, Mauritius, Seychelles
and Zanzíbar. Building capacities for increased public investment in integrated climate change adaptation and disaster risk reduction: 2012-2015. European Commission - Directorate General for Development and Cooperation. Geneva, Switzerland.

A comparison of annual investment in DRM to AAL and observed loss determined that among the five islands,
Madagascar suffers the greatest gap, pointing to the need for greater DRR investment. Most countries identified
that for the budget review to be more meaningful, it needs to more carefully capture and track investment related
to specific hazards.
During several meetings with representatives of the Ministries of Finance in the IOC region, it was established that
a scattered approach to DRM is inefficient and there is need for stronger collaboration between the DRM agency,
Ministry of Finance and other key sectoral ministries. Continuous capacity building on risk terminology and
concepts, loss and risk information management and economic analysis was recommended by Ministries of
Finance in the region.
The loss and risk information should be examined from the perspective of both DRM policy maker and financial
planners. Given the importance of public investment in DRR, continuous refinement of loss and risk information
should be promoted through regular dialogue with data users. In the process of economic analysis, Ministries of
Finance understood and appreciated the importance of loss and risk information. On some cases, they identified
several mistakes and inconsistencies in the records in disaster loss databases and the data were corrected. Such
exchanges of information will improve overall quality of knowledge management to support DRM decision making.
Government needs to develop investment and financing strategies to address both extensive (small scale but high
frequency) and intensive (low frequency but high impact). Climate change will increase risks in terms of frequency,
geography and intensity. Understanding risk structures and the expected economic impact in the country is the
critical first step to determine the optimum policy mix for each risk layer. In developing investment and financing
strategies to address disaster risk, DRR investment and risk financing should not be considered separately.
Depending on risk layers, the most appropriate policy mix changes and DRR investment and risk financing are not
mutually exclusive. For example, DRR investment often decreases insurance premiums.
This packaged approach with a focus on financial planners in government will be standardized and replicated in
Asia, Africa, Latin America and other regions in the coming years and the knowledge is planned to be archived and
presented globally in a working paper series of UNISDR on “Public Investment and Financing Strategy for DRR”.
The report summarizing activities in IOC region will thereby contribute to increasing the global knowledge base.

1. Introduction
In 2012, the UNISDR started a project called “Building capacities for increased public investment in integrated
climate change adaptation and disaster risk reduction: 2012-2015” under the financial sponsorship of EC-
Development and Cooperation (EC-DEVCO). The initiative supports approximately 30 countries in Asia, Pacific,
Africa, Latin America and the Caribbean to systematically account for disaster loss and to develop probabilistic
estimations of future risk. It provides a baseline for an economic approach toward better public investment planning.
In the Western Indian Ocean region, this initiative has been separately planned and implemented between 2013-
2015 in cooperation with the ISLANDS programme of the Indian Ocean Commission (IOC), in accordance with the
programme design developed by UNISDR and implemented through the “ISLANDS Financial Protection
Programme against Climatic and Natural Disaster Risks”.
The initiative has three components:
Component 1: disaster loss
Component 2: probabilistic disaster risk assessment
Component 3: public investment planning
Component 3 of this initiative considers disaster risks in economic analysis to support and facilitate risk-proof public
investment decision-making. It especially aims to contribute to the progress of HFA priority areas monitored through
core indicator 4.6 “procedures are in place to assess the disaster risk impacts of major development projects,
especially infrastructure” and 3.3 “Research methods and tools for multi-risk assessments and cost benefit analysis
are developed and strengthened”.
UNISDR has been in charge of designing methodologies for Component 3 and in the process, considered how
natural science can be linked to social science to contribute to better decision making in public investment planning.
In the Indian Ocean Commission (IOC) region, this project has been planned and implemented from 2013 to 2015
in cooperation with ISLANDS, in accordance with the project design developed by UNISDR.
This report summarizes all activities implemented in the IOC Region2. Chapter 2 presents the regional structure
and differences in basic country structure, as background. Chapters 3 and 4 outline loss and risk as the starting
point of analysis. Chapter 5 briefly explains the DRR institutions and policies across the region. Chapter 6 outlines
the current state of risk-sensitive public investment planning and risk financing policy and summarizes the national
level results of three types of economic analysis implemented in the effort.
In Component 3, UNISDR introduced tools a) to monitor DRM budgets to analyse the current state of public
investment (called the “risk sensitive budget review”), b) to measure the impact of disasters on public finance and
on the economy at the macro scale (CATSIM analysis), and c) to measure the impact of DRR investment on society
(probabilistic cost-benefit analysis). In Chapter 7, recommendations for policy makers are presented drawing from
the analyses implemented.
For greater theoretical and technical background and detailed case studies on each tool, readers are directed to
consult the country report series (one per island). In the introductory chapters of each national report, the
background, especially why we need risk-sensitive public investment, is explained. Then, basic concepts of loss
and risk are defined to provide a common understanding of key terminology. Lastly, the overall streamlined process
from loss data analysis through probabilistic risk assessment into economic analysis is explained.
2 A series of workshop/meetings are listed in Annex.

2. Regional Structures
This chapter sets the foundation for the exploration of risk- sensitive public investment in five islands situated in
the Indian Ocean (hereafter called IOC Region), namely:
o Madagascar o Mauritius o Seychelles o Comoros o Zanzibar (of the United Republic of Tanzania).
While the general structure of the region is provided below, the institutional and legal structures in place for disaster
risk management are described in Chapter 5.
A. Population
These five islands in the Indian Ocean are home to 25.8 million people sitting on 594,331 km2 of land. The
population density of the islands ranges from 35 (in Madagascar) to 618 (in Mauritius) (Table 1).
Table 1: Population in the IOC Region
Population Area
(km2)
Pop. Density
Madagascar 22.3 million (2012) 587,040 35
Mauritius 1.26 million (2014) 2,040 618
Seychelles 88,300 (2012) 455 198
Comoros 734,900 (2013) 2,236 278
Zanzibar 1,303,569 (2012) 2,560 530
IOC REGION 25.6 million 594,331 43
Source: UNISDR/IOC (2015a, 2015b, 2015c, 2015d, 2015e) and World Bank for Comoros.
B. Government and Political Structures
The Indian Ocean Commission (IOC) is an intergovernmental organization that was created in 1982 in Port Louis
(Mauritius) and later institutionalized by the Victoria Agreement (Seychelles) in 1984. It brings together five
countries from the Indian Ocean region: Comoros, Madagascar, Mauritius, Seychelles and Reunion (France).
As a tool for regional cooperation, across all sectors - political and diplomatic, economic and ecological, cultural
and health - the IOC enables its members to respond to the common challenges of sustainable development.
Indeed, the IOC as an external vehicle for collective and concerted action, leads cooperation projects that cover a
wide range of fields including: maritime security, health monitoring, the management and control of fisheries,
disaster risk reduction, the promotion of political stability and improved air, maritime and digital connectivity. As the
only African regional organization made up entirely of islands, the IOC defends the common interests of its island
states on the regional and international scene.
In doing so, the IOC has become the preferred interlocutor of development partners, which it mobilises around
cross border issues of common interest.

This is in the context of its mission that the island of Zanzibar of the United Republic of Tanzania, has been added
to the beneficiary territories of the ISLANDS programme.
IOC operates wherever its action brings a strong added value to those of its members and / or initiatives of broader
regional organizations (COMESA, SADC, Tripartite) of continental institutions (African Union) and / or multilateral
(UN, WTO, etc.). While ensuring the principles of coordination, complementarity and subsidiarity, IOC assumes a
supporting role in areas where its members require specific heightened support. Its aim is to increase the impact
of its interventions, focusing on the implementation of initiatives that produce more tangible results and more visible
benefit to the people.
At the national level within the region, there are some major differences in forms of government, etc. Highlights are
described in Table 2.
Table 2: National government structure of the IOC Region (as of December 2014)
Year of
Independence
Form of Government Legislature
Madagascar 1960 Unitary semi-presidential
republic
Parliament (Senate and National
Assembly)
Mauritius 1968 (Republic
since 1992)
Parliamentary republic National Assembly
Seychelles 1976 Presidential republic National Assembly
Comoros 1975 Federal presidential republic Assembly of the Union
Zanzibar 1963 Union Government, Semi-
autonomous state within the
United Republic of Tanzania
House of Representatives
UNISDR/IOC (2015a, 2015b, 2015c, 2015d, 2015e)
C. Economic Structures3
While economic structures (i.e. as manifest in the GDP) in the region have been on the rise for Mauritius and
Madagascar more or less since 2002, they have only risen since 2012 for Seychelles and have stagnated for
Comoros (Figure 1). The trends for per capita GDP, however, demonstrate that while per capita growth is
growing for Seychelles and Mauritius, the same cannot be said for Madagascar (Figure 2).
3 Zanzibar was not analyzed together in this section due to lack of comparable data
Mission of the IOC
The IOC has a mission to actively contribute to the construction of a regional platform for sustainable
development by strengthening the ties of solidarity among its Member States on the basis of a smart growth
strategy and concerted actions.
More specifically, the IOC’s mission has two complementary components:
the development and implementation of regional cooperation projects designed to protect the populations of
Indianoceanic region, improve their lives and preserve the natural resources upon which they are heavily reliant;
the defence of common interests of its Member States on the regional and international scene and emphasis
of their specific characteristics with development partners and in multilateral fora.

Figure 1: GDP (in USD billion at 2012 prices)
Source: World Bank Development Indicators
Figure 2: GDP per capita (in USD thousand at 2012 prices)
Source: World Bank Development Indicators
Figure 3 demonstrates growth in capital formation for Mauritius and scattered status for Madagascar until data
were no longer available. For Comoros, available data show very little real growth (data for Seychelles not
available). Figure 4 shows the current account balance as proportion of GDP in which all countries demonstrate
volatile trends with Seychelles the most negative and Madagascar the most optimistic since 2009.

Figure 3: Gross capital formation (in USD billion 2012 prices)
Source: World Bank Development Indicators
Figure 4: Current account balance as % of GDP
Source: International Monetary Fund, World Economic Outlook Database, April 2014
D. Public Finance
Public finance in the region is described by exploring trends in government balance as proportion of GDP. All four
countries for which data exist show slight improvements over the past year (Figure 5).

Figure 5: Government balance, % of GDP
Sources: International Monetary Fund, World Economic Outlook Database, April 2014
Donor aid is an important source for DRR in this region. Except for Madagascar, whose donor aid has fallen sharply
since the civil strife, trends in donor aid has hovered under USD 200milion for the other three countries, with
Seychelles and Comoros receiving the lowest (Figure 6). Donor fund uncertainty produces a gap between budget
and expenditure (see Box 1 in Zanzibar explanation).
Figure 6: Trends of donor aid (in USD 2012 prices)
Source: African Development Bank, Organisation for Economic Co-operation and Development, United Nations Development
Programme (2014)
0
200
400
600
800
1'000
1'200
2007 2008 2009 2010 2011 2012
Comoros Madagascar
Mauritius Seychelles
USD million (2012 price)
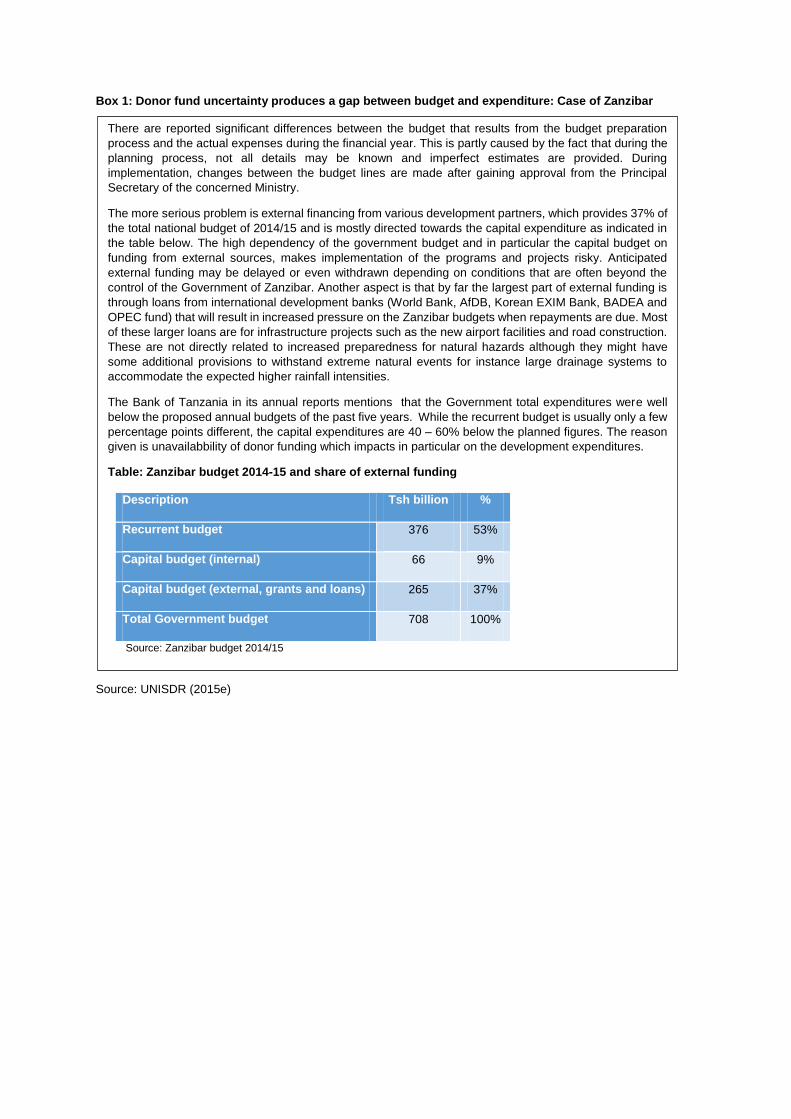
Box 1: Donor fund uncertainty produces a gap between budget and expenditure: Case of Zanzibar
Source: UNISDR (2015e)
There are reported significant differences between the budget that results from the budget preparation
process and the actual expenses during the financial year. This is partly caused by the fact that during the
planning process, not all details may be known and imperfect estimates are provided. During
implementation, changes between the budget lines are made after gaining approval from the Principal
Secretary of the concerned Ministry.
The more serious problem is external financing from various development partners, which provides 37% of
the total national budget of 2014/15 and is mostly directed towards the capital expenditure as indicated in
the table below. The high dependency of the government budget and in particular the capital budget on
funding from external sources, makes implementation of the programs and projects risky. Anticipated
external funding may be delayed or even withdrawn depending on conditions that are often beyond the
control of the Government of Zanzibar. Another aspect is that by far the largest part of external funding is
through loans from international development banks (World Bank, AfDB, Korean EXIM Bank, BADEA and
OPEC fund) that will result in increased pressure on the Zanzibar budgets when repayments are due. Most
of these larger loans are for infrastructure projects such as the new airport facilities and road construction.
These are not directly related to increased preparedness for natural hazards although they might have
some additional provisions to withstand extreme natural events for instance large drainage systems to
accommodate the expected higher rainfall intensities.
The Bank of Tanzania in its annual reports mentions that the Government total expenditures were well
below the proposed annual budgets of the past five years. While the recurrent budget is usually only a few
percentage points different, the capital expenditures are 40 – 60% below the planned figures. The reason
given is unavailabbility of donor funding which impacts in particular on the development expenditures.
Table: Zanzibar budget 2014-15 and share of external funding
Description Tsh billion %
Recurrent budget 376 53%
Capital budget (internal) 66 9%
Capital budget (external, grants and loans) 265 37%
Total Government budget 708 100%
Source: Zanzibar budget 2014/15

3. Disaster Loss
A. Overview
Component 1 of this initiative was to build a disaster loss database that registers not only large-scale but also
small-to-medium scale disasters. The small-to-medium scale disasters are rarely registered in the international
disaster databases, because their effects are considered to be less relevant from a macroeconomic perspective.
However, such disasters usually impact the livelihoods of poor people, perpetuating their level of poverty and
human insecurity, and eroding government budgets. They exacerbate local level sustainability and pose serious
problems for the development of a country as a whole. The analysis of disasters at all scales allows the identification
of aggregated effects over time, regional areas and hazards targeted as high priority, and impacts on housing and
livelihoods of local communities.
Loss information contributes to comprehensive risk assessment by providing an estimate of the risk of high
frequency but small-scale risk. It also gives information on non-modelled hazards. Furthermore, it can be utilized
as an input to economic analysis, for example cost benefit and economic impact analysis. The key concepts
introduced in the loss data analysis are:
Intensive disasters: high-severity, mid to low frequency disasters, mainly but not exclusively associated with high
profile fast-onset hazards. UNISDR classifies disasters as intensive when at least 30 people are killed, and/or a
minimum of 600 houses are destroyed.
Extensive disasters: low severity, high frequency disasters, mainly but not exclusively associated with highly
localized and often slower-onset hazards. All disasters with less than 30 people killed, and/or less than 600 houses
destroyed, are classified as “extensive”. There is no minimum number of deaths or damaged houses to be
considered extensive4.
During the project, data on extensive and intensive disasters that occurred from 1980 to 2014 were collected. The
data were registered by district, which allows more detailed examination of loss distribution in the country. The
current loss database basically registers direct physical loss data only. Indirect and socio-economic loss data are
not registered in principle. Even if registered, it needs to be analysed with caution due to ambiguity of definitions.
The disaster data not directly associated with natural hazards (e.g. traffic accident, marine accident, epidemic,
shark attack) were registered in the database but excluded for analysis in this report5.
The disaster loss database takes into account the different disaster types and registers a series of indicators to
classify impact such as:
- Damaged houses
- Destroyed houses
- Basic human loss (mortality, injured, affected).
The loss data were assigned monetary value by applying the methodology developed by UNISDR, which allows
comparison across countries6.
This effort benefited substantially from the hosting and technical guidance and contextualization of the following
entities in the five islands (Table 3).
4 The most well-known international disaster loss database called EM-DAT registers disasters for a minimum of 10 deaths (see http://www.emdat.be/criteria-and-definition). 5 Fire is included in the analysis, though. 6 For methodology of assigning monetary value to loss, see http://www.preventionweb.net/english/hyogo/gar/2013/en/gar-pdf/Annex_2.pdf

Table 3: Hosting agencies of national disaster loss database
Hosting Agency Other Cooperating Agencies
Madagascar Emergency Management and Prevention
Unit (CPGU - Cellule de Prévention et
Gestion des Urgences)
Ministry of Environment
Mauritius NDRRMC - Disaster Risk Reduction and
Management Centre
Meteorological Services
Seychelles Division of Risk and Disaster Management Ministry of Environment and Energy
Comoros Civil Protection Ministry of Environment
Zanzibar Department of Disaster Management Second Vice President’s Office
Source: UNISDR/IOC (2015a, 2015b, 2015c, 2015d, 2015e)
The data is open source, available at the following site:
http://www.desinventar.net/DesInventar
B. Disaster Loss in the IOC Region
Disaster Incidence
Table 4 portrays the compilation of data for the period 1980 to 2014 on hazard events for the five entities in the
Indian Ocean studied in this project. While 3,235 data cards were registered for GAR Universe (standardized data
excluding man-made disasters and epidemics), the vast majority of registered hazards were categorized as
“extensive” for all countries; overall this represents 97% of registered events in the region.
Table 4: Hazard events in the IOC (1980-2011)
Data Cards
Total Number
Extensive Events
Number (%)
Intensive Events Number
Madagascar 1,378 1,298 (94%) 80
Mauritius 1,105 1,104 (99%) 1
Seychelles 636 636 (100%) 0
Comoros 105 104 (99%) 1
Zanzibar 10 10 (100%) o
REGION 3,235 3,152 (97%) 82
Source: Author, based on National Disaster Loss Database.
Disaster Loss
Loss of lives due to the 3,235 registered events totals 1,635 (see Table 5). Over 85% of these deaths occurred in
Madagascar (N=1,399). About half of the lives lost due to natural hazards were lost during intensive events.

Table 5: Mortality due to disasters in the IOC
Deaths Incurred
(% in IO region)
Deaths due to Intensive Events
(% of total events)
Madagascar 1,399 (89%) 785 (56%)
Mauritius 127 (8%) 1 (1%)
Seychelles 7 (0.4%) No intensive events
Comoros 34 (2%) No data
Zanzibar 1 (0.06%) 0
TOTAL 5 Islands 1,635 786
Source: Author based on National Disaster Loss Database.
In terms of physical loss, the full set of events registered in the Indian Ocean totalled USD 17.2 billion at 2013
prices (see Figure 7Error! Reference source not found.). The most costly events in the region are intensive
cyclones (contributing 88% of the loss) and extensive cyclones (an additional 8%). Fires (forest and others) are the
second most costly types of hazards in the region.
Figure 7: Total Economic Loss (infrastructure and agriculture)
Source: Author based on National Disaster Loss Database.
A closer look at extensive events alone (Figure 8), further emphasizes the destructive role that fires play in the
region as well as heavy rains, despite the much lower overall loss (USD 2.2 billion).

Figure 8: Economic Loss due to extensive events (infrastructure and agriculture)
Source: Author based on National Disaster Loss Database.
Economic loss by country is as follows (Table 6). Madagascar DRR policy should mainly focus on cyclones because
93% of economic loss is due to cyclones. The target of Mauritius DRR policy should be also cyclones, which
contribute to 82% of total economic loss. In Seychelles, floods and landslides are considered major natural hazards.
Flooding, especially in the coastal zones where 80% of settlement and business infrastructures are accumulated,
would have significant direct and indirect loss. Comoros has been suffered mainly from cyclones and floods. In
Zanzibar, though past loss dais not still sufficiently recorded, the UNISDR/IOC (2015e) reports the disaster events
are mainly related to rainfall causing droughts and floods.
Table 6: Economic loss by country
TOTAL Intensive
(cyclone)
Extensive
(cyclone)
Flood Fire Others
Madagascar 8,838,785,661 85% 8% - 5% 2%
Mauritius 59,062,996 37% 45% 5% 3% 10%
Seychelles 15,593,630 - - 50% - 50%
Comoros 9,800,000 58% 35% 7%
Zanzibar 1,286,745 - - 88% - 12%
Note: Others in Seychelles include tsunami, landslide, rain and storm (15%, 13%, 10%, 10% each). Union des Comoros is an approximate figure. Source: Author based on National Disaster Loss Database.

4. Disaster Risk
A. Overview
Component 2 of this initiative aimed to build a database for probabilistic risk assessment. UNISDR facilitated the
identification and consolidation of a national focal point for disaster risk information and enhanced the
understanding of risk concepts and risk assessing methodologies through capacity building workshops
Probabilistic risk assessment differs from a “deterministic” risk assessment in that it attributes a probability to
hazardous events. Probability indicates the likelihood of the event to occur during a given year; it is estimated using
frequency and is expressed in terms of “return period” or “loss exceedance rate”. Risk is expressed as a
combination of the probability of the event occurring and the expected loss when such an event occurs.
In probabilistic risk assessment, risk is composed of three factors: hazard, exposure and vulnerability (Figure 9).
Hazard data are basically calculated from a set of stochastic scenarios and in this initiative the data were extracted
from global datasets7. Exposure data measures the degree at which people and assets will be at risk when a
hazard hits, and often consists of inventories of buildings, population and infrastructure. In this initiative, we used
a combination of global exposure databases and data compiled by national experts (processed to construct a
proxy). Vulnerability indicates the susceptibility of exposed population or assets to suffer damages and loss. This
is important because hazard affects exposed element in different ways. For example, a certain wind speed affects
a wooden house more heavily than a concrete building. In other words, vulnerability data show the relationship
between hazard intensity and the expected values of damage. In this initiative, vulnerability data were also taken
from global data sets.
Figure 9: Key concepts of probabilistic risk assessment
Source: Author
7 Hazard, exposure and vulnerability data used for the risk assessment in Mauritius is outlined in INGENIAR (2014) and UNISDR/IOC (2014).
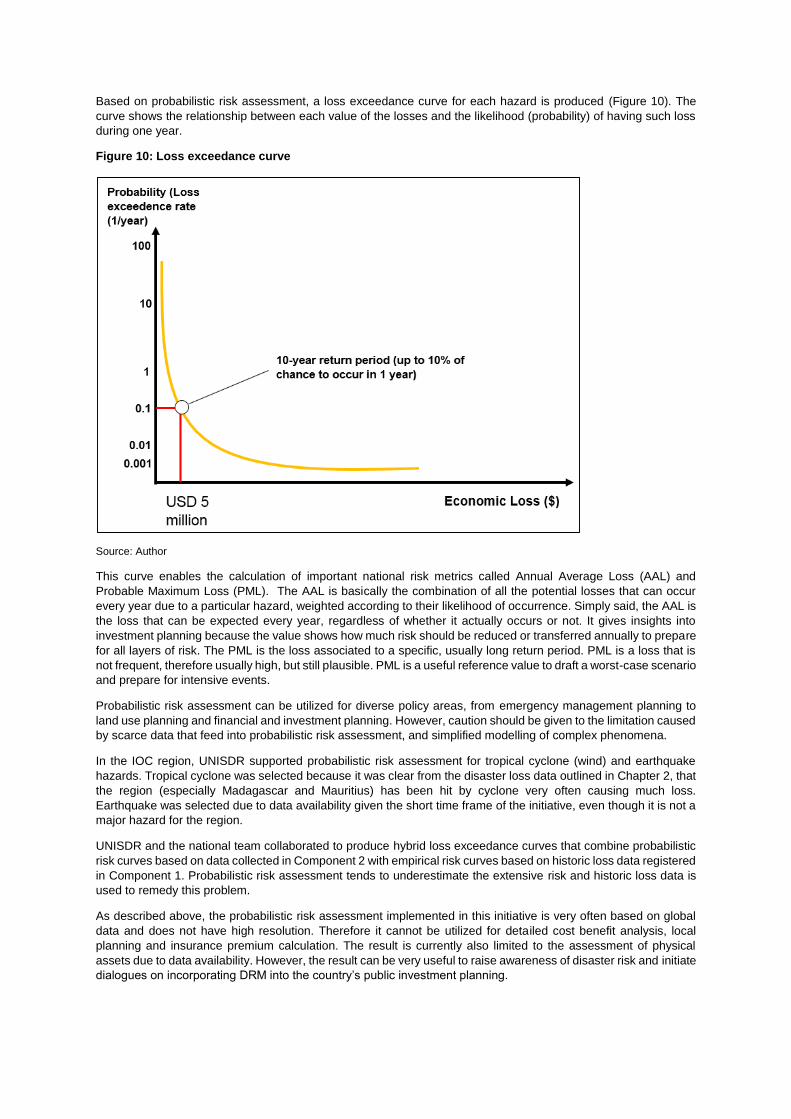
Based on probabilistic risk assessment, a loss exceedance curve for each hazard is produced (Figure 10). The
curve shows the relationship between each value of the losses and the likelihood (probability) of having such loss
during one year.
Figure 10: Loss exceedance curve
Source: Author
This curve enables the calculation of important national risk metrics called Annual Average Loss (AAL) and
Probable Maximum Loss (PML). The AAL is basically the combination of all the potential losses that can occur
every year due to a particular hazard, weighted according to their likelihood of occurrence. Simply said, the AAL is
the loss that can be expected every year, regardless of whether it actually occurs or not. It gives insights into
investment planning because the value shows how much risk should be reduced or transferred annually to prepare
for all layers of risk. The PML is the loss associated to a specific, usually long return period. PML is a loss that is
not frequent, therefore usually high, but still plausible. PML is a useful reference value to draft a worst-case scenario
and prepare for intensive events.
Probabilistic risk assessment can be utilized for diverse policy areas, from emergency management planning to
land use planning and financial and investment planning. However, caution should be given to the limitation caused
by scarce data that feed into probabilistic risk assessment, and simplified modelling of complex phenomena.
In the IOC region, UNISDR supported probabilistic risk assessment for tropical cyclone (wind) and earthquake
hazards. Tropical cyclone was selected because it was clear from the disaster loss data outlined in Chapter 2, that
the region (especially Madagascar and Mauritius) has been hit by cyclone very often causing much loss.
Earthquake was selected due to data availability given the short time frame of the initiative, even though it is not a
major hazard for the region.
UNISDR and the national team collaborated to produce hybrid loss exceedance curves that combine probabilistic
risk curves based on data collected in Component 2 with empirical risk curves based on historic loss data registered
in Component 1. Probabilistic risk assessment tends to underestimate the extensive risk and historic loss data is
used to remedy this problem.
As described above, the probabilistic risk assessment implemented in this initiative is very often based on global
data and does not have high resolution. Therefore it cannot be utilized for detailed cost benefit analysis, local
planning and insurance premium calculation. The result is currently also limited to the assessment of physical
assets due to data availability. However, the result can be very useful to raise awareness of disaster risk and initiate
dialogues on incorporating DRM into the country’s public investment planning.

The challenge is that the current historic loss databases have time series that are too short to produce high quality
risk assessments. Achieving more detailed risk assessments requires continuity on capacity building processes,
improvement of data/information and commitment of institutions, technical personnel and decision makers.
In the Indian Ocean, the hosting entities for this component of the project are portrayed in Table 7.
Table 7: Hosting agencies for probabilistic risk assessment.
Hosting entities for Disaster Risk (Component 2)
Madagascar Emergency Management and Prevention Unit (CPGU - Cellule de Prévention et Gestion
des Urgences)
Centre for Research and Development/University of Madagascar (Centre de recherche et
dévéloppement / Université de Madagascar)
Mauritius National Disaster Risk Reduction and Management Centre
Mauritius Meteorological Services
Seychelles Département de gestion de risque et catastrophe
Planning Department (Departement de planification)
Ministry of Land Use and Housing (Ministere de l’Utilisation des terres et logement)
Ministry of Environment
Communication, Information and Technology Department
Comoros Ministry of the Interior
Meteorological Service (Direction Générale de Météorologie, ANACEM)
Ministry of Finance and Budget (Ministère des Finances et du budget)
Union of Chamber of Trade, Industry and Agriculture of Comoros (Union des Chambres de
Commerce, d'Industrie et d'Agriculture des Comores (UCCIA))
Jurist Business Law (Jurisconsulte Droit des Affaires)
Zanzibar Office of Chief Government Statistics (OCGS)
Disaster Management Department (DMD)
Source: UNISDR/IOC (2015a, 2015b, 2015c, 2015d, 2015e)

B. Probabilistic Risk Assessment in the IOC Region
In the IOC region, UNISDR supported building of probabilistic risk assessment for tropical cyclonic wind
(Madagascar, Mauritius, Seychelles and Comoros) and earthquake (Madagascar, Seychelles, Union des
Comoroes and Zanzibar). Tropical cyclone was selected because it was clear from the disaster loss data that the
region (especially Madagascar and Mauritius) has been hit by cyclone very often causing much loss. Earthquake
was selected due to data availability given the short time frame of the initiative, even though it is not a major hazard
for the region.
Table 8 presents the regional summary of results: the AAL in absolute terms and relative to other values for both
hazards in the five islands. Total Absolute AAL for both hazards in the studied islands sums to USD 161.43 million
and constitutes an average of 3.65‰ of Exposed Assets, 3.7% Goss Fixed Capital Formation (GFCF) and 0.9% of
GDP. Tropical cyclone in Madagascar and Mauritius contributes to 99.6% of total AAL. AAL in Seychelles is
estimated to be zero for both hazards due to the location.
Table 8: Absolute and Relative AAL in the IOC
TROPICAL CYCLONIC WIND
Absolute AAL Wind (USD million)
Relative AAL Wind (‰ for Exposed Assets and % for GDCF and GDP)
Madagascar USD 73.39 2.90‰ 4.26% 1.21%
Mauritius USD 86.91 8.27‰ 4.40% 1.00%
Seychelles USD 0.00 0.00‰ 0.00% 0.00%
Comoros USD 0.16 0.20‰ 1.90‰ 0.40‰
EARTHQUAKE Absolute AAL Earthquake
(USD million)
Relative AAL Earthquake (‰ for Exposed Assets and % for GDCF and GDP)
Madagascar USD 0.56 0.02‰ 0.33‰ 0.09‰
Seychelles USD 0.00 0.00‰ 0.00% 0.00%
Comoros USD 0.21 0.03‰ 2.44‰ 0.47‰
Zanzibar USD 0.20 0.15‰ 1.39‰ 0.22‰
Source: UNISDR/IOC (2015a, 2015b, 2015c, 2015d, 2015e)
Table 9 and Table 10 portray the results of the PML for cyclonic winds and earthquakes, respectively. Regional
PML is estimated at USD 1465 million for wind and USD 2.29 million for earthquake in a 50-year return period,
increasing with longer return periods. Earthquake PML is relatively much smaller than the tropical cyclonic wind
PML. PML in Mauritius and Madagascar for tropical cyclonic winds are very high.
Table 9: PML for tropical cyclonic winds
CYCLONE PML Madagascar Mauritius Comoros
RETURN PERIOD 50 (USD million) (% of Exposed Assets) (% of Gross Fixed Capital Formation) (% of GDP)
USD 367.10 (1.4%)
(21.4%) (6.0%)
USD 1,094.00 (10.4%) (55.6%) (12.6%)
USD 2.61 (0.3%) (3.0%) (0.6%)
RETURN PERIOD 100 (USD million) (% of Exposed Assets) (% of Gross Fixed Capital Formation) (% of GDP)
USD 438.38 (1.7%)
(25.5%) (7.2%)
USD 1,726.00 (16.4%) (87.7%) (19.9%)
USD 3.13 (0.4%) (3.6%) (0.7%)
RETURN PERIOD 250 (USD million) (% of Exposed Assets) (% of Gross Fixed Capital Formation) (% of GDP)
USD 545.03 (2.1%)
(31.7%) (9.0%)
USD 2,288.00 (21.8%)
(116.3%) (26.4%)
USD 3.87 (0.5%) (4.5%) (0.9%)
RETURN PERIOD 500 (USD million) (% of Exposed Assets) (% of Gross Fixed Capital Formation) (% of GDP)
USD 583.36 (2.3%)
(33.9%) (9.6%)
USD 2,773.00 (26.4%)
(141.0%) (32.0%)
USD 4.52 (0.6%) (5.3%) (1.0%)

RETURN PERIOD 1000 (USD million) (% of Exposed Assets) (% of Gross Fixed Capital Formation) (% of GDP)
USD 650.34 (2.5%)
(37.8%) (10.7%)
USD 2,929.00 (27.9%)
(148.9%) (33.8%)
USD 5.05 (0.6%) (5.9%) (1.1%)
Source: UNISDR/IOC (2015a, 2015b, 2015d)
Table 10: PML for earthquake
EARTHQUAKE PML Madagascar Comoros Zanzibar
RETURN PERIOD 50 (USD million) (% of Exposed Assets) (% of Gross Fixed Capital Formation) (% of GDP)
USD 1.40 (0.01%) (0.08%) (0.02%)
USD 0.49 (0.06%) (0.57%) (0.11%)
USD 0.40 (0.03%) (0.28%) (0.04%)
RETURN PERIOD 100 (USD million) (% of Exposed Assets) (% of Gross Fixed Capital Formation) (% of GDP)
USD 3.74 (0.01%) (0.22%) (0.06%)
USD 1.25 (0.15%) (1.45%) (0.28%)
USD 1.00 (0.08%) (0.69%) (0.11%)
RETURN PERIOD 250 (USD million) (% of Exposed Assets) (% of Gross Fixed Capital Formation) (% of GDP)
USD 14.68 (0.06%) (0.85%) (0.24%)
USD 5.70 (0.71%) (6.63%) (1.27%)
USD 4.00 (0.30%) (2.78%) (0.45%)
RETURN PERIOD 500 (USD million) (% of Exposed Assets) (% of Gross Fixed Capital Formation) (% of GDP)
USD 37.20 (0.15%) (2.16%) (0.61%)
USD 17.09 (2.12%)
(19.87%) (3.80%)
USD 12.50 (0.95%) (8.68%) (1.40%)
RETURN PERIOD 1000 (USD million) (% of Exposed Assets) (% of Gross Fixed Capital Formation) (% of GDP)
USD 83.06 (0.33%) (4.83%) (1.37%)
USD 42.07 (5.21%)
(48.92%) (9.35%)
USD 34.00 (2.58%)
(23.61%) (3.81%)
Source: UNISDR/IOC (2015a, 2015d, 2015e)
When we see the curve, different characteristics across countries surfaces: Regarding tropical cyclonic wind risk,
higher risk in Madagascar regarding law and mid risk layers while in intensive risk layer, Mauritius risk is higher
(Figure 11). Comoros needs to prepare for intensive risk for earthquake but have more needs to invest in DRR to
reduce extensive tropical cyclonic wind risk instead of earthquake (Figure 12). Careful look at loss exceedance
curve informs policy makers of the priority out of several hazards that the country faces.

Figure 11: Loss exceedance curve of SWIO region for tropical cyclonic winds
Note: Risk of Seychelles is estimated to zero. Assessment of Zanzibar was not implemented due to low risk.
Source: UNISDR
Figure 12: Loss exceedance curve of SWIO region for earthquake
Note: Risk of Seychelles is estimated to zero. Assessment of Mauritius was not implemented due to low risk.
Source: UNISDR

5. Regional DRM/DRR/CCA Framework
This chapter describes the regional structures and dynamics in place that can serve as a foundation for risk-
sensitive public investment and financing strategy across the Indian Ocean region.
A. Institutional Structures
In the IOC Region, there is no regional entity, or department/unit to date that is officially mandated to focus on
disaster risk reduction or disaster management. Examples of such a regional entity elsewhere include the
Caribbean Disaster Emergency Management Agency (CDEMA), headquartered in Barbados, or the Disaster Risk
Reduction Unit inside SADC. Such an entity has been proposed for the IOC region, with many different options to
consider (See Grunewald and Sallustro, 20148). It merits being reconsidered with a greater focus on DRR than on
response.
At the national level, all studied countries have created an entity mandated to manage risk with very different names
(see Table 11). While some of the countries (Madagascar and Mauritius) still have two entities, one with a primary
focus on DRR, before the event, and another filling above all the role of emergency management after an event,
Seychelles and Zanzibar have only one entity. All of the entities are now anchored at the highest levels of
government, such as Prime Minister’s Office or the Vice Presidency. This is a good sign that they can provide
compelling arguments in favour of risk reduction for key decision makers.
Table 11: Disaster risk Management agencies
Source: UNISDR/IOC (2015a, 2015b, 2015c, 2015d, 2015e)
B. Legal structures
There are numerous continental and regional entities in Africa that provide a wider perspective of strategic thought
and protection for DRM/DRR/CCA. The Africa Union established the “Disaster Risk Reduction for Sustainable
Development in Africa” as a regional strategy for Sub Saharan Africa. It aims to increase political commitment to
DRR; improve identification and assessment of disaster risks; enhance knowledge management for DRR; increase
public awareness of disaster risk reduction; improve governance of DRR institutions; and integrate DRR in
emergency response management. This strategy has also informed the sub-regional efforts made by African RECs
to strengthen their capacities in the area of DRR. One REC, the Southern Africa Development Commission
Secretariat (SADC, to which some IOC islands also belong) elaborated, in 2011, their “Disaster Risk Reduction
Strategy and Plan of Action, 2010 – 2015”. This strategy is a tool for the implementation of the SADC DRR Policy
framework among the 15 member states.
8 François Grunewald F. and Sallustro, J-L., 2014. Élaboration de procedures exceptionnelles en cas de crise dans les pays membres de la COI. URG; Référence projet: COI AO-PGRNC-2012-02.
Name of National Disaster Authority
Anchorage and
Date of creation
Mandate (DM, DRR or both)
Number of full-time
personnel
REGIONAL None
Madagascar National Council of DRM (CNGRC); National Office of DRM (BNGRC); Emergency Prevention and Management Agency (CPGU)
Min. Dom. Affairs; 2006
PM 2006
Mainly DM
Both
55
24
Mauritius National DRR and Management Centre (NDRRMC) National Emergency Operations Command (NEOC) within NDRRMC
PM, 2013
PM, 2013
Both
DM
1-8
Seychelles Division for Risk and Disaster Management (DRDM)
Vice Pres., 1999
Both 6
Comoros Directorate General of Civil Protection (DGSC)
2012 (COSEP
since 2007)
DM n.a.
Zanzibar Disaster Management Department (DMD)
2nd V.P., 2006
Both 22

The Mauritius Strategy (MS) for the ‘Further Implementation of the Barbados Programme of Action (BPoA) for the
Sustainable Development of Small Island Developing States (SIDS)’ was adopted by 129 countries and territories
in the conference held in Mauritius, January 2005. It addresses the unique development problems of SIDS and
sets out the basic principles and specific actions required to support sustainable development. In Section II of the
MS, all five IOC islands agreed to “strengthen their respective national frameworks for more effective disaster
management and … regional mechanisms as facilities to improve national disaster mitigation, preparedness and
early-warning capacity, increase public awareness about disaster reduction, stimulate interdisciplinary and
intersectoral partnerships, and the mainstreaming of risk management into the national planning process”; as well
as to “augment the capacity of SIDS to predict and respond to emergency situations, including those affecting
human settlements, stemming from natural and environmental disasters”.
The ISLANDS programme seeks to bridge these gaps through innovative pillars in: regional cooperation and
integration, SIDS-SIDS knowledge exchanges, and a methodology to deal with the large asymmetries between the
developmental stages of the beneficiary countries. One of the ISLANDS flagship programs is the “Capacities for
Risk Financing Mechanisms” in light of natural and climatic disasters, the effort guiding this study.
Countries that have a DRM, DRR or CCA strategy are delineated in Table 12 below. New momentum for DRR has
been emerging, for example, by Disaster Risk Management Act in Seychelles and Disaster Risk Reduction
Management Bill (in draft) in Mauritius.
Table 12: Instruments related to DRM/DRR or DM
Strategies, Policies
and Plans
Legislation
(Bills, Acts, etc.)
Madagascar National Strategy on Disaster Risk
Management (2003)
The Act no 2003-010 related with
National Strategy on Disaster Risk
Namangement
Mauritius Disaster Risk Reduction and
Management Strategic Framework and
Plan; Climate Change Adaptation Policy
(20 years)
Climate Change Adaptation Strategy and
Action Plan (1998)
Disaster Risk Reduction and
Management Bill, in draft;
Climate Change Bill, in draft
Seychelles National Risk and Disaster Management
Policy (2008, updated in 2014)
Climate Change Strategy (2009)
Disaster Risk Management Act,
2014
Comoros9 National Strategy for the Reduction of
Risk and Disasters (SNRRC, draft)
-
Zanzibar Disaster Management Policy (2011)
Emergency Preparedness and Response
Plan (2011)
Zanzibar Climate Change Strategy (2014)
Disaster Management Act, No.2
(2003, under review)
Source: UNISDR/IOC (2015a, 2015b, 2015c, 2015d, 2015e)
9 A recent study guided by IOC (AFD, 2014: Renforcement des politiques publiques et appui aux structures nationales…dans les pays membres de la COI) states that the Law on environmental protection, 1995, could be the basis upon which to develop a legislative position on DRM in Comoros.

C. Status of Hyogo Framework for Action
Based on the HFA Monitor data, the overall status of the HFA priorities among the five islands varies from 1.86 in
Comoros to 3.68 in Mauritius, all indicators averaged (Table 13). Priority 1, “Ensuring that DRR is a national and
local priority with a strong institutional basis” demonstrates the most progress, with an average of 3.25 across the
region (it is among the two highest for three countries: Madagascar, Mauritius and Seychelles). Priority 4 “Reducing
the underlying factors of risk” is the area needing the most support, especially for Madagascar and Comoros. Risk
sensitive public Investment planning is the most related with Priority Action 4 (e.g. HFA Core Indicator 4.6) and
needs more efforts according to the country’s self-assessment reports.
Table 13: Hyogo Framework for Action progress reported by IOC countries
Note: The figures for Zanzibar use those for the United Republic of Tanzania, as Zanzibar does not report to the HFA Monitor independently. The Tanzanian figures may not be a true reflection of capacity in Zanzibar. Source: Author, Compiled from UNISDR’s HFA Monitor, self-reported progress on most recent submission (year varies)
(Best rating is
‘5’) Priority Action
1: Ensure that
DRR is a
national and
local priority
with a strong
institutional
basis
Priority
Action 2:
Identify,
assess and
monitor
disaster
risks and
enhance
early
warning
Priority Action
3: Use
knowledge,
innovation and
education to
build a culture
of safety and
resilience
Priority
Action 4:
Reduce the
underlying
risk factors
Priority Action
5: Strengthen
disaster
preparedness
for effective
response at all
levels
Average
of all
Scores
REGIONAL
AVG 3.35 3.30 2.95 2.90 3.20 3.12
Madagascar 3.75 3.50 3.75 2.67 3.50 3.36
Mauritius 4.00 3.50 3.50 3.67 3.75 3.68
Seychelles 4.00 4.00 2.00 3.33 3.75 3.41
Comoros 1.75 2.50 2.25 1.50 1.50 1.86
Zanzibar 3.25 3.00 3.25 3.33 3.50 3.27

6. DRR/DRM/CCA in Public Investment Planning
A. Current Status of Risk-Sensitive Public Investment
Risk-sensitive public investment is not an integral part of fiscal policy and practice in the region. Disaster risks are
not addressed explicitly in most of the Indian Ocean countries. However, there have been many efforts to recognize
risk (see Box 2 as good practice Box for Mauritius EIA guidelines and Seychelles and Zanzibar legal/policy progress
toward strengthened risk sensitive investment). Key government stakeholders in each country that would eventually
be implicated in risk-sensitive public investment are described in Table 14.
Table 14: Key government stakeholders identified in each country
Source: UNISDR/IOC (2015a, 2015b, 2015c, 2015d, 2015e)
Key Government Stakeholders for DRR Investment
Identified in each country
Madagascar Prime Minister’s Office (CPGU), Ministry of Agriculture, Ministry of Finance and Budget
the Ministry of Domestic Affairs (BNGRC), Ministry of Public Works, Ministry of
Transport, Ministry of Health, Ministry of the Interior, Ministry of Education
Mauritius Prime Minister’s Office, NDRRMC, Ministry of Health, Police and Coast Guard, Fire
Services, Meteorological Services, Local Government, Ministry of Public Infrastructure
(Roads & Drainage) and Ministry of Public Utilities (Water and Electricity)
Seychelles Ministry of Finance, Ministry of Environment and Energy, Ministry of Health, Ministry of
Land Use and Habitat (Planning), Land Transport Division, Ministry of Youth, Sports
and Community Development, Chamber of Commerce and Industry, Meteorology and
Climate Change Division, Division of Risk and Disaster Management, Public Utilities
Corporation (PUC), Police and Fire Services
Comoros Directorate General of Budget, General Planning Commission (CGP),
Ministry of the Interior, Ministry of Foreign Affairs, Directorate General of Civil
Protection (DGSC), Technical Directorate of Meteorology (DTM and ANACM),
Volcanological Observatory of Karthala, Regional Directorates of Civil Defense (Grand
Comore - Anjouan and Moheli), National Directorate of Health (DNS)
Zanzibar Disaster Management Department, Ministry of Finance and Planning Commission,
Line ministries (health, natural resources, infrastructure, etc.)
Disaster response agencies: police, coast guard, fire services, local government
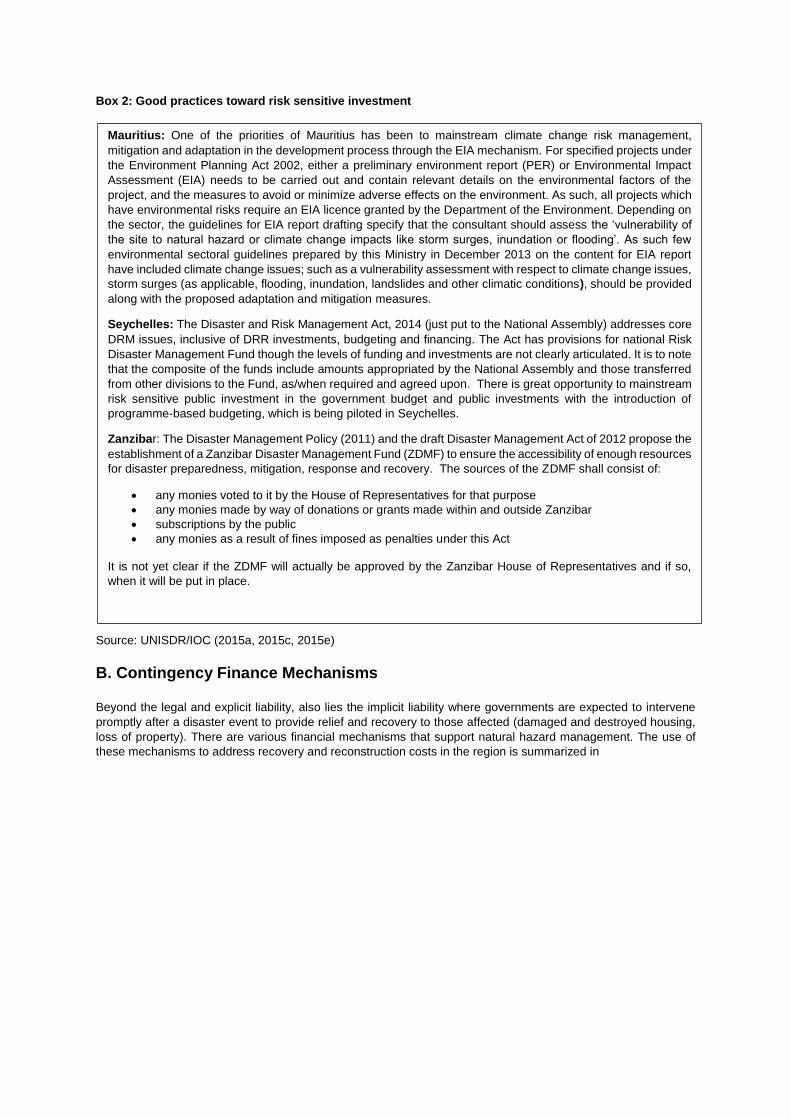
Box 2: Good practices toward risk sensitive investment
Source: UNISDR/IOC (2015a, 2015c, 2015e)
B. Contingency Finance Mechanisms
Beyond the legal and explicit liability, also lies the implicit liability where governments are expected to intervene
promptly after a disaster event to provide relief and recovery to those affected (damaged and destroyed housing,
loss of property). There are various financial mechanisms that support natural hazard management. The use of
these mechanisms to address recovery and reconstruction costs in the region is summarized in
Mauritius: One of the priorities of Mauritius has been to mainstream climate change risk management,
mitigation and adaptation in the development process through the EIA mechanism. For specified projects under
the Environment Planning Act 2002, either a preliminary environment report (PER) or Environmental Impact
Assessment (EIA) needs to be carried out and contain relevant details on the environmental factors of the
project, and the measures to avoid or minimize adverse effects on the environment. As such, all projects which
have environmental risks require an EIA licence granted by the Department of the Environment. Depending on
the sector, the guidelines for EIA report drafting specify that the consultant should assess the ‘vulnerability of
the site to natural hazard or climate change impacts like storm surges, inundation or flooding’. As such few
environmental sectoral guidelines prepared by this Ministry in December 2013 on the content for EIA report
have included climate change issues; such as a vulnerability assessment with respect to climate change issues,
storm surges (as applicable, flooding, inundation, landslides and other climatic conditions), should be provided
along with the proposed adaptation and mitigation measures.
Seychelles: The Disaster and Risk Management Act, 2014 (just put to the National Assembly) addresses core
DRM issues, inclusive of DRR investments, budgeting and financing. The Act has provisions for national Risk
Disaster Management Fund though the levels of funding and investments are not clearly articulated. It is to note
that the composite of the funds include amounts appropriated by the National Assembly and those transferred
from other divisions to the Fund, as/when required and agreed upon. There is great opportunity to mainstream
risk sensitive public investment in the government budget and public investments with the introduction of
programme-based budgeting, which is being piloted in Seychelles.
Zanzibar: The Disaster Management Policy (2011) and the draft Disaster Management Act of 2012 propose the
establishment of a Zanzibar Disaster Management Fund (ZDMF) to ensure the accessibility of enough resources
for disaster preparedness, mitigation, response and recovery. The sources of the ZDMF shall consist of:
any monies voted to it by the House of Representatives for that purpose
any monies made by way of donations or grants made within and outside Zanzibar
subscriptions by the public
any monies as a result of fines imposed as penalties under this Act
It is not yet clear if the ZDMF will actually be approved by the Zanzibar House of Representatives and if so,
when it will be put in place.

Table 15 Out of the four ex-ante mechanisms, there are live examples in the region for each one. Contingency
Funds are established in four islands. However reality check clarifies the limitation. For example, the contingency
funds in Madagascar is deplete and needs additional funding to support the scheme. All islands have some
experience with insurance, though the use level differs different across countries (see Box 3, explaining Mauritius
insurance as good practice).
Five of the seven ex-post mechanisms are currently employed in the region. While Madagascar and Zanzibar
commonly accept international assistance, they also cast ‘diverting funds from another budget’ as a mechanism
employed, even if Mauritius and Seychelles deems this possible. A credit from the Central Bank and borrowing by
issuing domestic bonds is used in Zanzibar, and is deemed possible by the other islands. Madagascar can also
borrow from multi-lateral institutions, which is possible in the other islands. The report of each country highlights
that countries are struggling with accessing sufficient money to finance disaster management and combining
several tools with diversion from other budget items as main financing sources.
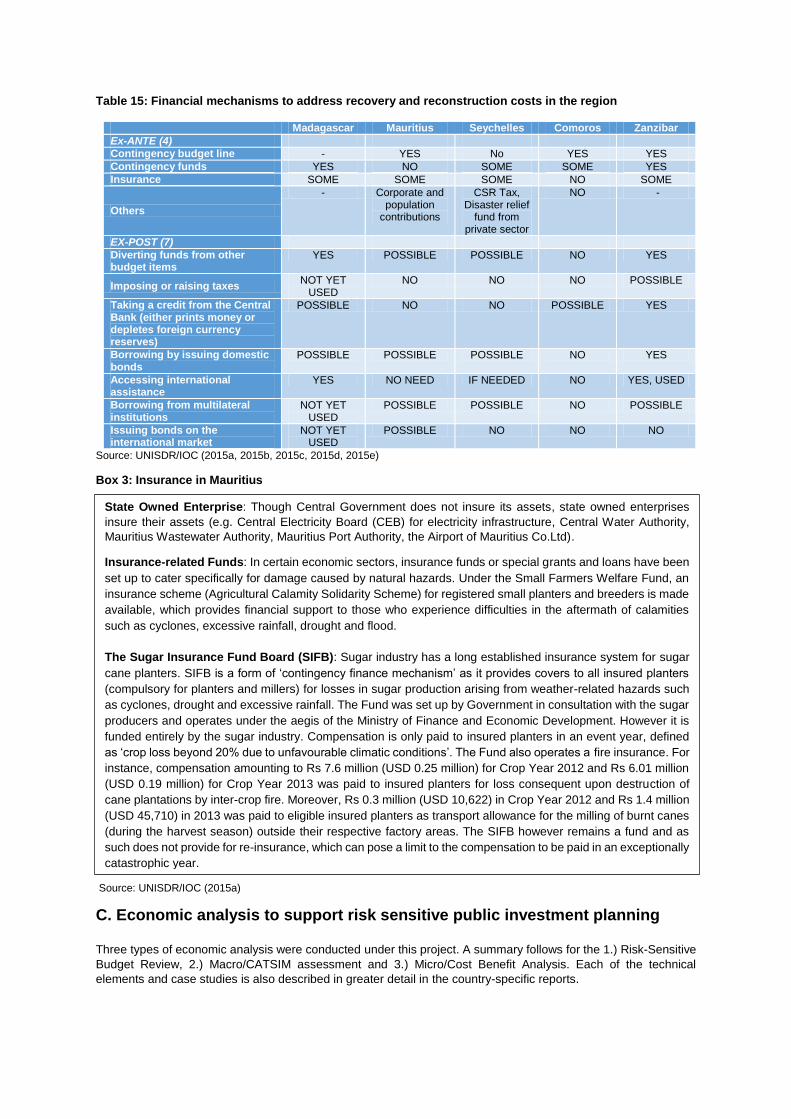
Table 15: Financial mechanisms to address recovery and reconstruction costs in the region
Madagascar Mauritius Seychelles Comoros Zanzibar
Ex-ANTE (4)
Contingency budget line - YES No YES YES
Contingency funds YES NO SOME SOME YES
Insurance SOME SOME SOME NO SOME
Others
- Corporate and population
contributions
CSR Tax, Disaster relief
fund from private sector
NO -
EX-POST (7)
Diverting funds from other budget items
YES POSSIBLE POSSIBLE NO YES
Imposing or raising taxes NOT YET
USED NO NO NO POSSIBLE
Taking a credit from the Central Bank (either prints money or depletes foreign currency reserves)
POSSIBLE NO NO POSSIBLE YES
Borrowing by issuing domestic bonds
POSSIBLE POSSIBLE POSSIBLE NO YES
Accessing international assistance
YES NO NEED IF NEEDED NO YES, USED
Borrowing from multilateral institutions
NOT YET USED
POSSIBLE POSSIBLE NO POSSIBLE
Issuing bonds on the international market
NOT YET USED
POSSIBLE NO NO NO
Source: UNISDR/IOC (2015a, 2015b, 2015c, 2015d, 2015e)
Box 3: Insurance in Mauritius
Source: UNISDR/IOC (2015a)
C. Economic analysis to support risk sensitive public investment planning
Three types of economic analysis were conducted under this project. A summary follows for the 1.) Risk-Sensitive
Budget Review, 2.) Macro/CATSIM assessment and 3.) Micro/Cost Benefit Analysis. Each of the technical
elements and case studies is also described in greater detail in the country-specific reports.
State Owned Enterprise: Though Central Government does not insure its assets, state owned enterprises
insure their assets (e.g. Central Electricity Board (CEB) for electricity infrastructure, Central Water Authority,
Mauritius Wastewater Authority, Mauritius Port Authority, the Airport of Mauritius Co.Ltd).
Insurance-related Funds: In certain economic sectors, insurance funds or special grants and loans have been
set up to cater specifically for damage caused by natural hazards. Under the Small Farmers Welfare Fund, an
insurance scheme (Agricultural Calamity Solidarity Scheme) for registered small planters and breeders is made
available, which provides financial support to those who experience difficulties in the aftermath of calamities
such as cyclones, excessive rainfall, drought and flood.
The Sugar Insurance Fund Board (SIFB): Sugar industry has a long established insurance system for sugar
cane planters. SIFB is a form of ‘contingency finance mechanism’ as it provides covers to all insured planters
(compulsory for planters and millers) for losses in sugar production arising from weather-related hazards such
as cyclones, drought and excessive rainfall. The Fund was set up by Government in consultation with the sugar
producers and operates under the aegis of the Ministry of Finance and Economic Development. However it is
funded entirely by the sugar industry. Compensation is only paid to insured planters in an event year, defined
as ‘crop loss beyond 20% due to unfavourable climatic conditions’. The Fund also operates a fire insurance. For
instance, compensation amounting to Rs 7.6 million (USD 0.25 million) for Crop Year 2012 and Rs 6.01 million
(USD 0.19 million) for Crop Year 2013 was paid to insured planters for loss consequent upon destruction of
cane plantations by inter-crop fire. Moreover, Rs 0.3 million (USD 10,622) in Crop Year 2012 and Rs 1.4 million
(USD 45,710) in 2013 was paid to eligible insured planters as transport allowance for the milling of burnt canes
(during the harvest season) outside their respective factory areas. The SIFB however remains a fund and as
such does not provide for re-insurance, which can pose a limit to the compensation to be paid in an exceptionally
catastrophic year.

C.1. Summary of the Risk-Sensitive Budget Review (RSBR)
The Risk-Sensitive Budget Review (RSBR), applying a “DRM Marker” aims to identify the degree to which
Government has budgeted or/and invested in Disaster Risk Reduction and Management implicitly or explicitly. To
that effect, the budgets of key Ministries and Departments have been scrutinized to mark both those projects whose
“significant” (but not main) objective is DRR and those projects specifically addressing DRR that would not have
been undertaken without the “principal” DRM objective.
A Risk Sensitive Budget Review (RSBR) is a simple systematic quantitative analysis of a budget (or series of
budgets) that enables parties to estimate and take credit for investment in risk management and risk reduction (see
thorough description of budget review methodology in Annex A of each National Report). If the RSBR is conducted
by a national government, the findings typically track public investment. An RSBR conducted on a series of annual
budgets allows for the identification and tracking of temporal trends (i.e., increasing investment in risk reduction).
An RSBR that also categorizes components of risk management can point to trends in focus (i.e. increasing
investment in prevention and risk reduction, as opposed to repeatedly and/or only responding to disasters). In both
cases, the RSBR can convincingly monitor accountability (protecting the public) and make public investment more
efficient (investing in prevention is known to be a savings for response).
To that effect, the budgets of key Ministries and Departments were analysed to mark those efforts appearing in the
budgets whose “significant” (but not main) objective is DRR and those specifically addressing DRR, which would
not have been undertaken without the “principal” DRM objective. In addition to categorizing the budget/expenditure
for different projects, functions and administration activities as Significant or Principal, they were tagged, or
classified into four distinct categories of disaster risk management, namely, Risk Prevention/mitigation,
Preparedness, Response/Relief and Reconstruction.
Although the country analyses each employed the OECD-WB-UNISDR proposed DRM Marker method, readers
are cautioned to be prudent when comparing results across countries. This is because they were obliged to use
different years and numbers of years, different types of budgets (some included capital others only recurrent budget
for consumption; some drew on expenditure reports while others stuck to actual budgets), levels (some were able
to pull in devolved budgets and even donor funding) and sectors/ministries (while small countries may have
included every budget, larger countries chose seven to 13 different budgets as their focus for the exercise) and
hazards. Table 16 demonstrates the variety of different scopes that were selected for a national budget review from
the five IOC countries included in the present effort.
Table 16: Different scopes in budget review
Years
(Number:
Span)
Capital / Current
(Budgets/ Expenditures)
Coverage
(Number of
sectors,
ministries,
etc.)
Hazard
Focus
Madagascar 5 years:
2010-2014
Current (Budgets) 9 Cyclone, floods,
epidemics and locust
Mauritius
2 years:
2013, 2014
Both (Both) 9 Cyclone, heavy rains,
flood, landslide, drought,
fire, epidemics
Seychelles 3 years:
2012-2014
Both (Both) 17 Geological (e.g.
earthquake, tsunami),
meteorological (e.g.
Cyclone), hydrological
(e.g. flood, landslide),
epidemics and others
Comoros 4 years:
2011 to
2014
Both (Budgets) 7 n.a.

Zanzibar 1 year:
2014/15
Both (Budgets) 11 Fires, drought,
epidemics (human and
animal), climate change
Source: UNISDR/IOC (2015a, 2015b, 2015c, 2015d, 2015e)
The five IOC islands implemented their first ever risk-sensitive budget review in 2014, under the supervision of this
project. The results, although preliminary, are an exciting first glance at possible levels of investment (and gaps) in
risk reduction over the recent years. Across the region, DRM-marked investments ranged from 2 to 7% of the
studied national budgets (Table 17). According to this analysis, the greatest proportion of investment in DRR to
date occurs in Mauritius.
While two countries marked a greater proportion as “Significant”, the others marked more as “Principle”. Significant
markings are considered potential signs of mainstreaming, as those investments are not pinned to specific DRR
projects (or designed as such). In this respect, mainstreaming of DRR concepts would appear to be more
thoroughly underway in and Seychelles and Zanzibar.
Table 17: DRM marked investments
Proportion of studied
budgets “marked” for
DRM
Principal
(“2”)
(USD million)
Significant
(“1”)
(USD million)
Total
“Marked”
(USD million)
Total “Marked” /
total budget (%)
(% of total studied)
Madagascar (Sum:
2010-2014)
120.7 10.4 131 1.87%
(of USD 7.03 billion)
Mauritius (Sum: 2013
and 2014)
333 256 588 7%
(of USD 8.4 billion)
Seychelles (Average of
2012 - 2014)
3.3 13.2 16.5 3.75%
(of USD 440 million)
Comoros (Average of
2011-2014)
3.81 0.39 4.2 7%
Zanzibar (2014/2015, 1
year)
2.56 10.60 13.2 3%
(of USD 440 million)
Source: UNISDR/IOC (2015a, 2015b, 2015c, 2015d, 2015e)
In terms of tagging components of Risk Management (See Table 18), the overall trend points to a greater
investment in preventive / mitigation action for Mauritius, Seychelles and Zanzibar. In Madagascar and Comoros,
the greatest current investment is in response. A closer look at how this has evolved in the IOC region through the
years would shed more light on whether or not it is a real trend, driven by rising awareness levels.

Table 18: Tagging by component of risk management (% of total DRM investment)
Prevention/
Mitigation
Preparedness Response Recovery/
Reconstruction
Madagascar 13.7% 34.9% 47.7% 3.7%
Mauritius 74.3% 22.4% 0.1% 3.2%
Seychelles 62.6% 27.4% 9.4% 0.6%
Comoros 33.0% 2.0% 65.0% 0.0%
Zanzibar 80.0% 5.0% 15.0% 0.0%
Source: UNISDR/IOC (2015a, 2015b, 2015c, 2015d, 2015e)
As promising additional analysis, Zanzibar divided marked budget between DRM and CCA objectives. The analysis
shows that 43% of the identified budgets are DRM related and these are in particular for activities implemented
through the Ministry of Health. The balance of 57% has been classified as CCA-related, mainly in the agricultural
and environment sectors such as for agricultural research and irrigation development.
The gap analysis (Table 19) was conducted in this effort more to demonstrate utility and to become familiar with
the process than to produce concrete results. To be credible, a gap analysis needs to compare both observed
historic loss and estimated Average Annual Loss (AAL) to estimated current investment in DRR focused on the
same set of hazards. It is not useful, for example, to compare the AAL for earthquakes to a budget review focused
only on flooding and storms. Nonetheless, the regional results of the gap analysis described below--to be explored
with caution, can inform a healthy debate. Table 19 uncovers a gap in DRR investment for example, in Madagascar.
The results should not be interpreted, however, to signify that “enough is already being done” in the other islands.
Table 19: Gap Analysis
A. Annual Loss
(Multi-hazard,
total: 1980-2013)
(USD Million)
B. AAL
(Quake and/or
Wind)
(USD Million)
C. Current Annual
Investment in DRR/DRM
(USD Million)
Gap
(If C<A or
C<B
gap)
Madagascar 260
(8,839)
75 (both) 26.2
(2010-2014 average)
Both
Mauritius
4.5
(59)
87
(wind only)
294
(2013-2014 average)
Neither
Seychelles 1.2
(15.6)
0 (both) 15.6
(2012-14 average)
Neither
Comoros 0.29
(9.8)
0.37
(both)
4.2
(2011-14 average)
Neither
Zanzibar 0.04
(1.3)
0.2
(quake only)
13.2
(2014/15)
Neither
Source: UNISDR/IOC (2015a, 2015b, 2015c, 2015d, 2015e)
The Ministries of Finance involved in the above analyses are convinced that the exercise can serve as a useful
tool to both become more effective in spending (in the face of evolving risk profiles) and to demonstrate

accountability to their respective publics and/or donors. Furthermore, it was proposed that such an exercise, not
requiring a huge investment in time/effort and could be readily contracted to an agent each year, under the careful
supervision of the NDMA and Min. Finance. Another solution would be to develop a roving team at the regional
level that could lend capacity each year at a given time to the national stakeholders for a renewed analysis.
C.2. Macro-economic analysis: CATSIM
Generally regarded as the ‘insurer of last resort,’ national governments assume primary responsibility in providing
response, recovery and reconstruction resources in times of disasters (Mechler, 2004). Governments play an
important role in the post-disaster period, conducting timely and accurate damage assessment, devising
rehabilitation plans, and financing and executing rehabilitation projects. Reconstruction is often very costly.
Appropriate assessment of existing risk and contingency liability and reducing risk as much as feasible before
events occur is therefore of paramount importance for government’s strategic decision-making, planning and
resource allocation.
To respond to such needs in 2006, International Institute for Applied Systems Analysis (IIASA) invented the
CATSIM (Catastrophe Simulation), an interactive simulation tool to build capacity of policy makers to estimate and
reduce public sector financial vulnerability. Annex B of the national reports describes a recent application of
CATSIM in each island; the National Reports of each country also hold much greater detail and figures specific to
each country-level analysis.
Building on the results for loss and risk, the main findings specific to CATSIM analysis are as follows:
Fiscal resources available for reconstruction and recovery (excluding international aid) under an optimistic
assumption are portrayed in Table 20. In each country, fiscal resources available for reconstruction and
recovery include, for example, those drawn from budget diversion, domestic credit, IMF and international
borrowing. Uncertainty regarding fiscal resources availability is high and these numbers should be
interpreted with caution as locally specific economic and policy considerations could significantly limit the
use of these resources. Same assumptions were applied for all islands.
Fiscal resources gap years were estimated – the return period at which each government will face difficulty
in raising sufficient funds for reconstruction. The gaps for the IOC islands were between 24 and 329 years
(see Table 20). Zanzibar was identified as having no fiscal resource gap for earthquake risk.
Table 20: CATSIM Analysis (for tropical cyclone and earthquake)
AAL
(own estimate)
Financial resources
available (USD Million)
Fiscal Resources Gap Year
Madagascar 58 158 24
Mauritius 58 278 62 to 87
Seychelles 0.59 34 102 to 329
Comoros 1.07 11 56 to 77
Zanzibar
(earthquake
only)
0.18 85 None identified
Source: UNISDR/IOC (2015a, 2015b, 2015c, 2015d, 2015e)
Based on these findings, the IOC and the governments of the Indian Ocean are encouraged to take a ‘layered risk
management’ approach, in which resources are allocated based on the varying levels of risk facing each country,
with a priority given to reducing existing risk and preventing the creation of new risks in the extensive risk layer
(Figure 13). Drawing from the current CATSIM analysis, because of their high volume of extensive risk and their
low fiscal gap years, it would be more beneficial and effective for Madagascar and Comoros to focus on risk
reduction efforts. Due to different exposure profiles and resources, Mauritius and Seychelles should also start to
explore risk-financing mechanisms.

Figure 13: Fiscal gap and risk management strategies based on ‘risk layering approach’
Source: Author based on UNISDR/IOC (2015a, 2015b, 2015c, 2015d, 2015e)
The present study identified data gaps and sources of uncertainty regarding fiscal risk assessment (see Box 4 for
the data challenges in Seychelles). The present studies did not fully account for indirect effects of disaster damage,
and further studies are needed to quantify and evaluate the indirect risks caused by disaster damage.
Box 4: Insufficient risk information limits credibility of fiscal risk assessment’: Case of Seychelles
Source: UNISDR/IOC (2015c)
It is also important to discuss and update fiscal resilience parameter and value at critical time, for example, when
administration changes or after disaster (see Box 5 for Madagascar experience in CATSIM 2012 and 2014).
Contingency financing mechanism for disaster management should be checked regularly. Defining government
liability more concretely is also recommended.
Zanzibar: No Gap Year
Seychelles: 102-329
years
Mauritius: 62-87 years
Comoros: 56-77 years
Madagascar: 23-24
years
This study evaluated fiscal resources gap using both the current CAPRA estimates and statistical estimates
available from Hochrainer-Stigler et al. (2014) (Error! Reference source not found.). In general, the estimates
ased on CAPRA GIS shows lower loss estimates than those from Hochrainer-Stigler et al. (2014). In particular,
the aggregate risk of Seychelles appears small relative to the previous estimate, and also to the empirical
observations: in 2013 there was a storm event that results in estimated USD 9.3 million in damage; in 2004
there was an earthquake that resulted in USD 30 million in damage; and in 1997 there was a flood event that
resulted in USD 1.7 million in damage (EM-DAT 2014). Based on the current CAPRA estimate, this 2013 storm
would have a return period of approximately 200 years, while the 2004 earthquake would have a return period
of 300 years and 1997 flood 140 years. The probability that such rare events happen three times in the past 17
years is very small, suggesting that the CAPRA estimates may be significantly underestimating the existing risk
of Seychelles. A large discrepancy in risk information highlights further validation is advisable.

Box 5: Madagascar CATSIM simulation in 2012 and 2014
Source: UNISDR/IOC (2015b)
C.3. Micro-economics: Cost Benefit Analysis
Cost benefit analysis (CBA) is an established tool in economics. This analysis can be used for both sectorial and
project analysis. Many countries already adopt cost benefit analysis as a requirement prior to large-scale public
investment projects. In this initiative, probabilistic CBA was applied to account for the benefits of risk reduction (Box
x for probabilistic CBA workshop in Madagascar). Forward-looking CBA was applied for Madagascar and Mauritius
based on the risk data developed in Component 1 and backward-looking CBA based on past loss data was applied
for Seychelles, Comoros and Zanzibar. The benefit is estimated by measuring how much annual average loss
(AAL) will be reduced after the investment, thereby determining if the result is cost efficient or inefficient.
Results from the exercise in the IOC (Table 21) determined that, in the case of Madagascar, Mauritius and
Seychelles, the scenarios were judged to be cost-efficient while the cases of Comoros and Zanzibar was cost-
inefficient. The lack of documentation regarding past disaster damage and losses seems to lead to underestimation
of probabilistic benefit in the latter cases (see Box 7 for Zanzibar case).
Box 6: Probabilistic CBA workshop in Madagascar
Based on the current study, the fiscal resources gap is estimated at 24 years while 2012 study shows 23 years.
The relatively close figures estimated for fiscal gaps in 2012 and this study is explained partly by the fact that
assets and disaster related information collected in 2012 was used as inputs for risk analysis in Component 2.
However, the breakdown of funding sources is markedly different, especially with regards to the access to
domestic credit and international lending. This difference is due to the fact that the current estimate of fiscal
parameters is made based on standard assumptions applied in the global assessment (Hochrainer-Stigler et
al. 2014). Therefore, further validation of fiscal parameters through national workshops and interviews with
national stakeholders will be necessary.
The fiscal parameters must have been changed because of political change and especially a reserve fund has
been discontinued and deplete in recent years, where the government faces a practical issue regarding how
the account created in the name of a former administration can be transferred to the current one.
Also, it is important to point out that the use of economic risk assessment has not been sustained in
Madagascar. Economic risk assessments are hence conducted on ad-hoc bases, i.e. only when donor-
supported project funding becomes available for this type of effort. There is therefore a need to create a more
sustainable system of iterative fiscal and economic risk assessment embedded in the existing domestic
institutional framework. A further assessment of capacity and institutional needs as well as development of
appropriate risk assessment tools and training materials that cater to the operational needs of government
decision-making should be conducted.
In 29 January 2015, in response to request from Government of Madagascar, UNISDR/IIASA implemented
capacity building workshop for probabilistic cost benefit analysis. Participants were more than 30 government
officials from Ministry of Finance and Budget, Emergency Prevention and Management Agency (CPGU),
Ministry of Public Works, Ministry of Agriculture and many other critical ministries/agencies. Methodology for
backward-looking CBA was first presented and participants implemented simulation. The main objective was
that participants understand the basic method to calculate AAL by using statistical rule called Simpson rule,
and understand that difference of AAL before and after DRR investment can be the benefit of CBA. The analysis
is possible by using EXCEL spreadsheet. And then, forward-looking CBA was presented and participants were
asked to implement simulation using CAPRA model. The main objective is that they understand that DRR policy
can change the vulnerability curve and therefore AAL. UNISDR/IIASA saw the potential that future capacity
building workshop for probabilistic risk assessment can integrate a component of probabilistic CBA because it
clearly shows the participants how probabilistic risk assessment can be utilized to support public finance
planners and DRR practitioners.

Table 21: Cost Benefit Analysis
Scenario / Project
evaluated
Type of Analysis Benefit-Cost
Ratio at 5%
discount rate
Result
Madagascar Retrofitting housing
for tropical cyclonic wind
Probabilistic
(forward-looking)
1.26
(wood and
unreinforced
masonry)
Cost efficient
Mauritius
Retrofitting iron housing
for tropical cyclonic wind
Probabilistic
(forward-looking)
2.80 Cost efficient
Seychelles Flood alleviation
(Point La Rue)
Probabilistic
(backward-looking)
1.21 Cost efficient
Comoros Retrofitting housing for
tropical cyclonic wind
and flood
Probabilistic
(backward-looking)
0.32 Cost
inefficient
Zanzibar Urban surface
water drainage
Probabilistic
(backward-looking)
0.14 Cost
inefficient
Source: UNISDR/IOC (2015a, 2015b, 2015c, 2015d, 2015e)
Box 7: Insufficient loss data limits accuracy and credibility of CBA: Zanzibar CBA case
Source: UNISDR/IOC (2015e)
Based on these findings, the IOC and the governments of the Indian Ocean are encouraged to compile more
complete sets of damage and cost data that will refine future cost benefit analyses. They are also encouraged to
explore how to systematize the use of CBA in the hopes of making risk reduction a predominate characteristic of
public investment.
Based on limited data, the surface drainage project seems inefficient use of funds, given the negative NPV and
B/C ratios less than one, regardless of the discount rate or increase in exposed assets.
For estimating the AAL for Zanzibar, data only offered was one previous event, a 2005 flood. Given this event
and probability of first loss, a probable maximum loss curve was created.
Information revealed inconsistencies in the damages caused by the 2005 flood. In the data received and
analysed in this report, there were only 64 houses destroyed (IFRC 2005). Yet another source claim that “20,000
people” were affected in the 2005 flood event and still other source claims that 3,645 housings are affected
annually by flooding (questions for expert opinions, 2011). However, with no concrete data other than the 64
housings destroyed and the water sanitation recovery costs, it is difficult to obtain a rather accurate amount of
economic losses caused by the 2005 flooding in the region where the drainage system will be implemented.
Lack of any further detailed information on the economic losses as a result of the flood limits the robustness of
any attempt at accurately estimating the probabilistic losses caused by flooding or any other event. Without a
robust assessment of the losses caused by past hazardous events, estimations of the benefits of disaster risk
reduction investment will also be inaccurate.
In addition, the present assessment did not take into account many of the indirect and intangible losses that may
result due to natural disasters, such as business losses due to floods, additional medical cost associated with
morbidity and any reduction in land values that may result due to frequent inundation. These are clear limitations
of this current analysis and further studies are certainly needed to improve the accuracy and comprehensiveness
of our analysis.

7. Conclusions and Recommendations
Comparison of empirical observations of economic loss (1980-2013) related to registered disaster events and
projected risk estimates (AAL and PML) demonstrate considerable uncertainty. The main findings of the regional
loss and risk assessment are synthesized below:
The Indian Ocean Region has lost at least USD 17.2 billion in infrastructure and agricultural investments
since 1980 (at 2013 prices). It loses an average of USD 430 million each year to the registered natural
hazards, the greatest volume lost in Madagascar.
The projected combined Average Annual Loss (AAL) associated with two hazards (tropical cyclonic wind
and earthquake), however, is estimated in USD 161 million, or nearly 1% of the combined GDP for the
region (relative loss ranges from 0.02% of Zanzibar GDP to 1.2% Malagasy GDP each year). Beyond the
sheer number of hazards included in the risk estimates, other differences between registered losses and
AAL may be attributable to a combination of incomplete registered exposed assets and the uncertain
future impacts of climate change, etc.
Probable maximum losses for the 50-year return period (combining wind and earthquake) sum to USD
1.5 billion in the region, the greatest losses to be incurred in Mauritius (USD 1,094 million) followed by
Madagascar (USD 368 million).
Regardless of the level of loss, investing in DRM is already underway in the five IOC islands. Across the region,
DRM-marked investments found in national budgets over the past years ranged from 2 to 16% of total annual
budgets amounts. This amounts to a combined USD 457 million each year in the region, ranging from USD 288
million each year in Mauritius to USD 4.2 million in Comoros.
The overall trend points to a greater investment in preventive / mitigation action only for Mauritius, Seychelles and
Zanzibar. In Madagascar and Comoros, the greatest current investment is still in emergency response. Clearly,
DRR, the prevention and reduction of risk, merits greater investment now.
While at face value, comparing these figures to registered loss and AAL points to a gap (or need for greater
investment) only in Madagascar, the results should not be interpreted to signify that “enough is already being done”
in the other islands. In fact, there are strong indications that the real value of losses and risks is not currently
sufficiently captured and that the budget analysis may overcompensate for some efforts.
Through the present study, the IOC islands are now exposed to a suite of tools and a list of risk management
options to prepare them for an uncertain future. With more improved data, and enhanced in-house capacity, the
respective governments should be posed to choose which of those tools and options are best suited for their risk
profile (hazard events, exposure and loss, etc.). A risk-layered approach suggested by CATSIM analysis and cost
benefit analysis highlights how to choose more appropriate policies in DRR/DRM.
Further challenges: Data gaps, capacity training and awareness raising toward risk layered approach
During several meetings with representatives of the Ministries of Finance in the IOC region, it was established that
a scattered approach to DRM is inefficient and there is need for stronger collaboration between the DRM agency,
Ministry of Finance and other key sectoral ministries. Continuous capacity building on risk terminology and
concepts, loss and risk information management and economic analysis was recommended by Ministries of
Finance in the region. Institutional support for iterative management should be embedded in the existing DRR/CCA
policy framework of respective countries. This can begin only alongside a regularly refreshed regional awareness-
raising endeavour, highlighting risk-sensitive pubic investment.
The present study identified data gaps and sources of uncertainty regarding fiscal risk assessment. While the
CATSIM portion of the study assessed cyclone wind and earthquake risks only (except for Zanzibar where only
earthquake risk was evaluated), further analyses are certainly needed to include risks from additional hazards.
Also, a large discrepancy in risk data was identified for Seychelles, which requires further validation. Given the
relatively short period of data availability for these countries, high uncertainty can be expected of catastrophic risks
with return periods of above 500. It is advisable, therefore, to promote further data collection, registry and tracking,
validation and analyses performed in an iterative fashion to reduce this range of uncertainty. The present studies
also did not fully account for indirect effects of disaster damage; further studies are needed to quantify and evaluate
them.
The loss and risk information should be examined from the perspective of both DRM policy maker and financial
planners. Given the importance of public investment in DRR, continuous refinement of loss and risk information
should be promoted through regular dialogue with data users. In the process of economic analysis, Ministries of

Finance understood and appreciated the importance of loss and risk information. On some cases, they identified
several mistakes and inconsistencies in the records in disaster loss databases and the data were corrected. Such
exchanges of information will improve overall quality of knowledge management to support DRM decision making.
Technical and institutional support is necessary to establish iterative risk management system in the IOC countries.
In terms of technical needs, knowledge regarding probabilistic risk assessment (CAPRA) and economic
assessment tools (CATSIM) would be required along with general awareness of risk related concepts and statistics.
Given the limited availability of risk experts in each country, a regional approach may be appropriate. A pool of
trained resource persons at regional level whose main focus is not only to regularly update the event registry, risk
analyses, RSBR, CATSIM and CBA, but are skilled as trainers to promote national-level capacity building may be
an effective way to leverage local capacity and resources.
Government needs to develop investment and financing strategies to address both extensive (small scale but high
frequency) and intensive (low frequency but high impact). Climate change will increase risks in terms of frequency,
geography and intensity. Understanding risk structures and the expected economic impact in the country is the
critical first step to determine the optimum policy mix for each risk layer. In developing investment and financing
strategies to address disaster risk, DRR investment and risk financing should not be considered separately.
Depending on risk layers, the most appropriate policy mix changes and DRR investment and risk financing are not
mutually exclusive. For example, DRR investment often decreases insurance premiums.
This packaged approach with a focus on financial planners in government will be standardized and replicated in
Asia, Africa, Latin America and other regions in the coming years and the knowledge is planned to be archived and
presented globally in a working paper series of UNISDR on “Public Investment and Financing Strategy for DRR”.
The report summarizing activities in IOC region will thereby contribute to increasing the global knowledge base.

References
François Grunewald F. and Sallustro, J-L., 2014. Élaboration de procedures exceptionnelles en cas de crise dans
les pays membres de la COI. URG; Référence projet: COI AO-PGRNC-2012-02.
UNISDR/IOC (2015a): ISLANDS Programme for Financial Protection against Climatic and Natural Disasters-
Building Capacities for Increased Public Investment in Integrated Climate Change Adaptation and Disaster Risk
Reduction: Report of Mauritius. Mauritius. Indian Ocean Commission.
UNISDR/IOC (2015b): ISLANDS Programme for Financial Protection against Climatic and Natural Disasters-
Building Capacities for Increased Public Investment in Integrated Climate Change Adaptation and Disaster Risk
Reduction: Report of Madagascar. Mauritius. Indian Ocean Commission.
UNISDR/IOC (2015c): ISLANDS Programme for Financial Protection against Climatic and Natural Disasters-
Building Capacities for Increased Public Investment in Integrated Climate Change Adaptation and Disaster Risk
Reduction: Report of Seychelles. Mauritius. Indian Ocean Commission.
UNISDR/IOC (2015d): ISLANDS Programme for Financial Protection against Climatic and Natural Disasters-
Building Capacities for Increased Public Investment in Integrated Climate Change Adaptation and Disaster Risk
Reduction: Report of Comoros. Mauritius. Indian Ocean Commission.
UNISDR/IOC (2015e): ISLANDS Programme for Financial Protection against Climatic and Natural Disasters-
Building Capacities for Increased Public Investment in Integrated Climate Change Adaptation and Disaster Risk
Reduction: Report of Zanzibar. Mauritius. Indian Ocean Commission.

Annex D: Workshops and Meetings in IOC region
Inception meeting
Dates: 15-17 April 2013
Venue: ICCS, Seychelles
Host: Ministry of Environment
UNISDR staff in charge: Julio Serje, Kazuko Ishigaki, Manuela Di Mauro
Participants: 34
Component 1: capacity building for national disaster loss database
Comoros national workshop:
Dates: June 11-13, 2013
Venue: Hotel Retaj
Host: the Civil Protection and the Ministry of Environment.
UNISDR staff in charge: Sylvain Ponserre and Julio Serje
Participants: 25
Seychelles national workshop:
Dates: 14 - 19 Jul 2013.
Venue: Seychelles Fishing Authority, Division of Risk and Disaster Management (DRDM)
Host: the Division of Risk and Disaster Management (DRDM)
UNISDR staff in charge: Sylvain Ponserre
Participants: 22
Madagascar national workshop:
Dates: 28 Jul - 01 Aug 2013.
Venue: Hotel Colbert
Host: The "Cellule de Prévention et Gestion des Urgences"(CPGU)
UNISDR staff in charge: Sylvain Ponserre
Participants: 36
Mauritius national workshop:
Dates: 24 - 29 Aug 2013.
Venue: Indian Ocean Commission headquarters
Host: Ministry of Environment
UNISDR staff in charge: Sylvain Ponserre
Participants: 40

Zanzibar national workshop:
Dates: 11-14 June 2013
Venue: Zanzibar Ocean View Hotel
Host: NBI Office
UNISDR staff in charge: XXXXX
Participants: 37
Component2: Capacity building for Probabilistic Risk Assessment:
First regional workshop
Dates: 21-23 October 2013
Venue: Indian Ocean Commission headquarters, Mauritius
Host: Ministry of Environment
UNISDR staff in charge: Manuela Di Mauro, Mabel Cristina Marulanda Fraume (consultant)
Participants: 40
Second regional workshop
Dates: 20-22 November 2013
Venue: Indian Ocean Commission headquarters, Mauritius
Host: Ministry of Finance
UNISDR staff in charge: Mabel Cristina Marulanda Fraume (consultant)
Participants: 22
Third regional workshop
Dates: 19-21 March 2014
Venue: Indian Ocean Commission headquarters, Mauritius
Host:
UNISDR staff in charge: Mabel Cristina Marulanda Fraume (consultant)
Participants: 31
Mauritius national workshop:
Dates: 17-18 February 2014
Venue: Indian Ocean Commission Secretariat
Host:
UNISDR staff in charge: Mabel Cristina Marulanda Fraume (consultant)
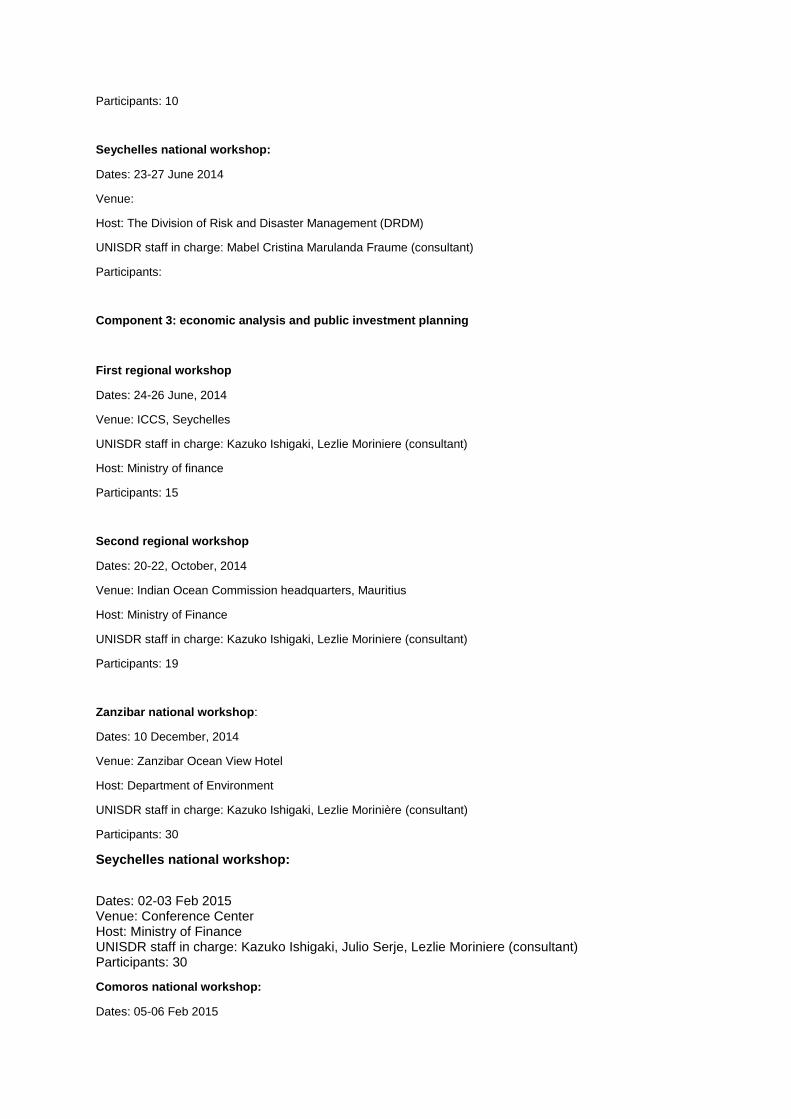
Participants: 10
Seychelles national workshop:
Dates: 23-27 June 2014
Venue:
Host: The Division of Risk and Disaster Management (DRDM)
UNISDR staff in charge: Mabel Cristina Marulanda Fraume (consultant)
Participants:
Component 3: economic analysis and public investment planning
First regional workshop
Dates: 24-26 June, 2014
Venue: ICCS, Seychelles
UNISDR staff in charge: Kazuko Ishigaki, Lezlie Moriniere (consultant)
Host: Ministry of finance
Participants: 15
Second regional workshop
Dates: 20-22, October, 2014
Venue: Indian Ocean Commission headquarters, Mauritius
Host: Ministry of Finance
UNISDR staff in charge: Kazuko Ishigaki, Lezlie Moriniere (consultant)
Participants: 19
Zanzibar national workshop:
Dates: 10 December, 2014
Venue: Zanzibar Ocean View Hotel
Host: Department of Environment
UNISDR staff in charge: Kazuko Ishigaki, Lezlie Morinière (consultant)
Participants: 30
Seychelles national workshop:
Dates: 02-03 Feb 2015 Venue: Conference Center Host: Ministry of Finance UNISDR staff in charge: Kazuko Ishigaki, Julio Serje, Lezlie Moriniere (consultant) Participants: 30
Comoros national workshop:
Dates: 05-06 Feb 2015

Venue: Direction générale de la Sécurité Civile
Host: Direction générale de la sécurité civile
UNISDR staff in charge: Julio Serje, Lezlie Morinière (consultant)
Participants:55
Madagascar national workshop:
Dates: 28-30 Feb 2015
Venue: STC
Host: Ministry of Finance
UNISDR staff in charge: Kazuko Ishigaki, Lezlie Morinière (consultant)
Participants: 30
Mauritius national workshop:
Dates: tbc
Venue: tbc
Host: tbc
UNISDR staff in charge: tbc
Participants: tbc

UNISDR Working Papers on Public Investment Planning and Financing Strategy for Disaster Risk Reduction
1. Public Investment Planning and Financing Strategy to Reduce and Mange Disaster Risk: Review of
Mauritius, February 2015
2. Public Investment Planning and Financing Strategy to Reduce and Mange Disaster Risk: Review of Madagascar, February 2015
3. Public Investment Planning and Financing Strategy to Reduce and Mange Disaster Risk: Review of Seychelles, February 2015
4. Public Investment Planning and Financing Strategy to Reduce and Mange Disaster Risk: Review of
Comoros, February 2015
5. Public Investment Planning and Financing Strategy to Reduce and Mange Disaster Risk: Review of Zanzibar, February 2015
6. Public Investment Planning and Financing Strategy to Reduce and Mange Disaster Risk: Review of South-West Indian Ocean Region, February 2015
The series offers analysis and policy guidance to national governments and other stakeholders to strengthen public investment planning and financing strategy to reduce and manage disaster risk. These reviews are part of a larger body of UNISDR work on disaster risk reduction, including loss database building, global probabilistic risk assessment, HFA Monitor and others. This work includes both theoretical reports and reports on specific countries or regions. Contents: Executive Summary Introduction: Conceptual Framework Chapter 1: Country Structure Chapter 2: Disaster Loss Chapter 3: Disaster Risk Chapter 4: National DRM/DRR/CCA Framework Chapter 5: DRR/DRM/CCA in Public Investment Planning Chapter 6: Policy Recommendations Annex A: Risk-Sensitive Budget Review Annex B: Macro/CATSIM Assessment Annex C: Micro/Cost-Benefit Analysis Annex D: Workshops and Meetings in IOC Region

w w w . u n i s d r . o r g