Slide Slide 1 Section 5-3 Binomial Probability Distributions.
Upload
virginia-skinnerCategory
view
44download
5description

Review of Probability and
Binomial Distributions
The Mathematics of Chance
• How many possible outcomes are there with a single 6-sided die?
• What are your “chances” of rolling a 6?
• Can we generalize what you just did?

"A gambler's dispute … a game consisted in throwing a pair of dice 24 times; the problem was to decide whether or not to bet even money on the occurrence of at least one "double six" during the 24 throws.
The gambler’s dispute (1654)
• This famous dispute led to the formal development of the mathematical theory of probability
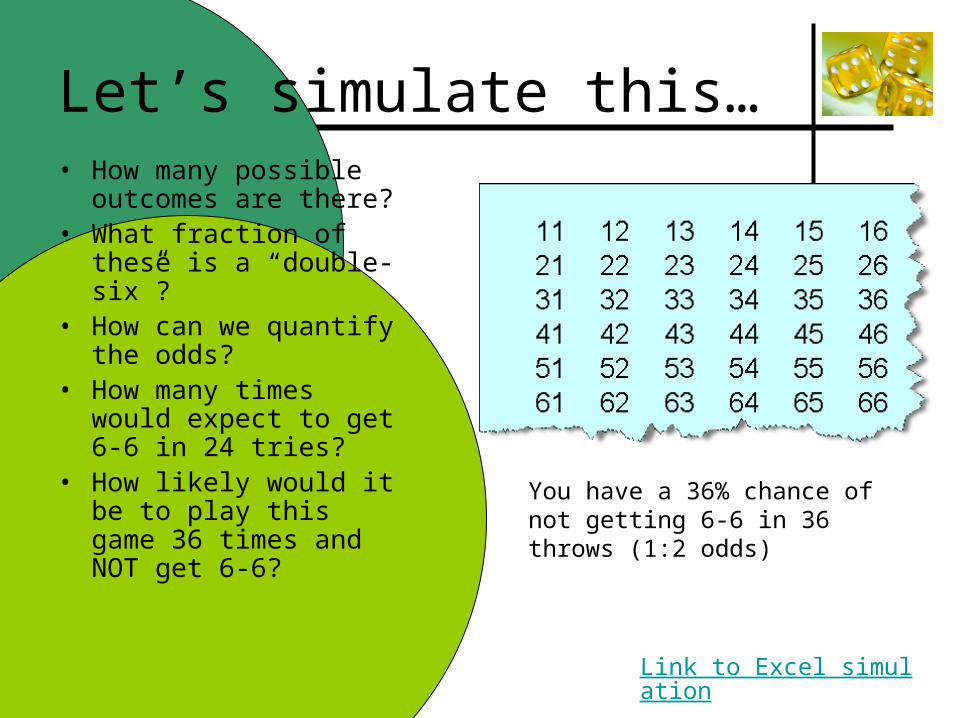
Let’s simulate this…• How many possible
outcomes are there?• What fraction of these is
a “double-six”?• How can we quantify the
odds?• How many times would
expect to get 6-6 in 24 tries?
• How likely would it be to play this game 36 times and NOT get 6-6?
You have a 36% chance of not getting 6-6 in 36 throws (1:2 odds)
Link to Excel simulation
Defining Probability
• We define probability by comparing an outcome or set of outcomes with the set of all possible outcomes for an event.
• This will lead us to an “intuitive” definition of probability
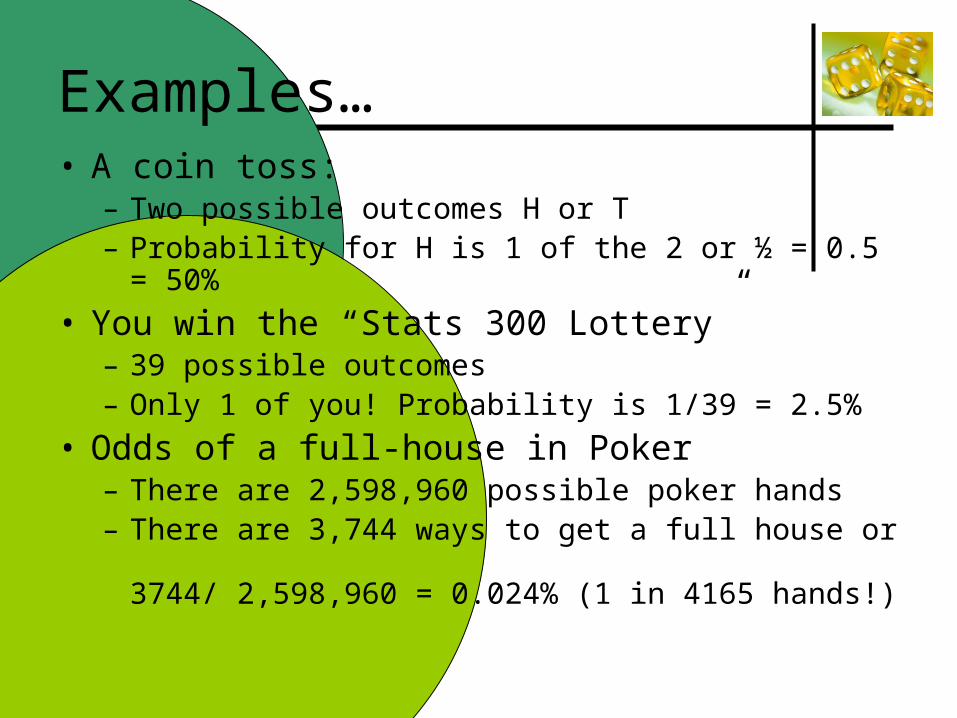
Examples…• A coin toss:
– Two possible outcomes H or T– Probability for H is 1 of the 2 or ½ = 0.5 = 50%
• You win the “Stats 300 Lottery”– 39 possible outcomes– Only 1 of you! Probability is 1/39 = 2.5%
• Odds of a full-house in Poker– There are 2,598,960 possible poker hands– There are 3,744 ways to get a full house or
3744/ 2,598,960 = 0.024% (1 in 4165 hands!)
Independent Events
• When events are independent – the outcome (or probability) of the one does not change the probability of the other.
• Example:– You flip a coin and get heads – what is the
probability that you heads on the next flip?– NOTE – this is not the same as asking what is
the probability of flipping two heads in succession
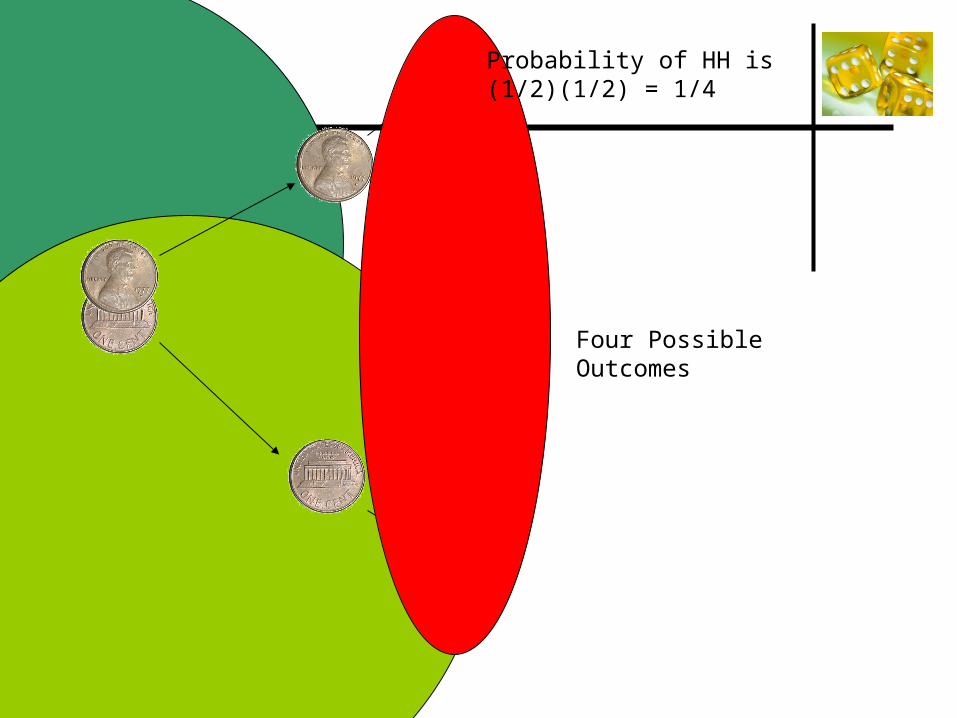
Four Possible Outcomes
Probability of HH is(1/2)(1/2) = 1/4
Probability Rules (for events)…
• A probability of 0 means an event never happens
• A probability of 1 means an event always happens
• Probability P is a number always between 0 and 1
Probability Rules (for events)…
• If the probability of an event A is P(A) then the probability that the event does not occur is 1-P(A)
• This is also called the compliment of A and is denoted AC
• Example: what is the probability of not rolling a 6 when using an honest die?Solution: P6 = 1/6, PC
6 = 1 - 1/6 = 5/6
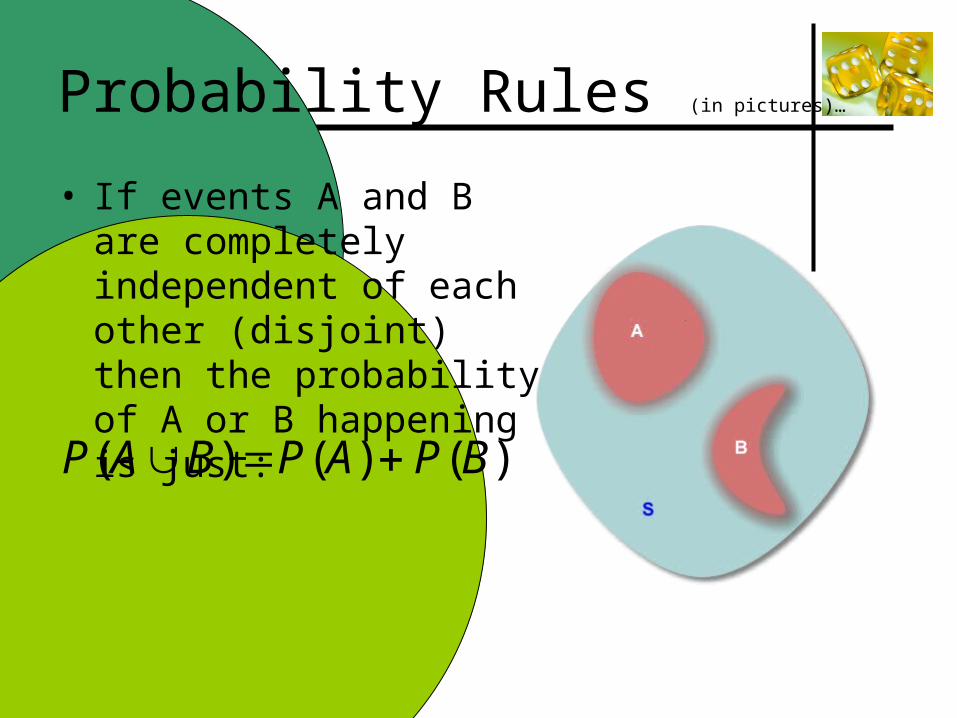
Probability Rules (in pictures)…
• If events A and B are completely independent of each other (disjoint) then the probability of A or B happening is just:
( ) ( ) ( )P A B P A P B
Sample Questions…
• What is the probability of flipping 5 successive heads?
• What is the probability of flipping 3 heads in 5 tries?
• From your text: 4.8, 4.13,4.14
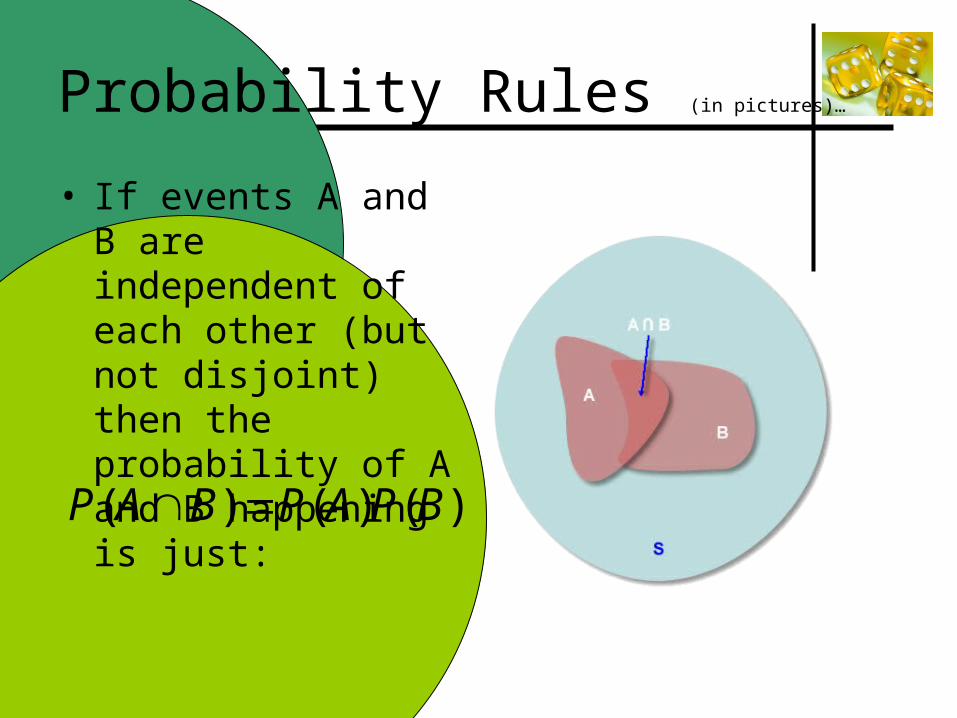
Probability Rules (in pictures)…
• If events A and B are independent of each other (but not disjoint) then the probability of A and B happening is just:
( ) ( ) ( )P A B P A P B
The Binomial Distribution
A motivating example…• 35% of Canadian university students work
more than 20 hours/week in jobs not related to their studies. This can have a serious impact on their grades. What is the probability that I have at least 5 such students in this class?
Answer: There is better Answer: There is better than a 99% chance!than a 99% chance!
What is a Binomial Distribution?•Any random statistic that can be cast in a “yes/no” format where:
•N successive choices are independent•“yes” has probability p and “no” has probability 1-p
fits a binomial distribution.
Suggest 3 other examples of data sets that can be modeled as binomial distributions
Looking a bit deeper…• Suppose someone offered you the following
“game”:
• Should you accept the bet?
• What is your expected return on this bet?
• How can we calculate the odds?
Toss a coin 5 times. If you get 3 headsToss a coin 5 times. If you get 3 heads I pay you a dollar, otherwise you pay me 50 cents.I pay you a dollar, otherwise you pay me 50 cents.
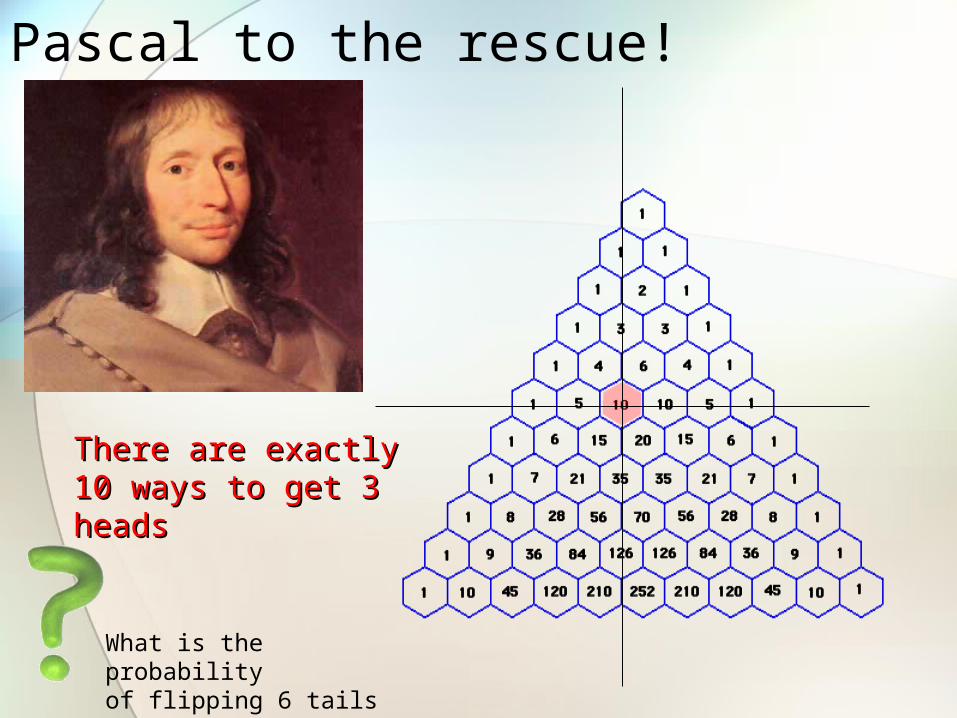
Pascal to the rescue!
There are exactly 10 There are exactly 10 ways to get 3 headsways to get 3 heads
What is the probabilityof flipping 6 tails in 8 trials?
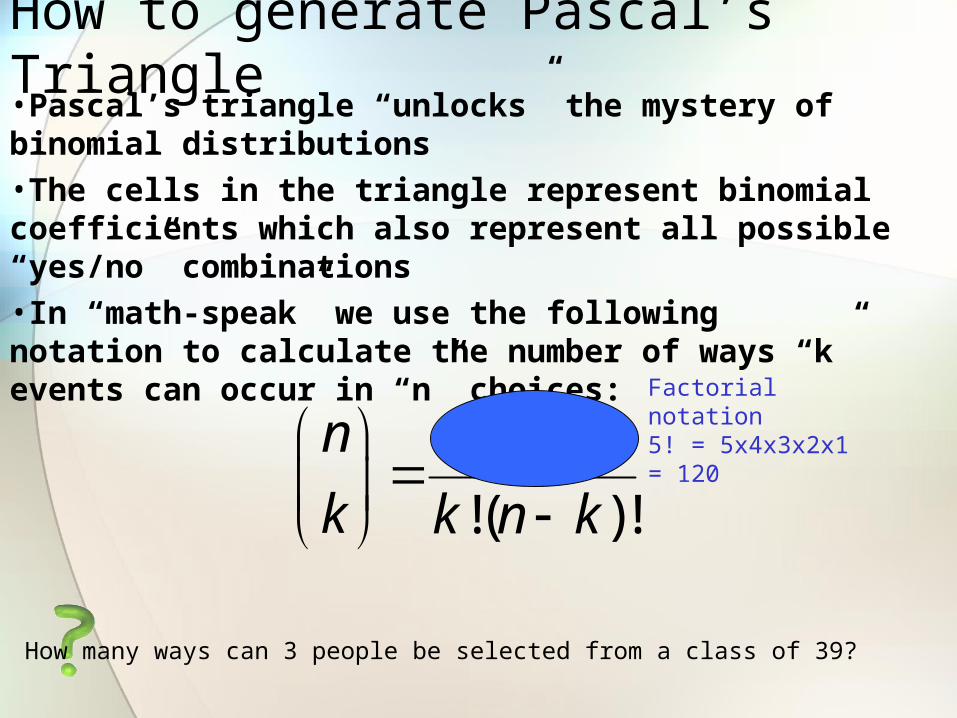
How to generate Pascal’s Triangle•Pascal’s triangle “unlocks” the mystery of binomial distributions•The cells in the triangle represent binomial coefficients which also represent all possible “yes/no” combinations•In “math-speak” we use the following notation to calculate the number of ways “k” events can occur in “n” choices:
!
!( )!
n n
k k n k
Factorial notation5! = 5x4x3x2x1 = 120
How many ways can 3 people be selected from a class of 39?
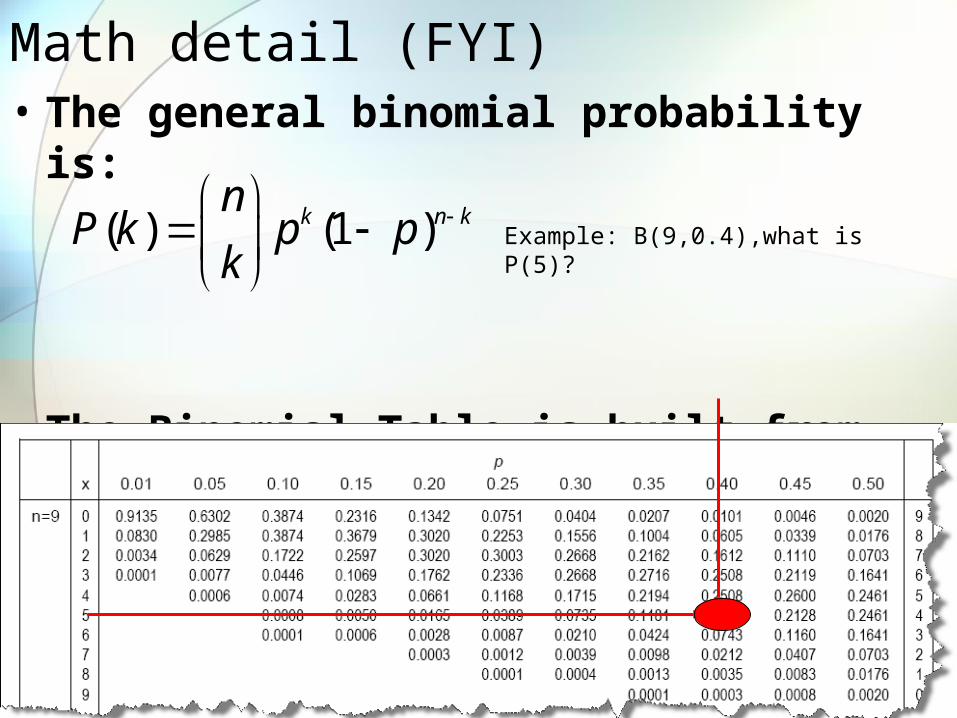
Math detail (FYI)• The general binomial probability is:
• The Binomial Table is built from these terms
( ) (1 )k n kn
P k p pk
Example: B(9,0.4),what is P(5)?
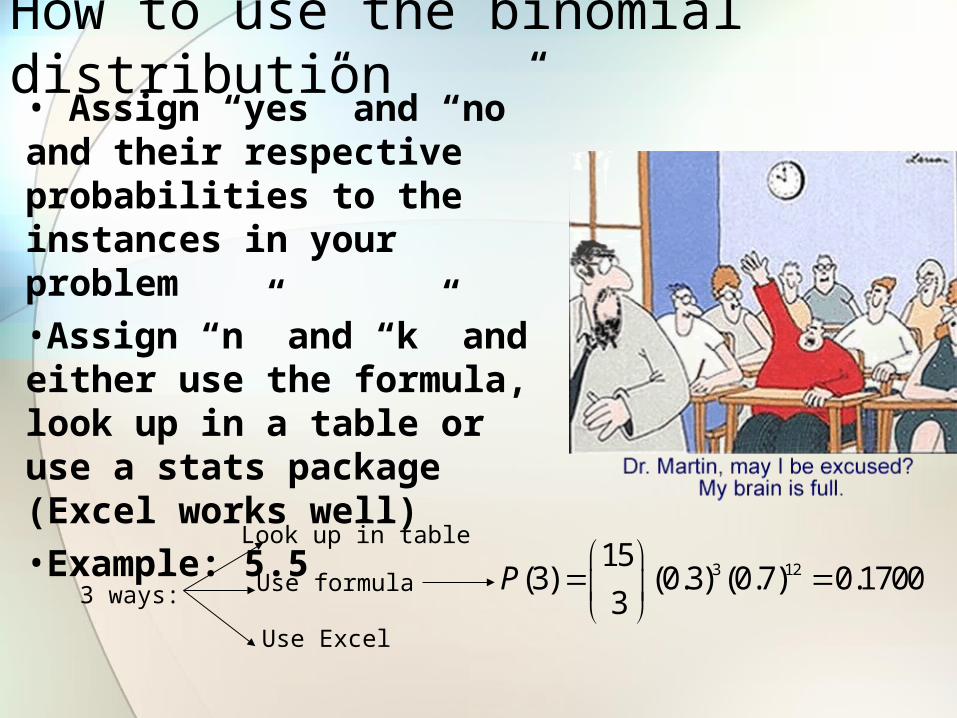
How to use the binomial distribution• Assign “yes” and “no” and their respective probabilities to the instances in your problem•Assign “n” and “k” and either use the formula, look up in a table or use a stats package (Excel works well)•Example: 5.5
3 ways:
Look up in table
Use formula
Use Excel
3 1215
(3) (0.3) (0.7) 0.17003
P
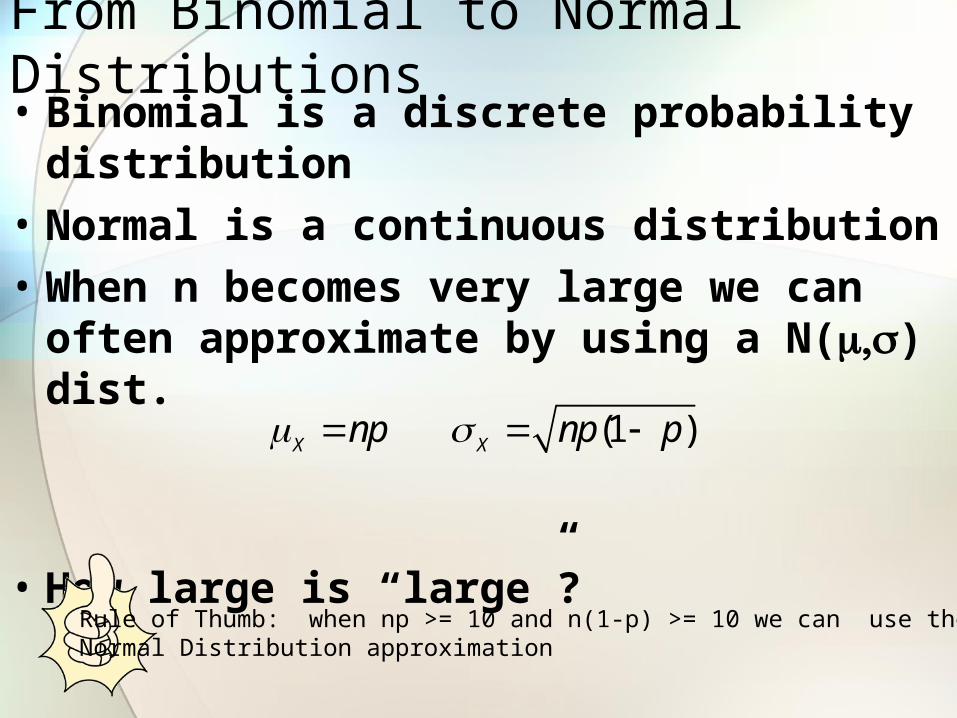
From Binomial to Normal Distributions• Binomial is a discrete probability
distribution
• Normal is a continuous distribution
• When n becomes very large we can often approximate by using a N() dist.
• How large is “large”?
(1 )X Xnp np p
Rule of Thumb: when np >= 10 and n(1-p) >= 10 we can use theNormal Distribution approximation
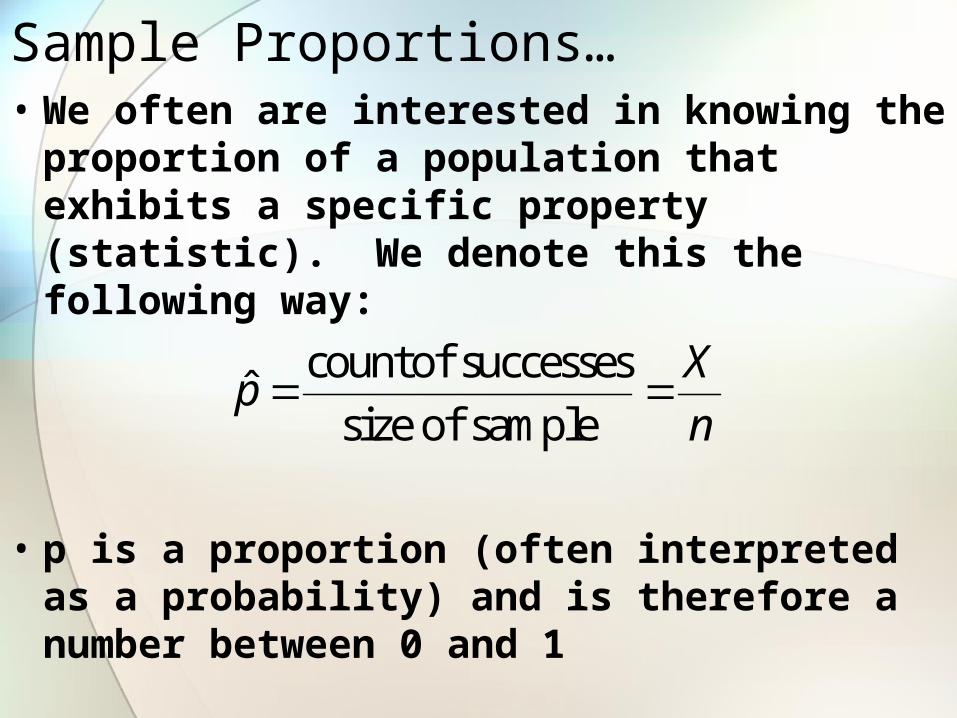
Sample Proportions…• We often are interested in knowing the
proportion of a population that exhibits a specific property (statistic). We denote this the following way:
• p is a proportion (often interpreted as a probability) and is therefore a number between 0 and 1
count of successesˆ
size of sample
Xp
n
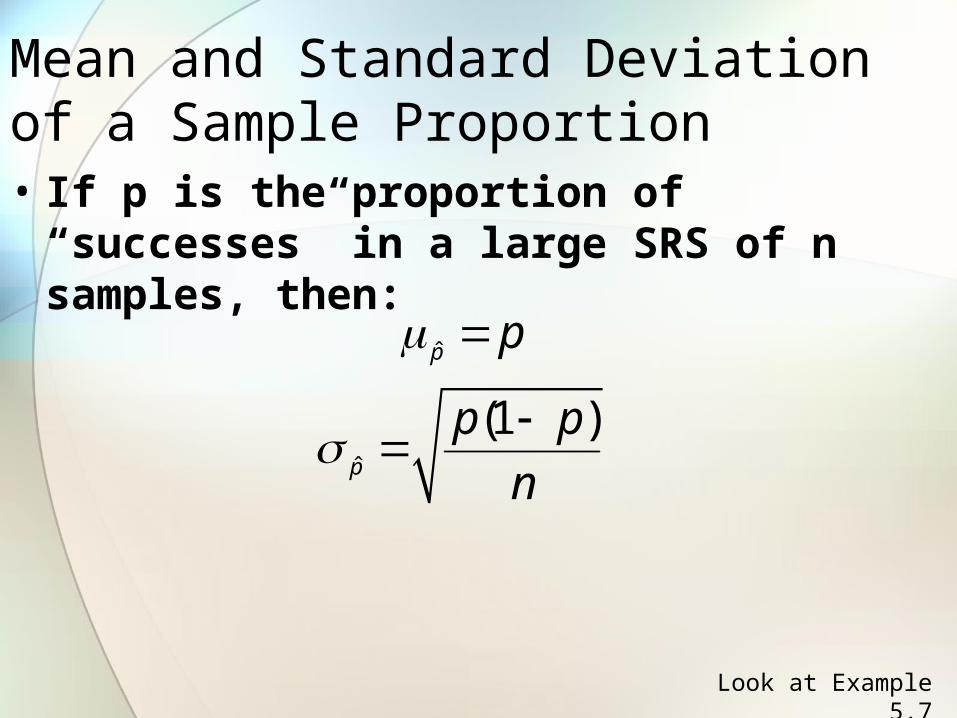
Mean and Standard Deviation of a Sample Proportion• If p is the proportion of “successes” in a
large SRS of n samples, then:
ˆ
ˆ
(1 )
p
p
p
p p
n
Look at Example 5.7
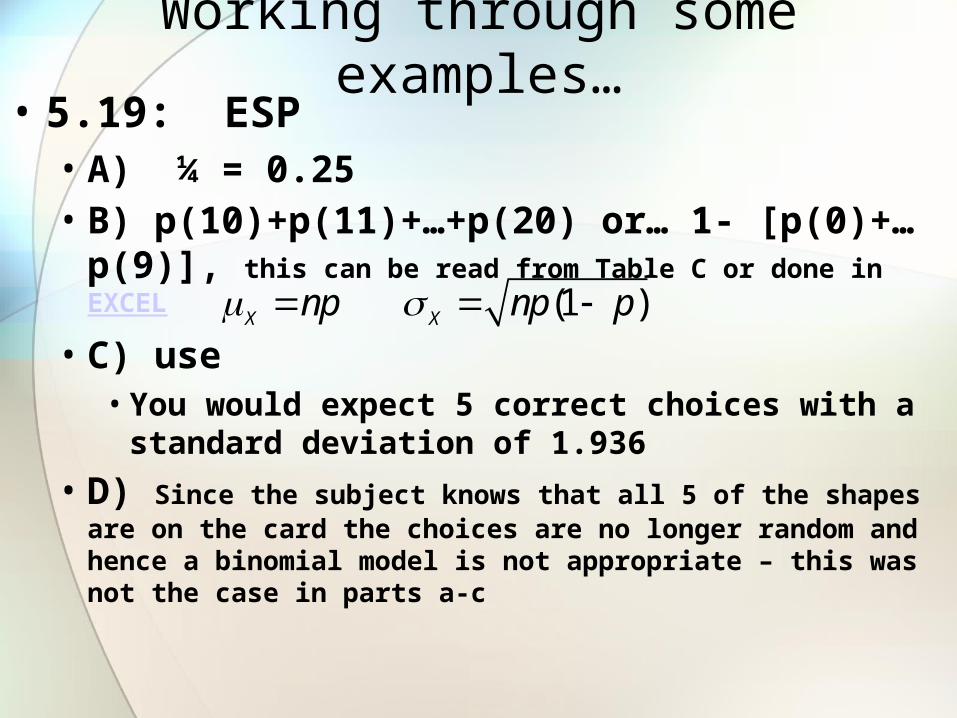
Working through some examples…• 5.19: ESP
• A) ¼ = 0.25• B) p(10)+p(11)+…+p(20) or… 1- [p(0)+…p(9)], this
can be read from Table C or done in EXCEL
• C) use• You would expect 5 correct choices with a standard
deviation of 1.936
• D) Since the subject knows that all 5 of the shapes are on the card the choices are no longer random and hence a binomial model is not appropriate – this was not the case in parts a-c
(1 )X Xnp np p
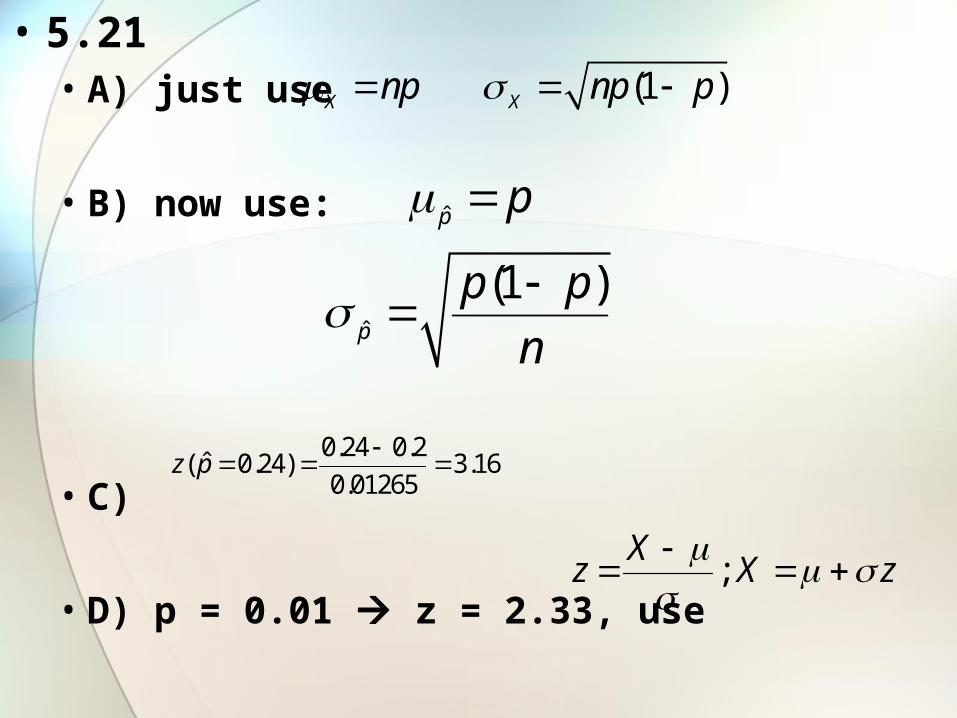
• 5.21• A) just use
• B) now use:
• C)
• D) p = 0.01 z = 2.33, use
(1 )X Xnp np p
ˆ
ˆ
(1 )
p
p
p
p p
n
0.24 0.2ˆ( 0.24) 3.16
0.01265z p
;X
z X z
• 5.24• Identify relevant statistics: n = 1500, p = 0.7
• A) X = np = (1500)(0.70) = 1050• B) z = (1000-1050)/17.748, better than 99% chance• C) z = (1200-1050)/17.748, NO CHANCE!!!!!• D) X = np = 1190 and = 18.89, chance that more than
1200 accept is now pretty good (p = 0.2892)