Review of Indonesian development corridors - Bustanul Arafin
20
Review of Indonesian Development Corridors: An Inclusion of Agricultural Research Bustanul Arifin [email protected] Professor of Agricultural Economics at the University of Lampung Head of Expert Group for the National Food Security Council The 11 th Meeting of the Independent Science and Partnership Council (ISPC), 30 March – 1 April 2015 in Bogor
-
Upload
independent-science-and-partnership-council-of-the-cgiar -
Category
Science
-
view
38 -
download
0
Transcript of Review of Indonesian development corridors - Bustanul Arafin

Review of Indonesian Development Corridors:
An Inclusion of Agricultural Research
Bustanul Arifin [email protected]
Professor of Agricultural Economics at the University of Lampung
Head of Expert Group for the National Food Security Council
The 11th Meeting of the Independent Science and Partnership Council (ISPC), 30 March – 1 April 2015 in Bogor

Presentation Outline
1. Indonesia in the Future: Optimistic View?
2. New Government Strategy: Economic Self-Reliance
3. Wither Development Corridor? Java pragmatism
4. Major issues: Economies of scale and inefficiency
5. Future Challenges of Agricultural Research
6. Concluding Remarks: Policy recommendations

Indonesia TODAY Indonesia in 2030
Sources: McKinsey Global Institute, 2012

President Yudhoyono: Inclusion Issues
• Triple-track strategy (pro-growth, pro-jobs, pro-poor) has
achieved some progress in the first term (2004-2009).
Quadruple-track strategy (adding pro-environment) in the
second term focused also to Outside Java development.
• The engine of Outside Java economy: Mining, plantation
and some service sectors; decentralization and regional
autonomy speed up the economic growth of Outside Java
although economic inequality has widen in recent years.
• If infrastructure development is targeted Outside Java,
these regions will become the sources of Indonesia’s
economic growth in the near future. But, how to start?

Production centers and processing of agricultural and resource-based products and national energy stocks Production centers and
processing of agriculture and mining-based products, national-energy socks
Production centers and processing of agriculture, plantations, and fisheries, and the oil and gas mining
Sumatra Corridor
Kalimantan Corridor
Sulawesi Corridor
Entry point of tourisms and national support system for food production
Supporters of manufacturing and service sectors
Development center of food, fisheries, national energy and mining.
Java Corridor
Bali-Nusra Corridor
Papua-Maluku Corridor
MP3EI 2025: Economic Development Corridors

President Widodo: Economic Self-Reliance
• Food sovereignty: manifested through the power and
freedom to manage the national food issues, supported by:
1. Food security, ability to fulfill food needs domestically;
2. Food policy is formulated and by the Indonesians;
3. Ability to protect and empower the main actors of food
system, particularly farmers & fishermen.
• Maritime economy: major improvement on infrastructure,
ports, vessels, interconnectivity, and all logistic systems;
• Sustainability: Economically viable, socially acceptable and
ecologically sound. Public-private partnership is encouraged.
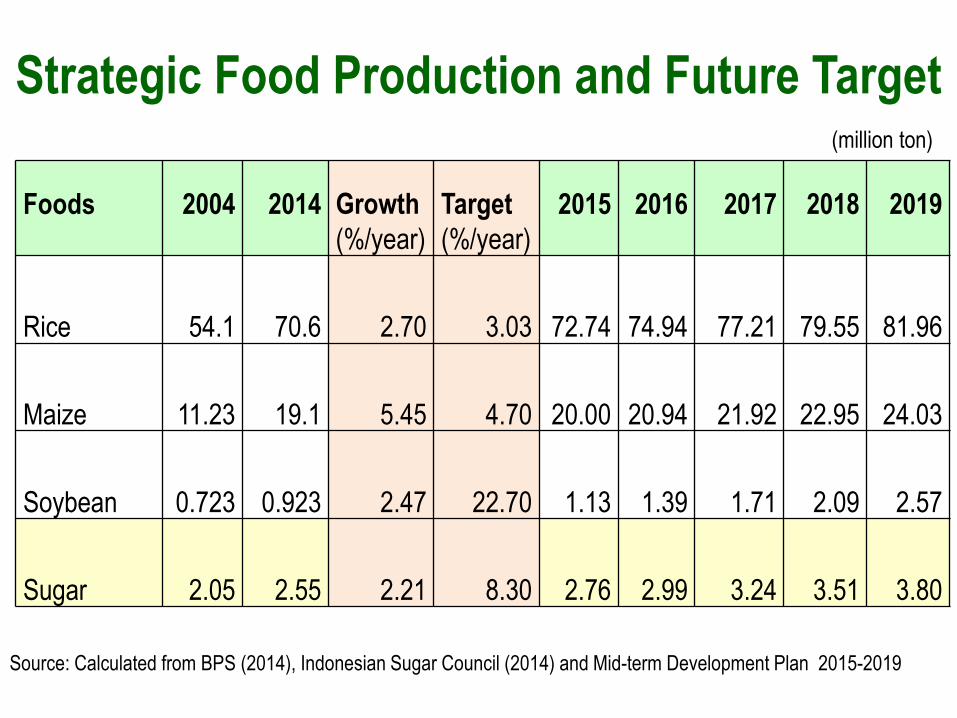
Strategic Food Production and Future Target
Foods
2004
2014
Growth
(%/year)
Target
(%/year)
2015
2016
2017
2018
2019
Rice 54.1 70.6 2.70 3.03 72.74 74.94 77.21 79.55 81.96
Maize 11.23 19.1 5.45 4.70 20.00 20.94 21.92 22.95 24.03
Soybean 0.723 0.923 2.47 22.70 1.13 1.39 1.71 2.09 2.57
Sugar 2.05 2.55 2.21 8.30 2.76 2.99 3.24 3.51 3.80
Source: Calculated from BPS (2014), Indonesian Sugar Council (2014) and Mid-term Development Plan 2015-2019
(million ton)

TFP: Slow Growth of Indonesian Agriculture • The current growth rate of agricultural sector is 3.4 percent, which is
not adequate to improve the growth quality of the Indonesian economy;
• Total Factor Productivity (TFP) is the portion of output not explained by the amount of inputs used in production. TFP is determined by how efficiency and intensely the inputs are utilized in production.
• A recent TFP study of ASEAN agriculture (Suo, et al. 2014) has found 1.4 percent growth, where all 8 countries have positive TFP, except Laos and Myanmar having negative TFP growth.
• The study applies decomposing the TFP into technical efficiency change (TEC) and technological change (TC), using Malmquist Index-DEA Methodology. Variations in TFP growth is primarily driven by technological change. Low technological change leads to low growth.
• The declining shift of labor productivity in Indonesia and Philippines is not surprising, given that supply response in major agricultural commodities in these two countries is quite slow, in spite of increasing demand for foods and agricultural products.

Slow Productivity Growth in Strategic Foods Strategic Food 2010 2011 2012 2013 2014*
Rice: Harvested Area (ha) 13,244,184 13,203,643 13,445,524 13,835,252 13,768,319
Productivity (ton/ha) 5.01 4.98 5.14 5.15 5.12
Production(ton GKG) 66,411,469 65,756,904 69,056,126 71,279,709 70,607,231
Rice Import (ton) 527,772 2,201,564 1,416,226 **472,000 500,000
Maize: Harvested Area (ha) 4,131,676 3,864,692 3,957,595 3,821,504 3,880,221
Productivity (ton/ha) 4.43 4.56 4.90 4.84 4.93
Production(ton dry grains) 18,327,636 17,643,250 19,387,022 18,506,287 19,127,409
Maize Import (ton) 3,041,000 1,724,000 2,719,000 3,500,000 3,150,000
Soybean: Harvested Area (ha) 660,823 622,254 567,624 550,793 611,805
Productivity (ton/ha) 1,24 1.37 1.48 1.42 1.51
Production (ton dry beans) 907,031 851,286 843,153 779,992 921,336
Soybean Import (ton) 1,620,000 1,890,000 1,990,000 1,787,000 1,882,000
Sugar: Harvested Area (ha) 432,714 450,298 451,191 460,496 479,000
Productivity (ton/ha) 5.29 4.95 5.74 5.19 5.32
Production (ton sugar) 2,290,117 2,228,259 2,591,687 2,390,000 2,550,000
Sugar Import (ton) 2,300.000 2,200.000 2,590.000 2,550,000 3,650,000
Sources: BPS, Data 2014* is second forecast. Import data: From commodity associations. Sugar Data : From AGI (Gula Insight, 2014)

Shifting production to Outside Java? Not Easy
• Next 5 years, new government would not take the risks by shifting the basis of strategic food production to Outside Java; – Rice 2009: 34.9 million ton (54.2%) 2014: 36.4 million ton (51.6%)
– Maize 2009: 9.5 million ton (53.6%) 2014: 10.2 million ton (53.1%)
– Soybean 2009: 645 thous.ton (66.4%) 2014: 595 thous.ton (64.6%)
– Sugar 2009: 1.5 million ton (67.3%) 2014: 1.65 million ton (64.7%);
• Preventing land conversion in Java by enforcing law & regulations;
• Strengthening the foundation of food production of Outside Java.

Economies of Scale and Efficiency Issues
• The majority of food-crop farmers (about 54%) is smallholders,
about 49.5% living in Java and 18.7% in Outside Java. From 28.6
million poor people, about 62.8 percent of them is farmers.
• The new government reinstalls the programs of agrarian reforms
and spatial planning and development, to increase the farm-
holding size and improve the market access.
• Major public investment has been allocated to build new ports,
rehabilitate infrastructures, develop “sea-toll” transportation as
the empty back-haul has lowered the efficiency of logistic system.
• New approach on corporate farming and food estates has been
developed, especially outside Java, both for area expansion and
production intensification to maintain food security in the country.
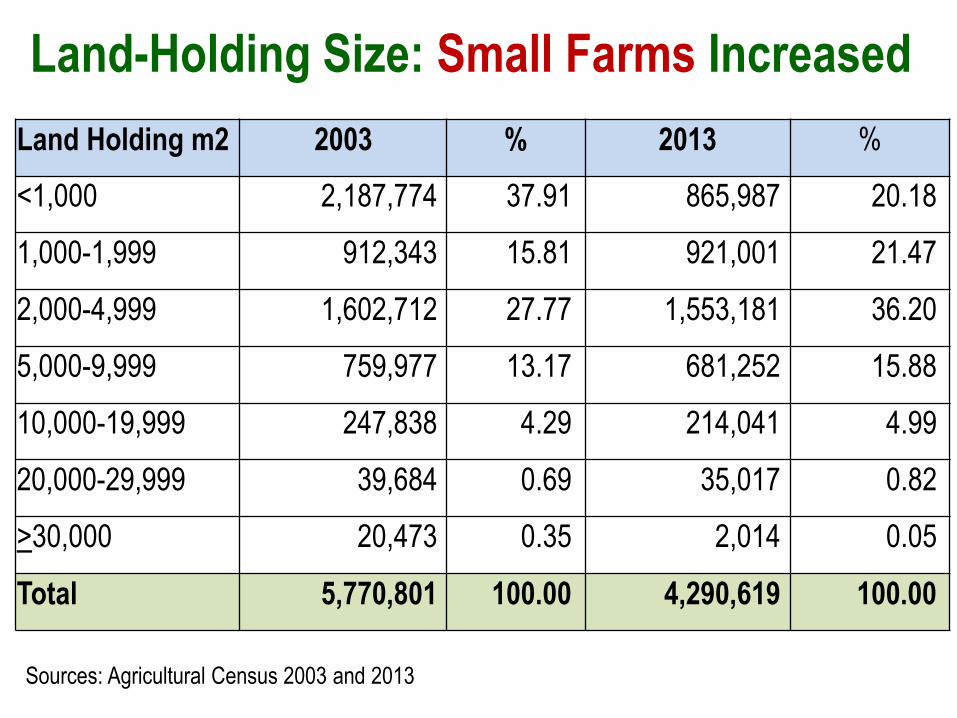
Land-Holding Size: Small Farms Increased
Land Holding m2 2003 % 2013 %
<1,000 2,187,774 37.91 865,987 20.18
1,000-1,999 912,343 15.81 921,001 21.47
2,000-4,999 1,602,712 27.77 1,553,181 36.20
5,000-9,999 759,977 13.17 681,252 15.88
10,000-19,999 247,838 4.29 214,041 4.99
20,000-29,999 39,684 0.69 35,017 0.82
>30,000 20,473 0.35 2,014 0.05
Total 5,770,801 100.00 4,290,619 100.00
Sources: Agricultural Census 2003 and 2013
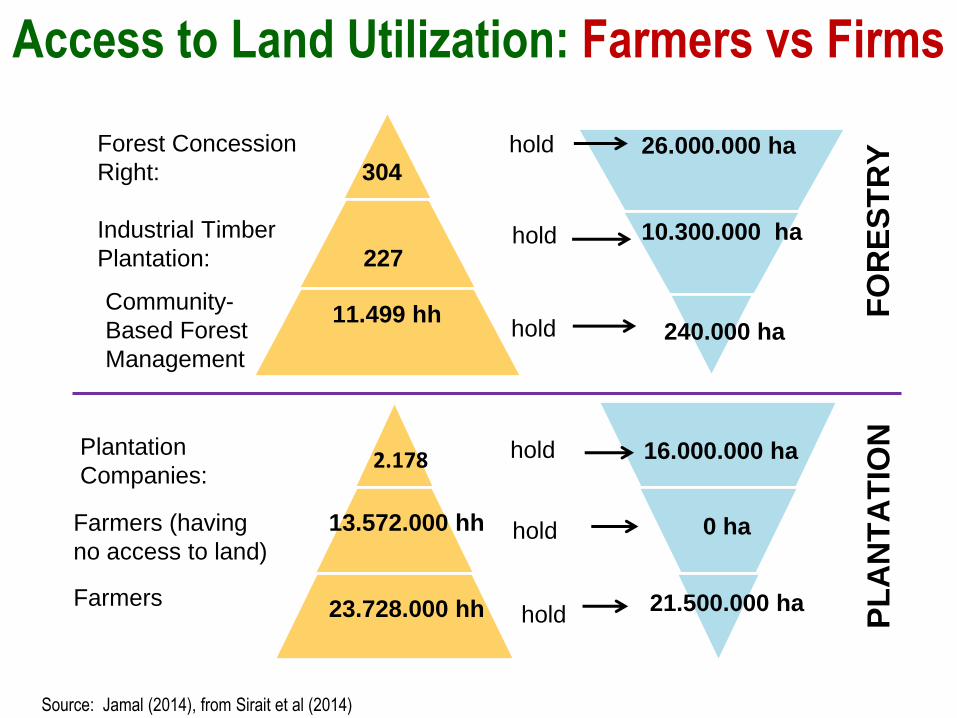
Access to Land Utilization: Farmers vs Firms
FO
RE
ST
RY
P
LA
NT
AT
ION
26.000.000 ha
10.300.000 ha
Community-
Based Forest
Management
11.499 hh 240.000 ha
Farmers (having
no access to land)
Farmers
Plantation
Companies:
13.572.000 hh
23.728.000 hh
0 ha
21.500.000 ha
16.000.000 ha
hold
hold
hold
hold
hold
hold
Forest Concession
Right: 304
Industrial Timber
Plantation: 227
2.178
Source: Jamal (2014), from Sirait et al (2014)

Farmers’ Access to Banking System
Source: Ikhsan, 2014

Java farmers have a better banking access
Source: Ikhsan, 2014
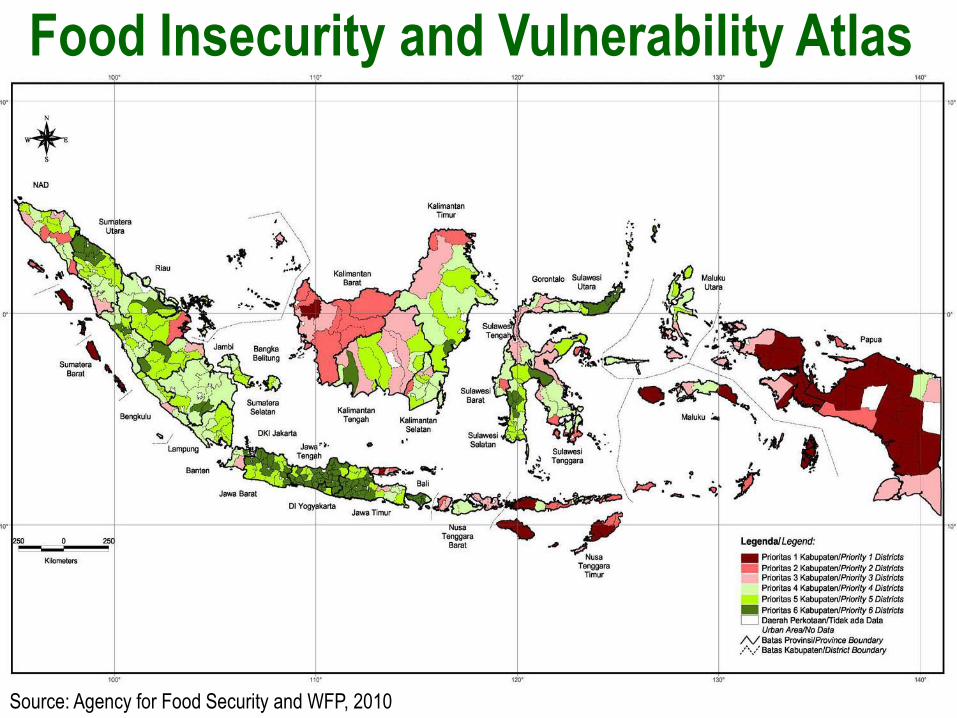
Food Insecurity and Vulnerability Atlas
Source: Agency for Food Security and WFP, 2010
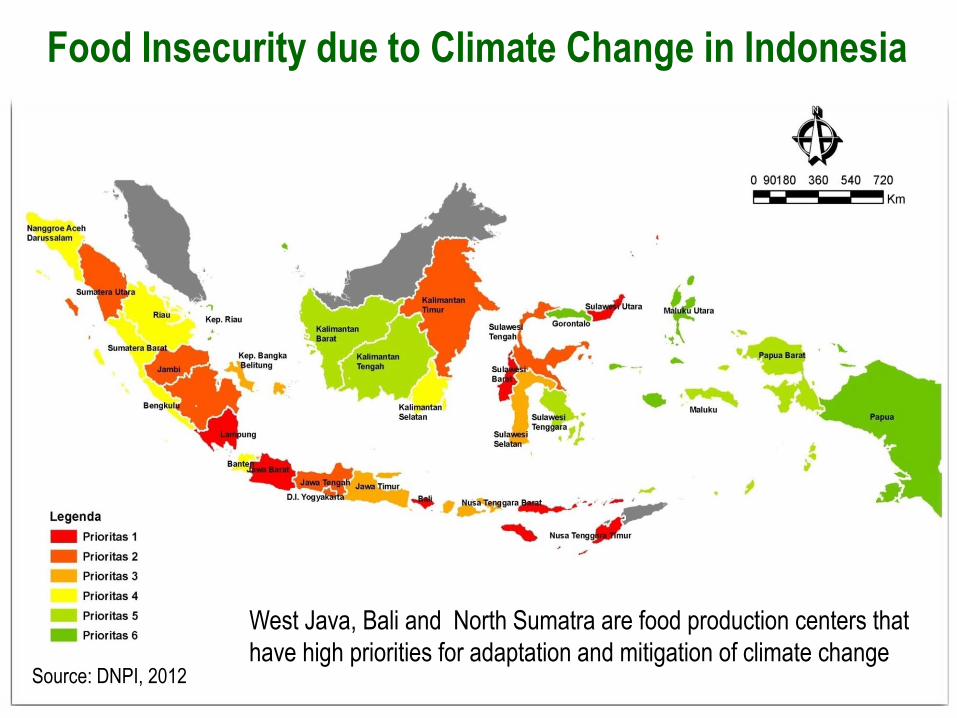
Food Insecurity due to Climate Change in Indonesia
West Java, Bali and North Sumatra are food production centers that
have high priorities for adaptation and mitigation of climate change Source: DNPI, 2012

Research Intensity in Agriculture: Declining
RI = -3E-05t + 0.0014
0
0.0002
0.0004
0.0006
0.0008
0.001
0.0012
0.0014
0.0016
0.0018
1972 1976 1980 1984 1988 1992 1996 2000 2004
Rati
o
Research intensity
Linear (Research
intensity)
Source: Warr, 2011
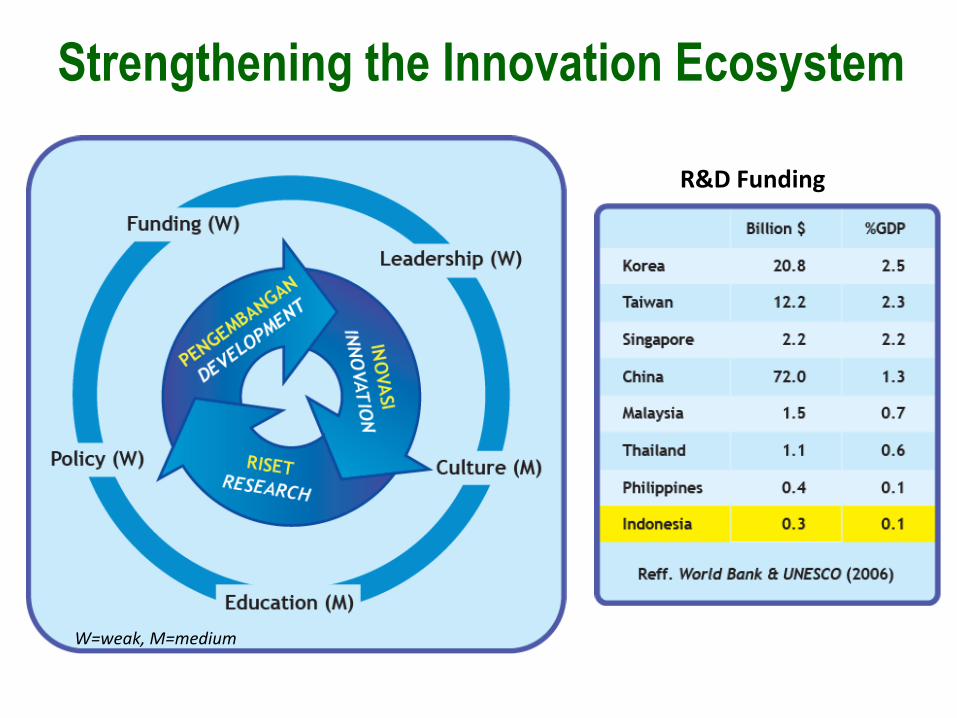
W=weak, M=medium
R&D Funding
Strengthening the Innovation Ecosystem

Concluding Remarks: Policy Changes
• Land-holding size remains problematic for the farmers’ welfare, unless agricultural policies are supported by a high quality rural development and agrarian reforms, and by rapid pace of "upward diversification” from low-to high value local foods, horticulture, and estate crops, etc.
• Priorities to close the gap between ideal and actual yield level; Improve capacity building of researchers and research institute;
• Reduce poverty (subsidizing the needy and empowering the active poor), implementing concrete actions to combat children malnutrition and preventing its future occurrence by promoting food diversification based on local endowments and food technology development;
• R&D policies should increase budget allocation at least 1 percent of the GDP, from the public funds, SOEs and private sectors, empower food-innovation networks, involving ABGC partnership.
• Complement on-going bureaucracy reforms at the institution level with a modernized regulatory framework, easily implemented at both central, provincial and local government.