Review of Data Sources, QSARs and Integrated Testing ... · EUR 22943 EN - 2007 Review of Data...
103
EUR 22943 EN - 2007 Review of Data Sources, QSARs and Integrated Testing Strategies for Aquatic Toxicity Tatiana Netzeva, Manuela Pavan and Andrew Worth
Transcript of Review of Data Sources, QSARs and Integrated Testing ... · EUR 22943 EN - 2007 Review of Data...

EUR 22943 EN - 2007
Review of Data Sources, QSARs and Integrated Testing Strategies
for Aquatic Toxicity
Tatiana Netzeva, Manuela Pavan and Andrew Worth

The mission of the IHCP is to provide scientific support to the development and implementation of EU policies related to health and consumer protection. The IHCP carries out research to improve the understanding of potential health risks posed by chemical, physical and biological agents from various sources to which consumers are exposed. European Commission Joint Research Centre Institute for Health and Consumer Protection Contact information Address: European Chemicals Bureau TP 581 E-mail: [email protected] Tel.: +39 0332 785428 Fax: +39 0332 786717 http:// http://ecb.jrc.it/QSAR http://www.jrc.cec.eu.int Legal Notice Neither the European Commission nor any person acting on behalf of the Commission is responsible for the use which might be made of this publication. A great deal of additional information on the European Union is available on the Internet. It can be accessed through the Europa server http://europa.eu/ JRC 40402 EUR 22943 EN ISBN X-XXXX-XXXX-X ISSN 1018-5593 Luxembourg: Office for Official Publications of the European Communities © European Communities, 2007 Reproduction is authorised provided the source is acknowledged Printed in Italy
ABSTRACT This review collects information on sources of aquatic toxicity data and
computational tools for estimation of chemical toxicity aquatic to aquatic organisms,
such as expert systems and quantitative structure-activity relationship (QSAR)
models. The review also captures current thinking of what constitutes an integrated
testing strategy (ITS) for this endpoint. The emphasis of the review is on the
usefulness of the models and for the regulatory assessment of chemicals, particularly
for the purposes of the new European legislation for the Registration, Evaluation,
Authorisation and Restriction of Chemicals (REACH), which entered into force on 1
June 2007. Effects on organisms from three trophic levels (fish, Daphnia and algae)
were subject of this review. In addition to traditional data sources such as databases,
papers publishing experimental data are also identified. Models for narcoses, general
(global) models as well as models for specific chemical classes and mechanisms of
action are summarised. Where possible, models were included in a form allowing
reproduction without consultation with the original paper. This review builds on work
carried out in the framework of the REACH Implementation Projects, and was
prepared as a contribution to the EU funded Integrated Project, OSIRIS.

LIST OF ABBREVIATIONS ASTER ASsessment Tools for the Evaluation of Risk ASTM American Society for Testing and Materials EC European Commission EC Effective Concentration ECB European Chemicals Bureau ECETOC European Centre for Ecotoxicology and Toxicology of Chemicals EINECS European INventory of Existing Commercial chemical Substances ELUMO Energy of the Lowest Unoccupied Molecular Orbital EPA Environmental Protection Agency ESIS European chemical Substances Information System (ECB) EU European Union FHM Fathead minnow ITS Integrated (Intelligent) Testing Strategy HPV High Production Volume JRC Joint Research Centre Kow Octanol-water partition coefficient LC50 Lethal concentration to 50% of the test animals LOEC Lowest observed effect concentration MATC Maximum Acceptable Toxicant Concentration n Number of chemicals NOEC No Observed Effect Concentration OECD Organisation for Economic Cooperation and Development PNEC Predicted No-Effect Concentration QAAR Quantitative Activity-Activity Relationship QSAAR Quantitative Structure-Activity-Activity Relationship QMRF (Q)SAR Model Reporting Format (Q)SAR (Quantitative) Structure Activity Relationship REACH Registration, Evaluation, Authorisation & Restriction of Chemicals r2 Coefficient of determination RIP REACH Implementation Project TG Test Guideline s Standard error of estimate SMILES Simplified Molecular Input Line Entry System

CONTENTS 1. Introduction........................................................................................................1
1.1 REACH conditions regarding the use of (Q)SARs ...................................................... 2 1.2 REACH information requirements for aquatic toxicity ............................................... 3 1.3 Test methods for aquatic (pelagic) toxicity .................................................................. 4 1.4 Classification schemes for modes of toxic action ........................................................ 5
2. Sources of test data on aquatic toxicity..............................................................7 3. QSARs for acute toxicity to fish........................................................................8
3.1 QSARs for narcoses ..................................................................................................... 8 3.2 Global QSARs............................................................................................................ 12 3.3 QSARs for specific chemical classes and MOA ........................................................ 19
4. QSARs for Daphnia .........................................................................................22 4.1 QSARs for narcoses ................................................................................................... 22 4.2 Global QSARs............................................................................................................ 22 4.3 QSARs for specific chemical classes and MOA ........................................................ 25
5. QSARs for algae ..............................................................................................29 5.1 QSARs for narcoses ................................................................................................... 29 5.2 Global QSARs............................................................................................................ 29 5.3 QSARs for specific chemical classes and MOA ........................................................ 29
6. Quantitative activity-activity relationships ......................................................35 7. Expert systems .................................................................................................42 8. Integrated testing strategies..............................................................................48 9. Conclusions......................................................................................................56 10. References........................................................................................................59

1
1. Introduction Information on aquatic toxicity is required in order to assess hazard and risk of
chemical substances to marine and freshwater organisms living in the water column.
A detrimental effect of a chemical can be expressed in short term and/or long term
exposure. The short term (acute) toxicity is most often measured as a concentration,
which is lethal to 50% of the organisms (lethal concentration, LC50) or causes a
measurable effect to 50% of the test organisms (effective concentration, EC50). Long
term (chronic) toxicity is evaluated to assess the possible detrimental effect(s) of a
chemical on survival, growth and reproduction. Typical endpoints for chronic toxicity
include the no observed effect concentration (NOEC), lowest observed level
concentration (LOEC), and maximum acceptable toxicant concentration (MATC),
which is a geometric mean of the NOEC and LOEC. In risk assessment, one or more
of these endpoints is extrapolated to obtain a Predicted No Effect Concentration
(PNEC) for the aquatic compartment. This review focuses mainly on approaches for
predicting acute aquatic toxicity but the estimation of chronic toxicity is also
mentioned.
On 18 December 2006, the European Council and European Parliament adopted
legislation (EC 2006a, EC 2006b) for a new chemical management system called
REACH (Registration, Evaluation, Authorisation and Restriction of Chemicals). The
purpose of REACH is to ensure a high level of human health and the environment,
including the promotion of alternative (non-animal) methods for assessment of
hazards of substances, amongst others. Non-testing methods such as structure-activity
relationships (SARs) and quantitative structure-activity relationships (QSARs),
collectively refereed as (Q)SARs, are quoted are expected to be most useful for
substances most lacking in experimental data, such as those manufactured and
imported in low tonnages (e.g. between 1 and 10 tonnes per year). The (Q)SAR,
chemical category and read-across approaches are referred to in several places in the
REACH annexes, including Annex III (Criteria for substances registered in quantities
between 1 and 10 tonnes), Annex VI (Information requirements referred to in Article
10), Annexes VII–X (Standard information requirements for substances manufactured
or imported in quantities of 1 tonne or more, of 10 tonnes or more, of 100 tonnes or

2
more, and of 1000 tonnes or more, respectively). The key message in the annexes,
including Annex VI, is that all available data shall be assessed first before new tests
are carried out. Annex XI introduces general rules for adaptation of the standard
testing regime set out in Annexes VII to X, including (Q)SARs, grouping of
substances and read-across.
This review summarises different sources of ecotoxicological data, models and
approaches described in the literature that are available (free or commercial) for the
estimation of aquatic (pelagic) toxicity of chemical substances. This review builds on
an earlier literature survey carried out by the ECB (Lessigiarska et al, 2005) which
also describes literature-based QSAR models for acute aquatic toxicity (to aquatic
bacteria, protozoa, algae, hydrozoa, daphnids, fish and amphibians) as well as some
non-aquatic endpoints. The use of such approaches will facilitate the collection of
non-testing information for REACH and its application in Integrated Testing
Strategies (ITS) for aquatic toxicity is expected to lower the number of tests that need
to be performed for regulatory purposes.
1.1 REACH conditions regarding the use of (Q)SARs (Q)SARs for aquatic endpoints have been used for over 10 years, albeit in an ad hoc
manner, in the regulatory assessment of chemicals within the EU. Examples of the
historical use of (Q)SARs in hazard classification and in risk assessment are given in
Gallegos Saliner et al (2007) and in Tsakovska et al (2007), respectively.
Under REACH, the use of (Q)SARs is expected to be more frequent and consistent.
Annex XI of the REACH proposal states that results obtained from valid (Q)SARs
may indicate the presence or absence of a certain dangerous property. Results of
(Q)SARs may be used instead of testing when the following conditions are met:
• results are derived from a (Q)SAR model whose scientific validity has been established;
• the substance falls within the applicability domain of the (Q)SAR model; • results are adequate for the purpose of classification and labelling and risk
assessment; • adequate and reliable documentation of the method is provided.

3
With regard to validity, the OECD Principles for (Q)SAR validation (OECD, 2004)
are applicable. According to the OECD definition: “to facilitate the consideration of a
(Q)SAR model for regulatory purposes, it should be associated with the following
information: 1) a defined endpoint; 2) an unambiguous algorithm; 3) a defined
domain of applicability; 4) appropriate measures of goodness-of-fit, robustness and
predictivity; 5) a mechanistic interpretation, if possible.”
The principles for (Q)SAR validation identify the types of information that are
considered useful for the regulatory review of (Q)SARs under REACH. Guidance on
the practical interpretation of the OECD principles has been published by the ECB
(Worth et al., 2005) and the OECD (OECD, 2007). The REACH framework for using
(Q)SAR, grouping and read-across is described in Worth et al. (2007). The
requirement for adequate and reliable documentation on (Q)SARs prompted the
development of (Q)SAR Model Reporting Formats (QMRFs). For more information,
visit the website of the European Chemicals Bureau: http://ecb.jrc.it/qsar/qsar-tools).
1.2 REACH information requirements for aquatic toxicity
With respect to aquatic (pelagic) toxicity, Annex VII (1 tonne or more) requires
information on short-term toxicity testing on invertebrates (preferred species
Daphnia) and growth inhibition study on aquatic plants (algae preferred); Annex VIII
(10 tonnes or more) additionally requires short-term toxicity data on fish but the
registrant can consider long-term toxicity data instead of short term; Annex IX (100
tonnes or more) requires in addition long term toxicity data on invertebrates (preferred
species Daphnia) and long-term toxicity data on fish (both necessary unless already
provided as part of Annex VIII requirements); and Annex X (1000 tonnes or more)
includes long-term toxicity data on invertebrates and plants (unless already provided
as part of Annex IX requirements). Annexes VII and VIII also specify when the
studies do not need to be conducted, one scenario being the presence of mitigation
factors that indicate that the aquatic toxicity is not likely to occur.
Bearing in mind the REACH provisions, and especially Annex VI, which calls for
gathering of all existing available test data on a substance as well as collecting all
other available and relevant information (including information from (Q)SARs and
4
read-across), it seems that the in silico methods will play an important role for
indicating presence or absence of a hazardous property, which in certain cases will be
able to replace the results of animal tests for both hazard and risk assessment.
1.3 Test methods for aquatic (pelagic) toxicity
Information on aquatic toxicity may be acquired from studies performed according to
existing national and international guidelines, such as the EU testing methods and
OECD test guidelines (TGs) which refer to internationally agreed testing methods.
The complete list of OECD Guidelines for the Testing of Chemicals can be found on
the OECD website (http://www.oecd.org). Examples include TG 201 for 72-h growth
inhibition of algae; TG 221 for up to 14 days growth inhibition to Lemna sp.; TG 202
for up to 14 days acute immobilization Daphnia sp., TG 211 for 21 days reproduction
to Daphnia; 203 for 96-h acute toxicity to fish; TG 204 for 14 days prolonged toxicity
to fish, etc. For long-term toxicity to fish, REACH (Annex IX) recommends the fish
early-life stage (FELS) test (TG 210), fish short-term toxicity test on embryo and sac-
fry stages (TG 212), and fish juvenile growth test (TG 215). American Society for
Testing and Materials (ASTM) and International Organisation of Standardisation
(ISO) also offer standardised methods than could offer acceptable alternatives to
OECD guidelines. Experiments not carried out according to GLP or recognised
guidelines could also provide useful data, however these data should be particularly
assessed for their reliability, adequacy, relevance and completeness. Some so-called
"difficult" substances may require special attention in terms of generation of new data
or interpretation of existing data. Such substances might be associated with problems
of solubility (not dissolving in the water phase), bioavailability (irregular exposure
concentration for the duration of the test), and/or concentration measurement
(suitability of the analytical method). Examples of problematic properties include low
water solubility (typically below 1 mg/L), ionisation, ability to form complexes,
surface activity, colour, volatility, adsorption, abiotic or biotic degradation and
photodegradation.

5
1.4 Classification schemes for modes of toxic action
Various modes of toxic action (MOA) for chemicals in fish, extended to other aquatic
organisms, have been identified. Currently, the Verhaar scheme seems to be best
recognised and most extensively used. Verhaar et al. (1992) recognised four modes of
action associated with different structural classes: class I – inert chemicals, class II –
relatively inert chemicals, class III – reactive chemicals, and class IV – specifically
acting chemicals. Class I is typically associated with non-polar narcosis. Class II is
associated with polar narcosis. Class III summarises different types of reactive
chemicals, which in principle are difficult to model together but the net result of
reactivity in most cases is enhanced toxicity. Class IV is most often linked to
chemicals that act as acetylcholinesterase inhibitors or provoke central nervous
system effects. The Verhaar classification scheme is implemented in the Toxtree
software, available from the ECB website (http://ecb.jrc.it/qsar/qsar-tools).
The Verhaar classification system was challenged to predict the class of new
chemicals with measured toxicity data (validation data available from the paper). It
was observed that the system generally provides adequate predictions but additional
research is needed to refine the rules for classification of certain chemicals (Verhaar et
al., 2000). More specifically, the authors note that some compounds are slightly more
toxic than predicted. These were identified as small reactive compounds or
compounds amenable to biotransformation, with low log Kow values and high aqueous
solubility (e.g. 2,4-pentanedione from Class I, aniline and phenol from Class II,
acrolein, benzoquinone, and endothal from Classes III and IV). On the other end of
the spectrum are some compounds that are less toxic than predicted, especially in the
high log Kow range for Class I compounds (e.g. 1-nonanol, cyclododecatriene), and
the in mid-to-high log Kow range for Class III and IV chemicals. As an additional
reason for the appearance of outliers (both positive and negative), the species
sensitivity differences were noted. Even though the estimation methods are based on
data for P. promelas and P.reticulata, and the overlap in species between classes was
very high, there is still the need to extrapolate the prediction to fish in general.
Another problem with the Verhaar classification scheme is the appearance of a Vth
Class, for which classification could not be done for various reasons and this class
could be sizable compared to the data set of interest (about 30% in the case of the

6
validation study in Verhaar et al., 2000). However, the authors note that lots of the
unclassified chemicals belong to the chemical classes of organic acids and esters, for
which classification should be feasible. In a different set (100 randomly selected
discrete organic chemicals from EINECS), 50% of the chemicals remained
unclassified (our unpublished results) using the Toxtree software for classification. It
should be noted, however, that rules for specific mechanisms were not implemented
in v. 1.20 of Toxtree.
Russom et al. (1997) distinguish the uncoupling of oxidative phosphorylation,
respiratory inhibition, and electrophilic/nucleophilic reactivity mechanisms. The latter
can be further split for modelling purposes. The modes of action in ecotoxicology,
their role in body burdens, species sensitivity, QSARs and mixture effects were
critically reviewed by Escher and Hermens (2002). Recently, toxicogenomics was
emphasized as a potential useful methodology for MOA identification and
confirmation (Ankley et al., 2006).

7
2. Sources of test data on aquatic toxicity Information on test data can be found in various databases, some of which were
designed for storing ecotoxicity information (e.g. EAT, ECOTOX) whereas others are
more general (e.g. ESIS, OECD HPV database). The ECETOC Aquatic Toxicity
(EAT) database (ECETOC 2003a) contains ecotoxicity data for more than 600
substances, collected from the scientific literature starting from the 1970's. ECOTOX
is maintained by the US EPA and contains toxicity information on aquatic and
terrestrial organisms for more than 8400 chemicals. ESIS is hosted by the ECB. The
OECD HPV database was compiled in the framework of the OECD HPV Chemicals
programme. Information on aquatic toxicity can also be retrieved from the HERA
(Human and Environmental Risk Assessment) database, TOXNET, N-class, Riskline,
Canadian Priority Substances Lists, Japanese Ministry of Environment programs.
Links to some useful databases are given in Table 1.
Table 1. Databases containing information on the aquatic toxicity of chemicals Database and Provider Website ECOTOX Database
US EPA
http://cfpub.epa.gov/ecotox/
European chemical Substances Information System (ESIS)
EC-JRC-ECB
http://ecb.jrc.it/esis/
OECD HPV database
OECD
http://cs3-hq.oecd.org/scripts/hpv/
TOXNET
US National Library of Medicine
http://www.nlm.nih.gov/pubs/factsheets/toxnetfs.html
N-class database
KemI, Sweden
http://apps.kemi.se/nclass/
Riskline
KemI, Sweden
http://apps.kemi.se/riskline/
Canadian Priority Lists
Environment Canada
http://www.ec.gc.ca/CEPARegistry/subs_list/Priority.cfm

8
3. QSARs for acute toxicity to fish The models identified in the literature are classified in several groups:
• Models for narcoses; • Global QSARs (developed without respect of chemical class and MOA); • QSARs for specific chemical classes and MOA.
QSAR models for narcoses were considered separately since trey predict baseline
effect and were somewhat subject to more extensive modelling compared to other
MOA. The same model classification approach was applied to QSARs for Daphnia
and algae. If a paper describes modelling to two organisms from two or three tropic
levels, it was classified taking into account the higher species, if not possible to
separate the models.
Some approaches require combination of data for different trophic levels. Such an
approach is described in Jager et al. (2007). The authors proposed a mechanism-
oriented approach and introduced a method to decompose toxicity data in a
contribution from the chemical (potency) and from the exposed species
(vulnerability). They used a database for acute aquatic toxicity (4 algal species; 5
arthropods (Daphnia and other); 1 mollusc, 5 fish species, and one protozoon) and
focus on some well-defined chemical classes. The full data set is available upon
request from the authors. The results showed that the potency is strongly related to
hydrophobicity and vulnerability differences between species are small for narcotic
compounds. Potencies show less relation with hydrophobicity and interspecies
differences are larger for organophosphate and carbamate insecticides. Photosynthesis
inhibitors generally act narcotic to animals, but were more potent for algae. Using
potencies and vulnerabilities, acute toxicity values were well predicted by the
proposed approach (within a factor of 3–6) but it still better understanding of MOA.
3.1 QSARs for narcoses
Compared with other toxicological endpoints, the modes of toxic action in
ecotoxicology are relatively well understood, and consequently (Q)SARs for aquatic
toxicity endpoints tend to be mechanistically based. The narcosis mode of action is

9
associated with altered structure and function of the cell membranes. In a consensus
classification of 177 industrial chemicals more than 50% were classified as narcotics
(Pavan et al., 2005a).
Models for non-polar and polar narcosis (NPN and PN, respectively) were included in
the European Technical Guidance Document in support of Commission Directive
93/67/EEC on Risk Assessment for new notified substances, Commission Regulation
(EC) No 1488/94 on Risk Assessment for existing substances and Directive 98/8/EC
of the European Parliament and of the Council concerning the placing of biocidal
products on the market. Two models (one for NPN and one for PN), based on LC50
values of chemicals classified as non-polar [Eq. 1] and polar narcotics [Eq. 2], to P.
promelas (in mol/L, from 96-h test) were given there, as well as a model, estimating
NOEC to B. rerio.
log LC50 = -0.85 log Kow – 1.39 [1] n = 58, r2 = 0.94, q2 = 0.93, s = 0.36 log LC50 = -0.73 log Kow – 2.16 [2] n = 86, r2=0.90, q2 = 0.90, s = 0.33
The models were originally published by Verhaar et al. (1995), and were evaluated
with aim to test reproducibility and external predictivity by Pavan et al. (2005a). The
data for the training and test set chemicals are available from Pavan et al. (2005a).
The latter authors developed also a general narcosis model [Eq. 3] by combining the
training sets of the other two, with motivation to avoid uncertainty in discrimination
between NPN and PN. The QSAR model was defined by the developer to be
applicable to chemicals with octanol-water partition coefficient (log Kow) values in
range from -1.31 to 6.20. However, the model is not recommended for chemicals with
log Kow < 1 due to large error for both non-polar and polar narcotics. It works best in
the range 3 < log Kow < 6. The structural domain includes aliphatic and aromatic
hydrocarbons, halogenated aliphatic and aromatic hydrocarbons, ethers, alcohols,
aromatic nitro compounds, anilines and phenols (only when a presence of an
additional substituent on the benzene ring in case of phenols and anilines do not
change the mechanism of action).

10
Log LC50 = -0.81 log Kow – 1.74 [3] n = 144, r2 = 0.88, q2 = 0.87, s = 0.45
A quadratic function is used to describe the relationship between log Kow and the
toxicity, when the former varies in a large range or the training set includes chemicals
with log Kow above approximately 6. An equation of this type was used by Hermens
et al. (1984), to describe the relationship between the log Kow and the 24-day toxicity
of chemicals to guppy (P. reticulata, LC50 in µmol/L) for anilines and chloroanilines
[Eq. 4]:
Log (1/LC50) = -0.150 (log Kow )2 + 1.67 log Kow – 4.56 [4] n = 11, r2 = 0.89, s = 0.27
Similar equations can be found for fathead minnow in Veith et al. (1983), and for
sheepshed minnow in Zaroogian et al. (1985). The advantage of the quadratic models
compared to the linear ones is that the former account for decreasing toxicity above
certain hydrophobicity, while the latter predict continuously increasing toxicity with
increase of hydrophobicity. This can result in overestimation of toxicity for very
hydrophobic chemicals.
A log Kow-based model for baseline toxicity (narcosis type I, inert chemicals) for P.
promelas was given also by Russom et al. (1997) [Eq. 5]. The concentration is
calculated on molar basis (presumably mol/L) and data is from 96-h test with flow-
trough protocol.
Log LC50 = -0.94 log Kow + 0.94 log (0.000068 log Kow +1) – 1.25 [5] Associated statistics not provided but the data is published
Models for NPN [Eq. 6] and PN [Eq. 7] were developed also for P. reticulata (in
mol/L, from 96-h test). The models are taken from Roberts and Costello (2003). The
training set data are available.
Log LC50 = -0.84 log Kow – 1.12 [6] n = 8, r2 = 0.97, q2 = 0.96, s = 0.24, F = 199
Log LC50 = -0.76 log Kow – 2.00 [7] n = 11, r2 = 0.89, q2 = 0.84, s = 0.28, F = 72

11
QSARs for non-polar narcosis were developed by Lessigiarska et al. (2004), based on
the EU New Chemicals Database (NCD) chemicals. These include models to O.
mykiss (rainbow trout) [Eq. 8] and B. rerio (zebra fish) [Eq. 9]. LC50 is in mg/L, from
96-h tests for both species.
Log (1/LC50) = 0.47 log Kow – 3.28 [8] n = 34, r2 = 0.64, s = 0.50, F = 57
Log (1/LC50) = 0.35 log Kow – 3.07 [9] n = 19, r2 = 0.47, s = 0.45, F = 15
The limited goodness-of-fit, as presented by r2, could be due to the fact that for the
development of the models, concentration in mg/L was used instead of molar
concentration (practical difficulties for conversion observed), as well as the quality of
data. Data was collected from different laboratories, and probably obtained under
different experimental conditions.
Papa et al. (2005) developed multiple linear regression (MLR) models for NPN and
PN using different molecular descriptors and genetic algorithm (GA) for selection of
variables. The LC50 data set was taken from Russom et al. (1997). For NPN [Eq. 10],
the authors used log Kow calculated from ClogP program, while for PN [Eq. 11]
models they used AlogP values.
Log (1/LC50) = 0.72 log Kow – 0.13 ELUMO – 1.03 RARS + 2.6 [10] ntrain = 147, ntest = 116, r2 = 0.95, q2 = 0.95, q2
ext = 0.93, s = 0.28
The model for NPN demonstrates excellent statistical characteristics but the inclusion
of additional to log Kow descriptors could be questioned due to the fact that ClogP
octanol-water partition coefficient alone gives r2 = 0.92. Here, ELUMO stands for the
energy of the lowest unoccupied molecular orbital and RARS – R matrix average row
sum-GETAWAY, inversely related to molecular dimension.
Log (1/LC50) = 0.34 logKow + 0.82 BEHv3 + 0.18 nHDon – 0.65 C029 + 2.6 [11] ntrain = 57, ntest = 29, r2 = 0.90, q2 = 0.88, q2
ext = 0.84, s = 0.31

12
The model with AlogP octanol-water partition coefficient alone gives r2 = 0.77.
Therefore, the inclusion of additional parameter(s) might be beneficial for the increase
of predictivity, however the question is how the additional descriptors are better
selected – in an automated statistical way or empirically, even showing lower
goodness-of-fit. Here, BEHv3 means highest eigenvalue n.3 of Burden
matrix/weighted by the Van der Waals volumes, nHDon – number of donor atoms for
H-bonds), and C029 – atom centered fragment counting for groups derived from
carboxylic acid R–CX–X.
Yuan et al. (2007) developed a data mining scheme called "clustering first, and then
modelling" to build local QSAR models for the subsets resulted from clustering of the
training set according to structural similarity. The strategy includes: (1) clustering,
where the training set is clustered into subsets according to structural similarity with
an unsupervised pattern recognition technique; (2) classification, where the validation
and test set are classified by a supervised pattern recognition method; (3) modelling,
where local models for each subset were built; and (4) prediction, where the toxicity
of the test set was predicted by both the corresponding local models and the global
model and the performances of each model were evaluated. Hierarchical clustering
was employed for cluster analysis, k-nearest neighbour for classification, and partial
least squares (PLS) for the model generation, all algorithms being implemented in
Matlab. The authors found that the predictive performances of the local models based
on the subsets were much superior to those of the global model based on the whole
training set. The procedure is interesting from methodological point of view with
respect of combining different methods and techniques for data mining in an
automated workflow, however some proportionality between the problem (modelling
of 96-h baseline toxicity to P. promelas in this case) and complexity of the solution
should exists.
3.2 Global QSARs
A model based on hydrophobicity/electrophilicity approach (referred to as “response-
surface” model) for 96-h acute toxicity to P. promelas, developed for aromatic

13
narcotics as well as for non-specific (soft) electrophiles was proposed by Veith and
Mekenyan (1993) (redeveloped by Pavan et al.[2005b]):
Log LC50 = -0.57 log Kow + 0.45 ELUMO – 2.44 [12] n = 114, r2 = 0.78, q2= 0.76, s = 0.48
Where LC50 is in mol/L and ELUMO is the energy of the lowest unoccupied molecular
orbital (in eV). Models of this type were published later by other workers (Dimitrov et
al., 2003; Netzeva et al., 2005). Pavan et al. (2005b) performed a validation of Eq.
[12] with external data from the OECD Screening Information Data Set (SIDS),
which resulted in q2ext = 0.75 for 25 chemicals.
Huuskonen (2003) proposed a model for acute toxicity to P. promelas (fathead
minnow) in 96-h-assay based on electrotopological (E-state) indices of diverse data
set. The training set was available, and the algorithms allow redevelopment of the
model (Pavan et al., 2005b), to test the accuracy and transferability (LC50 in mol/L). It
was also validated with external set of 39 SIDS data (q2ext = 0.49). All data is
available.
Log LC50 = -0.916 – 0.194 SsCH3 – 1.707 SdsCH – 0.171 SssCH – 0.406 SsssCH – 0.200 SaasC – 0.332 SssssC – 0.054 SsNH2 – 0.058 StN + 0.951 SddsN – 0.080 SsOH – 0.029 SdO – 0.098 SsF – 0.168 SsCl – 0.236 SsBr [13] n = 121, r2 = 0.84, q2 = 0.68, s = 0.39, F = 40
Netzeva et al. (2005) published a number of multivariate models with log Kow and
various electronic descriptors for 96-h acute toxicity to P. promelas. LC50 was
converted from mg/L to mmol/L for the purposes of the study. The data set is listed in
Appendix 11. The hydrophobicity alone, after exclusion of outliers accounted for
about 65% of toxicity.
Log (1/LC50) = 0.700 log Kow – 0.720 [14] n = 560, r2 = 0.65, r2
CV = 0.65, s = 0.80, F = 1034
1 The use of this data set requires citation of the original paper.

14
Six statistical outliers to Eq. [14], all with positive standardised residuals greater than
3, were identified and excluded beforehand. These were strychnine, rotenone,
acrolein, allyl alcohol, malononitrile, and N-vinylcarbazole. Two outliers with
considerable negative residuals (4,4'-isopropylidenebis(2,6-dichlorophenol) and
tetrabutyltin) were also identified.
Netzeva et al. (2005) developed a series of multivariate MLR models with increasing
complexity by the best subset selection techniques (all possibilities combinations are
attempted and the model with highest r2 for a given number of descriptors is kept), as
well as two partial least squares (PLS) models. The best (according to r2) MLR
models with AM1 [15] and B3LYP [16] descriptors were:
log (1/LC50) = 0.452 log Kow – 95.29 PIrrmx – 19.89 FPSA_3H + 0.228 DN – 12.20 n = 568, r2 = 0.692, r2
CV = 0.685, s = 0.771, F = 316 [15]
log (1/LC50) = 0.563 log Kow – 0.227 ELUMO + 0.00223 DPSA_2Z - 0.778 Qp_mx – 0.535 n = 568, r2 = 0.689, r2
CV = 0.682, s = 0.775, F = 311 [16]
The descriptors, used in the two equations, are the following:
log Kow Octanol-water partition coefficient (calculated by Pallas v. 3.0)
PIrrmx Maximum self-polarisability considering all atomic sites r in a molecule
FPSA_3H Fractional positive surface area = PPSA / SA for 3H
DN Sum of the acceptor delocalisabilities of all atomic sites of type Y in a molecule
(Y = C, H, N, O)
ELUMO Energy of the lowest unoccupied molecular orbital
DPSA_2Z Difference in charged partial surface area = PPSA_YY – PNSA_YY (YY = 1,
1Z, 2, 2Z, 3, 3Z), YY = 2Z
Qp_mx Maximum positive atomic charge in a molecule considering all non-hydrogen
atoms
Papa et al. (2005) developed a general model for estimating acute toxicity to P.
promelas both with inclusion of logP [17] and without [18]. Descriptors were selected
using GA from a pool of about 1200 calculated descriptors. The experimental toxicity
data is available as supplementary material. In both models the goodness of fit (r2)
was about 0.8.

15
Log (1/LC50) = 0.56 log Kow + 0.34 DP03 + 20.8 H8m – 0.79 GATS1v – 1.59 R1v + 2.9 ntrain = 249, ntest = 200, r2 = 0.1, q2 = 0.81, q2
ext = 0.72, s = 0.334 [17]
Here, octanol-water partition coefficient was calculated as AlogP. DP03 means
Randic molecular profile n.03, H8m – H autocorrelation of lag8/weighted on atomic
mass, GATS1v – Geary autocorrelation of lag 1 weighted by the Van der Waals
volumes, and R1v – R autocorrelation of lag 1 weighted by the Van der Waals
volumes.
Log (1/LC50) = 0.91 WA + 6.2 Mv +0.08 H-046 + 0.22 nCb – 0.19 MAXDP – 0.33 nN – 2.54 ntrain = 249, ntest = 200, r2 = 0.1, q2 = 0.79, q2
ext = 0.71, s = 0.38 [18]
Here, WA is a topological descriptor representing the mean Weiner index, Mv the
mean atomic van der Waals volume, nCb the number of C sp2 in substituted
benzenes, H-046 the H attached to C-O sp3, MAXDP th maximal electrotopological
positive variation, and nN is the number of nitrogen atoms.
Pavan et al. (2006) developed a model for prediction of the acute toxicity towards the
fathead minnow (P. promelas). A dataset of 408 heterogeneous chemicals with 96-h
LC50 data was modelled by a diverse set of theoretical molecular descriptors using
multivariate linear regression (MLR) and Genetic Algorithm – Variable Subset
Selection (GA-VSS). Descriptors were calculated with DRAGON and Tsar software.
Particular emphasis was given to statistical validity and applicability domain. External
validation was performed by using OECD Screening Information Data Set (SIDS)
data for 177 High Production Volume (HPV) chemicals, and good results in
prediction were obtained (n = 49,q2ext = 84.4). Data are available.
Log LC50 = - 2.09 – 0.578 ALogP + 0.397 ELUMO – 0.147 S2K – 0.887 nRNH2 n = 408, r2 = 80.3, q2 = 80.1, s = 0.560, F = 410 [19]
where LC50 is the concentration (in moles per litre) causing 50% lethality in P.
promelas, after an exposure of 96 hours, AlogP is the octanol-water partition
coefficient calculated from the Ghose-Crippen logP model, ELUMO is the energy of the

16
lowest unoccupied molecular orbital, S2K is an extension of the Kier shape index
which accounts for the 2-path and nRNH2 is the number of the primary aliphatic
amine functional groups. The model was developed for organic aromatic compounds,
including alkyl, halogen benzenes, as well as similar substituents on phenols and
anilines considered to act by a number of different MOA. These include non-polar
and polar narcosis as well as unspecific electrophilicity.
Mazzatorta et al. (2005) applied a hierarchical QSAR approach for the prediction of
96-h acute toxicity of pesticides to O. mykiss (rainbow trout). Toxicological were
extracted from the U.S. EPA-Office of Pesticides Programs, International Center for
Pesticides and Health Risk Prevention, and the Federal Biological Research Center for
Agriculture and Forestry. A total of 282 chemicals, spanning a wide range of chemical
classes, were selected in this way after preliminary check of data for quality. A total
of 729 descriptors were calculated. The experimental toxicity data is available as
supporting information. Seven descriptors were selected by using GA (HACA-2 from
MOPAC, HOMO-LUMO energy gap, 3 vp – a connectivity index, HA dependent
HDSA-1 from Zefirov’s indices, 1XBETA polarisability, FHBCA fractional HBSA
(HBSA/TMSA) from MOPAC PC, and log Kow from EPIWin). It was coupled with
counter-propagation artificial neural network (CPNN) to derive non-linear models.
The model produced r2 of 0.81 for the training set (222 data points) and 0.79 for the
test set (52 data points). The reduced number of chemicals (274 from 282) is a result
of elimination of 8 chemicals in the descriptor calculation process.
Casalegno et al. (2006) used fragment-based QSAR approach is presented to correlate
LC50-96 h acute toxicity to O. mykiss (rainbow trout). The data set is the same used in
Mazzatorta et al. (2005), and was compiled under the DEMETRA EU funded project.
The approach exploits the possibility of prioritising fragments' contributions to
toxicity through generation of atomic centred units (ACUs). On the assumption that
one fragment might be mainly responsible for the molecular toxicity, a three-stage
modelling strategy was developed to select the most important moieties and to
establish their priorities at a molecular level. Quantitative toxicity prediction yielded
r2 of 0.85 for the training set (239 data points) and 0.75 for the test set (41 data
points). The main difficulty in the application of the fragment-based approach was the
diversity in the data set. More than 20 pesticide classes were presented: organotins,

17
organochlorines, organophosphates, carbamates, formamidines, terpenes, pyrethroids,
phenols, spinosyns, pyrroles, pyridazinones, benzoylureas, etc. Some of those classes
contained only one or two compounds and this hampers the straightforward
application of methods that demand structurally descriptive compounds to work
properly, such as fragment-based ones. The outcome of the DEMETRA modelling
process for pesticides and different organisms is presented in Amaury et al. (2007).
The authors report the results of a very extensive study, that aims to investigate the
influence of the descriptors and modelling technique on the predictivity of the models,
the development of a hybrid model, including classification and prediction steps, as
well as rules for restricting the domain and thus increasing the predictivity of the
hybrid system for deriving of conservative predictions for regulatory purposes using
O. mykiss data.
Furusujö et al. (2006) developed Partial Least Squares (PLS) regression provides
models and diagnostics that can be used to decide whether or not a substance is within
the model domain. QSAR models for four different environmental end-points (55
chemicals with 96-h LC50 to fish L. macrochirus, 45 chemicals with data with 48-h
EC50 to D. magna, 83 chemicals with EC50 to P. subcapitata, also know as S.
capricornutum, in growth rate inhibition test, and 93 chemicals with EC50 to V.
fischeri) were used to demonstrate the importance of appropriate training set selection
and how the reliability of QSAR predictions can be increased by outlier diagnostics
(supplementary data available from doi). All models showed consistent results and
test set prediction errors were very similar in magnitude to training set estimation
errors when prediction outlier diagnostics were used to detect and remove outliers in
the prediction data. The PLS models are not given in the text of the paper.
Sild et al. (2006) reported the application of a new system for open distributed
computing including analysis of delocalised and heterogeneous data sources, with
utilization of different software tools for data mining and engineering to ECOTOX
database. Even though details of the study are not provided, the paper is interesting
from methodological point of view.
Amini et al. (2007) reported a support vector inductive logic programming (SVILP),
which was applied to a heterogeneous set of 576 chemicals, tested to P. promelas
18
(available from DSSTox database). The SVILP approach learns rules, followed by
quantitative modelling. The first step is to prepare the background knowledge,
namely, the chemical fragments in the form of logic relations. The logic relations
identify the chemical fragments according to the atom and bond details. In addition to
background knowledge, the chemicals in the training set are classified into more toxic
(positives) and less toxic (negatives) according to the observed toxicities. ILP learning
can then be conducted using the background knowledge and the observations. The
software CProgol automatically learns the rules. The learned rules form the input for
quantitative prediction of toxicity. ILP could provide also insight into the cause of
toxicity for each chemical by analyzing the rules that were selected. Examples of
rules for high toxicity include: a phenyl group and an electron-donating group and
distance between them is 7.3 ± 1.0 Å; a hydrophobic atom and an electron-
withdrawing group and distance between them is 9.1 ± 1.0 Å; …number of chlorine
atoms greater than, or equal to 3.
Hewitt et al. (2007) studied consensus regression, as compared to single multiple
linear regression, models for the development of QSARs to several endpoints,
included acute toxicity to fish (P. promelas) and protozoa (T. pyriformis). Summary
of model equations is available as supporting information. For each data set, a genetic
algorithm was used to develop a model population and the performance of consensus
models was compared to that of the best single model. The authors concluded that the
increase in model complexity when using consensus models does not seem warranted
given the minimal improvement in model statistics.
Knauer et al. (2007) examined acute toxicity to fish hepatoma cell line PLHC-1 and to
juvenile rainbow trout for 18 plant diverse protection products with different
mechanism of action. The main objective was to explore whether hepatoma cells
could be used to predict acute toxicity in fish taking into account the mode of toxic
action and compound properties. Acute fish toxicity was determined using the OECD
guideline test 203 and compared to predicted baseline LC50 of acute fish toxicity
calculated with a quantitative structure–activity relationship (QSAR) derived for
guppy fish. Cytotoxicity was determined through the inhibition of neutral red uptake
(NR50) into lysosomes and compared to predicted baseline cytotoxicity derived for
goldfish GFS cells. In general, NR50 values were higher by a factor ranging from 3 to

19
3000 than the corresponding acute LC50. A weak correlation between NR50 and LC50
values was found (log/log: r2 = 0.62). Also the lipophilicity (log Kow) was not a good
predictor for cytotoxicity (r2 = 0.43) and lethality (r2 = 0.57) of these pesticides. The
authors concluded that the neutral red assay is detecting general baseline toxicity only.
Comparing LC50 data to QSAR results, the compounds can be classified to act as
narcotics or reactive compounds with a specific MOA in fish. The results indicated
limitation of the neutral red assay in predicting acute fish toxicity. A promising
alternative might be the assessment of toxicity in a set of in vitro systems addressing
also cell-specific functions which are related to the mode of toxic action of the
compound. A different approach could be also to combine measured in vitro data and
calculated descriptors of chemical structure, similar to the scenario, explored in Kahn
et al. (2007).
3.3 QSARs for specific chemical classes and MOA
Wong et al. (1997) published structure activity relationships for acute toxicity of
alcohol ethoxylate surfactants to 96-h toxicity to P. promelas. The concentrations in
the models are presumably in µmol/L:
Log LC50 = 4.35 – 0.34 (alkyl) + 0.05 (EO) [20] n = 9, r2 = 0.99
It was found that surfactant toxicity tends to increase with increasing alkyl chain
(alkyl), and decreasing average number of ethylene oxide (EO) groups.
Boeije et al. (2006) revisited the data for the same class (alcohol ethoxylates) and
same chemicals as above (n = 9). Two new QSARs for LC50 (mol/L) were proposed
in order to capture the three important parameters and avoid over-fitting (statistics is
the same). The authors propose also a model for chronic toxicity to P. promelas (not
given here).
Log LC50 = -0.60 log Kow – 2.48 [21] n = 9, r2 = 0.91, s = 0.06
Log LC50 = -0.32 C + 0.05 EO – 1.78 [22]

20
n = 9, r2 = 0.91, s = 0.06
Parkerton and Konkel (2000) developed QSARs for phthalate esters (PEs) that
describe aquatic toxicity for different freshwater and marine species. Results for low-
molecular-weight PEs with log Kow < 6 indicate that toxicity data conform to a simple
log Kow -dependent QSAR. Fish were found to be more sensitive than algae while
invertebrates spanned a wide range in toxicological response. Freshwater and marine
species demonstrated a similar distribution of sensitivities. Comparison of species-
dependent QSARs supported the hypothesis that biotransformation plays an important
role in explaining toxicity differences observed between species. Estimated critical
body residues (CBRs) for parent PE in fish were in the range reported for other polar
organic chemicals while CBRs for parent PE plus associated metabolites were in the
range reported for nonpolar narcotics (i.e., baseline toxicity) suggesting a possible
putative role of PE metabolites. Results for high-molecular-weight PEs (log Kow > 6)
indicated that these chemicals are not acutely or chronically toxic to freshwater or
marine organisms due to the combined role of low water solubility and limited
bioconcentration potential which precludes attainment of internal concentrations that
are required to elicit adverse effects. The QSARs are not provided in mathematical
form but the study is a good example for application of integrated approach for filling
data gaps and PNEC derivation from available test and estimated data.
Zvinavashe et al. (2006) collected fifteen literature datasets for acute toxicity of
substituted (mono)nitrobenzenes to algae, daphnids, fish, protozoa, bacteria, and
yeast. The logarithm of the octanol/water partition coefficient, log Kow, and ELUMO,
were used as descriptors. QSAR models (0.65 < r2 < 0.98) were developed to predict
acute toxicity of substituted mononitrobenzenes to the aquatic organisms. The log Kow
was a sufficient descriptor for all cases, with the additional Elumo descriptor being
required only for algae. The QSARs were found to be valid for neutral substituted
mononitrobenzenes with no -OH, -COOH, or -CN substituents attached directly to the
ring. The data are available as supplementary material. The models for 96-h toxicity
to C. carpio [23] and 14-d P. reticulata [24] are given below (LC50 in µmol/L):
Log LC50 = -0.520 log Kow + 4.40 [23] n = 11, r2 = 0.62, s = 0.283, F = 14.6

21
Log LC50 = -0.628 log Kow + 3.52 [24] n = 18, r2 = 0.69, s = 0.27, F = 35.6
Lo Piparo et al. (2006) reported MLR and neural net models for 10 benzoxazinone
allelochemicals with atom and field-based descriptors. The chemicals are described as
natural pesticides produced by the plants at stress or damage. The group is of interest
because could be natural alternative to pesticide production. The endpoint is 48-h
EC50 to D. magna. The models are not explicitly given in the paper.

22
4. QSARs for Daphnia
4.1 QSARs for narcoses
Two log Kow-based QSARs for immobilization of Daphnia, expressed as 48-h EC50,
were proposed by Verhaar et al. (1995): one for NPN [25] and one for PN [26]. These
are listed below (concentrations in mol/L):
Log EC50 = -0.95 log Kow – 1.32 [25] n = 49, r2 = 0.95, q2 = 0.94, s = 0.34
Log EC50 = -0.56 log Kow – 2.79 [26] n = 37, r2 = 0.77, q2 = 0.73, s = 0.37
Lessigiarska et al. (2004) published a QSAR for non-polar narcosis to D. magna (48-h
immobilisation test, EC50 in mg/L) based on the EU NCD chemicals. Out of 156
chemicals with available data for this endpoint, 56 chemicals were classified as NPN.
Log (1/EC50) = 0.376 log Kow – 2.95 [27] n = 56, r2 = 0.54, s = 0.64, F = 63
Von der Ohe et al. (2005) proposed similar models for 48-h mortality test
(concentrations in mol/L) for NPN [28] and PN [29]:
Log LC50 = -0.86 logKow – 1.28 [28] n = 36, r2 = 0.90, q2 = 0.94, s = 0.44, F = 311
Log LC50 = -0.80 log Kow – 2.21 [29] n = 33, r2 = 0.74, q2 = 0.94, s = 0.45, F = 90 (without anilines)
4.2 Global QSARs
Faucon et al. (2001) collected acute Daphnia toxicity data for 96 substances from 297
notification files about new chemicals, stored at the French Department of
environment. This was further split into training (n = 61) and test set (n = 35).
Unfortunately, the chemical structures are confidential. Presumably, 48-h EC50 values

23
from immobilization test were collected (concentration in mol/L). The best two-
parameter equation from a pool containing log Kow, steric and electronic descriptors,
was built with the hydrophobicity parameter and the descriptor hardness [Ha = ½
(EHOMO-ELUMO)]. The authors noted that further increase in the number of descriptors
was accompanied by very weak increase of q2. The outliers were carefully analysed
and the model was validated with external test set of 30 chemicals randomly collected
from AQUIRE.
Log LC50 = -0.57 log Kow + 0.45 ELUMO – 2.44 [30] n = 61, r2 = 0.54, q2 = 0.49, s = 0.71
Tao et al. (2002) developed quantitative relationship between the median effective
concentration (48-h EC50) of organic chemicals to Daphnia magna and the number of
molecular fragments was investigated based on experimental EC50 values for 217
chemicals derived from the literature (data set seems unavailable). A fragment
constant model (r2 = 0.96) was developed based on a multivariate linear regression
between the number of fragments and the logarithmically transformed reciprocal
values of EC50 (units not clear). Functional correction factors were introduced into the
model. The model was verified using an independent set of randomly selected data.
The mean residual of the final model was 0.4 log-units. The model seems transparent
but complex, which hampers the reproduction.
Von der Ohe et al. (2005) performed an extensive literature search for toxicity data to
Daphnia from AQUIRE database. D. magna was the preferred species. The authors
found a total of 349 substances with at least one data point but those with LC50 that
exceeded the water solubility were excluded from the analysis and 300 substances
remained in the data set. More than 70 chemicals were associated with mortality data
to other Daphnia species (e.g. D. pulex, dubia, macrocopa, pulicaria, carinata, and
laevis). The data is available from the paper and provided in Appendix 22. The study
aimed at developing a pragmatic approach to discriminate excess toxicity from
narcotic effect levels and three discrimination schemes were presented. The
2 The use of this data set requires citation of the original paper.

24
discussion includes reaction mechanisms that can explain excess toxicity and
structural alerts are provided in transparent form.
Toropov and Benfenati (2006) examined three types of local graph invariants, the
vertex degrees (0EC), the extended connectivity of first order (1EC), and the numbers
of paths of length two (P2), as elementary invariants for construction of quantitative
structure–activity relationships (QSAR). The authors examined also combined
invariants, obtained by multiplying one of these three elementary types with another
(i.e., [0EC · 1EC], [0EC · P2], and [1EC · P2]), as graph invariants. Finally, global
(weighted) invariants were used in the QSAR analyses, codifying the presence and
nature of cycles in the molecular structures under consideration. These descriptors
have been used in one-variable models to predict toxicity toward 96-h LC50 (mmol/L)
to D. magna for a set of 262 pesticides (data are available from the paper). The
algorithm for calculation of descriptors and their role was discussed. The best model
was based on the correlation weight of local topological parameters (the [0EC · P2])
together with the global topological parameters
Log (1/LC50) = -226.3 + 227.5 0XCW(ak, [0ECk . P2k], CC) [31] n = 220, r2 = 0.7822, s = 0.849, F = 783 (training set) n = 42, r2 = 0.7388, s = 0.941, F = 113 (test set).
Amaury et al. (2007) developed a complex hybrid model for the prediction of the
acute toxicity of pesticides to Daphnia. The analysis of the possible outliers with data
mining tools resulted in a compilation of number of structural and physico-chemical
rules that lead to false negative predictions, for daphid as well as for fish. The
implementation of these rules in a software such as Toxtree will extremely useful for
identifying (a mixture of) reactive and specifically acting compounds, wich are
relatively underpredicted in the implementation of the original Verhaar classification
scheme. One can argue whether or not test data for one species only can cover the
toxicity to the whole taxa and whether there is commonality between structural alerts
for fish and daphnid. The latter is a task that deserves investigation on its own,
bearing in mind that the chemical sets with experimental data are limited in size and
diversity but there is a commonality in the toxic MOA, most often irrespectively of
the test organism. Nevertheless, the pesticide data set provides a kind of a worst case
scenario as a training set, including biologically active chemicals that were used

25
exactly for this purpose as pesticides. Therefore, the rules derived from it could be
seen as most demanding when screening for chemical and biological activity.
4.3 QSARs for specific chemical classes and MOA
Wong et al. (1997) published structure activity relationships for acute toxicity of
alcohol ethoxylate surfactants to 48-h toxicity to D. magna. The concentrations in the
models are presumably in µmol/L:
Log LC50 = 4.23 – 0.38 (alkyl) + 0.10 (EO) [32] n = 9, r2 = 0.96
Boeije et al. (2006) proposed new models for the same class (alcohol ethoxylates) and
same chemicals as above (n = 9), referring to the rule of thumb that for each
parameter to be fitted, about five data points should be available. Both new QSARs
are in agreement with the understanding that with increase of log Kow or alkyl chain,
the EC50 decreases (chemical more toxic). The contribution of the EO units to toxicity
(EC50 in mol/L) in the new QSAR was found almost identical to that in Wong et al.
(1997). The authors also propose a model for chronic toxicity to D. magna (not given
here).
Log EC50 = -0.58 log Kow – 2.70 [33] n = 9, r2 = 0.87, s = 0.30
Log EC50 = -0.32 C +0.12 EO – 2.26 [34] n = 9, r2 = 0.85, s = 0.23
Marchini et al. (1999) investigated the acute toxicity of aryl- and benzylhalides to D.
magna. Halobenzenes and halotoluenes are generally agreed to be unambiguous
baseline toxicants (class I) with the major exception of the benzylic structures, which
are reactive in fish tests (class III). Eighty-nine percent of the arylhalides tested in this
study matched a log Pow-dependent QSAR, including fluorinated, chlorinated,
brominated, and iodinated derivatives, thereby confirming the validity of the baseline
models also for variously halogenated compounds (other than only-chloro
compounds). On some occasions, the assignment to the two classes in D. magna

26
deviates from the structural rules derived from fish, i.e., iodinated compounds as well
as α,α-dichlorotoluenes. The QSARs derived on all tested data (1,3,5-trichlorotoluene
excluded, data are available) revealed lower slopes and higher intercepts than typical
baseline models, indicating that different ways to produce baseline toxicity could be
possible. The 48-h EC50 (immobilization) to Daphnia [35] is in (µmol/L):
Log (1/EC50) = 0.65 log Kow – 3.2 [35] n = 23, r2 = 0.74, s = 0.23, log Kow range = 2.89 to 5.18
Liu et al. (2003) measured acute toxicity (48 h–EC50, µmol/L) of 20 α-substituted
phenylsulphonyl acetates using Daphnia magna with a static method (data are
available). On a basis of physicochemical parameters (log Kow and aqueous solubility
log SW) linear models were developed. Charge model descriptors QSARs were also
calculated. For the models with the physicochemical parameters log Kow and log SW,
the low squared correlation coefficients (n = 20, r2 = 0.69 and r2 = 0.50, respectively)
indicated that hydrophobicity plays a dominant role for the toxicity but
hydrophobicity is not the only factor that influences the activity. The high activity of
the compounds was explained with the disruption of van der Waals interactions
between lipid and/or protein compounds within the membrane and the possibility of
the compounds to form hydrogen bonds with the receptor molecules. The log Kow
model [36] is listed below:
Log EC50 = -0.193 log Kow + 2.384 [36] n = 20, r2 (adj) = 0.668, s = 0.139, F = 39
Davies et al. (2004) reported a log Kow -based QSAR for quaternary alkylammonium
sulfobetains (zwitterions) to D. magna (48-h OECD 202 Guideline). Log Kow was
also measured using reverse-phase high performance liquid chromatography (data is
available). The measured in immobilization test EC50 (mmol/L) was modelled by
[37]:
Log (1/EC50) = 0.61 log Kow + 2.69 [37] n = 16, r2 = 0.87, s = 0.36, F = 94
On comparison with other QSARs, the authors argued that the quaternary ammonium
chemicals are polar narcotics.

27
Hodges et al. (2006) developed QSARs for the acute aquatic toxicity of the anionic
surfactants linear alkylbenzene sulphonates (LAS) [38] and ester sulphonates (ES)
[39] to D. magna, the aim being to investigate the modes of action by comparing the
QSARs for the two types of surfactant. The generated data for ES have been used to
develop a QSAR [39] correlating toxicity with calculated log Kow (48-h EC50 in
mol/L, data available):
Log(1/EC50) = 0.77 log Kow + 2.47 [38] n = 6, r2 = 0.99, s = 0.08
Log(1/EC50) = 0.78 log Kow + 1.37 [39] n = 21, r2 = 0.90, s = 0.26
The latter equation [39] has an intercept 1.1 log units lower than a QSAR for linear
alkylbenzene sulphonates [38]. The findings suggest that either ES surfactants act by a
different mode of action to LAS and other anionic surfactants. The authors suggest
that, unlike other anionic surfactants, which behave as polar narcotics, ES behave with
a similar MOA to non-ionic surfactants, e.g. general narcosis. However, it also
possible that he log Kow calculation method introduces a systematic overestimate
when applied to ES.
Zvinavashe et al. (2006) developed three hydrophobicity-based QSARs for substituted
(mono)nitrobenzenes (OH, COOH, CN, NO2, and C6H5 excluded) to Daphnia. The
endpoints are concentration immobilising 50% of the population (48-h IC50, µmol/L)
to D. magna [40] and lowest rejected concentration (21-d LRCT, µmol/L) that
significantly (p < 0.01) lowered the mean length of daphnid (D. magna) [41]. The
model for D. carinata is not given here due to the low coefficient of determination (n
= 12, r2 = 0.22).
Log IC50 = -0.626 log Kow + 3.49 [40] n = 15, r2 = 0.55, s = 0.24, F = 15.8
Log LRCT = -0.809 log Kow + 3.59 [41] n = 15, r2 = 0.65, q2 = 0.52, s = 0.25, F = 23.9

28
A model for 21-d EC50 to D. magna was also developed. For explanation of the
endpoint a consultation with a cited (original) paper is needed.

29
5. QSARs for algae
5.1 QSARs for narcoses
A log Kow-based QSAR for growth inhibition to algae (S. capricornutum), expressed
as 72-96-h EC50, was proposed by Van Leeuwen et al. (1992) (concentrations in
mol/L) for NPN:
Log EC50 = -1.00 log Kow – 1.23 [42] n = 10, r2 = 0.93, q2 = n.d., s = 0.17
Worgan et al. (2003) reported NPN [43] and PN [44] models for EC50 obtained in a
novel 15-min algal (C. vulgaris) assay. EC50 is reported in mmol/L.
Log (1/EC50) = 1.04 log Kow – 3.28 [43] n = 10, r2 = 0.96, q2 = 0.95, s = 0.27, F = 206
Log (1/EC50) = 0.641 log Kow – 1.91 [44] n = 10, r2 = 0.88, q2 = 0.84, s = 0.16, F = 69
5.2 Global QSARs
Global QSARs for algae were not identified in this review.
5.3 QSARs for specific chemical classes and MOA
Schmitt et al. (2000) determined proliferation toxicity of 19 nitrobenzenes toward the
algae S. vacuolatus in a 24-h one-generation reproduction assay. The resultant EC50
(presented in mol/L, data are available) values covering more than 4 orders of
magnitude were subjected to a QSAR analysis using hydrophobicity in terms of log
Kow, and calculated quantum chemical descriptors of molecular reactivity. For 13
mononitro-derivatives and the highly hydrophobic trifluralin, a narcotic-type mode of
action can explain most of the toxicity variation [45].

30
Log EC50 = -1.02 log Kow – 2.02 [45] n = 14, r2 = 0.78, s = 0.39, F = 42
Adding ELUMO yields a highly significant QSAR for 18 compounds (highly acidic
picric acid was excluded):
Log EC50 = -0.61 log Kow + 1.60 ELUMO – 1.19 [46] n = 18, r2 = 0.89, s = 0.42, F = 61
Eq. [46] can be further improved when adding the maximum net atomic charge at the
nitro nitrogen, qnitro-N, as the third descriptor (n = 18, r2 = 0.92). The best equation (n
= 19, r2 = 0.92) was developed with octanol-water distribution coefficient (log Dow –
accounting for ionization, instead of log Kow), ELUMO and qnitro-N (Eq. 47). Deviations
from the narcosis MOA are explained with ionization, stepwise biotransformation
(reduction) to aromatic amines, and possibility for redox-cycling.
Log EC50 = -0.55 log Dow + 1.69 ELUMO – 34.3 qnitro-N + 18.4 [47] n = 19, r2 = 0.95, s = 0.32, F = 84
Lu et al. (2000) reported measured 48-h toxicity of 40 substituted benzenes (nitro-,
chloronitro-, dinitro-, anilines and phenols) to the alga S. obliquus in a growth
inhibition assay. Data are available, concentration in mol/L. ELUMO was calculated
with AM1 method in MOPAC.
Log (1/EC50) = 0.272 log Kow – 0.659 ELUMO + 2.54 [48] n = 40, r2 = 0.79, s = 0.32, F = 71
Yan et al. (2005) studied 25 nitrobenzenes with density functional theory (DFT)
methods (B3LYP) to derive QSARs. The endpoint modelled was EC50 to alga S.
obliquus (duration and type of the test not found in the paper, probably 48-h growth
inhibition). Data are available, concentration in mol/L.
Log (1/EC50) = 0.668 log Kow + 2.31 [49] n = 18, r = 0.90, s = 0.16, F = 72 for mononitroaromatic compounds only

31
Log (1/EC50) = 4.63 QNO2 – 26.5 ELUMO + 2.92 [50] n = 25, r = 0.85, s = 0.29, F = 29
Log (1/EC50) = 6.48 QNO2 – 25.1 ELUMO + 3.75 [51] n = 22, r = 0.93, s = 0.21, F = 57 2,4-dinitroaniline, nitrobenzene and 2,4-dinitrophenol excluded
Zvinavashe et al. (2006), developed several QSARs for substituted
(mono)nitrobenzenes (OH, COOH, CN, NO2, and C6H5 excluded) to algae. The
models for short term data (e.g. 15-min) are not included here. The endpoints in the
listed QSARs are 96-h EC50 to C. pyrenoidosa [52, 53], 48-h EC50 to S. obliquus [54],
and 96-h LC50 to S. obliquus [55, 56] (all concentrations in µmol/L). The authors
found that ELUMO generally improves the QSARs for algae, which was not found for
fish and daphnids.
Log EC50 = -1.07 log Kow + 4.48 [52] n = 15, r2 = 0.64, s = 0.33, F = 23.1
Log EC50 = -0.589 + 1.450 ELUMO + 4.94 [53] n = 15, r2 = 0.80, q2 = 0.60, s = 0.26, F = 24.1
Log EC50 = -0.360 + 0.645 ELUMO + 3.77 [54] n = 15, r2 = 0.83, q2 = 0.76, s = 0.17, F = 29.7
Log LC50= -0.567 log Kow + 3.49 [55] n = 13, r2 = 0.80, q2 = 0.70, s = 0.19, F = 42.7
Log LC50 = -0.349 + 0.652 ELUMO + 3.75 [56] n = 13, r2 = 0.82, q2 = 0.71, s = 0.18, F = 23.5
Escher et al. (2006) analysed non-target effects of β-blockers with a screening test
battery non-specific, receptor mediated and reactive modes of action. The aquatic tests
include 30-min V. fischeri test and 24-h fluorescence test with the alga D. subspicatus.
For QSAR modelling, liposome-water distribution ratio at pH = 7 was measured. The
authors concluded that all studied β-blockers were baseline toxicants but based on
photosynthesis inhibition efficiency to algae, the compounds were 10 times more
toxic than their modelled baseline toxicity.

32
Chen and Lin (2006) reported application of a closed system for algal toxicity test of
chlorophenols to P. subcapitata. The dissolved oxygen production and the growth rate
based on cell density were the response endpoints. Phenol and seven chlorophenols
were tested using the above test technique. Median effective concentrations (EC50)
range from 0.004 to 25.93 mg/l (based on DO production) and 0.0134 to 20.90 mg/l
(based on growth rate). NOEC was also defined. The growth rate was found more
sensitive response endpoint than the oxygen production, except for the case of
pentachlorophenol. However, the differences in sensitivity between the two
parameters were marginal. The new test method was argued more sensitive than the
conventional algal batch tests. The results of the study indicated that the toxicity data
of volatile organic chemicals derived by conventional algal toxicity tests may severely
underestimate the impact of these toxicants. The results also showed that alga is very
sensitive to chlorophenols compared to other aquatic organisms such as the
luminescent bacteria (the Microtox test), D. magna, and rainbow trout. Two log Kow–
based QSARs are given in the paper and pKa also shows to be a good predictor of
toxicity. The units used in the QSARs are not clear but the data are available so the
models can be reproduced from raw data.
Log (1/EC50)oxygen demand = 1.30 log Kow + 0.83 [57] n = 8, r2 = 0.93
Log (1/EC50)growth rate = 1.16 log Kow + 1.33 [58] n = 8, r2 = 0.96
Chen et al. (2007) developed QSARs for anilines, supposedly acting by polar
narcosis. As an endpoint, they measured both dissolved oxygen production (DO) and
algal growth rate EC50 to C. subcapitata (the data is available). Both tests revealed
similar sensitivity of the alga to the effects of the anilines. The log Kow models for the
two endpoints (EC50 in mmol/L) are:
Log (1/EC50)oxygen demand = 1.14 log Kow – 1.77 [59] n = 19, r2 = 0.86, q2 = 0.83, s = 0.37, F = 131
Log (1/EC50)growth rate = 0.946 log Kow – 1.10 [60] n = 20, r2 = 0.75, q2 = 0.72, s = 0.50, F = 55

33
These models were improved by inclusion of ELUMO:
Log (1/EC50)oxygen demand = 0.588 log Kow – 1.33 ELUMO – 0.24 [61] n = 19, r2 = 0.92, q2 = 0.87, s = 0.33, F = 87
Log (1/EC50)growth rate = 0.24 log Kow – 1.97 ELUMO + 0.81 [62] n = 18, r2 = 0.88, q2 = 0.82, s = 0.37, F = 57
Two chemicals, 4-chloroaniline and 3,4-dimethylaniline, were found as outliers. An
interesting observation was made on species sensitivity to anilines. They found that
for various aquatic organisms, the relative sensitivity relationship for anilines is D.
magna > V. fischeri ≥ P. reticulata ≥ P. subcapitata ≥ P. promelas > T. pyriformis.
The susceptibility of P. subcapitata to anilines is similar to fish, but P. subcapitata is
apparently less sensitive than the water flea. The lack of correlation between the
toxicity revealed by different aquatic organisms (microalgae, D. magna, V. fischeri,
and P. reticulata) suggests that anilines might have different metabolic routes in these
organisms.
Chen and coworkers (Chen et al., 2007; Huang et al, 2007) performed toxicity testing
of various nitriles to P. subcapitata using a closed algal toxicity testing technique with
no headspace. Two different response endpoints, i.e., dissolved oxygen (DO)
production and algal growth rate, were used to evaluate the toxicity of nitriles. In
general, the DO endpoint revealed higher inhibitory effects than that from algal
growth rate. Halogen-substituted nitriles were found to be extremely toxic to P.
subcapitata. With increasing numbers of the halogen atoms, higher toxicity was
observed. The bromine substitutent also seems to be more toxic than chlorine
substitutent. QSARs were established based on the chemicals’ ELUMO values and
hydrophobicity (log Kow). For various aquatic organisms, the relative sensitivity
relationship is: P. promelas > P. subcapitata > T. pyriformis > D. magna>
luminescent bacteria (Microtox). The alga, P. subcapitata, was found to be quite
sensitive to nitriles compared to other organisms.
The correlations with log Kow alone for benzonitriles were relatively poor. However,
reasonable correlations between 48-h EC50 (mmol/L) and ELUMO were observed.
Log Kow was almost forced in the models after exclusion of outliers.

34
Log (1/EC50)oxygen demand = -51.8 ELUMO – 1.70 [63] n = 12, r2 = 0.85, q2 = 0.78, F = 58
Log (1/EC50)growth rate = -53.7 ELUMO – 1.90 [64] n = 12, r2 = 0.85, q2 = 0.77, F = 58
Log (1/EC50)oxygen demand = 0.0056 log Kow – 52.14 ELUMO – 1.51 [65] n = 10, r2 = 0.92, q2 = 0.81, F = 41 (acetonitrile and benzonitrile excluded)
Log (1/EC50)growth rate = 0.19 log Kow – 47.2 ELUMO – 1.65 [66] n = 9, r2 = 0.92, q2 = 0.51, F = 37 (acetonitrile, benzonitrileand bromoacetonitrile excluded)

35
6. Quantitative activity-activity relationships Many quantitative activity-activity relationships (QAARs) have been published in the
literature, although they have not been widely used in regulatory assessments. They
are generally based on the premise that the chemicals might have the same mechanism
of action across the species from different levels, although there might be more or less
apparent exceptions. For example, the proelectrophiles (i.e. chemicals that become
activated in vivo) might exhibit different toxicities depending on the compostion of
the enzyme system in the test species. Chemicals active in the Central Nervous
System will probably show excess toxicity in fish but could be narcotics in
microorganisms. The anilines are considered to be narcotics to fish but are more toxic
to Daphnia (Urrestarazu Ramos et al, 2002). It was also noted (Bearden and Schultz,
1998) that the goodness-of-fit might be excellent for some mechanisms (e.g. different
narcoses types) and can be relatively poor for other mechanisms (e.g. Schiff-base
formation or Michael-type acception), to complete lack of correlation for
proelectrophilicity. These examples show that QAARs should be applied with caution
and with awareness for possible exceptions.
There are several sources of non-standard data are frequently used to predict toxicity
to higher species. The acute toxicity to the unicellular ciliate T. pyriformis is often
used to predict acute toxicity to fish. Cronin et al. (1991) developed a relationship
between 96-h LC50 to P. promelas and 48-h IGC50 for T. pyriformis, for a diverse set
of 70 chemicals. Both toxicities are in mmol/L.
Log (1/LC50) = 0.99 log (1/IGC50) + 0.35 [67] n = 74, r2 = 0.81, s = 0.44, f = 307
This relationship was extended later to 256 chemicals.
Log (1/LC50) = 0.98 log (1/IGC50) + 0.57 [68] n = 256, r2 = 0.74, q2 = 0.73, s = 0.63, F = 707
Recently, Kahn et al. (2007) probed this correlation for 364 chemicals:

36
Log (1/LC50) = 1.00 log (1/IGC50) + 0.56 [69] n = 364, r2 = 0.75, q2 = 0.75, s = 0.642, F = 1109
Exclusion of 6 outliers (2-propen-1-ol, 2-propyn-1-ol, allyl methacrylate, N-
vinylcarbazole, 4-nitroaniline and diethanolamine) improved even more the
correlation:
Log (1/LC50) = 1.02 log (1/IGC50) + 0.54 [70] n = 358, r2 = 0.81, q2 = 0.80, s = 0.57, F = 1465
Kahn et al. (2007) developed further quantitative structure-activity-activity
relationships by adding calculated descriptors to the QAAR to improve the last
equation but the improvement increases also the complexity of the solution.
Toxicity to T. pyriformis was correlated also to the toxicity of other fish, such as 96-h
LC50 to P. reticulata (Seward et al., 2002). LC50 and IGC50 are in mmol/L.
Log (1/LC50) = 1.05 log (1/IGC50) + 0.56 [71] n = 124, r2 = 0.85, s = 0.42, F = 682
Dimitrov et al. (2004) proposed a generic interspecies quantitative model that can be
used to predict the acute toxicity of aldehydes to most species of aquatic organisms.
The model is based on the flow-through LC50 to P. promelas combined with other
selected fish acute toxicity data and on the static ciliate IGC50 to T. pyriformis data.
The toxicity of Schiff-base acting aldehydes was defined using hydrophobicity, as the
calculated log 1-octanol/water partition coefficient (log Kow), and reactivity, as the
donor delocalizability for the aldehyde O-site (DO-atom). The fish model [72]
compared favourably with the ciliate model [73]
Log 1/LC50 = −2.50 + 0.48 log Kow + 18.98 DO-atom [72] n = 62, r2 = 0.62, s2 = 0.24, F = 48.0, q2 = 0.59
Log 1/IGC50 = −0.985 + 0.53 log Kow + 11.37 DO-atom [73] n = 81, r2 = 0.651, s2 = 0.147, F = 72.9, q2 = 0.626.
37
The fish and ciliate surfaces appeared to be parallel, because they deviate significantly
only by their intercepts. These observations lead to the development of a global
QSAR for aldehyde aquatic toxicity (all concentrations are in mol/L):
Log E−1 = bOrganismE + 0.505 log Kow + 14.31 DO-atom [74] n = 143, r2 = 0.698, s2 = 0.187, s2Fish = 0.244, s2Ciliate = 0.149, F = 98, q2 = 0.681
This approach allows mixing of available toxicity data for development of more
general models instead of series of species specific models on the assumption that
chemicals acting by the same mechanism differ only with regard to the intercept in the
QSARs.
A number of correlations between acute toxicity to algae, Daphnia and fish are given
in Lessigiarska et al. (2004). Unfortunately, the goodness-of-fit in some models is not
good enough for all models to be recommended. Two of the models, however show
acceptable statistical performance and allow to estimate 96-h LC50 to B. rerio from
72-h EC50 to S. capricornutum (reduction in growth bioassay) [75] and 96-h LC50 to
O. mykiss from 48-h EC50 to Daphnia [76]. Eq. [76] is trustworthy because of the
large number of chemicals included despite the relatively low regression coefficient.
Outliers were not removed in this study. The concentrations in both equations are
expressed in mg/L.
Log (1/LC50) = 1.00 log (1/EbC50) – 0.50 [75] n = 21, r2 = 0.67, s = 0.55, F = 39
Log (1/LC50) = 0.77 log (1/EC50) – 0.27 [76] n = 360, r2 = 0.67, s = 0.63, F = 709
Cronin et al. (2004) developed a novel rapid and economic 15-min algal (C. vulgaris)
toxicity test (data are available). QAARs to other species were developed. The
correlation with 48-h IGC50 T. pyriformis data was particularly good [77], shortly
followed correlation to fish (96-h LC50 P. promelas, data are available, concentrations
in mmol/L). The QAAR with V. fischeri is not given here due to the lower coefficient
of determination (n = 50, r2 = 0.58).

38
Log (1/IGC50) = 0.696 log (1/EC50) + 0.551 [77] n = 69, r2 = 0.86, q2 = 0.85, s = 0.40, F = 417 (methyl acrylate, 2-hydroxyethyl acrylate, trans-2-pentenal, trans-2-hexenal excluded)
Log (1/LC50) = 0.934 log (1/EC50) + 1.35 [78] n = 40, r2 = 0.84, q2 = 0.82, s = 0.69, F = 193 (allyl methacrylate and 2-hydroxyethyl acrylate excluded)
Tremolada et al. (2004) developed quantitative inter-specific chemical activity
relationships for aquatic organisms in order to verify the utility of the QAARs for
estimating toxicological data when no other information is available. Inter-specific
toxicity relationships on fish, Daphnia and algae were performed for pesticides
considering a large data set (more than 600 compounds) collected from pesticide
manual (Tomlin, 1997), link to the compiled data not found) and grouping the data
either on a functional (herbicides, fungicides and insecticides) or chemical class base.
Good correlations were found between several fish species and they were improved
by excluding, from the data set, highly specific compounds such as organophosphorus
insecticides. Relationship between fish (rainbow trout) and Daphnia was significant
for the whole data set, but clearly improves if congeneric classes of pesticides are
considered. The most significant results were found for azoles (fungicides) and for all
data set of pesticides with the exclusion of organophosphorus and carbamate
insecticides. As expected, toxicity on algae does not correlate either with fish or with
Daphnia on the whole data set, but excluding the classes acting specifically toward
one organism (insecticides and several classes of herbicides), good relationships were
found. It should be noted that the algal toxicity is compilation for at least three species
(S. Subspicatus, S. capricornutum, Chlorella sp.) and two assays (photosynthesis
inhibition or growth reduction) due to lack of sufficient amount of reliable data to a
single species or test method. The analysis of the data permitted the conclusion that
the specificity in the mode action of pesticides is the key parameter for expecting or
not inter-specific relationships. The QAARs developed by Tremolada et al. (2004) are
summarised in Table 2.
Dyer et al. (2006) explored the potential of the U.S. EPA's Interspecies Correlation
Estimation (ICE) program to predict single species toxicity values from a single

39
known toxicity value (http://www.epa.gov/ceampubl/fchain/webice/index.htm). ICE
uses the initial toxicity estimate for one species to produce correlation toxicity values
for multiple species, which can be used to develop species sensitivity distribution
(SSD) and 5% concentration cut-off (HC5) from it. To test this approach to deriving
HC5, the authors generated toxicity values based on measured toxicity for three
surrogate species Pimephales promelas (Fathead minnow), Onchorynchus mykiss
(Rainbow trout), and Daphnia magna (water flea). Algal taxa were not used due to the
paucity of high quality algal-aquatic invertebrate and algal-fish correlations. The
compounds used (dodecyl linear alkylbenzenesulfonate (LAS), nonylphenol,
fenvalerate, atrazine, and copper) had multiple measured toxicity values and diverse
MOA. Distribution parameters and HC5 values from the measured toxicity values
were compared with ICE predicted distributions and HC5 values. While distributional
parameters (scale and intercept) differed between measured and predicted
distributions, in general, the ICE-based SSDs had HC5 values that were within an
order of magnitude of the measured HC5 values. Examination of species placements
within the SSDs indicated that the most sensitive species were coldwater species (e.g.,
salmonids and Gammarus pseudolimnaeus).

40
Table 2. QAAR models for diverse set of pesticides, developed by Tremolada et al. (2004). Target species Source species QAAR Model Eq. Oncorhynchus mykiss 96-h LC50 (mmol/L)
Lepomis macrochirus 96-h LC50 (mmol/L)
Log Y = 0.95 log X – 0.19 n = 199, r2 = 0.92, s = 0.44, F = 2168 (herbicides, fungicides, insecticides)
[79]
Oncorhynchus mykiss 96-h LC50 (mmol/L)
Lepomis macrochirus 96-h LC50 (mmol/L)
Log Y = 0.99 log X – 0.16 n = 174, r2 = 0.94, s = 0.39, F = 2557 (without organophosphorus)
[80]
Oncorhynchus mykiss 96-h LC50 (mmol/L)
Leuciscus idus 96-h LC50 (mmol/L)
Log Y = 0.97 log X – 0.47 n = 39, r2 = 0.92, s = 0.48, f = 447 (herbicides, fungicides, insecticides)
[81]
Oncorhynchus mykiss 96-h LC50 (mmol/L)
Ictalurus sp. 96-h LC50 (mmol/L)
Log Y = 0.99 log X – 0.14 n = 32, r2 = 0.91, s = 0.44, f = 298 (herbicides, fungicides, insecticides)
[82]
Oncorhynchus mykiss 96-h LC50 (mmol/L)
Pimephales promelas 96-h LC50 (mmol/L)
Log Y = 1.00 log X – 0.22 n = 12, r2 = 0.93, s = 0.52, f = 125 (herbicides, fungicides, insecticides)
Oncorhynchus mykiss 96-h LC50 (mmol/L)
Cyprinus sp. 96-h LC50 (mmol/L)
Log Y = 0.98 log X – 0.36 n = 65, r2 = 0.83, s = 0.54, F = 314 (without organophosphorus)
[83]
Oncorhynchus mykiss 96-h LC50 (mmol/L)
Cyprinus sp. 96-h LC50 (mmol/L)
Log Y = 0.98 log X – 0.36 n = 65, r2 = 0.83, s = 0.54, F = 314 (without organophosphorus)
[84]
Oncorhynchus mykiss 96-h LC50 (mmol/L)
Daphnia sp. (magna and pulex)
Log Y = 0.61 log X – 0.65 n = 267, r2 = 0.59, s = 0.98, F = 379
[85]

41
48-h EC50 (mmol/L) immobilisation
(diverse set of pesticides)
Oncorhynchus mykiss 96-h LC50 (mmol/L)
Daphnia sp. (magna and pulex) 48-h EC50 (mmol/L) immobilisation
Log Y = 0.82 log X – 0.41 n = 206, r2 = 0.77, s = 0.75, F = 683 (without organophosphorus and carbamates)
[86]
Oncorhynchus mykiss 96-h LC50 (mmol/L)
Daphnia sp. (magna and pulex) 48-h EC50 (mmol/L) immobilisation
Log Y = 1.0 log X – 0.21 n = 19, r2 = 0.84, s = 0.24, F = 86 (for azole and carbamates insecticides)
[87]
Oncorhynchus mykiss 96-h LC50 (mmol/L)
Daphnia sp. (magna and pulex) 48-h EC50 (mmol/L) immobilisation
Log Y = 0.87 log X + 1.3 n = 8, r2 = 0.80, s = 0.57, F = 24 (for carbamate insecticides only)
[88]
Daphnia sp. (magna and pulex) 48-h EC50 (mmol/L) immobilisation
S. Subspicatus, S. capricornutum, Chlorella sp. 96-h EC50 (mmol/L) photosynthesis inhibition or growth reduction
Log Y = 0.70 log X – 0.40 n = 60, r2 = 0.55, s = 0.83, F = 64 (diverse set)
[89]
Oncorhynchus mykiss 96-h LC50 (mmol/L)
S. Subspicatus, S. capricornutum, Chlorella sp. 96-h EC50 (mmol/L) photosynthesis inhibition or growth reduction
Log Y = 0.58 log X – 0.71 n = 56, r2 = 0.49, s = 0.67, F = 53 (diverse set)
[90]

42
7. Expert systems There are a number of expert systems developed that combine multiple QSAR models
or use general models to predict aquatic toxicological endpoints. A comprehensive
review of such expert systems is available from ECETOC (2003b). This review
intended to develop awareness that expert systems and software exist and might be
used to derive QSAR predictions for aquatic endpoints. It should be emphasized that
if possible, several predictions can be obtained and compared in order to increase
objectivity of the decision. However, they should be critically analysed for common
problems.
Amongst others, the following formalised expert system can be referenced:
• ECOSAR uses a number of class-specific log Kow-based QSARs in order to
predict the toxicity of chemicals to aquatic organisms (fish, daphnids, and green
algae). The log QSARs are developed for chemical classes based on measured
test data that have been submitted by industry to the U.S. Environmental
Protection Agency (U.S. EPA). The ECOSAR Class Program has been
developed primarily for the following scenario: (1) enter a SMILES notation; (2)
computer determination of appropriate ECOSAR classes for the SMILES
notation; and (3) calculate the ecotoxicity using a log Kow value. The program
might be executes in batch mode and the result is available in text format.
ECOSAR produces warnings in several occasions (e.g. when the water solubility
is very low, or when the prediction is outside the range of log Kow in the training
set). The software is freely available from the U.S. EPA (downloadable from
http://www.epa.gov/oppt/exposure/docs/episuitedl.htm)
• TOPKAT assesses the toxicity of chemicals from 2D molecular structure
(SMILES notation but other input formats are also available). The program uses
a range (Q)SAR models for assessing acute toxicity to fathead minnow and
Daphnia. The (Q)SAR models in TOPKAT use electrotopological (E-state)
fragments. (Q)SAR models (so called submodels) are available for different
chemical classes and the program automatically selects the equation form the
structural input. The program might be executed in batch mode and the result is
available in format, directly readable by Excel for Windows. TOPKAT produces
information for the (Q)SAR applicability domain at several levels: 1) the

43
prediction is within the “optimum prediction space” (OPS) of the model; 2) the
model is within the limits of OPS; 3) all fragments identified in a molecule are
known to the model. TOPKAT also makes visible experimental test data if such
is available for the query chemicals (presumably used in the (Q)SAR training
set). TOPKAT is commercial product of Accelrys Inc. (for information:
http://www.accelrys.com/products/topkat)
• MCASE is a knowledge-based system using fragment methodology to develop
QSAR models for non-congeneric databases. MCASE (and MC4PC) evaluate
the structural features of a set of non congeneric molecules and identify the
substructural fragments, called biophores that may be responsible for the
observed activity (i.e. chemical functionalities). The chemicals containing the
same biophore are grouped into subsets for which independent QSAR models
are developed. The descriptors of these models are called modulators and consist
of fragments found within the individual sets as well as calculated transport and
partition properties and quantum mechanical indices. The result of this operation
is a set of QSAR models build for the congeneric sets of molecules containing
the same biophore (identified as the “chemical functionality” responsible for the
observed property. The domain of validity of the methodology is linked (and
assessed) as a function of the probability that the corresponding biophore is
related to activity and the determination that every three bonded non-hydrogen
atom groups has been seen and therefore evaluated by the model builder or not
seen and therefore of questionable effect on the prediction results. Models for
several fish species were developed (blue gill, fathead minnow, rainbow trout,
and red killifish). Batch mode is available. MCASE is a commercial product of
MultiCASE Inc. (for information: http://www.multicase.com).
• OASIS uses the response-surface approach for modelling acute toxicity for two
types of toxicochemical domains: non-covalent (reversible) acting chemicals
and irreversible covalent bioreactive chemicals. The first domain includes
chemicals, which meet the traditional structural requirements for neutral
narcosis, amines, esters, phenols and anilines. The interaction of the non-
covalent acting chemicals with the lipid-bilayer region of membranes is
delineated by descriptors assessing the bioconcentration (BCF) and global
electrophilic character of molecules (ELUMO). The domain of reactive chemicals

44
is divided to sub-domains according to their putative mechanism of action
conditioned by specific reactive groups. For modelling of specific chemical
classes, the different reactivity parameters are used such as maximum donor and
acceptor delocalizability at α-C-atom (for α,β-unsaturated alcohols), charge at
carbonyl oxygen (for aldehydes), bond order between carbon and halogens (for
α,β- unsaturated halides), etc. In addition, inter-species QSARs for acute
toxicity to 17 aquatic species, such as fish, snail, tadpole, hydrozoan, crustacean,
insect larvae, and bacteria were developed. The TIMES platform is used to
predict the individual and interspecies models for acute aquatic toxicity (for
information: http://www.oasis-lmc.org/software.php)
• OECD (Q)SAR Application Toolbox. The OECD has started the development
of a (Q)SAR Application Toolbox as a means of making QSAR technology
readily accessible. The Toolbox is developed in two phases. The first phase,
developed by the LMC, Bulgaria, emphasises technological proof-of-concept.
The Toolbox currently contains several databases (also for aquatic toxicity),
includes tools to assist the user in the formation of chemical categories and
filling of data gaps by read across, and provides possibility for using a library of
(Q)SAR models (this functionality will be extensively developed in the second
phase, together with refinement of grouping schemes). The input is available in
several formats, including SMILES and drawing structure. Searching facility is
also available. For information, visit http://www.oecd.org, (Q)SARs Project).
The “proof-of-concept” version of the Toolbox will be publicly available in
March 2008.
• TerraQSAR - FHM is a stand-alone neural network-based program to compute
the acute toxicity (96-hr LC50) of organic chemicals to the fathead minnow using
proprietary neural network algorithm. The chemical input is SMILES string. The
output is either in mg/L, or in log (L/mmol). TerraQSAR – FHM is commercial
product of TerraBase Inc. (for information: http://www.terrabase-inc.com).
• ASTER (ASsessment Tools for the Evaluation of Risk) was developed by the
U.S. EPA to assist regulators in performing ecological risk assessments. ASTER
is an integration of the AQUIRE toxic effects database and the QSAR system, a
structure-activity based expert system. When empirical data are not available
mechanistically-based predictive models are used to estimate ecotoxicology
45
endpoints, chemical properties, biodegradation, and environmental partitioning.
ASTER is currently not publicly available.
• ChemProp (Chemical Properties Estimation Software System) was developed by
the UFZ Centre for Environmental Research, Germany. Methods within
ChemProp are implemented in a flexible form, allowing for regular updating and
extension according to the scientific progress. The system contains calculation
methods (from literature and original developments) for environmentally
relevant physical-chemical and environmental fate properties, and toxicities. The
software incorporates a new characterization scheme for acute toxicity to
daphnid and algae, with fish system being under development. Structural input
of one or many molecules is achieved either by means of a graphical molecule
editor, via SMILES strings, input or compilation from MDL or SMD formatted
molecule files, or by queries within the integrated structure database – e.g.
name, registry number, property profile, substructures. The primary result output
of ChemProp are formatted tables in HTML, visualised in an internal browser.
Import to usual spreadsheet software is possible. Pure text output (ASCII),
additional background information on calculation and model details as well as
visualisation of substructure search results is available. Basic statistical analyses
including respective plots and compound class specific analyses (either user-
specified or fully automated) are available. For information, visit:
http://www.ufz.de; for availability, contact developer: Dr Gerrit Schüürmann at
• PropertEst (Property Estimation) was developed by the Fraunhofer Institute,
Germany. The system is regularly revised. The software system currently
contains approximately 140 QSAR models. When developing the system, two
aspects were important: 1) validation: chemicals not considered in the
development of the model were tested for predicted compliance with measured
data, and 2) user-friendliness: input of molecular structure/smiles codes,
warning when extrapolating/reactive substructures, etc. There is a manual giving
an overview on structure-activity-relationships, descriptors and classification
models describes how to use PropertEst and lists all models included. Further
indications are given on how to choose an adequate model for a certain
substance. However, the user is still free to choose a QSAR model and to assess

46
the calculated values according to his “feelings”. For information, visit
http://www.ime.fraunhofer.de/aoe/chp/expo/qsar.propertest.jsp; for availability,
contact Dr Martin Müller (contact information available on the website).
Salvito et al. (2002) used ECOSAR for refinement of LC50 estimates of fragrance
materials to fish, derived from a general (log Kow-based) model. A predicted no-effect
concentration (PNEC) was calculated by the QSAR estimate and assessment factor
(AF). A conservative AF of 106 was applied to the endpoint if predicted by the
general QSAR. PNEC was compared with the predicted environmental concentration
(PEC) and if the ratio PEC/PNEC was grater than 1, the estimate was derived by
ECOSAR. This procedure led to a reduction in the number of chemicals with
PEC/PNEC > 1 from 27% to 8% from a total of 2141 substances.
Sanderson et al. (2003) performed probabilistic hazard assessment of environmentally
occurring pharmaceuticals toxicity to fish, daphnids and algae by ECOSAR screening.
In the absence of extensive ecotoxicological data, the authors scanned all the
compounds observed in the environment for toxicological properties by QSARs. The
results of the probabilistic distribution of environmental and effect concentrations and
hazard quotients (HQs) did not indicate significant acute risks prior to application of
assessment factors. Compared with measured effect concentrations SAR predictions
(as from ECOSAR) were more “sensitive” in about 80% of the cases. Based on
ECOSAR predictions, the following species sensitivity to drugs was noted: alga >
daphnid > fish. However, it was recognized that most of the drugs are optimized to
have specific effects and the models in ECOSAR are not generally trained on
pharmaceuticals.
Sanderson et al. (2004), extended the probabilistic study to 2986 different
pharmaceuticals, grouped in 51 classes relative to estimated hazard with ECOSAR.
The overall relative order of susceptibility (daphnids > fish > algae) was found
different from the previous study. The paper is reach on details about ECOSAR.
Moore et al. (2003) compared model predictions for 96-h LC50s to P. promelas to the
corresponding measured toxicity values available in the AQUIRE database using a
testing data set of 130 substances that had not been included in the training data sets

47
of the QSAR models. The testing data set was heavily weighted with neutral organics
of low molecular weight and functionality. Many of the testing data set substances
also had a nonpolar narcosis mode of action and/or were chlorinated. A variety of
statistical measures (correlation coefficient, slope and intercept from a linear
regression analysis, mean absolute and squared difference between log prediction and
log measured toxicity, and the percentage of predictions within factors of 2, 5, 10,
100, and 1,000 of measured toxicity values) indicated that the probabilistic neural
network (PNN) model had the best model performance for the full testing data set of
130 substances. The rank order of the remainder of the models depended on the
statistical measure employed. TOPKAT also had excellent model performance for
substances within its optimum prediction space. Only 37% of the substances in the
testing data set, however, fell within this optimum prediction space. Other methods
included in the study comprised ECOSAR, computational neural network (CNN),
ASTER, and OASIS.
In a study by de Roode et al. (2006), four QSARs were developed to predict toxicity
for 170 compounds from a broad chemical class, using them as a black-box.
Predictions were obtained for 122 compounds, indicating an important drawback of
QSARs, i.e., for 28% of the compounds QSARs were not applicable. ECOSAR,
TOPKAT, and QSARs for non-polar and polar narcosis generated predictions for 120,
39, 24, and 11 compounds, respectively. Correlations between experimental and
predicted effect concentrations were significant for TOPKAT and the QSAR for polar
narcosis, but generally poor for ECOSAR and the QSAR for non-polar narcosis.
When predicted effect concentrations for fish were allowed to deviate from
experimental values by a factor of 5, correct predictions were generated for 77%,
54%, 68%, and 91% of the compounds using ECOSAR, TOPKAT, and the QSARs
for non-polar and polar narcosis, respectively. The authors found impossible to
indicate specific chemical classes for which a QSAR should be used or not. The
results show that currently available QSARs cannot be used as a black-box and some
understanding is needed.

48
8. Integrated testing strategies
Bradbury et al. (2004) published a vision paper on meeting the scientific needs of
ecological risk assessment in a regulatory context. According to the authors,
components of an intelligent testing strategy include exposure information, threshold
of toxicological concern (TTC), QSARs, read-across methods and in vitro testing
methodologies. TTC is an exposure threshold value for chemicals, below which no
significant risk is expected. Combined with simple or more refined exposure
scenarios, TTC values can form the basis of an intelligent testing approach in a tiered
risk-assessment scheme. Figure 1 shows how this testing scheme can help to set data-
generation priorities.
Gubbels-van Hal et al. (2005) exercised practically an alternative approach for the
safety evaluation of new and existing chemicals, which the authors named as
integrated testing. Various in vitro and in silico methods without animals were applied
to 10 substances listed on the European List of Notified Chemical Substances
(ELINCS) with a complete test database-set available. The hazard assessment for
these substances was performed on basis of available non-animal data, QSAR, PBBK-
modelling and additional, new in vitro testing was applied. Based on these data
predictions on fish toxicity, acute toxicity, skin- and eye-irritation, sensitisation, and
toxicity after repeated dosing were made. The predictions were compared with the
outcome of the in vivo tests. Nine out of ten predictions on fish LC50 proved to be
correct. For skin- and eye-irritation 70% was predicted correctly. Sensitisation was
predicted correctly for 7 out of 10 substances, but three false negatives were found.
Acute oral toxicity (LD50) and repeated dose toxicity were less successful (5 out of 10
and 2 out of 10 correct predictions, respectively). Application of the PBBK model
proved successful. Acute dermal toxicity was predicted correctly in 9 out of 10 cases.
In general an over-estimation of systemic toxicity was found, which can be explained
by an over-prediction of cytotoxicity and worst case assumptions on absorption and
binding to (plasma) proteins. This integrated approach revealed potential to a 38%
reduction of test animals.

49
Figure 1. A scheme of efficient risk assessment, after Bradbury et al. (2004).
Arnot et al. (2006) reported a system for screening level Risk Assessment,
Identification and Ranking (RAIDAR) for prioritisation of chemicals by estimating
environmental fate and transport, bioaccumulation and exposure to human and
wildlife. The authors argue that the system is applicable when little or no empirical
property data exists and emission rates are known only approximately. Although the
uncertainties in the output might be high, the results may be adequate to “bin”
substances into groups of similar risk and thus compare high and low risk potential.
The conceptual overview of the system is given in Figure 2.

50
Figure 2. Conceptual overview of the RAIDAR model, after Arnot et al. (2006). Grindon et al. (2006) described a research project sponsored by Defra on the status of
alternatives to animal testing with regard to the European Union REACH
(Registration, Evaluation and Authorisation of Chemicals) system for safety testing
and risk assessment of chemicals. The project covered all the main toxicity endpoints
associated with the REACH system. The paper focuses on the prospects for using
alternative methods (both in vitro and in silico) for environmental (aquatic) toxicity
testing. The manuscript reviews tests based on fish cells and cell lines, fish embryos,
lower organisms, and the many expert systems and QSARs for aquatic toxicity
testing. Decision-tree style integrated testing strategies are also proposed for acute
aquatic toxicity (Figure 3) and chronic toxicity, including bioaccumulation (Figure 4),
followed by a number of recommendations for the future facilitation of aquatic
toxicity testing with respect to environmental risk assessment.

51
Figure 3. Decision-tree testing strategy for acute environmental toxicity testing after Grindon et al. (2006). Some details on the validation status of in vitro methods are omitted. UTC stands for Upper threshold concentration – Step Down approach, TG – for test Guideline, C & L – classification and labelling, RA – risk assessment.
Figure 4. Decision-tree testing strategy for chronic environmental and bioaccumulation toxicity testing after Grindon et al. (2006). ECETOC (2005) proposed a two-tiered approach (Figure 5) with aim to avoid, where
possible, using whole fish in aquatic toxicity assessment, or at least to minimize the

52
number of fish used, when there are no acceptable alternatives. The ECETOC
integrated strategy is shown in Figure 5. The algal test refers to 72-h algal inhibitory
assay (OECD TG 203) and the daphnid test refers to 48-h immobilization assay
(OECD TG 202). In the comparison between algal and daphnid toxicity, if the ratio is
< 0.5 or > 2 then, depending on data, fish acute step down procedure is suggested, or a
limit test. If the ratio is between 0.5 and 2, then it should be assumed that the
sensitivity of the two assays is similar and 48-h fish embryo toxicity assay is
recommended to increase the confidence in predicting acute toxicity to fish. If either
of the algal or daphnid EC50 is more sensitive than the 48-h embryo toxicity assay,
then data from the most sensitive species will be used for risk assessment and no
further testing will be required. The authors note, however, that the suggested
approach is theoretical and should be evaluated thoroughly before being applied to
risk assessment.
Figure 5. Flow-diagram representing the proposed strategy for assessing acute aquatic toxicity using currently available techniques, after ECETOC (2005).

53
In August 2005, a consortium contracted to develop a scoping study on the
Development of a Technical Guidance Document on information requirements on
intrinsic properties of substances (RIP 3.3-1) delivered a report with 14 appendices,
one of which (Appendix 10) aimed to define an Intelligent Testing Strategy (ITS) for
assessing the aquatic toxicity of a substance, within the context of REACH. The
scoping study is known also as the TAPIR (Three point three – A Project for the
Information Requirements of REACH) project (ECB, 2007). Appendix 10 developed
an integrated strategy guidance for data generation in a stepwise approach, where, in
principle, a higher level would correspond to more relevant, certain and accurate data.
The strategy builds on the concept that if the available information is not sufficient to
meet the regulatory needs, further gathering of information at a succeeding step in the
testing strategy is needed. If the available information is sufficient and the standard
information requirements are met, no further gathering of information is required. The
strategy starts with evaluation of available information and check whether it covers
the tonnage band requirements as specified in different Annexes of REACH.
Exposure information at this point can trigger data generation or possible waiving. If
conclusion on the aquatic toxicity endpoint is possible, it should be done. If not,
refinement of inadequate data and filling of data gap should be done, according to the
information requirements and needs. The possible ways suggested are either through
use of scientifically valid QSAR, grouping and read across, or by performing a test, if
needed. The TAPIR ITS for aquatic toxicity formed a basis for the development of the
Technical Guidance on Information Requirements for this endpoint under REACH
Implementation Project (RIP) 3.3-2 (ECB, 2007).
The REACH TGD proposes two different decision schemes for classification and
labelling and for chemical safety assessment (PNEC derivation). For determination of
the definitive toxicity criterion (NOEC < 0.01 mg/L) in the context of PBT
assessment, chronic test must be performed. For determination of the screening
toxicity criterion (L/EC50 < 0.1 mg/L), however, data from reliable non-standard tests
and non-testing methods, including valid QSAR predictions, may also be used. If
screening criterion is met, the substance is referred to definitive toxicity testing and
chronic studies are required regardless of the tonnage band, unless the acute L/EC50 <

54
0.01 mg/L, which automatically confirms that the substance fulfils the definitive
toxicity criterion.
According to the REACH TGD, environmental classification and labelling of a
substance is generally based on data from short-term tests to fish, invertebrate and
algae (recommended tests and endpoints are given in Section 4 of this document).
Classification & Labelling should be performed for all substances registered in
REACH.
Figure 6. Decision scheme for classification and labelling, after the TGD for REACH. As a first step, all available information on a substance has to be collected and
evaluated (Figure 6). Further, informational requirements for tonnage bands (as an
indicator for exposure) should be met. For substance between 1 and 10 tpa, if EC50 for
invertebrates and algae/aquatic plants are available, and there are no mitigating factors

55
limiting the bioavailablility, the substance should be classified on the lowest effect
value. It also reads there that if a reliable QSAR result for fish is available, or
additional information (e.g. from read-across) can be provided, this value should be
considered. For substances > 10 tpa, acute fish is required. However, derogations
from the standard information requirements may be made in some circumstances. An
interesting case is if acute data on invertebrates and algae are available and EC50 for
both species is > 1 mg/L. In this case, information on acute toxicity to fish will be
necessary. If calculation of an LC50 to fish with a reliable QSAR is possible, this
information can be used together with the available effect data for the purpose of
classification. QSARs can be also used to argue that fish is not the most sensitive
species from the three trophic levels.
The use of QSAR under reach for safety assessment and PNEC derivation will be
more limited probably than for Classification & Labelling. QSAR for long
term/chronic effects will be needed. QSARs for short term toxicity could be used in a
weight of evidence approach and for estimation of species sensitivity. For the latter
purpose, sets of models for different species and from different trophic levels will be
required.

56
9. Conclusions The purpose of this review was to collect information for sources of aquatic toxicity
data, recently published quantitative structure-activity relationship (QSAR) models,
computational tools for estimation of chemical toxicity aquatic to aquatic organisms,
and to capture the current understanding of what constitutes an integrated testing
strategy (ITS) for this endpoint as well as in more general terms, in the scientific
literature and for the purposes of REACH. Exhaustive review going back to the 80’
was not performed since the modelling of aquatic toxicity is a large field with many
different aspects but an effort was done to review most recent papers in well rated
journals. The understanding of the problems and possible solutions, however, require
a widespread knowledge of recent and past achievements. Predictive capabilities do
not increase overnight but gradually with increasing of data and improvement of
computational facilities.
With respect to data, several databases are known and lots of data is published in the
literature. However, the number of tested chemicals with reliable and compatible test
data remains small compared to regulatory inventories of interest. The biggest
datasets used for QSAR modelling comprise about 550 diverse chemicals with 96-
LC50 to P. promelas (reported initially by Russom et al., 1997, and further updated).
This data set has been used by various workers (Netzeva et al., 2005; Papa et al.,
2005; Amini et al., 2007; Kahn et al., 2007), and is generally available from
publications. Another big fish toxicity dataset with about 270 96-h LC50 to O. mykiss
was compiled for pesticides in DEMETRA (Mazzatorta et al., 2005; Casalegno et al.,
2006). This data set is also available from the papers. For Daphnia, the biggest data
set compiled and used in the context of QSAR model development and knowledge
mining was found in the paper of Von der Ohe et al. (2005). It contains 370 measured
LC50 values for D. magna and other Daphnia species. The data set is available from
the paper. Another big data set for Daphnia was reported by Toropov and Benfenati
(2006). It contains 262 LC50 values to diverse set of pesticides (available). A large
compilation of toxicity data (> than approx. 100) to algae was not detected. However,
it could be thought possible from different sources available. One problem with algal
data is the high variability of data due to the large diversity of methods and protocols
used for its measurement. In fact, one of the biggest consistent data sets for aquatic

57
toxicity was developed for the ciliate T. pyriformis. The author of the database claims
that the TETRATOX database is a collection of toxic potency data for more than
2,400 industrial organic compounds of which more than 1,600 have been published
(http://www.vet.utk.edu/TETRATOX). The data from TETRATOX have been
extensively used for knowledge mining, QSAR and QAAR development as well as a
milestone in testing of new modelling algorithms. QSARs to Tetrahymena, however,
were not reviewed specifically in this study since protozoa remind outside of the
recommended test methods for aquatic toxicity testing under REACH despite the fact
that non-standard data could and should be compiled, when available, in order to
apply weight of evidence hazard assessment of substances. Compared to the REACH
expected inventory (registration of 30,000 chemicals), the experimental data used in
QSAR models covers only about 1.8% with measured fish toxicity data and 1.2%
with measured daphnid toxicity data on the assumption that all tested chemicals will
be potentially registered. Therefore, existing data and non-testing methods will
become increasingly important.
With respect to the QSAR models reviewed, it seems that more and better quality
models are developed for fish > daphnid > algae. Such subjective observation might
be due to the magnitude of the saving potential of non-testing methods applied to
toxicity testing but the environmental protection goal is to ensure concentrations that
will be protective to the most sensitive species in the aquatic ecosystem. The review
showed that for different chemical classes and different methodologies, the perception
for the “most sensitive species” changes and fish do not always seem to be most
sensitive. In this respect, development of models for toxicity to all trophic level is
important.
Narcosis seems to be the best represented MOA in terms of available QSARs.
Narcotics demonstrate also low interspecies variability and are associated with low
acute to chronic ratios (Ahlers et al., 2006) but problem in identifying narcotics still
exist. In this respect, expanding the knowledge and computational capability to
predict MOA from chemical structure is important but also the understanding of the
biological component should not be neglected. In chemico and in vitro methods could
be helpful to indicate the potential MOA, and assist in identifying reactive chemicals
58
(Schultz et al., 2006), In silico derived structural and physico-chemical rules also
have a large potential for identifying reactive chemicals (Amaury et al., 2007).
A subjective observation is also that in the recent years the number of papers
reporting complex computational approaches increase over the MOA-based papers.
As the diversity of the methods to mine the same data is most cases is positive for
increasing the confidence in the predictions from these data, the transparency and the
availability of such approaches is some times shaded by the complexity of the
approach. Thus, a potential solution could be development of databases with QSAR
estimates, a need coming also from the utilisation of grouping and read-across, but the
history of the models should be traceable and the quality should be good. The reality
is that many models are developed with methodological goals and appreciation of one
or more aspects of the QSARs is missing. Therefore, the development of a dynamic
QSAR inventory with transparent and comprehensive documentation, as initiated by
ECB (Worth et al., 2007), could increase the utility of many modelling efforts.
The expert systems (public or commercial) provide a robust tool for estimation of
toxicity. A progressive trend in increasing availability is noted by the influx of open
source applications and automation of the estimation workflows. There is also an
increased recognition of the need of reliable and accessible tools from OECD, ECB,
national regulatory authorities and Industry. Traditionally, QSARs are implemented in
the expert systems but QAAR models were also recognised as a potential means for
filling of data gaps but also to study species sensitivity and derive PNEC from SSD.
Finally, several literature-reported ITSs were reviewed. They all differ depending on
the background and goals of the authors. Some of the strategies are general as a
conceptual framework and others go in details about the tests to be used and their
status. Some ITS target risk assessment with different balance in the accents on
hazard and exposure, and others target only hazard assessment. Some of them are
skewed towards regulatory purpose and others on avoiding testing. Despite of all
differences, however, all reviewed ITSs identify the use of QSARs and in silico
methods, in general, as an essential element of the integrated strategy.

59
10. References
Ahlers J, Riedhammer C, Vogliano M, Ebert RU, Kühne R & Schüürmann G (2006). Acute to chronic ratios in aquatic toxicity – variations across trophic levels and relationships with chemical structure. Environmental Toxicology and Chemistry 25, 2937-2945.
Amaury N, Benfenati E, Boriani E, Casalegno M, Chana A, Chaudry Q, Chretien, JR, Coterill J, Lemke F, Piclin N, Pintore M., Porcelli C, Price N, Rocanglioni A & Toropov, A (2007). Benfenati E (Ed.) in: Quantitative Structure-Activity Relationships (QSAR) for Pesticide Regulatory Purposes. Results of the Modelling Step. Elsevier, Amsterdam, pp. 201-281.
Amini A. Muggleton SH, Lodhi H, Sternberg MJE (2007). A Novel Logic-Based Approach for Quantitative Toxicology Prediction. Journal of Chemical Information and Modeling 47, 998-1006.
Ankley GT, Daston GP, Degitz SJ, Denslow ND, Hoke RA, Kennedy SW, Miracle AL, Perkins EJ, Snape J, Tillitt DE, Tyler CR & Versteeg D (2006). Toxicogenomics in regulatory ecotoxicology. Environmental Science & Technology A-pages 40, 4055-4065.
Arnot J A, Mackay D, Webster E & Southwood JM (2006). Screening Level Risk Assessment Model for Chemical Fate and Effects in the Environment. Environmental Science & Technology 40, 2316-2323.
Bearden AP & Schultz TW (1998). Comparison of Tetrahymena and Pimephales toxicity based on mechanism of action. SAR & QSAR in Environmental Research 9, 127-153.
Boeije GM, Cano ML, Marshall SJ, Belanger SE, Van Compernolle R, Dorn PB, Gümbel H, Toy R & Wind T (2006). Ecotoxicity quantitative structure–activity relationships for alcohol ethoxylate mixtures based on substance-specific toxicity predictions. Ecotoxicology and Environmental Safety 64, 75-84.
Bradbury SP, Feijtel TC & Van Leeuwen CJ (2004). Meeting the scientific needs of ecological risk assessment in a regulatory context. Environmental Science & Technology. 38, 463A–470A.
Casalegno M, Sello G & Benfenati E (2006). Top-priority fragment QSAR approach in predicting pesticide aquatic toxicity. Chemical Research in Toxicology 19, 1533-1539.
Chen C-Y & Lin J-H (2006). Toxicity of chlorophenols to Pseudokirchneriella subcapitata under air-tight test environment. Chemosphere 62, 503-509.
Chen C-Y, Ko C-W & Lee P-I (2007). Toxicity of substituted anilines to Pseudokirchneriella subcapitata and quantitative structure-activity relationship analysis for polar narcosis. Environmental Toxicology and Chemistry 26, 1158-1164.

60
Cronin MTD, Dearden JC & Dobbs AJ (1991). QSAR studies of comparative toxicity in aquatic organisms. Science of the Total Environment 109/110, 431-439.
Cronin MTD, Netzeva TI, Dearden JC, Edwards R & Worgan ADP (2004). Assessment and modeling of the toxicity of organic chemicals to chlorella vulgaris: development of a novel database. Chemical Research in Toxicology 17, 545-554.
Davies J, Ward RS, Hodges G & Roberts DW (2004). Quantitative structure-activity relationship modeling of acute toxicity of quaternary alkylammonium sulfobetaines to Daphnia magna. Environmental Toxicology and Chemistry 23, 2111-2115.
De Roode D, Hoekzema C, de Vries-Buitenweg S, van de Waart B & van der Hoeven J (2006). QSARs in ecotoxicological risk assessment. Regulatory Toxicology and Pharmacology 45, 24-35.
Dimitrov SD, Mekenyan OG, Sinks GD, Schultz TW (2003). Global modeling of narcotic chemicals: ciliate and fish toxicity. Journal of Molecular Structure (THEOCHEM) 622, 63-70.
Dimitrov S, Koleva Y, Schultz TW, Walker JD & Mekenyan O (2004). Interspecies quantitative structure-activity relationship model for aldehydes: aquatic toxicity. Environmental Toxicology and Chemistry 23, 463-470.
Dyer SD, Versteeg DJ, Belanger SE, Chaney JG & Mayer FL (2006). Interspecies correlation estimates predict protective environmental concentrations. Environmental Science & Technology. 40, 3102-3111.
EC (2006a). Regulation (EC) No 1907/2006 of the European Parliament and of the Council of 18 December 2006 concerning the Registration, Evaluation, Authorisation and Restriction of Chemicals (REACH), establishing a European Chemicals Agency, amending Directive 1999/45/EC and repealing Council Regulation (EEC) No 793/93 and Commission Regulation (EC) No 1488/94 as well as Council Directive 76/769/EEC and Commission Directives 91/155/EEC, 93/67/EEC, 93/105/EC and 2000/21/EC. Official Journal of the European Union L396/1 of 30.12.2006. Accessible from http://publications.europa.eu.
EC (2006b). Directive 2006/121/EC of the European Parliament and of the Council of 18 December 2006 amending Council Directive 67/548/EEC on the approximation of laws, regulations and administrative provisions relating to the classification, packaging and labelling of dangerous substances in order to adapt it to Regulation (EC) No 1907/2006 concerning the Registration, Evaluation, Authorisation and Restriction of Chemicals (REACH) and establishing a European Chemicals Agency. Official Journal of the European Union L 396/850 of 30.12.2006. Accessible from http://publications.europa.eu
ECB (2007). Final report of REACH Implementation Project (RIP) 3.3-2. Technical Guidance Document to Industry on the Information Requirements for REACH. European Commission-Joint Research Centre, Ispra, Italy. Accessible from: http://ecb.jrc.it/REACH/RIP_FINAL_REPORTS.

61
ECETOC (2003a). ECETOC Aquatic Toxicity (EAT) Database. Supplement to ECETOC. 2003. Aquatic Hazard Assessment II. Technical Report No. 91. European Centre for Ecotoxicology and Toxicology of Chemicals, Brussels, Belgium.
ECETOC (2003). (Q)SARs: Evaluation of the commercially available software for human health and environmental endpoints with respect to chemical management applications. Technical Report No. 89. European Centre for Ecotoxicology and Toxicology of Chemicals. Brussels, Belgium.
ECETOC (2005). Alternative Testing Approaches in Environmental Safety Assessment. Technical Report No. 97. European Centre for Ecotoxicology and Toxicology of Chemicals. Brussels, Belgium.
Escher BI & Hermens JLM (2002). Modes of toxic action in ecotoxicology: their role in body burdens, species sensitivity, QSARs, and mixture effects. Environmental Science & Technology 36, 4201-4217.
Escher B, Bramaz N, Richter M & Lienert J (2006). Comparative ecotoxicological hazard assessment of beta-blockers and their human metabolites using a mode-of-action-based test battery and a QSAR approach. Environmental Science & Technology 40, 7402-7408.
Faucon JC, Bureau R, Faisant J, Briens F, Rault S (2001). Prediction of the Daphnia acute toxicity from heterogeneous data. Chemosphere 44, 407-422.
Furusjö E, Svenson A, Rahmberg M & Andersson M (2006) The importance of outlier detection and training set selection for reliable environmental QSAR predictions. Chemosphere 63, 99-108.
Gallegos Saliner A, Langezaal I & Worth AP (2007). Review of examples of read-across/category approaches discussed by the TC C&L. In: A Compendium of Case Studies that helped to shape the REACH Guidance on Chemical Categories and Read-Across. Worth A & Patlewicz G (Eds). European Commission report EUR 22481 EN. European Commission-Joint Research Centre, Ispra, Italy. Available from ECB website: http//ecb.jrc.it/QSAR.
Grindon C, Combes R, Cronin MTD, Roberts DW & Garrod J (2006). Integrated decision-tree testing strategies for environmental toxicity with respect to the requirements of the EU REACH legislation. ATLA 34, 651-664.
Gubbels-van Hal WMLG, Blaauboer BJ, Barentsen HM, Hoitink MA, Meerts IATM & van der Hoeven JCM (2005). An alternative approach for the safety evaluation of new and existing chemicals, an exercise in integrated testing. Regulatory Toxicology and Pharmacology 42, 284-295.
Hermens J, Leeuwangh P & Musch A (1984). Quantitative structure-activity relationships and mixture toxicity studies of chloro- and alkyanilines at an acute lethal toxicity level to the guppy (Poecilia reticulata). Ecotoxicology and Environmental Safety 8, 338-394.

62
Hewitt M, Cronin MTD, Madden JC, Rowe PH, Johnson C, Obi A, Enoch SJ (2007). Consensus QSAR Models: Do the Benefits Outweigh the Complexity? Journal of Chemical Information and Modeling 47, 1460-1468.
Hodges G, Roberts DW, Marshall SJ & Dearden JCD (2006). The aquatic toxicity of anionic surfactants to Daphnia magna—A comparative QSAR study of linear alkylbenzene sulphonates and ester sulphonates. Chemosphere 63, 1443-1450.
Huang C-P, Wang Y-J & Chen C-Y (2007). Toxicity and quantitative structure–activity relationships of nitriles based on Pseudokirchneriella subcapitata. Ecotoxicology and Environmental Safety 67, 439-446.
Huuskonen J (2003) QSAR modeling with the electrotopological state indices: predicting the toxicity of organic chemicals. Chemosphere 50, 949-953.
Knauer K, Lampert C & Gonzalez-Valero J (2007). Comparison of in vitro and in vivo acute fish toxicity in relation to toxicant mode of action. Chemosphere 68, 1435-1441.
Jager T, Posthuma L, de Zwart D & van de Meent D (2007). Novel view on predicting acute toxicity: Decomposing toxicity data in species vulnerability and chemical potency. Ecotoxicology and Environmental Safety 67, 311-322.
Kahn I, Maran U, Benfenati E, Netzeva TI, Schultz TW, Cronin MTD (2007). Comparative quantitative structure-activity-activity relationships for toxicity to Tetrahymena pyriformis and Pimephales promelas. ATLA 35, 15-24.
Lessigiarska I., Worth AP, Sokull-Klüttgen B, Jeram S, Dearden JC, Netzeva TI & Cronin MTD (2004). QSAR investigation of a large data set for fish, algae and daphnia toxicity. SAR & QSAR in Environmental Research 15, 413-431.
Lessigiarska I, Worth AP & Netzeva TI (2005). Comparative Review of QSARs for Acute Toxicity. European Commission report EUR 21559 EN. European Commission-Joint Research Centre, Ispra, Italy. Available from ECB website: http//ecb.jrc.it/QSAR.
Liu X, Wang B, Huang Z, Han S & Wang L (2003) Acute toxicity and quantitative structure–activity relationships of α-branched phenylsulfonyl acetates to Daphnia magna. Chemosphere 50, 403-408.
Lo Piparo E, Fratev F, Lemke F, Mazzatorta P, Smiesko M, Fritz JI & Benfenati E (2006). QSAR model for Daphnia magna toxicity prediction of benzoxazinone allelochemicals and their transformation products. Journal of Agricultural and Food Chemistry 54, 1111-1115.
Lu G-H, Yuan X & Zhao Y-H (2000). QSAR study on the toxicity of substituted benzenes to the algae (Scenedesmus obliquus). Chemosphere 44, 437-440.
Marchini S, Passerini L, Hoglund MD, Pino A & Nendza M. (1999). Toxicity of aryl- and benzylhalides to Daphnia magna and classification of their mode of action based on quantitative structure-activity relationships. Environmental Toxicology and Chemistry 18, 2759-2766.

63
Mazzatorta P, Smiesko M, Lo Piparo E & Benfenati E (2005). QSAR model for predicting pesticide aquatic toxicity. Journal of Chemical Information and Modeling 45, 1767-1774.
Moore DRJ, Breton RL & MacDonald DB (2003). A comparison of model performance for six quantitative structure-activity relationship packages that predict acute toxicity to fish. Environmental Toxicology and Chemistry 22, 1799-1809.
Netzeva TI, Aptula AO, Benfenati E, Cronin MTD, Gini G, Lessigiarska I, Maran U, Vračko M & Schüürmann G (2005). Description of the electronic structure of organic chemicals using semiempirical and ab initio methods for development of toxicological QSARs. Journal of Chemical Information and Modeling 45, 106-114.
OECD (2004). The Report from the Expert Group on (Quantitative) Structure-Activity Relationships [(Q)SARs] on the Principles for the Validation of (Q)SARs. ENV/JM/TG(2004)27/REV. Organisation for Economic Cooperation and Development, Paris, France. 17pp.
OECD (2007). Guidance Document on the Validation of (Quantitative) Structure Activity Relationship [(Q)SAR] Models. OECD Series on Testing and Assessment No. 69. ENV/JM/MONO(2007)2. Organisation for Economic Cooperation and Development, Paris, France. 154 pp. Available from: http://www.oecd.org/document.
Papa E, Villa F & Gramatica P (2005). Statistically validated QSARs, based on theoretical descriptors, for modeling aquatic toxicity of organic chemicals in Pimephales promelas (Fathead Minnow). Journal of Chemical Information and Modeling 45, 1256-1266.
Parkerton TF & Konkel WJ (2000). Application of quantitative structure-activity relationships for assessing the aquatic toxicity of phthalate esters. Ecotoxicology and Environmental Safety 45, 61-78.
Pavan M, Worth AP & Netzeva TI (2005a). Preliminary analysis of an aquatic toxicity dataset and assessment of QSAR models for narcosis. European Commission report EUR 21749 EN. European Commission-Joint Research Centre, Ispra, Italy. Available from ECB website: http//ecb.jrc.it/QSAR.
Pavan M., Worth, A.P., Netzeva, T.I. (2005b) Comparative assessment of QSAR models for aquatic toxicity. European Commission report EUR 21750 EN. European Commission-Joint Research Centre, Ispra, Italy. Available from ECB website: http//ecb.jrc.it/QSAR.
Pavan M, Netzeva TI & Worth AP (2006). Validation of a QSAR Model for Acute Toxicity. SAR & QSAR in Environmental Research 17, 147-171.
Roberts DW & Costello JF (2003) Mechanisms of action for general and polar narcosis: a difference in dimensions. QSAR & Combinatorial Science 22, 226-233
Russom CL, Bradbury SP, Broderius SJ, Hammermeister DE, Drummond R.A. (1997). Predicting modes of action from chemical structure: Acute toxicity in the fathead minnow (Pimephales promelas). Environmental Toxicology and Chemistry 16, 948-967.

64
Salvito DT, Senna RJ & Federle TW (2002). A framework for prioritising fragrance materials for aquatic risk assessment. Environmental Toxicology and Chemistry 21, 1301-1308.
Sanderson H, Johnson DJ, Wilson CJ, Brain RA & Solomon KR (2003). Probabilistic hazard assessment of environmentally occurring pharmaceuticals toxicity to fish, daphnids and algae by ECOSAR screening. Toxicology Letters 144, 383-395.
Sanderson H, Johnson DJ, Reitsma T, Brain RA, Wilson CJ & Solomon KR (2004). Ranking and prioritization of environmental risks of pharmaceuticals in surface waters. Regulatory Toxicology and Pharmacology 39, 158-183.
Schmitt H, Altenburger R, Jastorff B, Schuurmann G (2000). Quantitative structure-activity analysis of the algae toxicity of nitroaromatic compounds. Chemical Research in Toxicology 13, 441-450.
Schultz TW, Carlson RE, Cronin MTD, Hermens JLM, Johnson RP, O'Brien J, Roberts DW, Siraki A, Wallace KB & Veith GD (2006). A conceptual framework for predicting the toxicity of reactive chemicals: modeling soft electrophilicity. SAR & QSAR in Environmental Research 17, 413-428.
Seward JR, Hamblen EL & Schultz TW (2002). Regression comparisons of Tetrahymena pyriformis and Poecilia reticulata toxicity. Chemosphere 47, 93-101.
Sild S, Maran U, Lomaka A & Karelson M (2006). Open Computing grid for Molecular Science and Engineering. Journal of Chemical Information and Computer Science 46, 953-959.
Tao S, Xi X, Xu F, Li B, Cao J & Dawson R (2002). A fragment constant QSAR model for evaluating the EC50 values of organic chemicals to Daphnia Magna. Environmental Pollution 116, 57-64.
Tomlin CDS (1997). The Pesticide Manual, 11th ed. The British Crop Protection Council, Farnham, Surrey, UK.
Toropov AA & Benfenati E (2006). QSAR models for Daphnia toxicity of pesticides based on combinations of topological parameters of molecular structures. Bioorganic & Medicinal Chemistry 14, 2779-2788.
Tremolada P, Finizio A, Villa S, Gaggi C & Vighi M (2004). Quantitative inter-specific chemical activity relationships of pesticides in the aquatic environment. Aquatic Toxicology 67, 87-103.
Tsakovska I, Fabjan E & Worth AP (2007). Summary of Discussions on the Use of QSARs, Read-Across and Grouping in the Technical Committee on New and Existing Substances (TC NES) In: A Compendium of Case Studies that helped to shape the REACH Guidance on Chemical Categories and Read-Across. Worth A & Patlewicz G (Eds). European Commission report EUR 22481 EN. European Commission-Joint Research Centre, Ispra, Italy. Available from ECB website: http//ecb.jrc.it/QSAR.

65
Urrestarazu Ramos E, Vaal MA & Hermens JLM (2002). Interspecies sensitivity in the aquatic toxicity of aromatic amines. Environmental Toxicology and Pharmacology 11, 149-158.
Van Leeuwen CJ, Van der Zandt PTJ, Aldenberg T, Verhaar HJM & Hermens JLM (1992). Application of QSARs, extrapolation and equilibrium partitioning in aquatic effects assessment. I. Narcotic industrial pollutants. Environmental Toxicology and Chemistry 11, 267–282.
Veith GD, Call DJ & Brooke LT (1983). Structure-toxicity relationships for the fathead minnow, Pimephales promelas: narcotic industrial chemicals. Canadian Journal of Fisheries and Aquatic Science 40, 743-748.
Veith GD & Mekenyan OG (1993). A QSAR approach for estimating the aquatic toxicity of soft electrophiles. Quantitative Structure-Activity Relationships 12, 349-356.
Verhaar HJM, van Leeuwen, CJ & Hermens JLM (1992). Classifying environmental pollutants. 1. Structure-activity relationships for prediction of aquatic toxicity. Chemosphere 25, 471-491.
Verhaar HJM, Mulder W & Hermens JLM (1995). QSARs for ecotoxicity. In: Overview of structure-activity relationships for environmental endpoints, Part 1: General outline and procedure. Hermens, J.L.M. (Ed), Report prepared within the framework of the project “QSAR for Prediction of Fate and Effects of Chemicals in the Environment”, an international project of the Environmental Technologies RTD Programme (DGXII/D-1) of the European Commission under contract number EV5V-CT92-0211. Available from: http://ecb.jrc.it/QSAR
Verhaar HJM, Solbe J, Speksnijder J, van Leeuwen CJ & Hermens JLM. (2000). Classifying environmental pollutants: Part 3. External validation of the classification system. Chemosphere 40, 875-883.
Von der Ohe PC, Kühne R, Ebert R-U, Altenburger R, Liess M & Schüürmann G (2005). Structural alerts – a new classification model to discriminate excess toxicity from narcotic effect levels of organic compounds in the acute Daphnid assay. Chemical Research in Toxicology 18, 536-555.
Wong DCL, Dorn PB & Chai EY (1997). Acute toxicity and structure-activity relationships of nine alcohol ethoxylate surfactants to fathead minnow and Daphnia magna. Environmental Toxicology and Chemistry 9, 1970-1976.
Worgan ADP, Dearden JCD, Edwards R, Netzeva TI & Cronin MTD (2003). Evaluation of a novel short-term algal toxicity assay by the development of QSARs and interspecies relationships for narcotic chemicals. QSAR & Combinatorial Science 22, 204-209.
Worth AP, Bassan A, Gallegos A, Netzeva TI, Patlewicz G, Pavan M, Tsakovska I & Vracko M (2005). The Characterisation of (Quantitative) Structure-Activity Relationships: Preliminary Guidance. EUR 21866 EN. European Commission – Joint Research Centre, Ispra, Italy. Available from: http://ecb.jrc.it/QSAR

66
Worth AP, Bassan A, de Bruijn J, Gallegos Saliner A, Netzeva TI, Patlewicz G, Pavan M, Tsakovska I & Eisenreich S. (2007). The role of the European Chemicals Bureau in promoting the regulatory use of (Q)SAR methods. SAR & QSAR in Environmental Research 18, 111-125.
Yan X-F., Xiao H-M, Gong X-D & Ju X-H (2005). Quantitative structure–activity relationships of nitroaromatics toxicity to the algae (Scenedesmus obliguus). Chemosphere 59, 467-471.
Yuan H, Wang Y & Cheng Y (2007). Local and global quantitative structure-activity relationship modeling and prediction for the baseline toxicity. Journal of Chemical Information and Modeling 47, 159-169.
Zaroogian G, Heltshe JF & Johnson M. (1985). Estimation of toxicity to marine species with structure activity models developed to estimate toxicity to freshwater fish. Aquatic Toxicology 6, 251-270.
Zvinavashe E, Murk A, Vervoort J & Soffers AEMF (2006). Quantum chemistry based quantitative structure-activity relationships for modeling the (sub)acute toxicity of substituted mononitrobenzenes in aquatic systems. Environmental Toxicology and Chemistry 25, 2313-2321.

67
Appendix 1. Chemical Abstract Number (CAS), name and acute toxicity to the
fathead minnow (96-h log (1/LC50)) of the compounds studied by Netzeva et al.
(2005). The use of this data set requires citation of the original paper.
CAS
Name
Log (1/LC50)
(mmol/L)
10015 4-(hexyloxy)-m-anisaldehyde 1.947
10026 5-bromo-2-nitrovanillin 0.576
10048 p-chlorophenyl-o-nitrophenyl ether 2.114
10059 3'-chloro-o-formotoluidide 0.561
10060 di-n-butylisophtalate 2.490
10071 1,1-diphenyl-2-propyn-1-ol 1.273
10082 4,7-dithiadecane 1.375
10117 4,9-dithiadodecane 1.839
10151 2-chloroethyl-n-cyclohexyl carbamate 0.769
50066 phenobarbital -0.319
51285 2,4-dinitrophenol 1.141
51796 urethane -1.770
54217 salicylic acid, sodium salt -1.130
55210 benzamide -0.737
57147 1,1-dimethylhydrazine 0.884
57330 pentobarbital 0.700
57432 amobarbital 0.423
58082 caffeine 0.109
58275 2-methyl-1,4-naphthoquinone 3.195
58902 2,3,4,6-tetrachlorophenol 2.352
59507 4-chloro-3-methyl phenol 1.286
59972 tolazoline hydrochloride -0.255
60139 amphetamine sulfate 1.107
60297 diethyl ether -1.538
60413 strychnine hemisulphate salt 2.538
62533 aniline -0.158
63252 carbaryl 1.353

68
64175 ethanol -2.489
65305 nicotine sulfate 1.535
65452 2-hydroxybenzamide 0.133
66251 hexanal 0.855
66762 dicumarol 1.818
67367 p-phenoxybenzaldehyde 1.634
67561 methanol-rhodamine -2.963
67630 2-propanol -2.205
67641 acetone -2.146
67663 chloroform 0.228
67685 methyl sulfoxide -2.639
67721 hexachloroethane 2.190
70304 2,2'-methylene bis(3,4,6-trichlorophenol) 4.287
70699 4'-aminopropiophenone 0.009
71238 1-propanol -1.887
71363 1-butanol -1.368
71410 1-pentanol -0.729
71432 benzene 0.502
71556 1,1,1-trichloroethane 0.402
71738 thiopental,sodium salt 1.004
75058 acetonitrile -1.603
75070 ethanal 0.155
75092 dichloromethane -0.589
75478 iodoform 2.130
75650 2-methyl-2-propanol -1.937
75898 2,2,2-trifluoroethanol -0.075
75978 3,3-dimethyl-2-butanone 0.061
76017 pentachloroethane 1.429
77714 5,5-dimethylhydantoin -2.109
77747 3-methyl-3-pentanol -0.818
77758 3-methyl-1-pentyn-3-ol -1.094
78273 1-ethynyl-cyclohexanol -0.314
78513 tris(2-butoxyethyl) phosphate 1.551

69
78831 2-methyl-1-propanol -1.285
78875 1,2-dichloropropane -0.051
78900 1,2-diaminopropane -1.134
78922 2-butanol -1.695
78933 2-butanone -1.650
78966 1-amino-2-propanol -1.526
79005 1,1,2-trichloroethane 0.213
79016 trichloroethylene 0.474
79209 methyl acetate -0.635
79345 1,1,2,2-tetrachloroethane 0.917
79776 b-ionone 1.577
79958 4,4'-isopropylidenebis(2,6-dichlorophenol) 2.440
80466 p-tert-pentylphenol 1.802
80524 1,8-diamino-p-menthane 0.416
81196 a,a-2,6-tetrachlorotoluene 2.375
83329 acenaphthene 1.950
83341 3-methylindole 1.171
83794 rotenone 4.943
84628 diphenyl phthalate 3.600
84662 diethyl phthalate 0.844
84742 di-n-butylorthophthalate 2.515
86500 azinphos-methyl 3.695
87172 salicylanilide 1.732
87683 hexachloro-1,3-butadiene 3.462
87865 pentachlorophenol 3.079
88062 2,4,6-trichlorophenol 1.334
88302 3-trifluoromethyl-4-nitrophenol 1.355
88686 anthranilamide -0.463
88755 2-nitrophenol -0.061
88857 2-sec-butyl-4,6-dinitrophenol 2.536
90028 salicylaldehyde 1.725
90153 1-naphthol 1.493
90437 2-phenylphenol 1.442

70
90595 3,5-dibromosalicylaldehyde 2.518
91203 naphthalene 1.320
91225 quinoline 0.220
91656 N,N-diethylcyclohexylamine 0.861
91667 N,N-diethylaniline 0.959
91883 2-(n-ethyl-m-toluidino)ethanol 0.530
93914 1-benzoylacetone 2.169
94097 ethyl p-aminobenzoate 0.662
94622 piperine 1.561
95012 2,4-dihydroxybenzaldehyde 1.023
95476 o-xylene 0.811
95487 o-cresol 0.888
95501 1,2-dichlorobenzene 1.191
95512 2-chloroaniline 1.351
95523 2-fluorotoluene 0.756
95578 2-chlorophenol 0.969
95636 1,2,4-trimethylbenzene 1.192
95750 3,4-dichlorotoluene 1.743
95761 3,4-dichloroaniline 1.364
96059 allyl methacrylate 2.105
96139 2,3-dibromopropanol 0.487
96173 2-methylbutyraldehyde 0.936
96184 1,2,3-trichloropropane 0.346
96220 3-pentanone -1.252
96297 2-butanone oxime -0.986
96800 2-(diisopropylamino)ethanol -0.141
97029 2,4-dinitroaniline 1.072
97234 2,2'-methylenebis(4-chlorophenol) 2.939
98544 p-tert-butylphenol 1.465
98828 isopropylbenzene 1.279
98862 acetophenone -0.130
98953 nitrobenzene 0.015
99036 m-aminoacetophenone -0.451

71
99081 m-nitrotoluene 0.729
99978 N,N-dimethyl-p-toluidine 0.415
100016 p-nitroaniline 0.043
100027 4-nitrophenol 0.375
100107 p-dimethylaminobenzaldehyde 0.514
100254 1,4-dinitrobenzene 2.374
100378 N,N-diethylethanolamine -1.182
100414 ethylbenzene 0.943
100469 benzylamine 0.021
100527 benzaldehyde 1.144
100618 N-methylaniline 0.030
100641 cyclohexanone oxime -0.264
100709 2-cyanopyridine -0.843
100710 2-ethylpyridine -0.587
100798 solketal -2.102
100970 hexamethylenetetramine -2.551
101848 phenyl ether 1.629
102272 N-ethyl-m-toluidine 0.436
102692 tripropylamine 0.449
102716 triethanolamine -1.898
103059 benzyl-tert-butanol 0.393
103764 1-(2-hydroxyethyl)piperazine -1.692
103833 N,N-dimethylbenzylamine 0.554
103902 4-acetamidophenol -0.731
104132 4-butylaniline 1.165
104405 nonylphenol 3.197
104767 2-ethyl-1-hexanol 0.664
104881 4-chlorobenzaldehyde 1.805
104905 5-ethyl-2-methylpyridine 0.174
105146 5-diethylamino-2-pentanone -0.330
105533 diethyl malonate 1.017
105679 2,4-dimethylphenol 0.867
105759 dibutyl fumarate 2.686

72
105997 dibutyl adipate 1.851
106401 p-bromoaniline 0.559
106423 p-xylene 1.078
106445 4-methylphenol 0.817
106478 4-chloroaniline 0.620
106489 4-chlorophenol 1.323
106490 4-toluidine -0.143
106638 isobutyl acrylate 1.788
106945 1-bromopropane 0.262
107028 acrolein 3.448
107062 1,2-dichloroethane -0.138
107073 2-chloroethanol 0.203
107108 propylamine -0.717
107120 propionitrile -1.441
107142 chloroacetonitrile 1.748
107153 ethylenediamine -0.564
107186 allyl alcohol 2.259
107197 2-propyn-1-ol 1.564
107299 acetaldoxime -0.109
107415 2-methyl-2,4-pentanediol -1.957
107459 tert-octylamine 0.720
107471 tert-butyl sulfide 0.701
107879 2-pentanone -1.158
108101 4-methyl-2-pentanone -0.732
108203 isopropyl ether -0.886
108883 toluene 0.406
108894 4-picoline -0.636
108907 chlorobenzene 0.823
108930 cyclohexanol -0.847
108941 cyclohexanone -0.873
108952 phenol 0.514
108996 3-picoline -0.190
109013 1-methylpiperazine -1.361

73
109068 2-picoline -0.984
109079 2-methylpiperazine -1.350
109604 propyl acetate 0.231
109648 1,3-dibromopropane 1.918
109659 1-bromobutane 0.572
109739 butylamine -0.564
109751 allyl cyanide -0.433
109762 1,3-diaminopropane -1.206
109773 malononitrile 2.072
109853 2-methoxyethylamine -0.844
109897 diethylamine -1.068
109977 pyrrole -0.496
109999 tetrahydrofuran -1.476
110009 furan 0.048
110065 tert-butyl disulfide 2.115
110123 5-methyl-2-hexanone -0.144
110407 diethyl sebacate 1.981
110430 2-heptanone -0.060
110543 hexane 1.537
110565 1,4-dichlorobutane 0.391
110587 amylamine -0.308
110623 valeraldehyde 0.842
110656 2-butyne-1,4-diol 0.206
110736 2-(ethylamino)ethanol -1.220
110827 cyclohexane 1.269
110861 pyridine -0.127
110883 s-trioxane -1.820
110930 6-methyl-5-hepten-2-one 0.168
111137 2-octanone 0.552
111159 2-ethoxyethyl acetate 0.497
111251 1-bromohexane 1.680
111262 hexylamine 0.252
111273 1-hexanol 0.019

74
111422 diethanolamine -2.651
111466 2-hydroxyethyl ether -2.850
111477 n-propyl sulfide 0.736
111682 n-heptylamine 0.723
111693 1,4-dicyanobutane -1.252
111706 1-heptanol 0.527
111831 1-bromooctane 2.363
111864 octylamine 1.396
111875 1-octanol 0.950
111900 2-(2-ethoxyethoxy)ethanol -2.296
112050 nonanoic acid 0.182
112129 2-undecanone 2.055
112209 nonylamine 1.822
112276 triethylene glycol -2.601
112301 1-decanol 1.819
114261 propoxur 1.376
115195 2-methyl-3-butyn-2-ol -1.592
115208 2,2,2-trichloroethanol -0.301
115322 dicofol 2.788
115866 triphenyl phosphate 2.574
115902 fensulfothion 0.854
116063 aldicarb 2.344
118558 phenyl salicylate 2.259
118616 ethyl salicylate 0.924
118796 2,4,6-tribromophenol 1.704
119346 4-amino-2-nitrophenol 0.629
119619 benzophenone 1.108
120070 N-phenyldiethanolamine -0.608
120218 4-(diethylamino)benzaldehyde 0.870
120809 catechol 1.077
120821 1,2,4-trichlorobenzene 1.783
120832 2,4-dichlorophenol 1.323
121142 2,4-dinitrotoluene 0.875

75
121324 3-ethoxy-4-hydroxybenzaldehyde 0.278
121335 vanillin 0.426
121697 N,N-dimethylaniline 0.190
121733 1-chloro-3-nitrobenzene 0.923
121755 malathion 1.370
121879 2-chloro-4-nitroaniline 0.961
122032 p-isopropyl benzaldehyde 1.350
122394 diphenylamine 1.650
122996 2-phenoxyethanol -0.396
123079 4-ethylphenol 1.070
123159 2-methylvaleraldehyde 0.727
123546 2,4-pentanedione -0.243
123660 ethyl hexanoate 1.210
123728 butanal 0.654
123864 butyl acetate 0.810
123911 1,4-dioxane -2.048
124221 dodecylamine 3.255
126738 tributyl phosphate 1.384
126818 5,5-dimethyl-1,3-cyclohexanedione -1.914
127004 1-chloro-2-propanol -0.414
127184 tetrachloroethylene 1.093
127662 2-phenyl-3-butyn-2-ol 0.112
128370 2,6-di-tert-butyl-4-methylphenol 2.783
128449 saccharin, sodium salt hydrate -1.950
132649 dibenzofuran 1.959
133119 phenyl 4-aminosalicylate 1.744
134623 N,N-diethyl-m-toluamide 0.240
137406 propionic acid, sodium salt -1.698
140318 1-(2-aminoethyl)piperazine -1.229
141037 dibutyl succinate 1.713
141286 diethyl adipate 1.081
141435 2-aminoethanol -1.530
141786 ethyl acetate -0.417

76
141935 m-diethylbenzene 1.510
142289 1,3-dichloropropane -0.064
142621 hexanoic acid -0.440
142927 hexyl acetate 1.516
142961 butyl ether 0.606
143088 1-nonanol 1.403
143168 di-n-hexylamine 2.376
148538 o-vanillin 1.767
150196 3-methoxyphenol 0.225
150765 4-methoxyphenol 0.053
150787 p-dimethoxybenzene 0.072
271896 2,3-benzofuran 0.926
280579 1,4-diazabicyclo[2.2.2]octane -1.188
281232 adamantane 2.687
298044 Disulfoton 1.839
309433 secobarbital, sodium salt 1.043
314409 bromacil 0.147
329715 2,5-dinitrophenol 1.739
330541 diuron 1.215
330938 p-fluorophenyl ether 2.235
333415 diazinon 1.513
350469 1-fluoro-4-nitrobenzene 0.696
368774 a,a,a-trifluoro-m-tolunitrile 0.555
371404 4-fluoroaniline 0.818
387451 2-chloro-6-fluorobenzaldehyde 1.227
393395 a,a,a-4-tetrafluoro-o-toluidine 0.782
446526 o-fluorobenzaldehyde 1.963
447609 a,a,a-trifluoro-o-tolunitrile 0.608
454897 a,a,a-trifluoro-m-tolualdehyde 2.277
459596 4-fluoro-n-methylaniline 0.513
464459 [(1S)-endo]-(-)-borneol 0.417
464482 (1S)-(-)-camphor 0.952
470826 cineole 0.180

77
471772 neoabietic acid 2.248
496162 2,3-dihydrobenzofuran 0.168
497370 exo-norborneol -0.308
498668 norbornylene 0.974
499832 2,6-pyridinedicarboxylic acid -0.285
500221 3-pyridinecarboxaldehyde 0.815
502567 5-nonanone 0.662
513815 2,3-dimethyl-1,3-butadiene 1.075
514103 abietic acid 2.104
525826 flavone 1.803
527606 2,4,6-trimethylphenol 1.020
529191 o-tolunitrile 0.418
529204 o-tolualdehyde 0.356
532321 benzoic acid, sodium salt -0.526
534521 4,6-dinitro-o-cresol 2.007
538681 amylbenzene 1.938
540885 tert-butyl acetate -0.449
541731 1,3-dichlorobenzene 1.263
544401 n-butyl sulfide 1.611
552410 2'-hydroxy-4'-methoxyacetophenone 0.481
552896 o-nitrobenzaldehyde 0.959
555168 4-nitrobenzaldehyde 1.175
563804 3-methyl-2-butanone -1.001
573568 2,6-dinitrophenol 0.666
583539 1,2-dibromobenzene 1.765
589093 N-allylaniline 0.569
589162 4-ethylaniline 0.220
590863 isovaleraldehyde 1.423
591786 2-hexanone -0.631
593088 2-tridecanone 2.741
596850 manool 3.384
597648 tetraethyltin 4.330
598743 1,2-dimethylpropylamine -0.513

78
600362 2,4-dimethyl-3-pentanol -0.147
607001 N,N-diphenylformamide 0.875
607818 diethyl benzylmalonate 1.664
608719 pentabromophenol 3.720
609234 2,4,6-triiodophenol 2.591
613456 2,4-dimethoxybenzaldehyde 0.917
614802 2-acetamidophenol 0.835
615656 2-chloro-4-methylaniline 0.596
616864 4-ethoxy-2-nitroaniline 0.846
619501 methyl p-nitrobenzoate 0.881
619807 4-nitrobenzamide 0.097
620882 4-nitrophenyl phenyl ether 1.910
621089 benzyl sulfoxide 0.459
621421 3-acetamidophenol -0.874
622402 4-(2-hydroxyethyl)morpholine -1.315
623256 a,a'-dichloro-p-xylene 3.652
625865 2,5-dimethylfuran 0.131
628762 1,5-dichloropentane 0.746
629049 1-bromoheptane 2.086
629196 propyl disulfide 1.759
629403 1,6-dicyanohexane -0.588
634673 2,3,4-trichloroaniline 1.732
635938 5-chlorosalicylaldehyde 2.308
645567 4-propylphenol 1.093
653372 pentafluorobenzaldehyde 2.251
683727 2,2-dichloroacetamide -0.275
693163 1-methyl heptylamine 1.403
693549 2-decanone 1.438
693652 pentyl ether 1.703
693936 4-methyloxazole -1.223
693981 2-methylimidazole -0.542
700583 2-adamantanone 0.393
706149 a-decanolactone 0.976

79
708769 4,6-dimethoxy-2-hydroxybenzaldehyde 1.832
709988 propanil 1.404
732263 2,4,6-tri-tert-butylphenol 3.634
760236 3,4-dichloro-1-butene 1.127
761659 N,N-dibutylformamide 0.246
764012 2-butyn-1-ol 0.841
764136 2,5-dimethyl-2,4-hexadiene 1.465
768945 1-adamantanamine 0.782
769288 3-cyano-4,6-dimethyl-2-hydroxypyridine -0.025
771608 2,3,4,5,6-pentafluoroaniline 0.693
786196 carbophenothion 3.155
791286 triphenylphosphine oxide 0.715
818611 2-hydroxyethyl acrylate 1.384
818724 1-octyn-3-ol 2.485
821556 2-nonanone 0.971
822866 trans-1,2-dichlorocyclohexane 0.920
831823 p-phenoxyphenol 1.575
868779 2-hydroxyethyl methacrylate -0.242
872311 3-bromothiophene 1.421
874420 2,4-dichlorobenzaldehyde 1.988
882337 phenyl disulfide 3.298
886862 ethyl 3-aminobenzoate methanesulfonic acid salt 0.520
920661 1,1,1,3,3,3-hexafluoro-2-propanol -0.162
924414 1,5-hexadien-3-ol 0.411
927742 3-butyn-1-ol 0.288
928961 cis-3-hexen-1-ol -0.580
928972 trans-3-hexen-1-ol -0.432
932161 2-acetyl-1-methylpyrrole -0.105
939231 4-phenylpyridine 0.984
945517 phenyl sulfoxide 0.365
999611 2-hydroxypropyl acrylate 1.557
1072975 2-amino-5-bromopyridine -0.010
1080326 diethyl benzylphosphonate -0.168

80
1122549 4-acetylpyridine -0.142
1126461 methyl p-chlorobenzoate 1.191
1126790 butyl phenyl ether 1.416
1129357 methyl 4-cyanobenzoate 0.537
1198556 tetrachlorocatechol 2.290
1204213 a-bromo-2',5'-dimethoxyacetophenone 3.474
1461252 tetrabutyltin 3.885
1482151 3,4-dimethyl-1-pentyn-3-ol -0.262
1484135 N-vinylcarbazole 4.781
1484260 3-benzyloxyaniline 1.338
1563662 carbofuran 2.419
1634044 tert-butyl methyl ether -0.882
1647161 1,9-decadiene 2.678
1689823 p-phenylazophenol 2.229
1689834 3,5-diiodo-4-hydroxybenzonitrile 1.737
1689845 3,5-dibromo-4-hydroxybenzonitrile #1 1.382
1740198 dehydroabietic acid 2.156
1745819 2-allylphenol 0.952
1746232 tert-butylstyrene 2.515
1761611 5-bromosalicylaldehyde 2.189
1871574 3-chloro-2-chloromethyl-1-propene 2.818
1891958 3,5-dichloro-4-hydroxybenzonitrile 0.889
1962750 di-n-butylterephthalate 2.674
1965099 4,4'-dihydroxydiphenyl ether 1.588
2008584 2,6-dichlorobenzamide -0.392
2016571 n-decylamine 2.184
2032599 aminocarb 2.029
2034222 2,4,5-tribromoimidazole 1.583
2104645 o-ethyl o-(p-nitrophenyl phenyl)phosphonothioate 3.614
2117115 (+-)-4-pentyn-2-ol 0.380
2138229 4-chlorocatechol 1.961
2150472 methyl 2,4-dihydroxybenzoate 0.565
2176627 pentachloropyridine 2.728
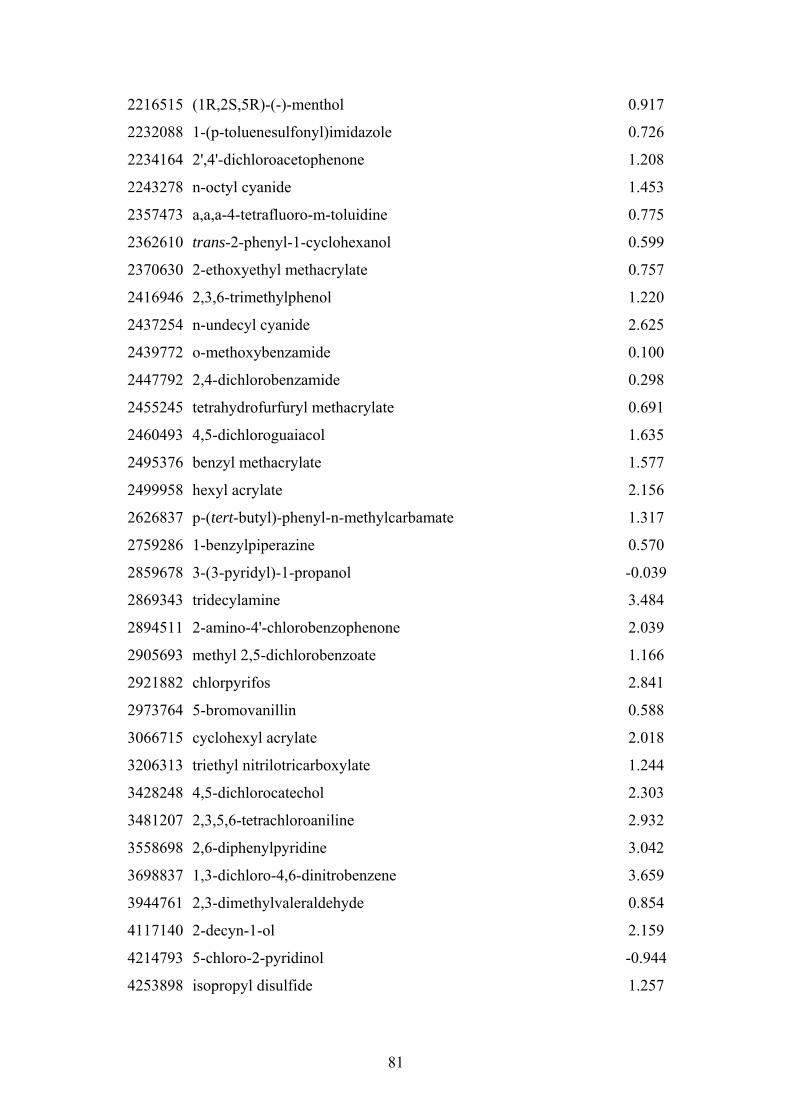
81
2216515 (1R,2S,5R)-(-)-menthol 0.917
2232088 1-(p-toluenesulfonyl)imidazole 0.726
2234164 2',4'-dichloroacetophenone 1.208
2243278 n-octyl cyanide 1.453
2357473 a,a,a-4-tetrafluoro-m-toluidine 0.775
2362610 trans-2-phenyl-1-cyclohexanol 0.599
2370630 2-ethoxyethyl methacrylate 0.757
2416946 2,3,6-trimethylphenol 1.220
2437254 n-undecyl cyanide 2.625
2439772 o-methoxybenzamide 0.100
2447792 2,4-dichlorobenzamide 0.298
2455245 tetrahydrofurfuryl methacrylate 0.691
2460493 4,5-dichloroguaiacol 1.635
2495376 benzyl methacrylate 1.577
2499958 hexyl acrylate 2.156
2626837 p-(tert-butyl)-phenyl-n-methylcarbamate 1.317
2759286 1-benzylpiperazine 0.570
2859678 3-(3-pyridyl)-1-propanol -0.039
2869343 tridecylamine 3.484
2894511 2-amino-4'-chlorobenzophenone 2.039
2905693 methyl 2,5-dichlorobenzoate 1.166
2921882 chlorpyrifos 2.841
2973764 5-bromovanillin 0.588
3066715 cyclohexyl acrylate 2.018
3206313 triethyl nitrilotricarboxylate 1.244
3428248 4,5-dichlorocatechol 2.303
3481207 2,3,5,6-tetrachloroaniline 2.932
3558698 2,6-diphenylpyridine 3.042
3698837 1,3-dichloro-4,6-dinitrobenzene 3.659
3944761 2,3-dimethylvaleraldehyde 0.854
4117140 2-decyn-1-ol 2.159
4214793 5-chloro-2-pyridinol -0.944
4253898 isopropyl disulfide 1.257

82
4460860 2,4,5-trimethoxybenzaldehyde 0.598
4655349 isopropyl methacrylate 0.528
4798441 1-hexen-3-ol 0.518
4901513 2,3,4,5-tetrachlorophenol 2.752
4916578 1,2-bis(4-pyridyl)ethane 0.086
5217470 1,3-diethyl-2-thiobarbituric acid -1.353
5292455 dimethyl nitroterephthalate 1.564
5331919 5-chloro-2-mercaptobenzothiazole 1.798
5372816 dimethyl aminoterephthalate 1.369
5395755 3,6-dithiaoctane 0.397
5407045 3-dimethylaminopropyl chloride hydrochloride 0.075
5465656 4'-chloro-3'-nitroacetophenone 1.560
5600215 2-amino-4-chloro-6-methylpyrimidine -0.010
5673074 2,6-dimethoxytoluene 0.877
5683330 2-dimethylaminopyridine -0.017
5813649 2,2-dimethyl-1-propylamine -0.736
5835267 isopimaric acid 2.541
5922601 2-amino-5-chlorobenzonitrile 0.727
6001645 1,1,1-trichloro-2-methyl-2-propanol hydrate 0.119
6175491 2-dodecanone 2.194
6203185 4-dimethylaminocinnamaldehyde 1.473
6284839 1,3,5-trichloro-2,4-dinitrobenzene 3.087
6361213 2-chloro-5-nitrobenzaldehyde 1.689
6575093 2-chloro-6-methylbenzonitrile 1.002
6602320 2-bromo-3-pyridinol -0.431
6636788 2-chloro-3-pyridinol -0.681
6921295 tripropargylamine -0.353
6948863 N,N-bis(2,2-diethoxyethyl)methylamine -0.384
7209383 1,4-bis(3-aminopropyl)piperazine -1.190
7212444 3-hydroxy-3,7,11-trimethyl-1,6,10-dodecatriene 2.192
7250671 1-(2-chloroethyl)pyrrolidine.hcl 0.046
7307553 n-undecylamine 2.912
7383199 1-heptyn-3-ol 1.804

83
10031820 p-ethoxybenzaldehyde 0.728
10293068 [1(R)-endo]-(+)-3-bromocamphor 0.528
10453868 resmethrin 4.740
13071799 terbufos 4.336
13209159 a,a,a',a'-tetrabromo-o-xylene 2.985
13608872 2',3',4'-trichloroacetophenone 2.048
13909734 2',3',4'-trimethoxyacetophenone -0.037
14064109 diethyl chloromalonate 2.311
14321278 N-ethylbenzylamine 0.374
14548459 4-bromophenyl 3-pyridyl ketone 1.109
14548460 4-benzoylpyridine 0.250
15045439 2,2,5,5-tetramethyltetrahydrofuran -0.117
15128822 3-hydroxy-2-nitropyridine -0.076
15972608 alachlor 1.732
16245797 4-octylaniline 3.233
16752775 methomyl (lannate) 1.886
16879020 6-chloro-2-pyridinol -0.218
17584122 3-amino-5,6-dimethyl-1,2,4-triazine -0.885
17754904 4-(diethylamino)salicylaldehyde 1.557
18368633 6-chloro-2-picoline -0.260
19549985 3,6-dimethyl-1-heptyn-3-ol 0.457
20662844 2,4,5-trimethyloxazole -0.606
22104627 4-dimethylamino-3-methyl-2-butanone 1.182
22726007 m-bromobenzamide 0.334
23135220 oxamyl 1.422
24544045 2,6-diisopropylaniline 1.096
29553262 2-methyl-3,3,4,4-tetrafluoro-2-butanol -0.561
30030252 chloromethyl styrene 2.692
33966506 (+-)-sec-butylamine -0.575
34274049 N-(3-methoxypropyl)-3,4,5-trimethoxybenzylamine 0.297
34723825 2-(bromomethyl)tetrahydro-2H-pyran -0.059
37529309 4-decylaniline 3.576
39905572 4-hexyloxyaniline 1.839
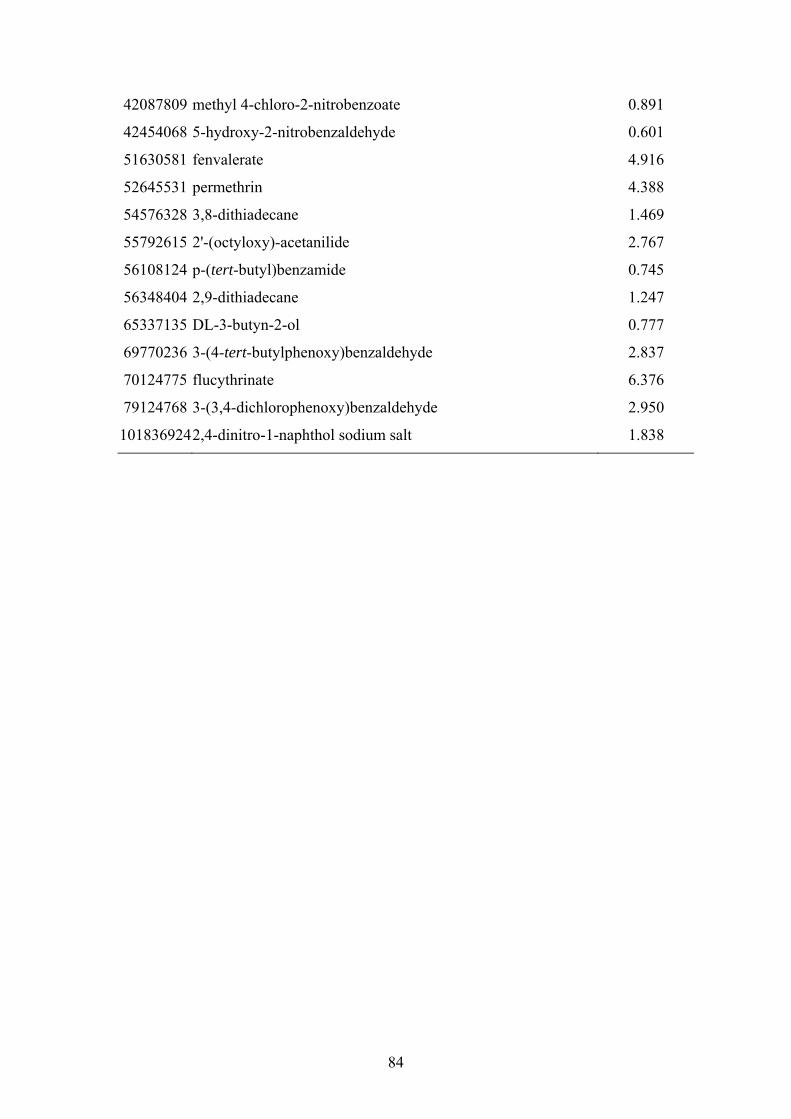
84
42087809 methyl 4-chloro-2-nitrobenzoate 0.891
42454068 5-hydroxy-2-nitrobenzaldehyde 0.601
51630581 fenvalerate 4.916
52645531 permethrin 4.388
54576328 3,8-dithiadecane 1.469
55792615 2'-(octyloxy)-acetanilide 2.767
56108124 p-(tert-butyl)benzamide 0.745
56348404 2,9-dithiadecane 1.247
65337135 DL-3-butyn-2-ol 0.777
69770236 3-(4-tert-butylphenoxy)benzaldehyde 2.837
70124775 flucythrinate 6.376
79124768 3-(3,4-dichlorophenoxy)benzaldehyde 2.950
101836924 2,4-dinitro-1-naphthol sodium salt 1.838

85
Appendix 2. Chemical Abstract Number (CAS), name and acute toxicity to the
Daphnia (48-h log LC50) of the compounds studied by von der Ohe et al. (2005). The
use of this data set requires citation of the original paper.
CAS
Name
Log LC50
(mol/L)
50293 DDT D. magna -7.89
51285 2,4-dinitrophenol D. magna -4.62
52686 trichlorofon D. magna -6.31
55389 fenthion D. magna -6.79
55630 nitroglycerine D. magna -3.85
56235 tetrachloromethane D. magna -3.64
56382 parathion D. magna -8.17
58140 pyrimethamine D. magna -4.63
58899 lindane D. magna -5.39
58902 2,3,4,6-tetrachlorophenol D. magna -6.12
59063 ethopabate D. magna -3.07
59507 4-chloro-3-methylphenol D. magna -4.85
60515 dimethoate D. magna -4.94
60571 dieldrin D. magna -6.28
62533 aniline D. magna -5.33
62555 thioacetamide D. magna -3.64
62566 thiourea D. magna -3.84
62737 dichlorvos D. magna -9.10
63252 carbaryl D. magna -7.33
64175 ethanol D. magna -0.59
67641 acetone D. magna -0.62
67663 trichlormethane D. magna -2.72
67721 hexachloroethane D. magna -4.83
68122 N,N-dimethylformamide D. magna -0.70
71238 1-propanol D. magna -0.93
71432 benzene D. magna -2.48
72208 endrin D. magna -6.38

86
74839 methyl bromide D. magna -4.63
75058 acetonitrile D. magna -1.06
75070 acetaldehyde D. magna -0.55
75081 ethyl mercaptan D. magna -5.56
75092 dichlormethane D. magna -2.59
75150 carbon disulfide D. magna -4.56
75218 ethylene oxide D. magna -2.32
75252 bromoform D. magna -3.74
75354 1,1-dichloroethene D. magna -3.28
76017 pentachloroethane D. magna -3.97
77474 hexachlorocyclopentadiene D. magna -6.72
78591 isophorone D. magna -3.06
78831 2-methyl-1-propanol D. magna -1.82
78875 1,2-dichloropropane D. magna -3.34
78999 1,1-dichloropropane D. magna -3.57
79005 1,1,2-trichloroethane D. magna -3.09
79016 trichloroethene D. magna -3.35
79061 acrylamide D. magna -2.65
79094 propionic acid D. magna -3.17
79345 1,1,2,2-tetrachloroethane D. magna -3.45
83410 1,2-dimethyl-3-nitrobenzene D. magna -4.56
83421 2-chloro-6-nitrotoluene D. magna -4.61
84662 diethyl phthalate D. magna -3.61
84742 dibutyl phthalate D. magna -4.88
85018 phenanthrene D. magna -5.36
85687 butyl benzyl phthalate D. magna -5.19
86306 N-nitrosodiphenylamine D. magna -4.40
86748 carbazole D. magna -4.70
87865 pentachlorophenol D. magna -5.64
88722 1-methyl-2-nitrobenzene D. magna -4.14
88733 1-chloro-2-nitrobenzene D. magna -3.64
88857 2-(1-methylpropyl)-4,6-dinitrophenol D. magna -6.00
88891 2,4,6-trinitrophenol D. magna -3.43

87
89598 4-chloro-2-nitrotoluene D. magna -4.27
89612 1,4-dichloro-2-nitrobenzene D. magna -4.26
90028 salicylaldehyde D. magna -4.45
90040 o-aminoanisole D. magna -4.01
90051 2-methoxyphenol D. magna -3.68
90131 1-chloronaphthalene D. magna -5.01
90437 2-phenylphenol D. magna -5.38
91203 naphthalene D. magna -4.12
91225 quinoline D. magna -3.53
91645 coumarin D. magna -4.03
91941 3,3’-dichlorobenzidine D. magna -5.38
92524 biphenyl D. magna -4.66
92693 4-phenylphenol D. magna -4.67
94757 2,4-dichlorophenoxyacetic acid D. magna -3.17
95158 benzo[b]thiophene D. magna -3.36
95476 o-xylene D. magna -3.78
95487 o-cresol D. magna -3.87
95501 1,2-dichlorobenzene D. magna -4.81
95512 2-chloroaniline D. magna -5.19
95534 ortho-toluidine D. magna -5.31
95578 2-chlorophenol D. magna -4.34
95761 3,4-dichlorobenzenamine D. magna -5.95
95829 2,5-dichloroaniline D. magna -4.74
95954 2,4,5-trichlorophenol D. magna -4.86
96093 1,2-epoxyethylbenzene D. magna -4.02
96184 1,2,3-trichloropropane D. magna -3.72
96457 ethylene thiourea D. magna -3.59
97007 1-chloro-2,4-dinitrobenzene D. magna -5.40
97745 bis(dimethylthiocarbamyl)sulfide D. magna -4.86
97778 bis(diethylthiocarbamoyl)disulfide D. magna -5.56
98828 cumene D. magna -3.64
98953 nitrobenzene D. magna -3.48
99081 1-methyl-3-nitrobenzene D. magna -4.04

88
99514 1,2-dimethyl-4-nitrobenzene D. magna -3.98
99650 1,3-dinitrobenzene D. magna -3.59
99876 cymene D. magna -4.32
99990 4-methylnitrobenzene D. magna -4.01
100005 4-chloronitrobenzene D. magna -4.31
100027 4-nitrophenol D. magna -3.96
100414 ethyl benzene D. magna -3.54
100425 styrene D. magna -3.41
100618 N-methylaniline D. magna -5.79
101553 4-bromophenyl-phenyl ether D. magna -5.84
101848 diphenyl ether D. magna -5.46
102089 diphenylthiourea D. magna -3.53
103695 ethylaniline D. magna -5.46
103720 isothiocyanatobenzene D. magna -6.13
103855 phenylthiourea D. magna -3.54
104949 4-methoxybenzenamine D. magna -5.57
105373 ethyl propionate D. magna -2.78
105555 1,3-diethylthiourea D. magna -2.84
105679 2,4-dimethylphenol D. magna -4.77
106412 4-bromophenol D. magna -4.46
106423 p-xylene D. magna -3.52
106445 p-cresol D. magna -3.71
106467 1,4-dichlorobenzene D. magna -4.17
106478 4-chloroaniline D. magna -6.41
106489 4-chlorophenol D. magna -4.42
106898 epichlorohydrin D. magna -3.58
107028 acrolein D. magna -6.00
107039 1-propanethiol D. magna -6.10
107062 1,2-dichloroethane D. magna -2.29
107073 2-chloroethanol D. magna -2.61
107119 allylamine D. magna -3.15
107131 acrylonitrile D. magna -3.78
107153 ethylenediamine D. magna -3.36
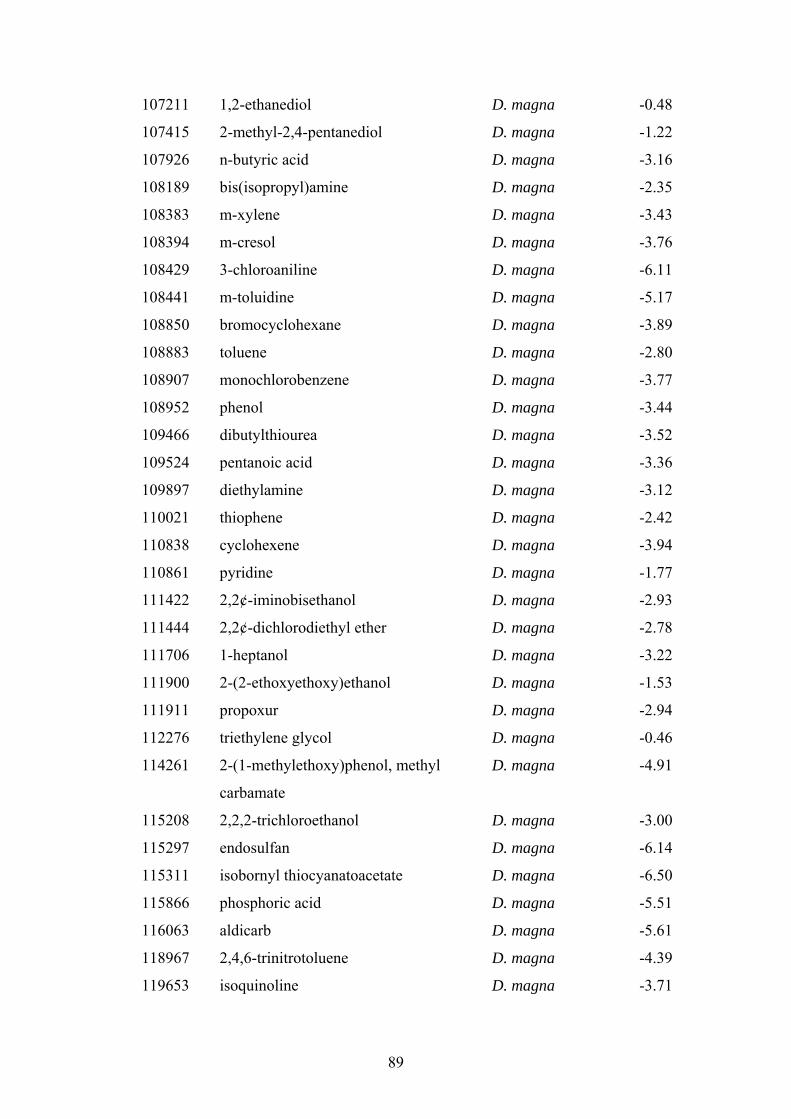
89
107211 1,2-ethanediol D. magna -0.48
107415 2-methyl-2,4-pentanediol D. magna -1.22
107926 n-butyric acid D. magna -3.16
108189 bis(isopropyl)amine D. magna -2.35
108383 m-xylene D. magna -3.43
108394 m-cresol D. magna -3.76
108429 3-chloroaniline D. magna -6.11
108441 m-toluidine D. magna -5.17
108850 bromocyclohexane D. magna -3.89
108883 toluene D. magna -2.80
108907 monochlorobenzene D. magna -3.77
108952 phenol D. magna -3.44
109466 dibutylthiourea D. magna -3.52
109524 pentanoic acid D. magna -3.36
109897 diethylamine D. magna -3.12
110021 thiophene D. magna -2.42
110838 cyclohexene D. magna -3.94
110861 pyridine D. magna -1.77
111422 2,2¢-iminobisethanol D. magna -2.93
111444 2,2¢-dichlorodiethyl ether D. magna -2.78
111706 1-heptanol D. magna -3.22
111900 2-(2-ethoxyethoxy)ethanol D. magna -1.53
111911 propoxur D. magna -2.94
112276 triethylene glycol D. magna -0.46
114261
2-(1-methylethoxy)phenol, methyl
carbamate
D. magna
-4.91
115208 2,2,2-trichloroethanol D. magna -3.00
115297 endosulfan D. magna -6.14
115311 isobornyl thiocyanatoacetate D. magna -6.50
115866 phosphoric acid D. magna -5.51
116063 aldicarb D. magna -5.61
118967 2,4,6-trinitrotoluene D. magna -4.39
119653 isoquinoline D. magna -3.71
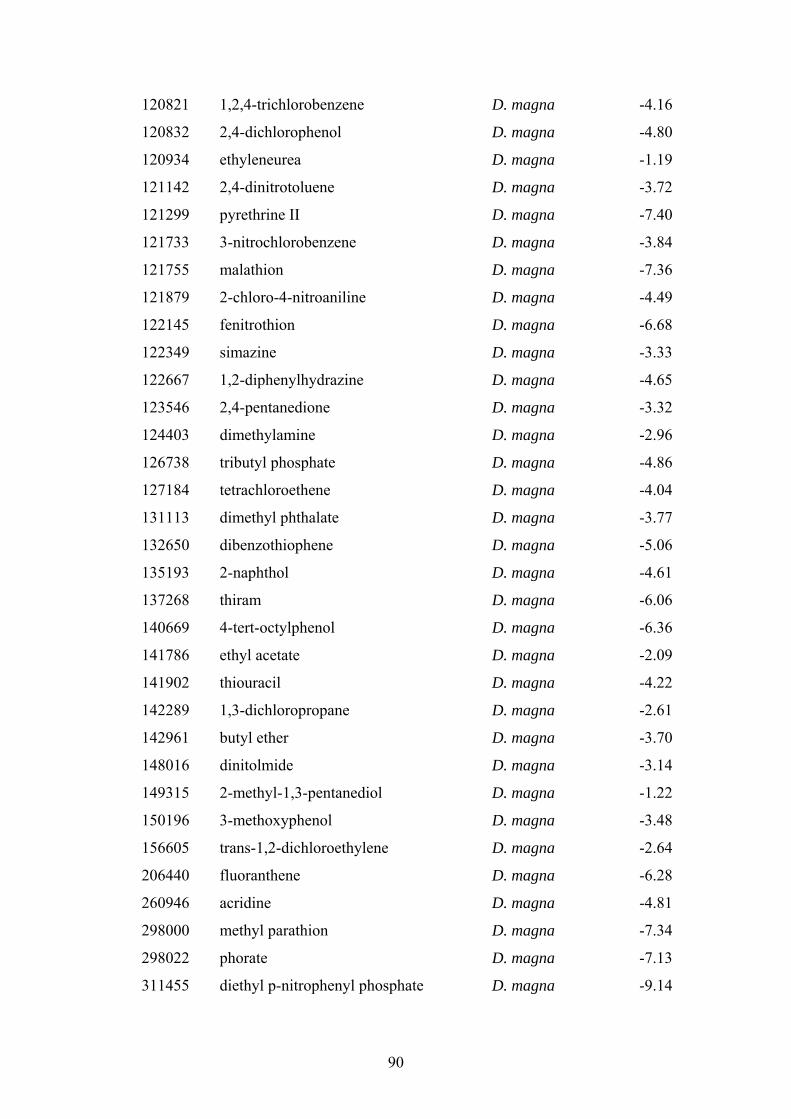
90
120821 1,2,4-trichlorobenzene D. magna -4.16
120832 2,4-dichlorophenol D. magna -4.80
120934 ethyleneurea D. magna -1.19
121142 2,4-dinitrotoluene D. magna -3.72
121299 pyrethrine II D. magna -7.40
121733 3-nitrochlorobenzene D. magna -3.84
121755 malathion D. magna -7.36
121879 2-chloro-4-nitroaniline D. magna -4.49
122145 fenitrothion D. magna -6.68
122349 simazine D. magna -3.33
122667 1,2-diphenylhydrazine D. magna -4.65
123546 2,4-pentanedione D. magna -3.32
124403 dimethylamine D. magna -2.96
126738 tributyl phosphate D. magna -4.86
127184 tetrachloroethene D. magna -4.04
131113 dimethyl phthalate D. magna -3.77
132650 dibenzothiophene D. magna -5.06
135193 2-naphthol D. magna -4.61
137268 thiram D. magna -6.06
140669 4-tert-octylphenol D. magna -6.36
141786 ethyl acetate D. magna -2.09
141902 thiouracil D. magna -4.22
142289 1,3-dichloropropane D. magna -2.61
142961 butyl ether D. magna -3.70
148016 dinitolmide D. magna -3.14
149315 2-methyl-1,3-pentanediol D. magna -1.22
150196 3-methoxyphenol D. magna -3.48
156605 trans-1,2-dichloroethylene D. magna -2.64
206440 fluoranthene D. magna -6.28
260946 acridine D. magna -4.81
298000 methyl parathion D. magna -7.34
298022 phorate D. magna -7.13
311455 diethyl p-nitrophenyl phosphate D. magna -9.14

91
333415 diazinon D. magna -8.45
470906 chlorfenvinfos D. magna -6.56
503877 2-thioxo-4-imidazolinone D. magna -3.77
532558 benzoyl isothiocyanate D. magna -4.93
534134 N,N’-dimethylthiourea D. magna -3.85
534521 dinitro-o-cresol D. magna -4.79
536903 3-methoxybenzeneamine D. magna -5.64
541731 1,3-dichlorobenzene D. magna -4.18
542756 1,3-dichloropropene D. magna -4.25
542858 isothiocyanatoethane D. magna -5.31
554007 2,4-dichloroaniline D. magna -5.43
556616 isothiocyanatomethane D. magna -5.42
576261 2,6-dimethylphenol D. magna -4.04
578541 2-ethylbenzenamine D. magna -4.18
589162 4-ethylaniline D. magna -6.13
592825 1-isothiocyanatobutane D. magna -5.43
598163 tribromoethene D. magna -4.33
598527 methylthiourea D. magna -3.98
602017 2,3-dinitrotoluene D. magna -5.44
609198 3,4,5-trichlorophenol D. magna -5.46
611063 2,4-dichloro-1-nitrobenzene D. magna -4.66
618622 1,3-dichloro-5-nitrobenzene D. magna -4.46
622786 benzylisothiocyanate D. magna -6.54
625536 ethylthiourea D. magna -4.00
626437 3,5-dichloroaniline D. magna -5.16
630206 1,1,1,2-tetrachloroethane D. magna -3.84
632224 1,1,3,3-tetramethylurea D. magna -1.60
634673 2,3,4-trichloroaniline D. magna -5.43
634833 2,3,4,5-tetrachloroaniline D. magna -5.56
636306 2,4,5-trichloroaniline D. magna -4.76
680319 hexamethyl phosphoramide D. magna -1.43
693210 diethylene glycol dinitrate D. magna -3.34
732116 phosmet D. magna -5.60

92
759944
dipropylcarbamothioic acid, S-ethyl
ester
D. magna
-4.61
786196 carbophenothion D. magna -6.44
825445 benzo[b]thiophene S,S-dioxide D. magna -4.07
877430 2,6-dimethylquinoline D. magna -3.62
935955 2,3,5,6-tetrachlorophenol D. magna -5.61
944229 fonofos D. magna -7.43
1014706 simetryn D. magna -3.63
1016053 dibenzothiophene-5,5-dioxide D. magna -4.57
1024573 heptachlor epoxide D. magna -6.21
1516321 butylthiourea D. magna -3.85
1563662 carbofuran D. magna -6.52
1570645 4-chloro-o-cresol D. magna -5.69
1570656 2,4-dichloro-6-methylphenol D. magna -5.65
1582098 trifluralin D. magna -6.24
1825214 pentachloroanisole D. magna -7.01
1836777 chlornitrofen D. magna -5.88
1897456 chlorothalonil D. magna -6.21
1912249 atrazine D. magna -3.60
1918021 picloram D. magna -3.61
1982474 chloroxuron D. magna -4.99
2008584 2,6-dichlorobenzamide D. magna -2.35
2051607 2-chlorobiphenyl D. magna -5.42
2051618 3-chlorobiphenyl D. magna -5.64
2051629 4-chloro-1,1’-biphenyl D. magna -5.60
2257092 (2-isothiocyanatoethyl)benzene D. magna -6.10
2437798 2,4,2’,4’-tetrachlorobiphenyl D. magna -6.99
2489772 trimethylthiourea D. magna -2.19
2539175 2-methoxytetrachlorophenol D. magna -6.08
2556425 tetrapropylthioperoxydicarbonicdiamide D. magna -6.19
2668248 2-methoxy-4,5,6-trichlorophenol D. magna -5.37
2741062 1-phenyl-3-ethyl thiourea D. magna -3.35
2764729 diquat D. magna -5.01

93
2782914 tetramethyl thiourea D. magna -2.23
2921882 clorpyrifos D. magna -8.64
3209221 1,2-dichloro-3-nitrobenzene D. magna -4.62
3483123 dithiothreitol D. magna -3.76
3547044 DDE D. magna -6.86
3689245 TEDP D. magna -9.15
3766812
2-(1-methylpropyl)phenol,
methylcarbamate
D. magna
-6.32
4044659 1,4-diisothiocyanatobenzene D. magna -6.40
4104750 N-methyl-N-phenylthiourea D. magna -3.36
6317186 thiocyanic acid, methylene ester D. magna -6.25
6972050 N,N-dimethylthiourea D. magna -3.39
7012375 2,4,4’-PCB D. magna -6.21
8018017 mancozeb D. magna -5.21
10605217 carbendazim D. magna -5.54
12002481 trichlorobenzene D. magna -4.40
15245440 2,4,6-trinitro-1,3-benzenediol D. magna -2.19
15263533 dithiocarbamate D. magna -7.38
18259057 2,3,4,5,6-PCB D. magna -7.61
23564058 thiophanate-methyl D. magna -4.33
25154523 nonylphenol D. magna -6.41
25167833 2,3,4,5-tetrachlorophenol D. magna -5.76
25875518 robenidine D. magna -6.65
28249776 thiobencarb D. magna -4.67
29232937 pirimiphos-methyl D. magna -9.14
32598133 3,3’,4,4’-tetrachloro-1,1’-biphenyl D. magna -8.16
33813206
5,6-dihydro-3H-imidazo[2,1-c]-1,2,4-
dithiazole-3-thione
D. magna
-5.92
33820530 isopropalin D. magna -7.01
35065271 2,2’,4,4’,5,5’-hexachloro-1,1’-biphenyl D. magna -8.44
35367385 diflubenzuron D. magna -7.77
35693993 2,2’,5,5’-tetrachloro-1,1’-biphenyl D. magna -6.99
37680652 2,2’,5-trichloro-1,1’-biphenyl D. magna -6.67

94
37680732 2,4,5,2’,5’-PCB D. magna -7.51
38380073 2,2’,3,3’,4,4’-PCB D. magna -8.78
51630581 fenvalerate D. magna -8.13
52315078 cypermethrin D. magna -9.06
52645531 permethrin D. magna -8.23
52918635 deltamethrin D. magna -10.09
55406536 iodopropynyl butylcarbamate D. magna -6.85
57057837 3,4,5-trichloroguaiacol D. magna -5.56
59756604 fluridone D. magna -4.86
66230044 esfenvalerate D. magna -9.19
68359375 cyfluthrin D. magna -9.42
76738620 paclobutrazol D. magna -4.01
91465086 cyhalothrin D. magna -8.72
50293 DDT D. pulex -8.58
51036 piperonyl butoxide C. dubia -5.71
55389 fenthion D. pulex -8.35
56382 parathion D. pulex -8.58
57556 propylene glycol C. dubia -0.90
58899 lindane D. pulex -5.14
62533 aniline D. pulex -5.97
62737 dichlorvos C. dubia -9.20
63252 carbaryl D. pulex -7.53
72208 endrin D. pulex -7.28
72435 methoxychlor C. dubia -7.39
75070 acetaldehyde C. dubia -0.88
76448 heptachlor D. pulex -6.95
85018 phenanthrene D. pulex -5.20
87865 pentachlorophenol D. pulex -5.37
88062 dowicide 2S C. dubia -4.69
90028 salicylaldehyde D. pulex -4.36
93721 silvex D. pulex -5.05
94757 2,4-D D. pulex -4.84

95
95487 o-cresol D. pulex -4.05
105373 ethyl propionate D. pulex -3.17
105679 2,4-dimethylphenol C. dubia -4.43
106445 p-cresol D. pulicaria -3.68
106489 4-chlorophenol C. dubia -4.15
107073 2-chloroethanol D. pulex -2.15
107119 allylamine D. pulex -3.23
108394 m-cresol D. pulicaria -3.04
108463 resorcinol D. pulicaria -3.04
108952 phenol D. pulex -3.13
110861 pyridine D. pulex -2.14
111422 2,2¢-iminobisethanol D. pulex -4.64
115297 endosulfan D. carinata -5.93
116063 aldicarb D. laevis -6.13
121755 malathion D. pulex -8.22
122145 fenitrothion M. macrocopa -6.85
122349 simazine D. pulex -3.00
123546 2,4-pentanedione D. pulex -3.30
141786 ethyl acetate D. pulex -2.53
145733 endothall C. dubia -3.59
206440 fluoranthene C. dubia -6.65
298000 methyl parathion C. dubia -7.94
330541 diuron D. pulex -5.22
333415 diazinon D. pulex -8.59
470906 chlorfenvinfos C. dubia -8.95
609198 3,4,5-trichlorophenol C. dubia -5.70
709988 propanil C. dubia -4.75
959988 alpha-endosulfan D. carinata -6.21
1014706 simetryn M. macrocopa -3.82
1031078 endosulfan sulfate D. carinata -5.75
1194656 dichlobenil D. pulex -4.67
1563388 carbofuran phenol C. dubia -6.01
1563662 carbofuran D. pulex -6.74

96
1582098 trifluralin D. pulex -6.14
1646873
2-methyl-2-(methylsulfinyl)-propion-
aldehyde,O-(methylcarbamoyl)oxime
D. laevis
-6.34
1646884 aldoxycarb D. laevis -5.34
1836755 nitrofen C. dubia -6.12
1912249 atrazine D. pulex -3.72
2212671 molinate C. dubia -4.83
2668248 2-methoxy-4,5,6-trichlorophenol C. dubia -5.10
2921882 clorpyrifos D. pulex -8.48
3766812
2-(1-methylpropyl)phenol,
methylcarbamate
M. macrocopa
-6.32
7786347 mevinphos C. dubia -8.37
8001352 toxaphene D. pulex -7.44
8003347 pyrethrum D. pulex -7.12
15972608 lasso D. pulex -4.44
19666309 oxadiazon M. macrocopa -5.80
21087649 metribuzin C. dubia -3.78
25167833 tetrachlorophenol D. pulex -5.36
28249776 thiobencarb C. dubia -5.70
33213659 beta-endosulfan D. carinata -6.30
51218452 metolachlor C. dubia -4.25
52645531 permethrin D. pulex -7.70
91465086 cyhalothrin C. dubia -9.18
95737681 pyriproxyfen D. carinata -6.60

97
European Commission EUR 22943 EN – Joint Research Centre – Institute for Health and Consumer Protection Title: Review of Data Sources, QSARs and Integrated Testing Strategies for Aquatic Toxicity Author(s): Netzeva T, Pavan M and Worth A Luxembourg: Office for Official Publications of the European Communities 2007 – 118 pp. – x cm EUR – Scientific and Technical Research series – ISSN 1018-5593 ISBN X-XXXX-XXXX-X Abstract This review collects information on sources of aquatic toxicity data and computational tools for estimation of chemical toxicity to aquatic organisms, such as expert systems and quantitative structure-activity relationship (QSAR) models. The review also captures current thinking of what constitutes an integrated testing strategy (ITS) for this endpoint. The emphasis of the review is on the usefulness of the models and for the regulatory assessment of chemicals, particularly for the purposes of the new European legislation for the Registration, Evaluation, Authorisation and Restriction of Chemicals (REACH), which entered into force on 1 June 2007. Effects on organisms from three trophic levels (fish, Daphnia and algae) were subject of this review. In addition to traditional data sources such as databases, papers publishing experimental data are also identified. Models for narcoses, general (global) models as well as models for specific chemical classes and mechanisms of action are summarised. Where possible, models were included in a form allowing reproduction without consultation with the original paper. This review builds on work carried out in the framework of the REACH Implementation Projects, and is compiled here as a contribution to the EU funded Integrated Project, OSIRIS.

98
The mission of the JRC is to provide customer-driven scientific and technical support for the conception, development, implementation and monitoring of EU policies. As a service of the European Commission, the JRC functions as a reference centre of science and technology for the Union. Close to the policy-making process, it serves the common interest of the Member States, while being independent of special interests, whether private or national.
AA
- BB
- XXXXX- LL- C