Review - New York Universitypeople.stern.nyu.edu/igiddy/review1.pdf · 2002-04-30 · Giddy/NYU...
44
Giddy/NYU Portfolio Management/1 Review Prof. Ian Giddy New York University New York University Stern School of Business Copyright ©2002 Ian H. Giddy Review 2 Topics l The Financial Markets l Time Value of Money and Yields l Money and Bond Markets l Risk and Return l Risk and Diversification l Valuation and Asset Pricing (CAPM) l Equity Valuation l International Financial Markets l Cash, Futures, FRAs and Swaps l Options & Applications l Portfolio Management and Performance Evaluation
Transcript of Review - New York Universitypeople.stern.nyu.edu/igiddy/review1.pdf · 2002-04-30 · Giddy/NYU...

Giddy/NYU Portfolio Management/1
Review
Prof. Ian GiddyNew York University
New York UniversityStern School of Business
Copyright ©2002 Ian H. Giddy Review 2
Topics
l The Financial Marketsl Time Value of Money and
Yieldsl Money and Bond
Marketsl Risk and Returnl Risk and Diversificationl Valuation and Asset
Pricing (CAPM)
l Equity Valuationl International Financial
Marketsl Cash, Futures, FRAs
and Swapsl Options & Applicationsl Portfolio Management
and Performance Evaluation
Giddy/NYU Portfolio Management/2
Copyright ©2002 Ian H. Giddy Review 3
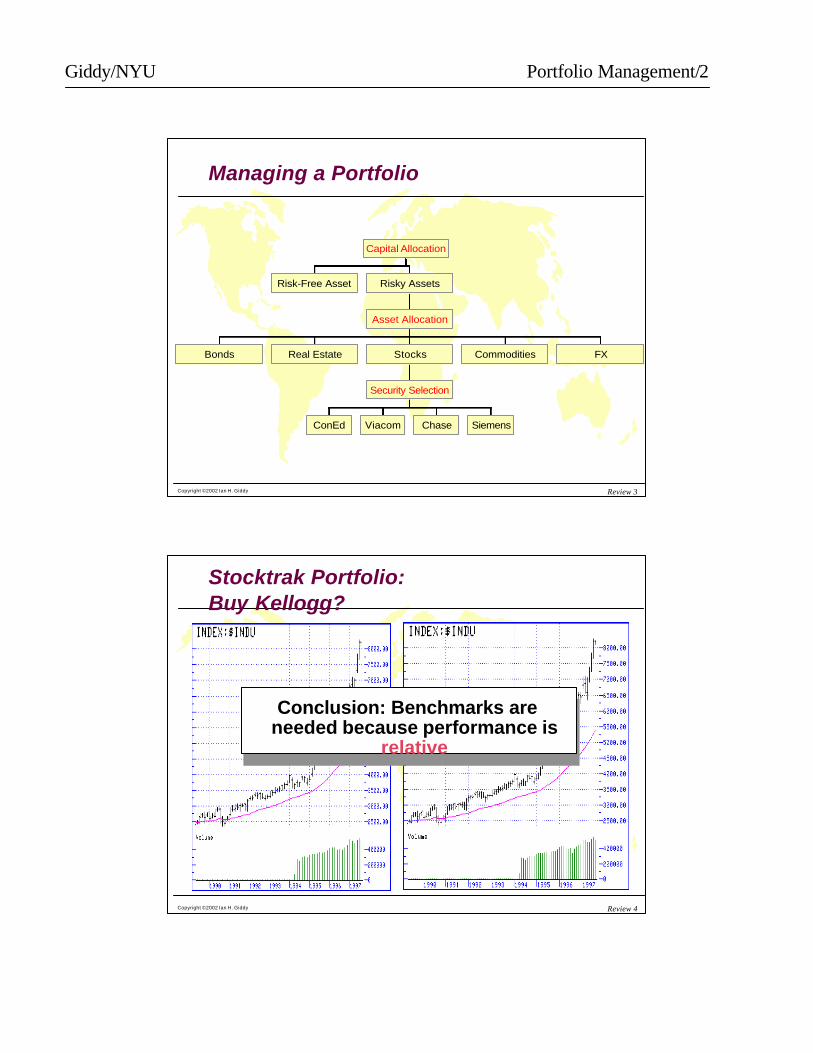
Risk-Free Asset
Bonds Real Estate
ConEd Viacom Chase Siemens
Security Selection
Stocks Commodities FX
Asset Allocation
Risky Assets
Capital Allocation
Managing a Portfolio
Copyright ©2002 Ian H. Giddy Review 4
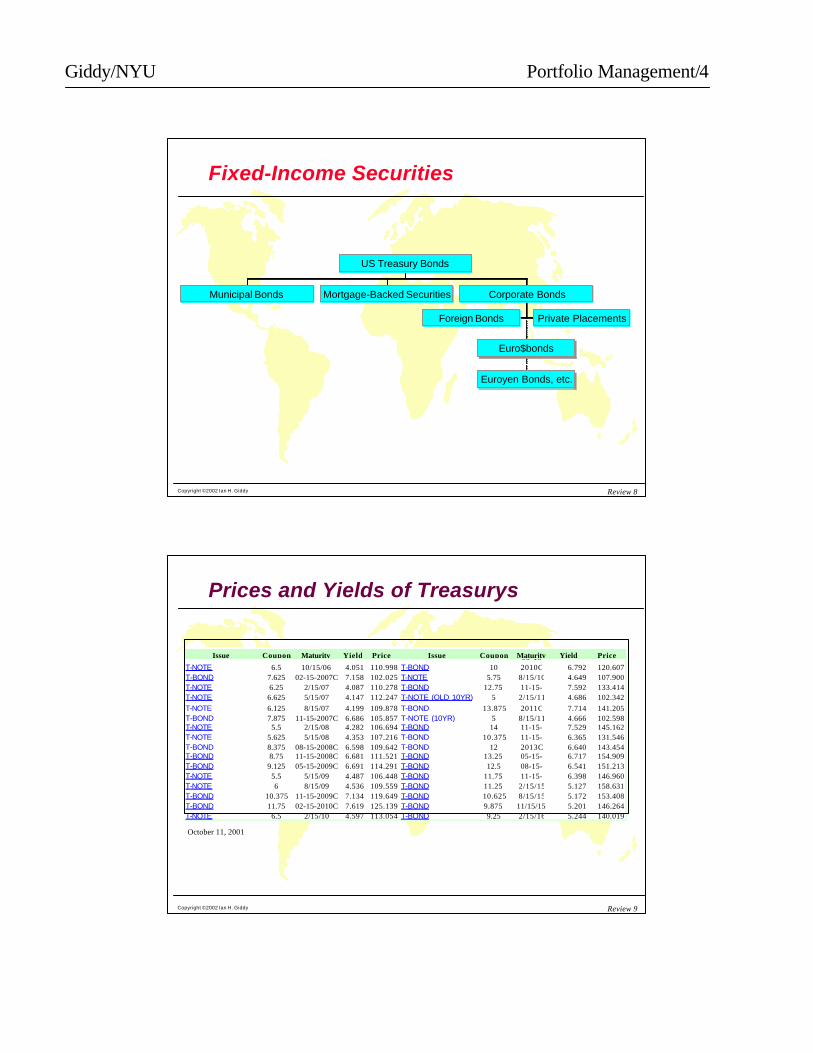
Stocktrak Portfolio:Buy Kellogg?
Conclusion: Benchmarks are needed because performance is
relative
Conclusion: Benchmarks are needed because performance is
relative

Giddy/NYU Portfolio Management/3
Copyright ©2002 Ian H. Giddy Review 6
The Players, such as Institutional Investors and Money Managers
Institutional Investors Money Managers
Mutual Funds
Insurance Companies
Pension Funds
Hedge funds, Central banks, etc.
Stocksand
bonds
Money managersMoney managers
Copyright ©2002 Ian H. Giddy Review 7
The Instruments
What Investments?What Investments?
Treasury Bills?(risk-free)
Treasury Bills?(risk-free)
Stocks and Bonds?(risky)
Stocks and Bonds?(risky)
Giddy/NYU Portfolio Management/4
Copyright ©2002 Ian H. Giddy Review 8
Municipal Bonds Mortgage-Backed Securities
Foreign Bonds Private Placements
Euroyen Bonds, etc.
Euro$bonds
Corporate Bonds
US Treasury Bonds
Fixed-Income Securities
Copyright ©2002 Ian H. Giddy Review 9
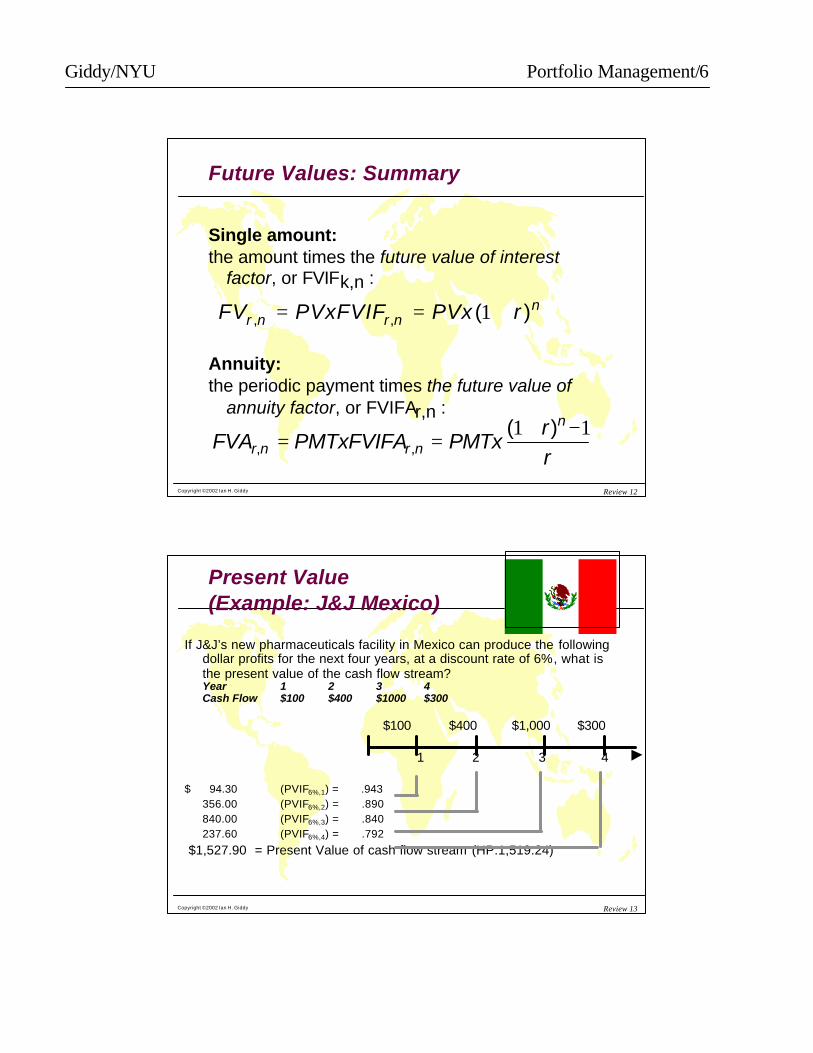
Prices and Yields of Treasurys
Issue Coupon Maturity Yield Price Issue Coupon Maturity Yield Price
T-NOTE 6.5 10/15/06 4.051 110.998 T-BOND 1005-15-2010C 6.792 120.607
T-BOND 7.625 02-15-2007C 7.158 102.025 T-NOTE 5.75 8/15/10 4.649 107.900T-NOTE 6.25 2/15/07 4.087 110.278 T-BOND 12.75 11-15- 7.592 133.414T-NOTE 6.625 5/15/07 4.147 112.247 T-NOTE (OLD 10YR) 5 2/15/11 4.686 102.342T-NOTE 6.125 8/15/07 4.199 109.878 T-BOND 13.875 2011C 7.714 141.205T-BOND 7.875 11-15-2007C 6.686 105.857 T-NOTE (10YR) 5 8/15/11 4.666 102.598T-NOTE 5.5 2/15/08 4.282 106.694 T-BOND 14 11-15- 7.529 145.162T-NOTE 5.625 5/15/08 4.353 107.216 T-BOND 10.375 11-15- 6.365 131.546T-BOND 8.375 08-15-2008C 6.598 109.642 T-BOND 12 2013C 6.640 143.454T-BOND 8.75 11-15-2008C 6.681 111.521 T-BOND 13.25 05-15- 6.717 154.909T-BOND 9.125 05-15-2009C 6.691 114.291 T-BOND 12.5 08-15- 6.541 151.213T-NOTE 5.5 5/15/09 4.487 106.448 T-BOND 11.75 11-15- 6.398 146.960T-NOTE 6 8/15/09 4.536 109.559 T-BOND 11.25 2/15/15 5.127 158.631T-BOND 10.375 11-15-2009C 7.134 119.649 T-BOND 10.625 8/15/15 5.172 153.408T-BOND 11.75 02-15-2010C 7.619 125.139 T-BOND 9.875 11/15/15 5.201 146.264T-NOTE 6.5 2/15/10 4.597 113.054 T-BOND 9.25 2/15/16 5.244 140.019
October 11, 2001

Giddy/NYU Portfolio Management/5
Copyright ©2002 Ian H. Giddy Review 10
The Yield Curve
bondsonline.comwww.federalreserve.gov/rnd.htmbondsonline.comwww.federalreserve.gov/rnd.htm
Copyright ©2002 Ian H. Giddy Review 11
Time Value
20%
15%
5%0%
Future Valueof One Dollar ($)
Periods
1.00
Giddy/NYU Portfolio Management/6
Copyright ©2002 Ian H. Giddy Review 12
Future Values: Summary
Single amount:the amount times the future value of interest
factor, or FVIFk,n :
Annuity:the periodic payment times the future value of
annuity factor, or FVIFAr,n :
FVA PMTxFVIFA PMTxrrr n r n
n
, ,( )
= =+ −1 1
FV PVxFVIF PVx rr n r nn
, , ( )= = +1
Copyright ©2002 Ian H. Giddy Review 13
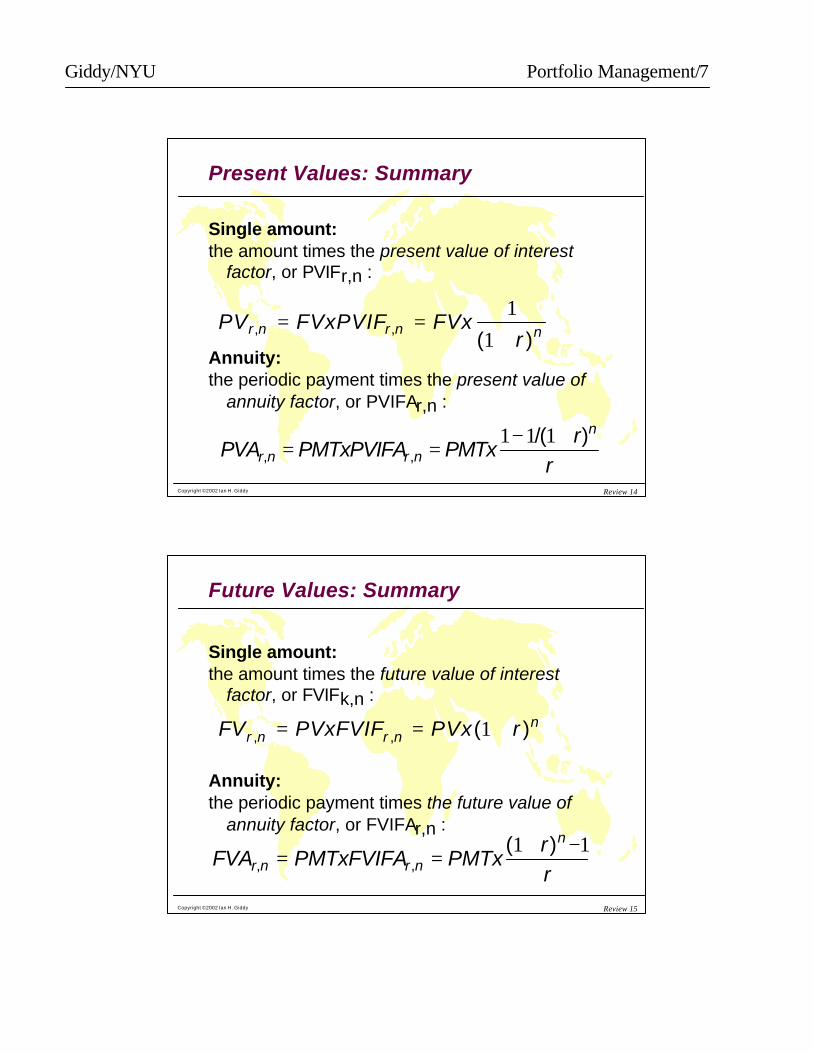
If J&J’s new pharmaceuticals facility in Mexico can produce the following dollar profits for the next four years, at a discount rate of 6%, what is the present value of the cash flow stream?Year 1 2 3 4Cash Flow $100 $400 $1000 $300
$100 $400 $1,000 $300
1 2 3 4
$ 94.30 (PVIF6%,1) = .943 356.00 (PVIF6%,2) = .890840.00 (PVIF6%,3) = .840237.60 (PVIF6%,4) = .792
$1,527.90 = Present Value of cash flow stream (HP:1,519.24)
Present Value(Example: J&J Mexico)
Giddy/NYU Portfolio Management/7
Copyright ©2002 Ian H. Giddy Review 14
Present Values: Summary
Single amount:the amount times the present value of interest
factor, or PVIFr,n :
Annuity:the periodic payment times the present value of
annuity factor, or PVIFAr,n :
PVA PMTxPVIFA PMTxr
rr n r n
n
, ,/( )
= =− +1 1 1
PV FVxPVIF FVxr
r n r n n, ,( )
= =+1
1
Copyright ©2002 Ian H. Giddy Review 15
Future Values: Summary
Single amount:the amount times the future value of interest
factor, or FVIFk,n :
Annuity:the periodic payment times the future value of
annuity factor, or FVIFAr,n :
FVA PMTxFVIFA PMTxrrr n r n
n
, ,( )
= =+ −1 1
FV PVxFVIF PVx rr n r nn
, , ( )= = +1

Giddy/NYU Portfolio Management/8
Copyright ©2002 Ian H. Giddy Review 16
Present Values: Summary
Single amount:the amount times the present value of interest
factor, or PVIFr,n :
Annuity:the periodic payment times the present value of
annuity factor, or PVIFAr,n :
PVA PMTxPVIFA PMTxr
rr n r n
n
, ,/( )
= =− +1 1 1
PV FVxPVIF FVxr
r n r n n, ,( )
= =+1
1
Copyright ©2002 Ian H. Giddy Review 17
Present Value Of A Perpetuity
A perpetuity is an annuity that goes on forever...
and (1/r) is the present value interest factor
for a perpetuity,
PVPMT
r∞ =
PVIFArr,∞ =1

Giddy/NYU Portfolio Management/9
Copyright ©2002 Ian H. Giddy Review 18
A Growing Annuity
A growing annuity is one that pays a regular amount that grows at a constant rate each year. A common application is dividends
Example: Gold mine’s value
−
++−+=
grrg
gPMTPVGAnn )1/()1(1
)1(
Copyright ©2002 Ian H. Giddy Review 19
A Growing Perpetuity
A growing perpetuity is one that pays a regular amount that grows at a constant rate each year. A common application is dividends
Example: Mature company value
grgPMT
PVGP−
+=
)1(

Giddy/NYU Portfolio Management/10
Copyright ©2002 Ian H. Giddy Review 20
J&J leases $12,000 of computer equipment from Hewlett-Packard. How much would its annual end-of-year payments have to be at a 15% interest rate if the cost must be fully repaid in 3 years?
PVA3 = $12,000; r = 15%; n = 3PVA3 = PMT x PVIFA15%,3
PMT = PVA3/PVIFA15%,3 = $12,000/2.283= $5,256.24
Loan Amortization Schedule - A schedule of equal payments to repay a loan. It shows the allocation of each loan payment to interest and principal.
Loan Amortization Example
Copyright ©2002 Ian H. Giddy Review 21
Basic Bond Valuation
WHERE:Bo = value of the bond at time zeroI = annual bond interest in dollars (interest payment)M = par value of the bondrt = required rate of returnn = number of years to maturity
B Ix PVIFA Mx PVIF
BIr
Mr
r n n
t nt
n
0
01 1 1
= +
=+
++=
∑
( ) ( )
( ) ( )
,

Giddy/NYU Portfolio Management/11
Copyright ©2002 Ian H. Giddy Review 22
The Zero Approach
l Use zero-coupon rates to value each cash flow - then add them!
l Where can we get the z’s? One place is from the Treasury strip market.
BCz
Cz
Mzn
n01
12
21 1 1=
++
++ +
+( ) ( )...
( )
Copyright ©2002 Ian H. Giddy Review 23
Bond Lego
u To value this bond, break it up into its component cash flows - e.g. 1st coupon of (5 3/4)/2 in Feb 1996, and so on...
u Then use zero’s to see what each is worth, and add the total.
In general, breaking up a security into its component parts is an excellent path to valuation.
Rate6
Maturity, Mo/YrDec 97
Bid Asked99:29 99:31
Ask Yld.6.01
A Treasury Noteas quoted in the Wall Street Journal Monday, July 24, 1995

Giddy/NYU Portfolio Management/12
Copyright ©2002 Ian H. Giddy Review 24
Forward Interest Rates
4
55.5 5.7
66.25
0
1
2
3
4
5
6
7
3 mo 6 mo 9 mo 1 yr 15 mo 18 mo
EURODOLLAR INTEREST RATES
The rate that can be locked in is the implied forward rate that equateslong term rates with short term rates
Copyright ©2002 Ian H. Giddy Review 25
I can buy a 2-year note or buy a 1-year note and reinvest it at some "forward" rate f:
(1+y2)2=(1+y1)(1+f)
Find f!
Calculating Implied Forward Rates

Giddy/NYU Portfolio Management/13
Copyright ©2002 Ian H. Giddy Review 26
Theories of Term Structure
l Expectationsl Liquidity PreferenceuUpward bias over expectations
l Market Segmentation uPreferred Habitat
Copyright ©2002 Ian H. Giddy Review 27
Identifying Undervalued Securities
BondsBonds
SpotRates
SpotRates
“Correct”pricing
“Correct”pricing
Comparewith actual
Comparewith actual
Giddy/NYU Portfolio Management/14
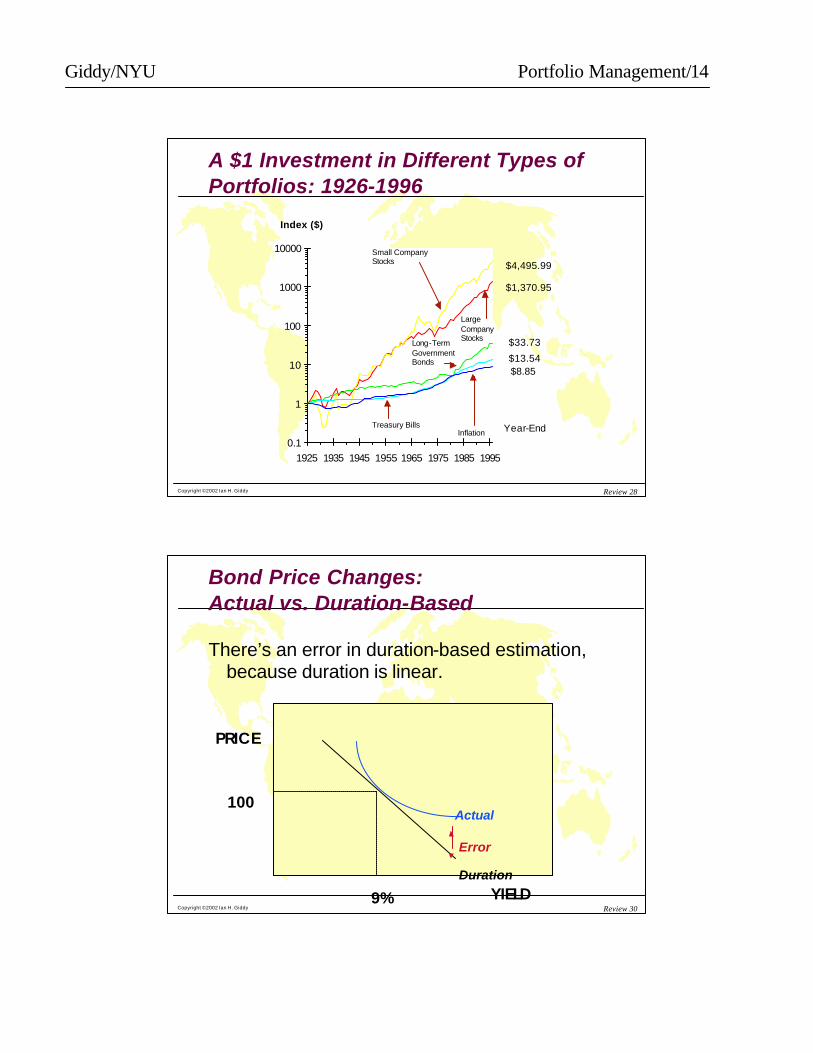
Copyright ©2002 Ian H. Giddy Review 28
A $1 Investment in Different Types of Portfolios: 1926-1996
0.1
1
10
100
1000
10000
1925 1935 1945 1955 1965 1975 1985 1995
Index ($)
$4,495.99
$33.73
$13.54$8.85
$1,370.95
Small Company Stocks
Large Company Stocks
Long-Term Government Bonds
Treasury BillsInflation Year-End
Copyright ©2002 Ian H. Giddy Review 30
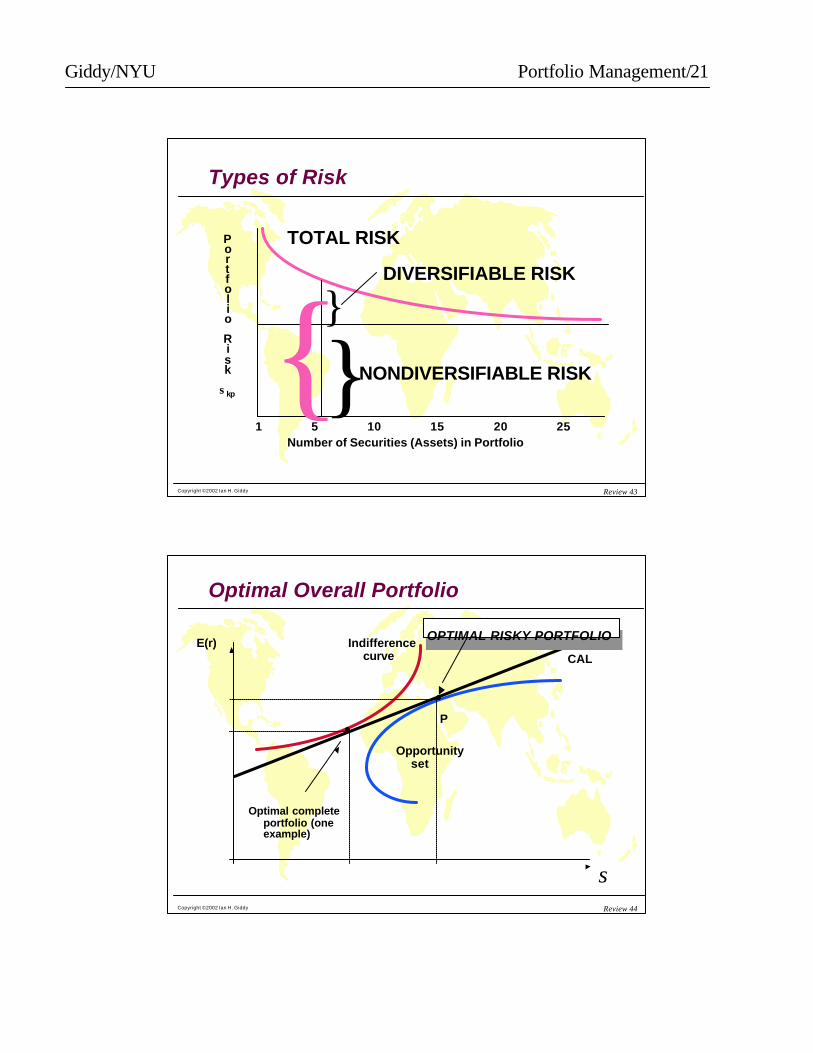
Bond Price Changes:Actual vs. Duration-Based
There’s an error in duration-based estimation, because duration is linear.
PRICE
YIELD9%
100Actual
Duration
Error

Giddy/NYU Portfolio Management/15
Copyright ©2002 Ian H. Giddy Review 31
Calculating Duration:MacCauley and Modified
)/1(%
)1(1
mrD
PdP
PD
Pr
tCF
D
MOD
n
t
tt
MAC
+−==∆=
+= ∑=
Copyright ©2002 Ian H. Giddy Review 32
Assets (each $10m):u1-year E$ depositu5-year, 6% T-note
Duration=4.3u9-year Strip
Fixed liabilities:u$10m 3 yearsu$15m 5 yearsu$5m 7 years
uAsset Duration = .33(1)+.33(4.3)+.33(9)uLiab Duration = .33(3)+.50(5)+.17(7)uNet duration is 4.77-4.67 = 0.10
Portfolio Duration

Giddy/NYU Portfolio Management/16
Copyright ©2002 Ian H. Giddy Review 33
Returns, Standard Deviations, and Frequency Distributions: 1926-1996
Source: © Stocks, Bonds, Bills, and Inflation 1997 Yearbook™, Ibbotson Associates, Inc., Chicago (annually updates work by Roger G.Ibbotson and Rex A. Sinquefield). All rights reserved.
– 90% + 90%0%
Average StandardSeries Annual Return Deviation Distribution
Large Company Stocks 12.7% 20.3%
Small Company Stocks 17.7 34.1
Long-Term Corporate Bonds 6.0 8.7
Long-Term Government Bonds 5.4 9.2
U.S. Treasury Bills 3.8 3.3
Inflation 3.2 4.5
Copyright ©2002 Ian H. Giddy Review 34
The Normal Distribution
Probability
Return onlarge companystocks
68%
95%
> 99%
– 3 – 48.2%
– 2 – 27.9%
– 1 – 7.6%
012.7%
+ 1 33.0%
+ 2 53.3%
+ 3 73.6%

Giddy/NYU Portfolio Management/17
Copyright ©2002 Ian H. Giddy Review 35
Credit Risk versus Market Risk
Copyright ©2002 Ian H. Giddy Review 36
Portfolio Optimization
σ
“Efficient frontier”
Individual assets
Global minimum-variance portfolio
E(r)

Giddy/NYU Portfolio Management/18
Copyright ©2002 Ian H. Giddy Review 37
Measuring Portfolio Return and Risk
The portfolio return E(Rp) is:
E(Rp) = (w1k1)+(w2k2)+ ... (wnkn) = Σ w j kj
where wj = weight of asset j, k j = return on asset j
The variance of a 2-asset portfolio is:
where wA and wB are the weights of A and B in the portfolio.
P2
A2
A2
B2
B2
A B AB A B = w + w + 2w wσ σ σ ρ σ σ
Copyright ©2002 Ian H. Giddy Review 38
Case Study: A Portfolio
Weight E(R) Std DevGPU 0 0.1267 0.1715Teledyne 0.25 0.1396 0.2893Kodak 0.25 0.1402 0.3082Thai Fund 0 0.2075 0.3278Merck 0 0.1781 0.341ATT 0.5 0.1126 0.1606TOTAL 1

Giddy/NYU Portfolio Management/19
Copyright ©2002 Ian H. Giddy Review 39
Portfolio Risk Computation
CORRELATION MATRIXSTD DEV GPU TeledyneKodakThai FundMerck ATT
GPU 0.1715 1Teledyne 0.2893 0.44 1Kodak 0.3082 0.17 0.65 1Thai Fund 0.3278 0.22 0.44 0.24 1Merck 0.341 0.35 0.15 0.13 0.03 1ATT 0.1606 0.68 0.4 0.43 0.23 0.6327 1
Portfolio Variance 3.48%Portfolio Std Deviation 18.66%
Copyright ©2002 Ian H. Giddy Review 40
Plotting the Efficient Frontier
0
0.05
0.1
0.15
0.2
0.25
0 0.05 0.1 0.15 0.2 0.25 0.3 0.35
ORIGINAL
ATT
THAI FUND

Giddy/NYU Portfolio Management/20
Copyright ©2002 Ian H. Giddy Review 41
Finding the Optimal Portfolio:Computations
Given the Risk-Free rate is: 5.00%
OPTIMAL PORTFOLIOSRisk Ratio
Return Std. Dev. Premium RP/SDGPU 11.26% 0.1606 6.26% 0.390
11.50% 0.1548 6.50% 0.42012.00% 0.1494 7.00% 0.46912.50% 0.1475 7.50% 0.508
MIN RISK 12.83% 0.1471 7.83% 0.53213.00% 0.1472 8.00% 0.54314.00% 0.1509 9.00% 0.59615.00% 0.1572 10.00% 0.63616.00% 0.168 11.00% 0.65517.00% 0.184 12.00% 0.65218.00% 0.2045 13.00% 0.63619.00% 0.2282 14.00% 0.613
THAI 20.75% 0.3278 15.75% 0.4800
0.05
0.1
0.15
0.2
0.25
0 0.05 0.1 0.15 0.2 0.25 0.3 0.35
That's the one!
Copyright ©2002 Ian H. Giddy Review 42
Equity Risk and Return
l Investors diversify, because you get a better return for a given risk.
l There is a fully-diversified “market portfolio” that we should all choose
l The risk of an individual asset can be measured by how much risk it adds to the “market portfolio.”
Giddy/NYU Portfolio Management/21
Copyright ©2002 Ian H. Giddy Review 43
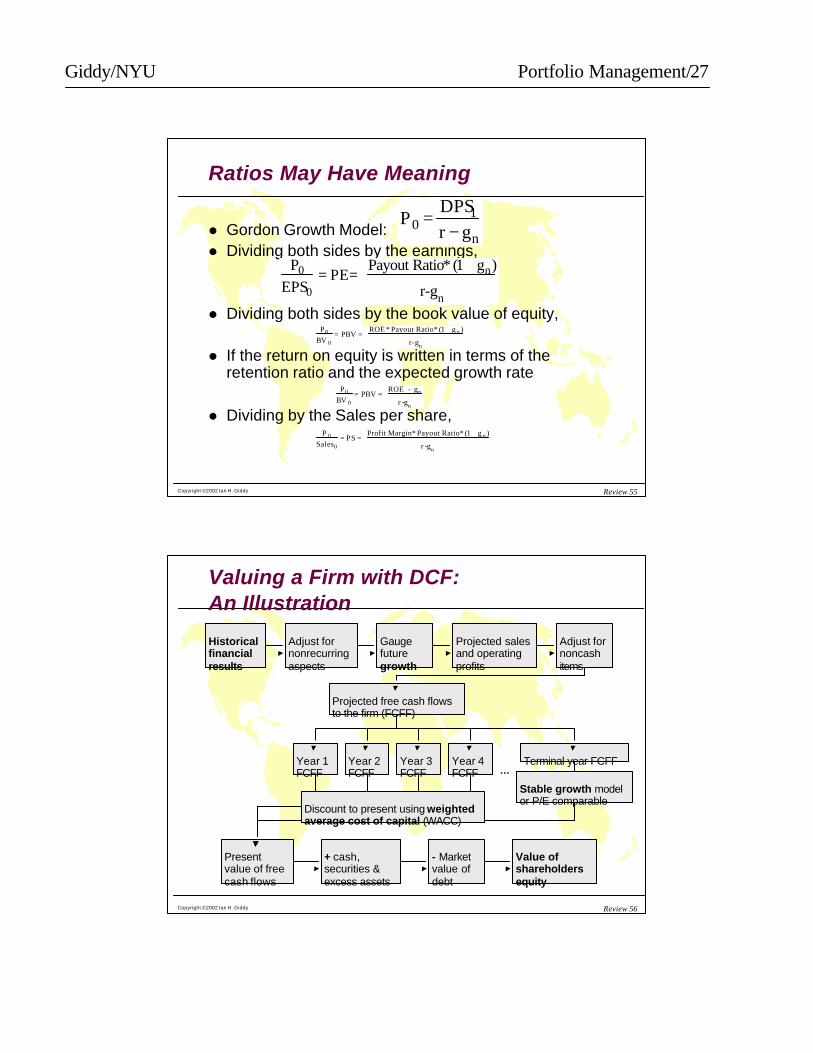
Types of Risk
Portfolio
Risk
σkp
Number of Securities (Assets) in Portfolio1 5 10 15 20 25
}}{
TOTAL RISK
NONDIVERSIFIABLE RISK
DIVERSIFIABLE RISK
Copyright ©2002 Ian H. Giddy Review 44
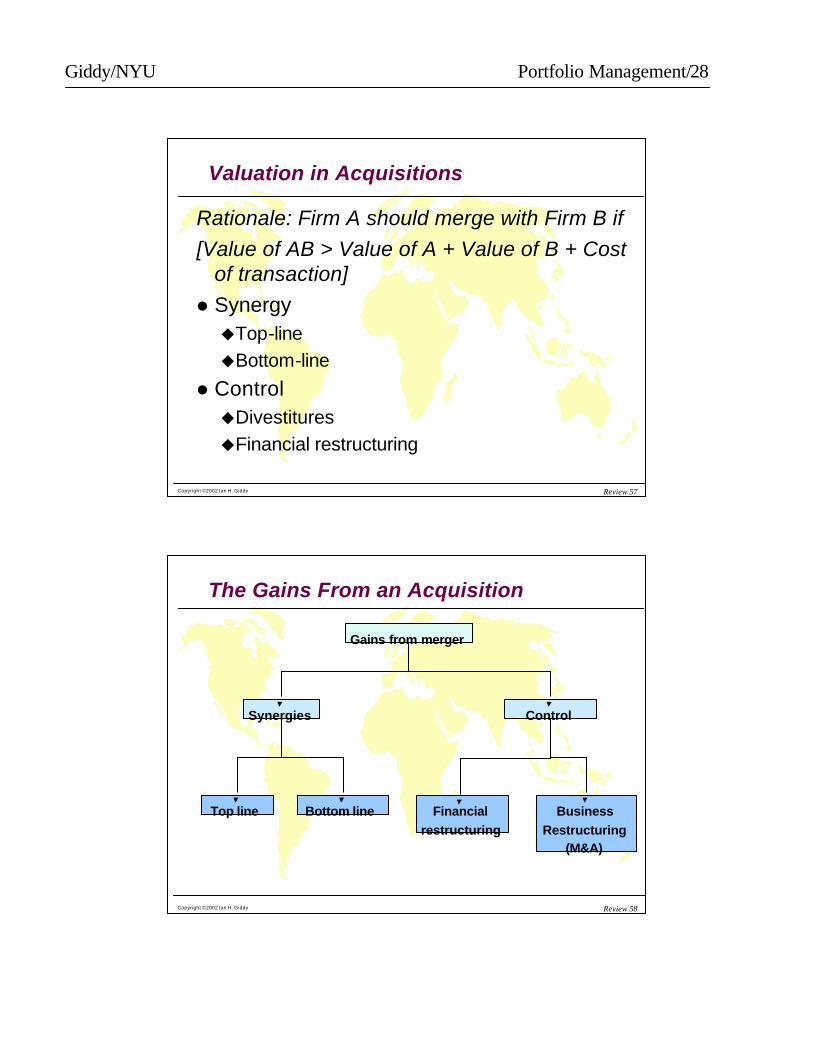
Optimal Overall Portfolio
σ
Indifference curve
Opportunity set
CALE(r)
P
Optimal complete portfolio (one example)
OPTIMAL RISKY PORTFOLIOOPTIMAL RISKY PORTFOLIO

Giddy/NYU Portfolio Management/22
Copyright ©2002 Ian H. Giddy Review 45
Security Market Line
Nondiversifiable Risk, β0 .50 1.0 1.5 2.0 . . .
SML
}Market RiskPremium: 4%
} Asset Z’s Risk Premium: 6%
1716151413121110
987654321
kz =
km =
RF =
RequiredReturn, k(%)
β RFβ m β z
Copyright ©2002 Ian H. Giddy Review 46
The Equation for the CAPM
kj = RF + βj (km - RF)where:kj = Required return on asset j;RF = Risk-free rate of return
βj = Beta Coefficient for asset j;km = Market return
The term [βj(km - RF)] is called the risk premium and (km-RF) is called the market risk premium

Giddy/NYU Portfolio Management/23
Copyright ©2002 Ian H. Giddy Review 47
Diversification and Asset Pricing: Summary
l Investors diversify, because you get a better return for a given risk.
l There is a fully-diversified “market portfolio” that we should all choose
l The risk of an individual asset can be measured by how much risk it adds to the “market portfolio”
l The CAPM tells us how the required return relates to the relevant risk.
Copyright ©2002 Ian H. Giddy Review 48
Value is Not Price
l What is Intrinsic Value?uSelf assigned ValueuVariety of models are used for estimation
l Market PriceuWhat stock can be sold for or bought at
l Trading Signalu IV > MP Buyu IV < MP Sell or Short Sellu IV = MP Hold or Fairly Priced
More, less, or same as market portfolio?

Giddy/NYU Portfolio Management/24
Copyright ©2002 Ian H. Giddy Review 49
Equity Valuation: From the Balance Sheet
Value of Assetsn Bookn Liquidationn Replacement
Value of Liabilities
n BooknMarket
Value of Equity
Valuation approach depends on the purpose:n Liquidation/breakup?n Going independent concernn Takeover/change in control?
Copyright ©2002 Ian H. Giddy Review 50
The Balance Sheet
Total Value of Liabilitiesand Shareholders’ Equity
Total Value of Assets
NetWorkingCapitalCurrent
Assets
Fixed Assets
1. Tangible fixed assets
2. Intangible fixed assets
Current Liabilities
Long-Term Debt
Shareholders’Equity

Giddy/NYU Portfolio Management/25
Copyright ©2002 Ian H. Giddy Review 51
Dividend Discount Model
01
12
21 1 1V Dk
Dk
D Pk
N NN= + +
+
+ + +( ) ( ) ( )...
l PN = the expected sales price for the stock at time N
l N = the specified number of years the stock is expected to be held
Copyright ©2002 Ian H. Giddy Review 52
No Growth Model: Example
E1 = D1 = $5.00k = .15V0 = $5.00 / .15 = $33.33
VDk
o =

Giddy/NYU Portfolio Management/26
Copyright ©2002 Ian H. Giddy Review 53
Constant Growth Model: Example
VoD g
k go
=+
−( )1
E1 = $5.00 b = 40% k = 15%(1-b) = 60% D1 = $3.00 g = 8%V0 = 3.00 / (.15 - .08) = $42.86
Copyright ©2002 Ian H. Giddy Review 54
Shifting Growth Rate Model: Example
D0 = $2.00 g1 = 20% g2 = 5% k = 15% T = 3 D1 = 2.40 D2 = 2.88 D3 = 3.46 D4 = 3.63
V0 = D1/(1.15) + D2/(1.15)2 + D3/(1.15)3 +D4 / (.15 - .05) ( (1.15)3
V0 = 2.09 + 2.18 + 2.27 + 23.86 = $30.40
Giddy/NYU Portfolio Management/27
Copyright ©2002 Ian H. Giddy Review 55
Ratios May Have Meaning
l Gordon Growth Model:l Dividing both sides by the earnings,
l Dividing both sides by the book value of equity,
l If the return on equity is written in terms of the retention ratio and the expected growth rate
l Dividing by the Sales per share,
P0 =DPS1r − gn
P0
EPS0= PE=
Payout Ratio* (1 + gn)
r-gn
P0
BV 0= PBV =
ROE - gn
r -gn
P0
BV 0= PBV =
ROE * Payout Ratio* (1 + g n )
r-gn
P 0
Sales0= PS =
Profit Margin* Payout Ratio* (1 + g n )
r -gn
Copyright ©2002 Ian H. Giddy Review 56
Valuing a Firm with DCF: An Illustration
Historical financial results
Adjust for nonrecurring aspects
Gauge future growth
Adjust for noncash items
Projected sales and operating profits
Projected free cash flows to the firm (FCFF)
Year 1 FCFF
Year 2 FCFF
Year 3 FCFF
Year 4 FCFF
Terminal year FCFF
Stable growth model or P/E comparable
Present value of free cash flows
+ cash, securities & excess assets
- Market value of debt
Value of shareholders equity
…
Discount to present using weighted average cost of capital (WACC)
Giddy/NYU Portfolio Management/28
Copyright ©2002 Ian H. Giddy Review 57
Valuation in Acquisitions
Rationale: Firm A should merge with Firm B if [Value of AB > Value of A + Value of B + Cost
of transaction]l SynergyuTop-lineuBottom-line
l ControluDivestituresuFinancial restructuring
Copyright ©2002 Ian H. Giddy Review 58
The Gains From an Acquisition
Gains from merger
Synergies Control
Top line Financialrestructuring
BusinessRestructuring
(M&A)
Bottom line
Giddy/NYU Portfolio Management/29
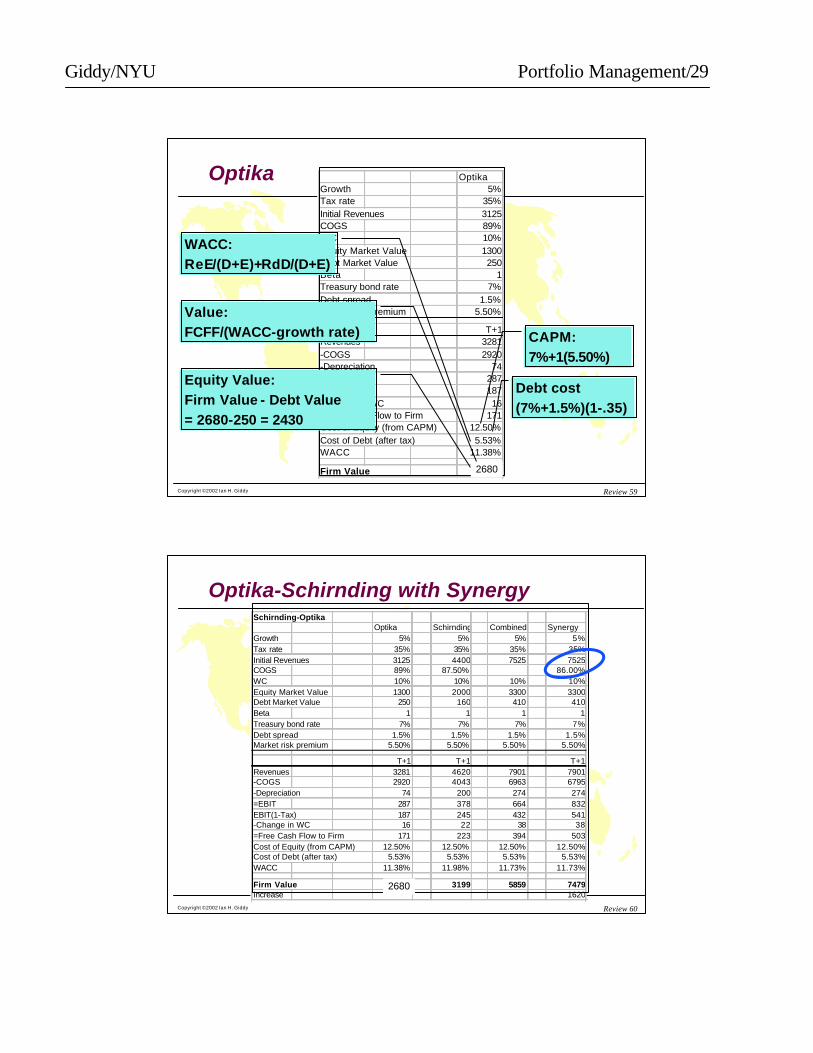
Copyright ©2002 Ian H. Giddy Review 59
Optika OptikaGrowth 5%Tax rate 35%Initial Revenues 3125COGS 89%WC 10%Equity Market Value 1300Debt Market Value 250Beta 1Treasury bond rate 7%Debt spread 1.5%Market risk premium 5.50%
T+1Revenues 3281-COGS 2920-Depreciation 74=EBIT 287EBIT(1-Tax) 187-Change in WC 16=Free Cash Flow to Firm 171Cost of Equity (from CAPM) 12.50%Cost of Debt (after tax) 5.53%WACC 11.38%
Firm Value 2278
CAPM:7%+1(5.50%)
Debt cost(7%+1.5%)(1-.35)
WACC:ReE/(D+E)+RdD/(D+E)
Value:FCFF/(WACC-growth rate)
Equity Value:Firm Value - Debt Value = 2680-250 = 2430
2680
Copyright ©2002 Ian H. Giddy Review 60
Optika-Schirnding with SynergySchirnding-Optika
Optika Schirnding Combined SynergyGrowth 5% 5% 5% 5%Tax rate 35% 35% 35% 35%Initial Revenues 3125 4400 7525 7525COGS 89% 87.50% 86.00%WC 10% 10% 10% 10%Equity Market Value 1300 2000 3300 3300Debt Market Value 250 160 410 410Beta 1 1 1 1Treasury bond rate 7% 7% 7% 7%Debt spread 1.5% 1.5% 1.5% 1.5%Market risk premium 5.50% 5.50% 5.50% 5.50%
T+1 T+1 T+1Revenues 3281 4620 7901 7901-COGS 2920 4043 6963 6795-Depreciation 74 200 274 274=EBIT 287 378 664 832EBIT(1-Tax) 187 245 432 541-Change in WC 16 22 38 38=Free Cash Flow to Firm 171 223 394 503Cost of Equity (from CAPM) 12.50% 12.50% 12.50% 12.50%Cost of Debt (after tax) 5.53% 5.53% 5.53% 5.53%WACC 11.38% 11.98% 11.73% 11.73%
Firm Value 2278 3199 5859 7479Increase 1620
2680

Giddy/NYU Portfolio Management/30
Copyright ©2002 Ian H. Giddy Review 61
What’s a Company Worth?Alternative Models
l The options approachuOption to expanduOption to abandon
l Creation of key resources that another company would pay foruPatents or trademarksuTeams of employeesuCustomers
l Examples?
LycosLycos
Messageclick.comMessageclick.com
Copyright ©2002 Ian H. Giddy Review 62
International
l Exchange Rate Risk is the risk arising from fluctuating exchange rates between two currencies

Giddy/NYU Portfolio Management/31
Copyright ©2002 Ian H. Giddy Review 63
Foreign Exchange Quotations
Spot Forward points
Copyright ©2002 Ian H. Giddy Review 64
Exchange Rates
CurrencyHowquoted
Spot(2 businessdays)
Forward(90 days)
Britishpounds(GBP)
US$perGBP
1.632 1.617
Japaneseyen (JPY)
Yen perUS$
117.5 116.3
Giddy/NYU Portfolio Management/32
Copyright ©2002 Ian H. Giddy Review 65
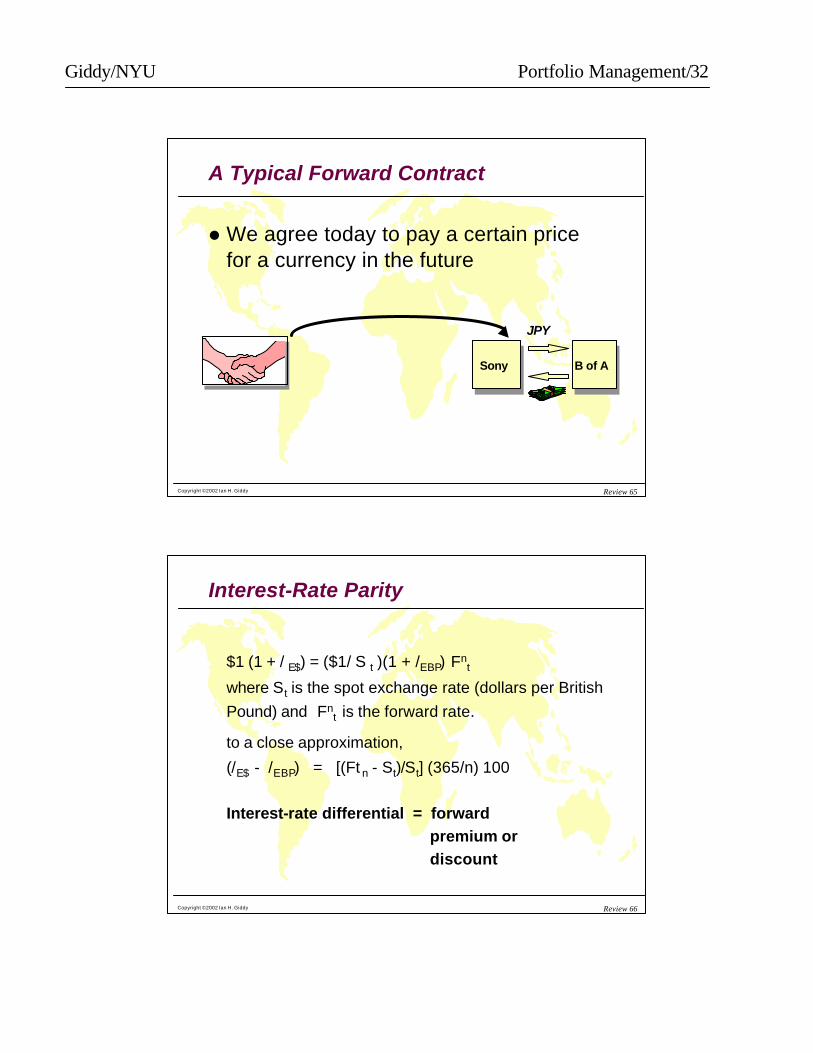
A Typical Forward Contract
l We agree today to pay a certain price for a currency in the future
SonySony B of AB of A
JPY
Copyright ©2002 Ian H. Giddy Review 66
Interest-Rate Parity
$1 (1 + / E$) = ($1/ S t )(1 + /EBP) Fnt
where St is the spot exchange rate (dollars per British Pound) and Fn
t is the forward rate.
to a close approximation,
(/E$ - /EBP) = [(Ft n - St)/St] (365/n) 100
Interest-rate differential = forwardpremium ordiscount

Giddy/NYU Portfolio Management/33
Copyright ©2002 Ian H. Giddy Review 67
Returns with FX
(1 + rUS) = (1 + rFM) (1 + rFX)
rUS = return on the foreign investment in US Dollars
rFM = return on the foreign market in local currency
rFX = return on the foreign exchange
Copyright ©2002 Ian H. Giddy Review 68
Hedging International Equity Investments
l Buy foreign equity and hedge the anticipated future value, P+E(r)?
l Use short-term, value-adjusted, roll-over hedges?
l Do nothing, because equities bear no currency sign?
AnticipatedAnticipatedActualActualInitialInitial

Giddy/NYU Portfolio Management/34
Copyright ©2002 Ian H. Giddy Review 69
Commodities: Spot and Forward
n$1584.5
n$1607.0
ALUMINUM PRICEper tonne
3 MONTHS 6 MONTHSSPOT
How can Coke’s canners cap their can costs?
Copyright ©2002 Ian H. Giddy Review 70
Swaps
GEGE ChaseChase
8% Fixed
3-mo Libor,floating
Ongoingshort-term
funding

Giddy/NYU Portfolio Management/35
Copyright ©2002 Ian H. Giddy Review 71
Cost-of-Carry Theory Applied to Stock Futures
Stock that pays no cash dividenduno storage costsuno seasonal patterns in prices
Strategy 1: Buy the stock now and hold it until time T
Strategy 2: Put funds aside today to perform on a futures contract for delivery at time T that is acquired today
Copyright ©2002 Ian H. Giddy Review 72
PayoffPayoff
Stock PriceStock Price
0
Call OptionCall Option
Options

Giddy/NYU Portfolio Management/36
Copyright ©2002 Ian H. Giddy Review 73
PayoffPayoff
Stock PriceStock Price
0
Call WriterCall Writer
Call HolderCall Holder
Payoff Profiles for Calls
Copyright ©2002 Ian H. Giddy Review 74
Arbitrage & Put Call Parity
Since the payoff on a combination of a long call and a short put are equivalent to leveraged equity, the prices must be equal.
C - P = S0 - X / (1 + rf)T
If the prices are not equal arbitrage will be possible

Giddy/NYU Portfolio Management/37
Copyright ©2002 Ian H. Giddy Review 75
Option Pricing
94.5
Option Price= Intrinsic value + Time value
Option Price
UnderlyingPrice
94.75
Time value depends onn TimenVolatilitynDistance from the strike price
Time value depends onn TimenVolatilitynDistance from the strike price
Copyright ©2002 Ian H. Giddy Review 76
Trading Options: Delta Hedging
Delta
We’ve written a put option
Hedged with 40% short
futures

Giddy/NYU Portfolio Management/38
Copyright ©2002 Ian H. Giddy Review 77
Goal: Understand Options’ Sensitivity
An option trader has a portfolio of options with different deltas, gammas, etc. The goal is to discover the sensitivities of the portfolio to changes in rates, time, volatility, etc, and to neutralize them.
Greek Measures∆ Delta Sensitivity of portfolio value to change in
price of the underlying assetΓ Gamma Sensitivity of delta to change in price of
underlying assetθ Theta Sensitivity of portfolio value to change in
timeΛ Lambda
(Vega)Sensitivity of portfolio value to change involatility
Ρ Rho Sensitivity of portfolio to change in interestrate
Copyright ©2002 Ian H. Giddy Review 78
Option Applications
l Cap: Agreement to compensate buyer when interest rate exceeds a specified ceiling.
l Floor: Agreement to compensate buyer when interest rate falls below a specified floor.
l Collar: A simultaneous purchase of a cap and sale of a floor. Net cost is the price of the cap less the value of the floor. Example:u If LIBOR > 12% cap, bank pays borrower the differenceu If LIBOR < 4% floor, borrower pays bank the difference
l Swaption: Option on a swap.

Giddy/NYU Portfolio Management/39
Copyright ©2002 Ian H. Giddy Review 79
Factors Influencing Cap Prices
l Lengthl Steepness of yield curvel Volatility
Yield Curve(Zero rates)
Volatility Curve
Forward Rates
Cap
Copyright ©2002 Ian H. Giddy Review 80
Convertibles, Warrants,and Other Hybrids
l Convertible Securitiesl Stock-Purchase Warrantsl Structured NotesGeneral principle: security can be valued
as a portfolio of two or more instruments
Giddy/NYU Portfolio Management/40
Copyright ©2002 Ian H. Giddy Review 81
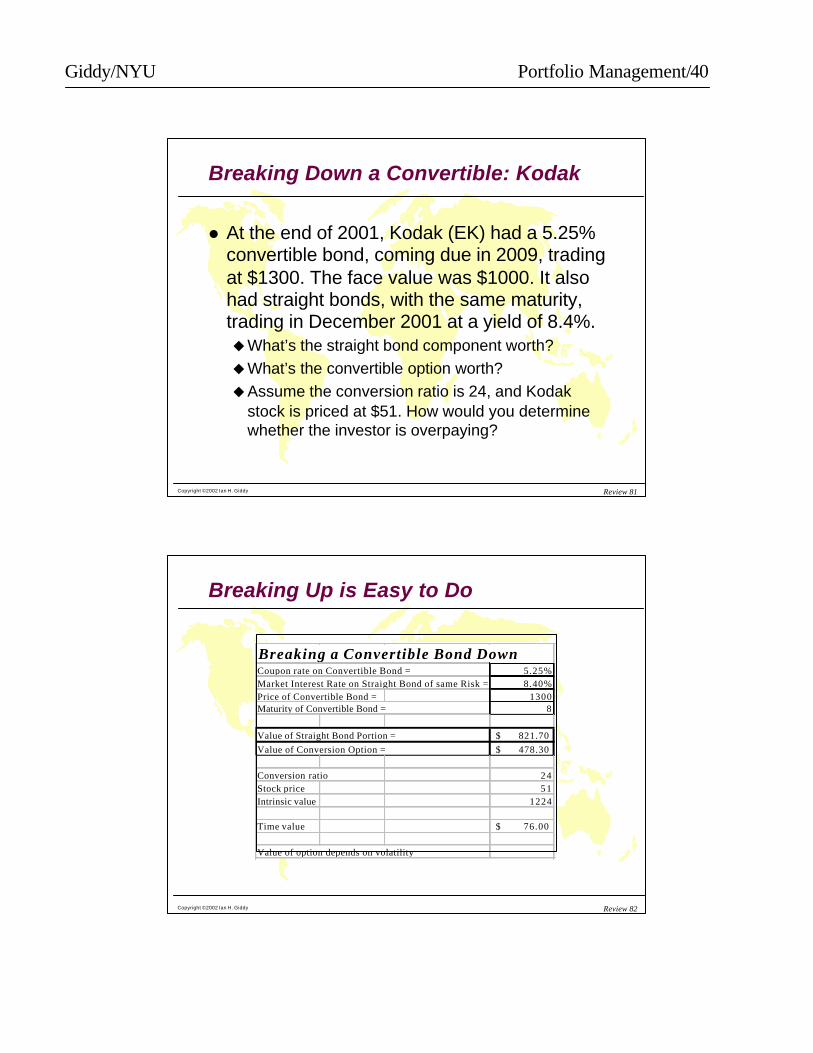
Breaking Down a Convertible: Kodak
l At the end of 2001, Kodak (EK) had a 5.25% convertible bond, coming due in 2009, trading at $1300. The face value was $1000. It also had straight bonds, with the same maturity, trading in December 2001 at a yield of 8.4%. uWhat’s the straight bond component worth?uWhat’s the convertible option worth?uAssume the conversion ratio is 24, and Kodak
stock is priced at $51. How would you determine whether the investor is overpaying?
Copyright ©2002 Ian H. Giddy Review 82
Breaking Up is Easy to Do
Breaking a Convertible Bond DownCoupon rate on Convertible Bond = 5.25%Market Interest Rate on Straight Bond of same Risk = 8.40%Price of Convertible Bond = 1300Maturity of Convertible Bond = 8
Value of Straight Bond Portion = 821.70$ Value of Conversion Option = 478.30$
Conversion ratio 24Stock price 51Intrinsic value 1224
Time value 76.00$
Value of option depends on volatility

Giddy/NYU Portfolio Management/41
Copyright ©2002 Ian H. Giddy Review 83
Capital Allocation
Risk-Free Asset
Bonds Real Estate
ConEd Viacom Chase Siemens
Security Selection
Stocks Commodities FX
Asset Allocation
Risky Assets
Capital Allocation
Copyright ©2002 Ian H. Giddy Review 84
Portfolio Performance Evaluation
l How well did the portfolio do?l How do we adjust for risk, to compare
different managers?l Why?uRiskuTiminguAsset allocationuSecurity selection
Giddy/NYU Portfolio Management/42
Copyright ©2002 Ian H. Giddy Review 85
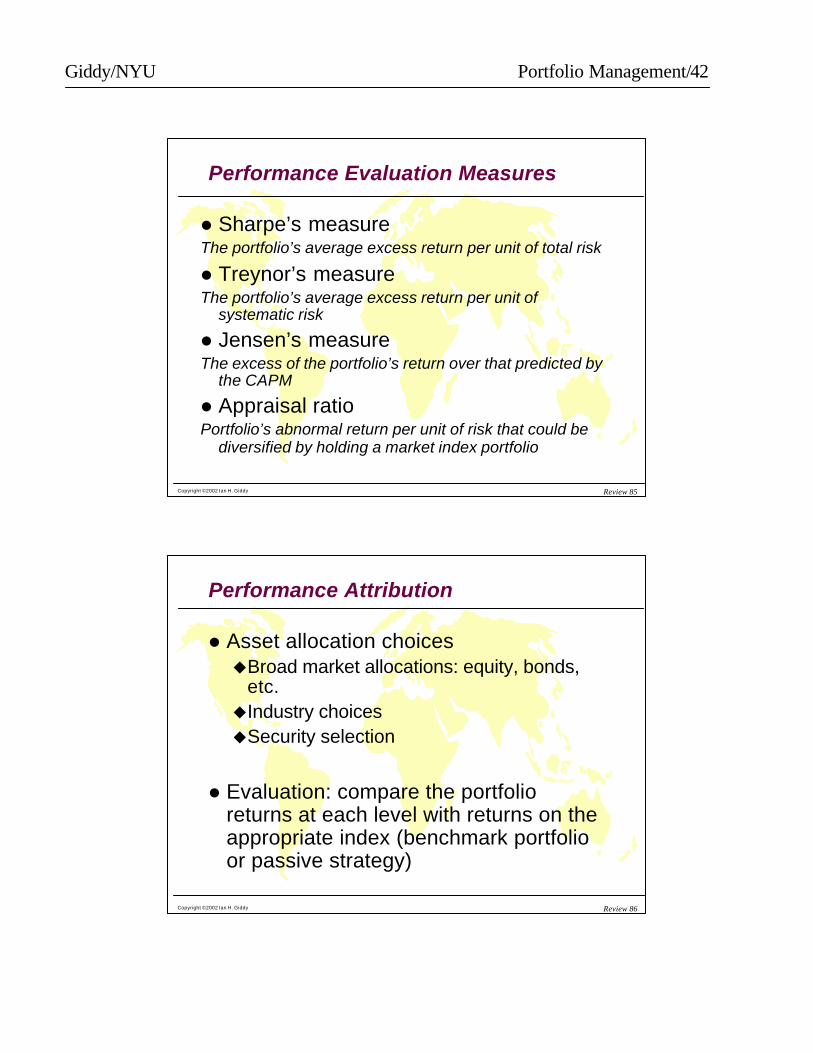
Performance Evaluation Measures
l Sharpe’s measureThe portfolio’s average excess return per unit of total risk
l Treynor’s measureThe portfolio’s average excess return per unit of
systematic risk
l Jensen’s measureThe excess of the portfolio’s return over that predicted by
the CAPM
l Appraisal ratioPortfolio’s abnormal return per unit of risk that could be
diversified by holding a market index portfolio
Copyright ©2002 Ian H. Giddy Review 86
Performance Attribution
l Asset allocation choicesuBroad market allocations: equity, bonds,
etc.uIndustry choicesuSecurity selection
l Evaluation: compare the portfolio returns at each level with returns on the appropriate index (benchmark portfolio or passive strategy)

Giddy/NYU Portfolio Management/43
Copyright ©2002 Ian H. Giddy Review 87
Active Portfolio Management
l Stock-picking and active portfolio management must pay, else the market would not be efficient!
l The optimal risky portfolio maximizes the reward-to-variability ratio; the slope of the CAL:
PASSIVECAPITAL ALLOCATON LINE
ACTIVECAPITAL ALLOCATON LINE
E(rp)
σ
Copyright ©2002 Ian H. Giddy Review 88
Conclusion: Hold Three Things
l Risk-free assetl Passive portfoliol Active portfolio

Giddy/NYU Portfolio Management/44
Copyright ©2002 Ian H. Giddy Review 93
Ian Giddy
NYU Stern School of Business44 West 4th St, NY 10012, USATel 212-998-0426; Fax [email protected]://giddy.org