Review Draft Assimilative Capacity Study for Nutrient ...
80
Review Draft Assimilative Capacity Study for Nutrient Loading in the Lower White River December 1999 Publication No. 00-03-001 printed on recycled paper
Transcript of Review Draft Assimilative Capacity Study for Nutrient ...
Review DraftAssimilative Capacity Study for
Nutrient Loadingin the Lower White River
December 1999
Publication No. 00-03-001printed on recycled paper
The Department of Ecology is an equal opportunity agencyand does not discriminate on the basis of race, creed,
color, disability, age, religion, national origin,sex, marital status, disabled veteran's status,
Vietnam Era veteran's status or sexual orientation.
If you have special accommodation needs or require this documentin alternative format, please contact the
Environmental Assessment Program, Joan LeTourneau at (360) 407-6764 (voice).
Ecology's telecommunications device for the deaf (TDD) number atEcology Headquarters is (360) 407-6006.
For additional copies of this publication,please contact:
Department of EcologyPublications Distributions Office
P. O. Box 47600Olympia, Washington 98504-7600
(360) 407-7472
Refer to Publication Number 00-03-001
Review DraftAssimilative Capacity Study for
Nutrient Loadingin the Lower White River
byKarol Erickson
Washington State Department of EcologyEnvironmental Assessment Program
Watershed Assessment SectionPO Box 47710
Olympia, Washington 98504-7710
December 1999
Water Body No. WA-10-1040
Publication No. 00-03-001printed on recycled paper
DRAFT – DO NOT CITE OR QUOTE Page i
Table of ContentsPage
List of Appendices............................................................................................................... ii
List of Figures and Tables .................................................................................................. iiiFigures .......................................................................................................................... iiiTables ........................................................................................................................... iv
Abstract ............................................................................................................................... v
Acknowledgements ............................................................................................................ vi
Introduction ......................................................................................................................... 1Background ................................................................................................................... 1Study Area..................................................................................................................... 1Relationship of pH to Nutrient Levels .......................................................................... 3Sources of Nutrients ...................................................................................................... 4Project Objectives ......................................................................................................... 4Water Quality Standards and Beneficial Uses............................................................... 4
Historical Data Summary .................................................................................................... 7Puyallup River TMDL................................................................................................... 7
Methods............................................................................................................................... 8Field Surveys................................................................................................................. 8Groundwater Study...................................................................................................... 12
Results ............................................................................................................................... 13Quality Assurance ....................................................................................................... 13pH................................................................................................................................ 13Dissolved Oxygen ....................................................................................................... 16Nutrients ...................................................................................................................... 16Nutrient Profiles .......................................................................................................... 19Historical Nutrient Concentrations.............................................................................. 22Nutrients vs. pH........................................................................................................... 23Turbidity...................................................................................................................... 23Alkalinity..................................................................................................................... 27Chlorophyll a and Periphyton ..................................................................................... 27Temperature ................................................................................................................ 29Fecal Coliform Bacteria .............................................................................................. 29
Assimilative Capacity Analysis......................................................................................... 311. Comparison of Upstream and Downstream Nutrient and pH Values ................... 322. Comparison to Literature Values ........................................................................... 32Sensitivity to Streamflow Levels ................................................................................ 34
Conclusions ....................................................................................................................... 35
Recommendations ............................................................................................................. 36
References ......................................................................................................................... 37
Page ii DRAFT – DO NOT CITE OR QUOTE
List of Appendices
A. Historical Data
B. Assessment of pH Response to Nutrient Loading in the Lower White River
C. Quality Assurance Analysis
D. Project Data
E. Mainstem Nutrient Profile Modeling
F. Periphyton Identification
G. Tabular Data for Figure 19
DRAFT – DO NOT CITE OR QUOTE Page iii
List of Figures and TablesPage
FiguresFigure 1. Study Area........................................................................................................... 2
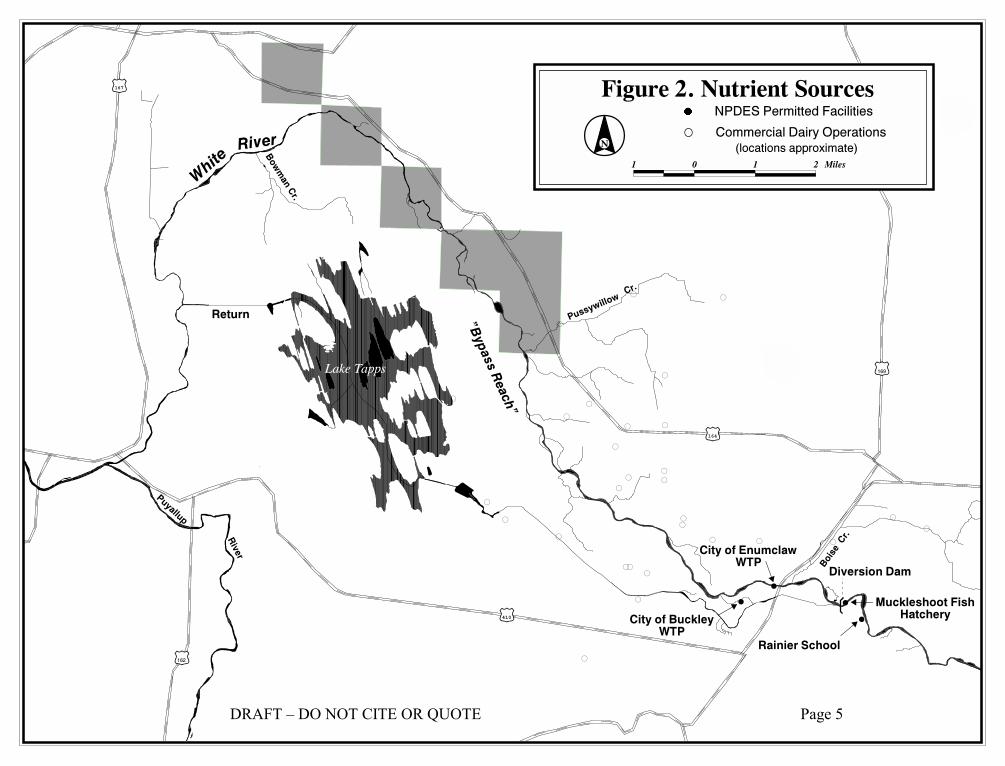
Figure 2. Nutrient Sources.................................................................................................. 5
Figure 3. Sampling sites ................................................................................................... 10
Figure 4. Schematic diagram of USGS gaging stations for the White River ................... 11
Figure 5. White River pH at river miles 25.2 and 8.0, 1996 surveys ............................... 13
Figure 6. White River pH at river mile 8.0; 1990, 1996, 1997, and 1999........................ 14
Figure 7. White River pH by day of year, all data within study area ............................... 16
Figure 8. White River dissolved oxygen percent saturation at river miles 25.2 and 8.0,continuous data ................................................................................................... 17
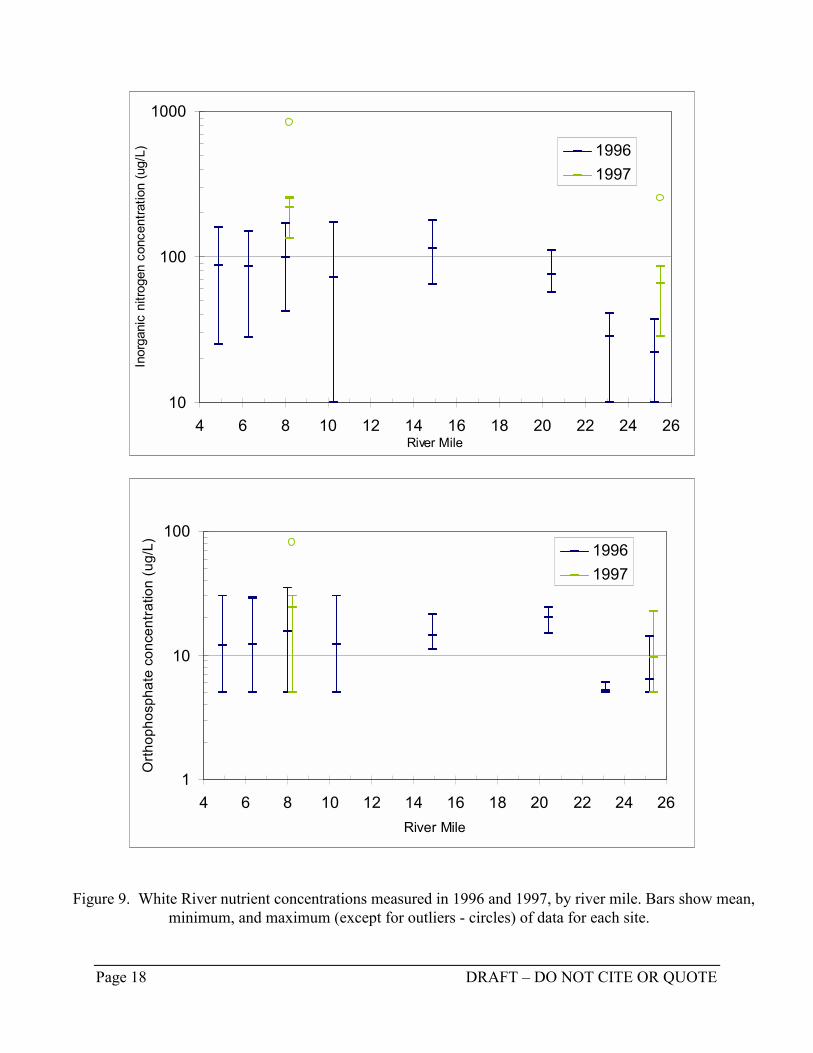
Figure 9. White River nutrient concentrations measured in 1996 and 1997, by rivermile. .................................................................................................................. 18
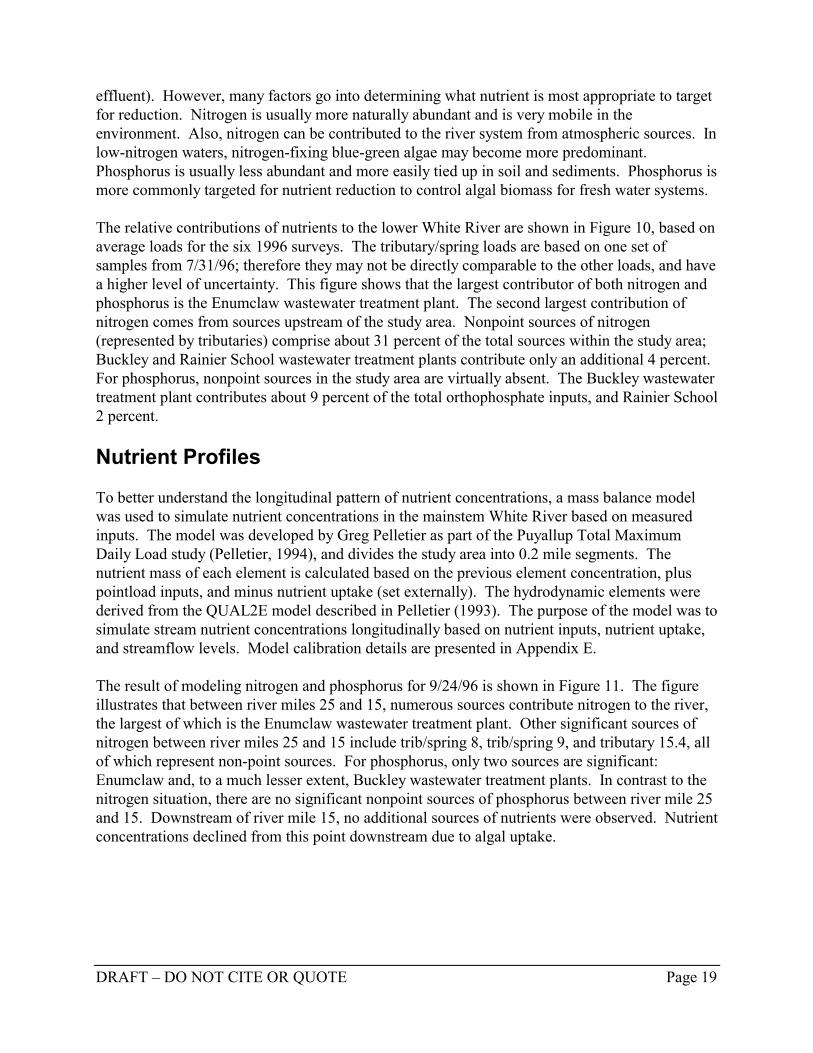
Figure 10. Relative contributions of nutrients to the lower White River. Average loads from 6 surveys in 1996 ..................................................................................... 20
Figure 11. White River modeled and measured inorganic nitrogen and orthophosphate 9/24/96; streamflow = 512 cfs at river mile 23.3............................................... 21
Figure 12. White River nitrate concentration time series for all available data, 1961 to 1999; combined data for river miles 4.9, 6.3, and 8.0 ........................ 22
Figure 13. White River nitrate concentration box plots by month for all available data,1961 to 1999; combined data for river miles 4.9, 6.3, and 8.0.. ......................... 23
Figure 14. Lower White River pH vs. inorganic nitrogen and orthophosphate concentrations, combined data for river miles 4.9, 6,3, and 8.0 ..................... 24
Figure 15. White River historical turbidity measurements (in NTU) within the study area,by time of year. . ................................................................................................. 25
Figure 16. White River turbidity, 1996 surveys, by river mile.......................................... 26
Figure 17. White River turbidity vs. pH for all available data in the study area............... 28
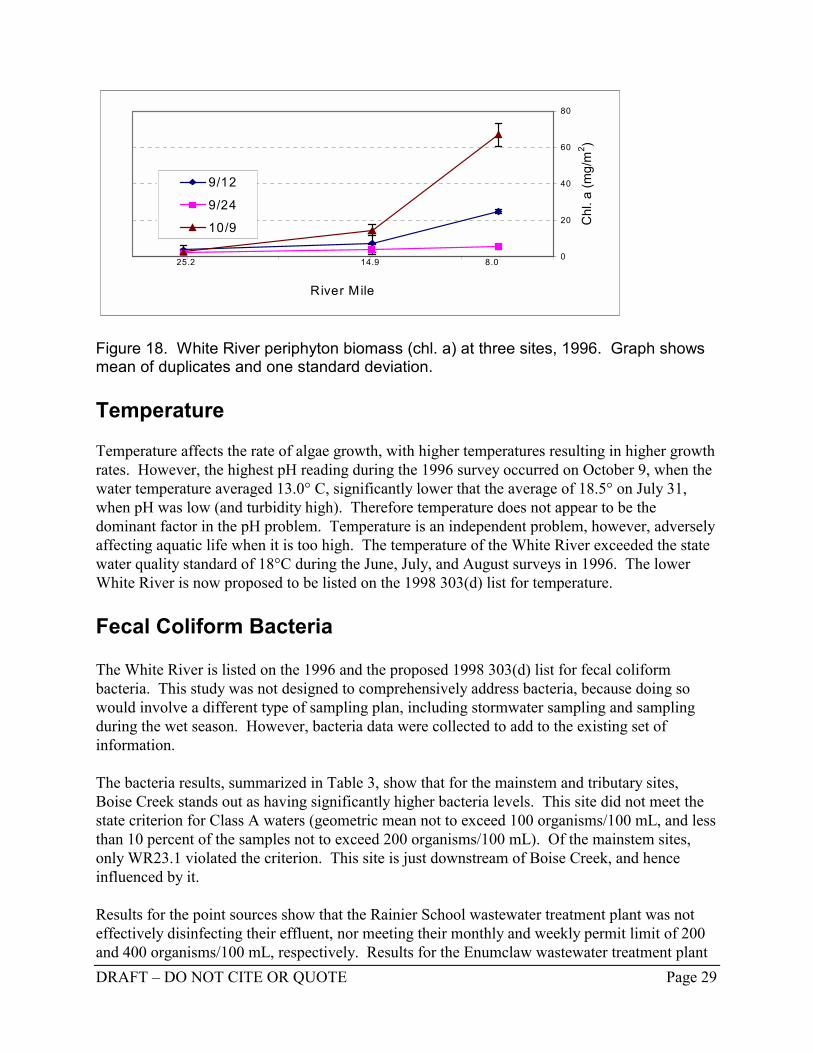
Figure 18. White River periphyton biomass (chl. a) at three sites, 1996 .......................... 29
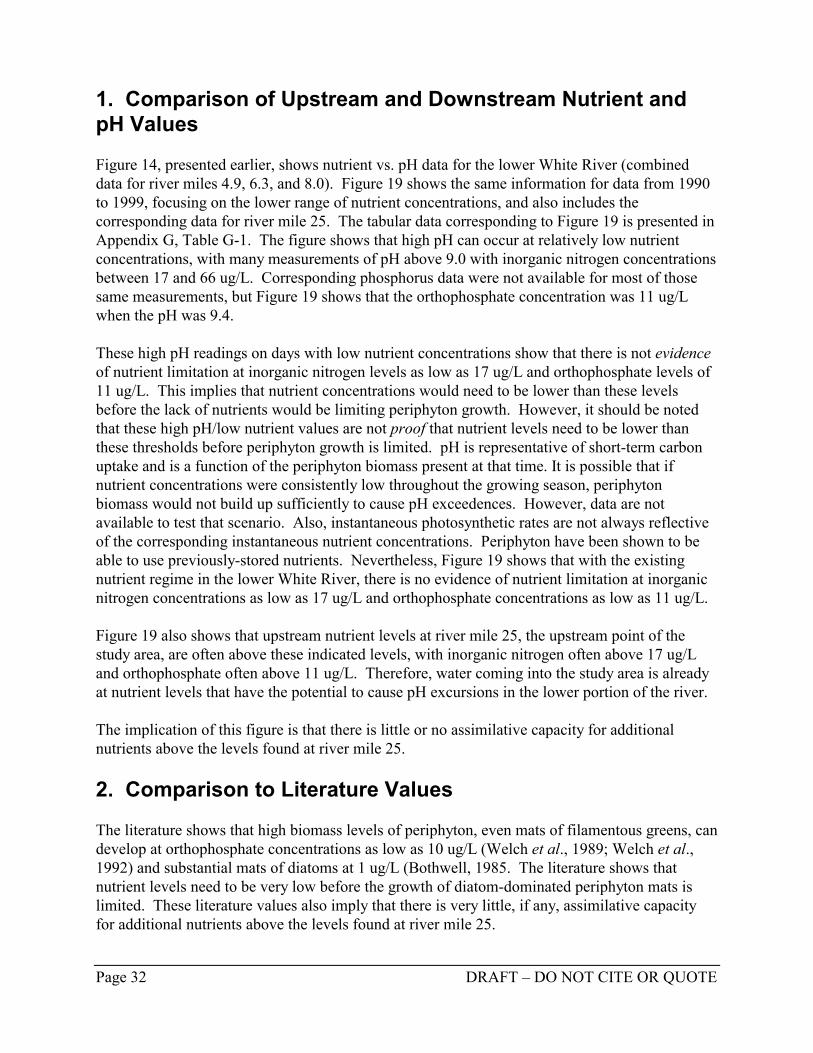
Figure 19. pH vs. inorganic nitrogen and orthophosphate concentrations for the lower White River and river mile 25. ............................................................... 33

Page iv DRAFT – DO NOT CITE OR QUOTE
TablesTable 1. Ambient monitoring data availability for the White River .................................. 7
Table 2. White River Nutrient TMDL sampling surveys in 1996...................................... 9
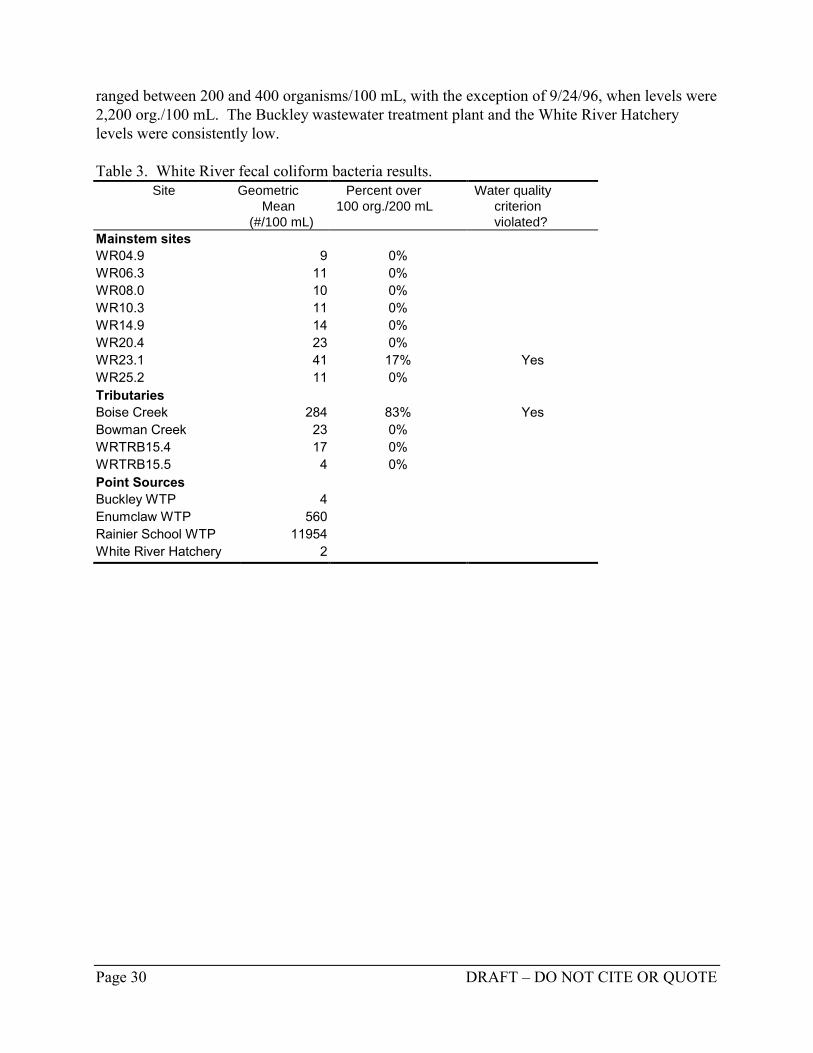
Table 3. White River fecal coliform bacteria results........................................................ 30
DRAFT – DO NOT CITE OR QUOTE Page v
Abstract
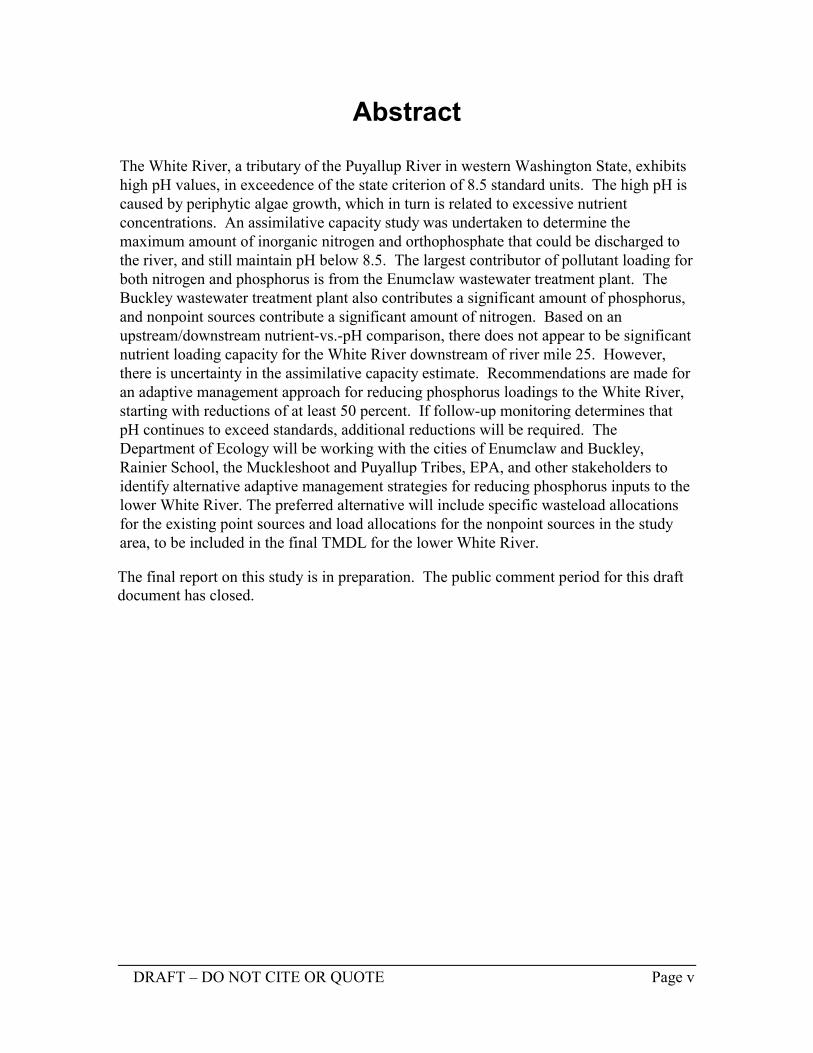
The White River, a tributary of the Puyallup River in western Washington State, exhibitshigh pH values, in exceedence of the state criterion of 8.5 standard units. The high pH iscaused by periphytic algae growth, which in turn is related to excessive nutrientconcentrations. An assimilative capacity study was undertaken to determine themaximum amount of inorganic nitrogen and orthophosphate that could be discharged tothe river, and still maintain pH below 8.5. The largest contributor of pollutant loading forboth nitrogen and phosphorus is from the Enumclaw wastewater treatment plant. TheBuckley wastewater treatment plant also contributes a significant amount of phosphorus,and nonpoint sources contribute a significant amount of nitrogen. Based on anupstream/downstream nutrient-vs.-pH comparison, there does not appear to be significantnutrient loading capacity for the White River downstream of river mile 25. However,there is uncertainty in the assimilative capacity estimate. Recommendations are made foran adaptive management approach for reducing phosphorus loadings to the White River,starting with reductions of at least 50 percent. If follow-up monitoring determines thatpH continues to exceed standards, additional reductions will be required. TheDepartment of Ecology will be working with the cities of Enumclaw and Buckley,Rainier School, the Muckleshoot and Puyallup Tribes, EPA, and other stakeholders toidentify alternative adaptive management strategies for reducing phosphorus inputs to thelower White River. The preferred alternative will include specific wasteload allocationsfor the existing point sources and load allocations for the nonpoint sources in the studyarea, to be included in the final TMDL for the lower White River.
The final report on this study is in preparation. The public comment period for this draftdocument has closed.
Page vi DRAFT – DO NOT CITE OR QUOTE
Acknowledgements
The many people contributing to this study are appreciated and deserve recognition.
John Tooley conducted the groundwater component of the study.
Emmanuel Nocon, Glenn Merritt, Norm Glenn, Joe Joy, Dan Saul, Bob Duffy, JohnTooley, and Will Kendra assisted with field work.
Randy Coots developed the maps.
Greg Pelletier provided guidance throughout the project.
Russ Ladley, Puyallup Tribe Fisheries Department, provided a boat and river raftingexpertise for the tributary and spring sampling.
Leslie Groce and Rob Fritz, of the Muckleshoot Tribe, provided valuable comments onthe project plan and assisted in defining sampling sites.
Review comments were provided by Dr. Eugene Welch, Ralph Vaga and Geoff Pooleof U.S. EPA Region 10, Julie Rector of the Muckleshoot Tribe, representatives of thecities of Enumclaw and Buckley, Peter Leinenbach, Greg Pelletier, Will Kendra, BillEhinger, Anise Ahmed, and Bob Duffy.
DRAFT – DO NOT CITE OR QUOTE Page 1
Introduction
Background
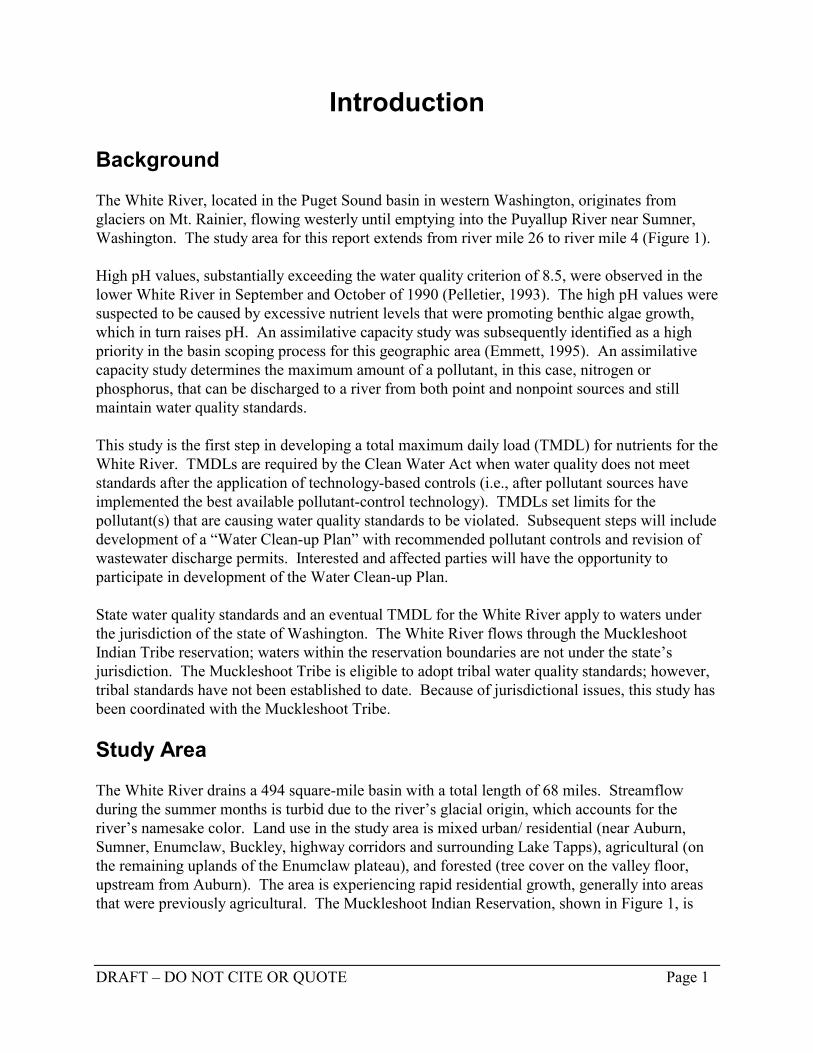
The White River, located in the Puget Sound basin in western Washington, originates fromglaciers on Mt. Rainier, flowing westerly until emptying into the Puyallup River near Sumner,Washington. The study area for this report extends from river mile 26 to river mile 4 (Figure 1).
High pH values, substantially exceeding the water quality criterion of 8.5, were observed in thelower White River in September and October of 1990 (Pelletier, 1993). The high pH values weresuspected to be caused by excessive nutrient levels that were promoting benthic algae growth,which in turn raises pH. An assimilative capacity study was subsequently identified as a highpriority in the basin scoping process for this geographic area (Emmett, 1995). An assimilativecapacity study determines the maximum amount of a pollutant, in this case, nitrogen orphosphorus, that can be discharged to a river from both point and nonpoint sources and stillmaintain water quality standards.
This study is the first step in developing a total maximum daily load (TMDL) for nutrients for theWhite River. TMDLs are required by the Clean Water Act when water quality does not meetstandards after the application of technology-based controls (i.e., after pollutant sources haveimplemented the best available pollutant-control technology). TMDLs set limits for thepollutant(s) that are causing water quality standards to be violated. Subsequent steps will includedevelopment of a “Water Clean-up Plan” with recommended pollutant controls and revision ofwastewater discharge permits. Interested and affected parties will have the opportunity toparticipate in development of the Water Clean-up Plan.
State water quality standards and an eventual TMDL for the White River apply to waters underthe jurisdiction of the state of Washington. The White River flows through the MuckleshootIndian Tribe reservation; waters within the reservation boundaries are not under the state’sjurisdiction. The Muckleshoot Tribe is eligible to adopt tribal water quality standards; however,tribal standards have not been established to date. Because of jurisdictional issues, this study hasbeen coordinated with the Muckleshoot Tribe.
Study Area
The White River drains a 494 square-mile basin with a total length of 68 miles. Streamflowduring the summer months is turbid due to the river’s glacial origin, which accounts for theriver’s namesake color. Land use in the study area is mixed urban/ residential (near Auburn,Sumner, Enumclaw, Buckley, highway corridors and surrounding Lake Tapps), agricultural (onthe remaining uplands of the Enumclaw plateau), and forested (tree cover on the valley floor,upstream from Auburn). The area is experiencing rapid residential growth, generally into areasthat were previously agricultural. The Muckleshoot Indian Reservation, shown in Figure 1, is
River
White
Cr.
Pussywillow
Lake Tapps
Bowman Cr.
Return
River
"Bypass Reach"
Boise
Cr.
Diversion Dam
(/162
(/169
(/167
(/410
(/164
White Bowman Cr.
River
Puyallup
MuckleshootIndian
Reservation
Auburn
Puyallup
Buckley
EnumclawSumner
Bonney Lake
2625
24
2322
21
20
19
18
17
16
15
14
13
12
11
10
9
87
6
5
4
3
2
1
27
Study Area° 1 0 1 2 MilesN
Figure 1. Study Area
Key1 River Mile
DRAFT – DO NOT CITE OR QUOTE Page 2
DRAFT – DO NOT CITE OR QUOTE Page 3
located along the White River between river miles 16 and 9. (River miles used in this report arebased on the catalog of Washington streams by the Department of Fisheries (Fisheries, 1975).The river miles are used as benchmarks for reference purposes, and may differ from other rivermile measurements due to river channel changes, scale effects, and other factors.)
At river mile 24.3, Puget Sound Energy diverts most of the river flow to Lake Tapps for powergeneration, leaving only a minimum flow in the mainstem until the water is returned at mile 3.5(Figure 1). This stretch of the river is known as the “bypass reach.” The study area for thisproject is from river mile 25 to river mile 3.5.
Relationship of pH to Nutrient Levels
Although the water quality problem in the White River is high pH, the assimilative capacitystudy was done for nutrients (nitrogen and phosphorus). The reason for this is described below.
High pH in the White River is caused by photosynthesis of algae. In the case of the White River,the algae are attached to rocks on the stream bottom (periphyton) as opposed to free-floating inthe water. The effect of photosynthesis on pH is well-documented in the literature and describedin textbooks on aquatic systems (Welch et al., 1992; Stumm and Morgan, 1981). Photosyntheticalgae consume CO2 faster than it can be replenished from the atmosphere, resulting in a net lossof carbon to the system. As total carbon goes down (and alkalinity remains essentially constant),pH goes up. Because of this process, the diurnal change in pH can be used as a measure ofphotosynthetic rate (Hall and Moll, 1975).
Algae photosynthesis can be summarized as:
Light + nitrogen + phosphorus + carbon Algae + oxygen
Carbon uptake occurs simultaneously with nutrient uptake, according to a stoichiometric ratiothat is similar to the carbon/nitrogen/phosphorus content of the algae. Therefore change in pH isdirectly related to nutrient uptake.
As depicted in the above equation, algae require nitrogen and phosphorus to grow. The purposeof this assimilative capacity study is to determine the maximum level of nutrients allowable inthe river to keep algae levels low enough that pH will be in compliance with standards.
Many other factors also affect algae growth, including light, temperature, stream water velocity,grazing by invertebrates, substratum type, and suspended sediment (Welch et al., 1992). Inaddition, the change in pH that results from a given amount of change in carbon is dependent onthe alkalinity of the water (also called buffering capacity). However, most of these factors arenatural characteristics of the system and are not controllable. Nutrient levels in the White Riverhave been increased over natural levels by human-related causes. Therefore, this assimilativecapacity study is focused on nutrients. The sensitivity of pH to streamflow levels is alsoaddressed in the Assimilative Capacity Analysis section.
Page 4 DRAFT – DO NOT CITE OR QUOTE
Sources of Nutrients
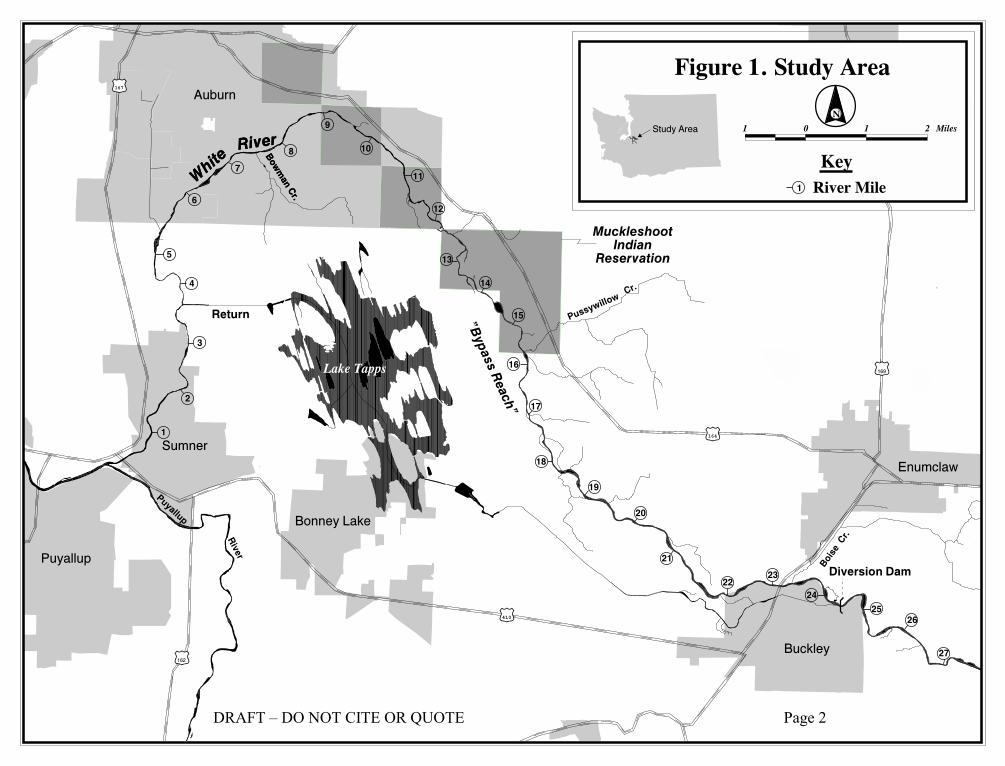
There are four point sources of nutrients in the study area (river miles given in parentheses).• Rainier School wastewater treatment plant (RM 25)• The White River Hatchery, operated by the Muckleshoot Indian Tribe (RM 24)• City of Enumclaw wastewater treatment plant (RM 23)• City of Buckley wastewater treatment plant (RM 22) There are numerous nonpoint sources of nutrients as well. In particular, about 20 dairies arelocated in the study area (Figure 2). In addition to dairies, other possible nonpoint sources ofnutrients include on-site septic systems, fertilizers, and other animal wastes.
Project Objectives The study objectives, as identified in the project plan (Erickson, 1996), were to:
• Characterize the White River pH, nutrient concentrations, and periphyton communities, bothlongitudinally along the affected river reach, and temporally over the summer season(including diurnal pH changes).
• Assess the relationship between nutrient concentrations, algal growth, streamflow, and pH forthe conditions observed.
• Assess nutrient loading from both point and nonpoint sources.
• Predict the effect of reduced nutrient loading on pH values.
Water Quality Standards and Beneficial Uses
The White River in the study area is classified as Class A, “excellent.” Washington State’s waterquality standards specify that “pH shall be within the range of 6.5 to 8.5 (freshwater) with ahuman-caused variation within a range of less than 0.5 units” (Ch.173-201A-030 WAC).Characteristic uses for this class consist of water supply (domestic, industrial, and agricultural),stock watering, fish and shellfish (salmonid and other fish migration, rearing, spawning andharvesting), wildlife habitat, recreation (primary contact recreation, sport fishing, boating, andaesthetic enjoyment), and commerce and navigation.
The pH of natural aquatic systems is important because the toxicity of many compounds isaffected by the degree of association of weak acids or bases, which is affected by pH. The mostobvious example of this for high pH is ammonia, which has been shown to be ten times as toxicat pH 8.0 as 7.0. On the other hand, metals, cyanide, and several other compounds are moretoxic at low pH. The “gold book” on water quality criteria (U.S. EPA, 1986) discusses thepotential impacts of pH on fishery resources:
There is no definite pH range within which a fishery is unharmed and outside of which it isdamaged, but rather, there is gradual deterioration as the pH values are further removed from
!
!
!
!
!
!
!
!!
!
!
!
!
!
!
!
!
!
!!
!
!
!
!!
!
!
!
!
#
#
#
#
(/164
(/410
(/167
(/169
(/162
Diversion DamBoise
Cr.
"Bypass Reach"Puyallup
River
Return
Bowman Cr.
PussywillowCr.
WhiteRiver Commercial Dairy Operations
(locations approximate)
NPDES Permitted Facilities
1 0 1 2 Miles
N
Figure 2. Nutrient Sources
°
Rainier School
Muckleshoot FishHatcheryCity of Buckley
WTP
City of EnumclawWTP
°°
°
Lake Tapps
DRAFT – DO NOT CITE OR QUOTE Page 5
Page 6 DRAFT – DO NOT CITE OR QUOTE
the normal range. The pH range which is not directly lethal to fish is 5 - 9; however, the toxicityof several common pollutants is markedly affected by pH changes within this range, andincreasing acidity or alkalinity may make these poisons more toxic (European Inland FisheriesAdvisory Commission, 1969).
The U.S. Fish and Wildlife Service (Piper et al., 1982), in discussing fish hatchery management,states:
Ninety percent of natural waters have pH values in the range 6.7 to 8.2 and fish should not becultured outside the range of 6.5 to 9.0. Many fish can live in waters of more extreme pH, evenfor extended periods, but at the cost of reduced growth and reproduction. Fish have lesstolerance of pH extremes at higher temperatures.
Even within the relatively narrow range of pH 6.5 to 9.0, fish species vary in their optimum pHfor growth. Generally, those species that live naturally in cold or cool waters of low primaryproductivity (low algal photosynthesis) do better at pH 6.5-9. Trout are an example; excessivemortality can occur at pH above 9.0. The affected fish rapidly spin near the surface of the waterand attempt to leave the water. Whitening of the eyes and complete blindness, as well as frayingof the fins and gills with the frayed portions turning white, also occur. Death usually follows ina few hours.
Of prime importance to the White River system is the White River spring chinook, the soleremaining spring chinook stock in South Puget Sound. The South Sound Spring ChinookSalmon Technical Committee (WDF&W et al., 1996) reports that the White River springchinook are among the most depressed salmon stocks in the Pacific Northwest outside of theColumbia River Basin.
An adult chinook tracking study was conducted in 1996 by the Puyallup Indian Tribe (Ladley etal., 1996). This study found spawning areas in the upper range of the study area (upstream ofriver mile 21.0). Extended holding behavior was not observed anywhere in the bypass reachexcept at the Tacoma Public Utilities pipeline crossing (about 0.8 miles downstream of thediversion dam). This study did not address juvenile usage.
Spawning, holding, and rearing of spring chinook occur during the period high pH was measured(September and October). However, the exact effect of high pH on spring chinook is not known.
In addition to spring chinook, other important species of fish occur in the lower White River. A1997 study by the Muckleshoot Indian Tribe documented coho, steelhead, spring and fallchinook, chum, sockeye, and pink salmon in the mainstem and tributaries within the bypass reachof the White River. Whereas most spawning occurred in the tributaries, spawner surveys foundcoho, chum, and chinook spawning in the mainstem White River.
DRAFT – DO NOT CITE OR QUOTE Page 7
Historical Data Summary
Puyallup River TMDL
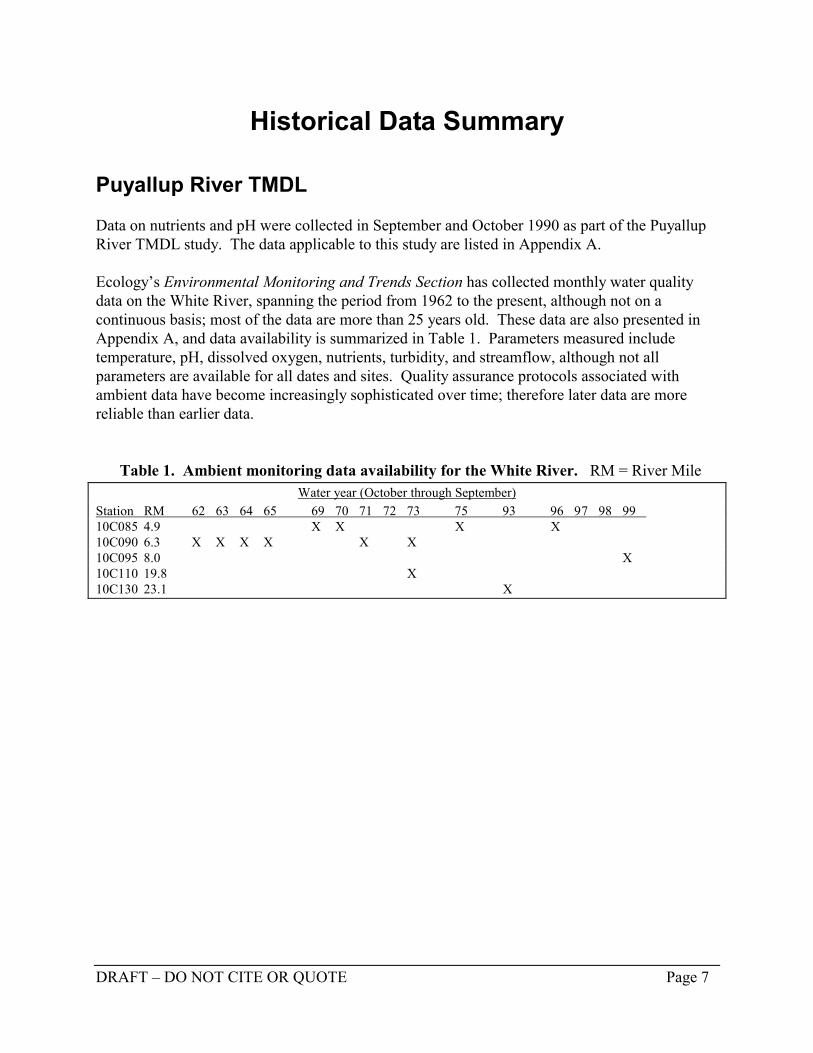
Data on nutrients and pH were collected in September and October 1990 as part of the PuyallupRiver TMDL study. The data applicable to this study are listed in Appendix A.
Ecology’s Environmental Monitoring and Trends Section has collected monthly water qualitydata on the White River, spanning the period from 1962 to the present, although not on acontinuous basis; most of the data are more than 25 years old. These data are also presented inAppendix A, and data availability is summarized in Table 1. Parameters measured includetemperature, pH, dissolved oxygen, nutrients, turbidity, and streamflow, although not allparameters are available for all dates and sites. Quality assurance protocols associated withambient data have become increasingly sophisticated over time; therefore later data are morereliable than earlier data.
Table 1. Ambient monitoring data availability for the White River. RM = River MileWater year (October through September)
Station RM 62 63 64 65 69 70 71 72 73 75 93 96 97 98 99 10C085 4.9 X X X X10C090 6.3 X X X X X X10C095 8.0 X10C110 19.8 X10C130 23.1 X
Page 8 DRAFT – DO NOT CITE OR QUOTE
Methods
Field Surveys
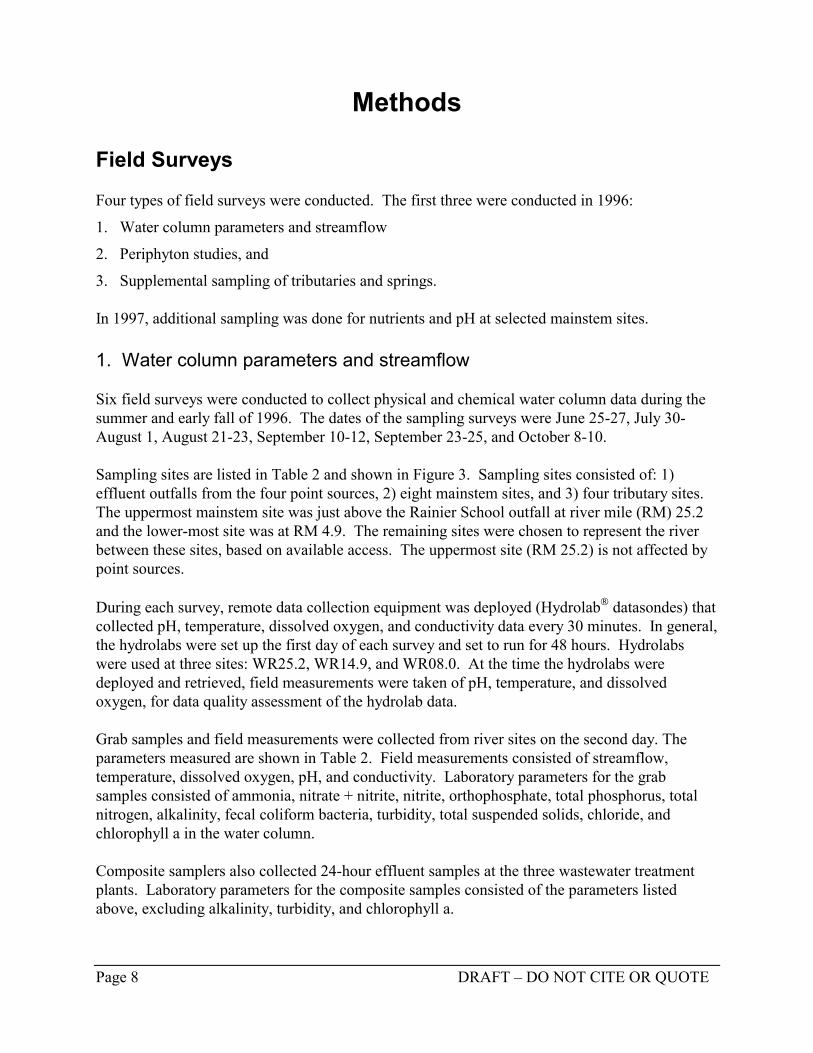
Four types of field surveys were conducted. The first three were conducted in 1996:
1. Water column parameters and streamflow
2. Periphyton studies, and
3. Supplemental sampling of tributaries and springs.
In 1997, additional sampling was done for nutrients and pH at selected mainstem sites.
1. Water column parameters and streamflow
Six field surveys were conducted to collect physical and chemical water column data during thesummer and early fall of 1996. The dates of the sampling surveys were June 25-27, July 30-August 1, August 21-23, September 10-12, September 23-25, and October 8-10.
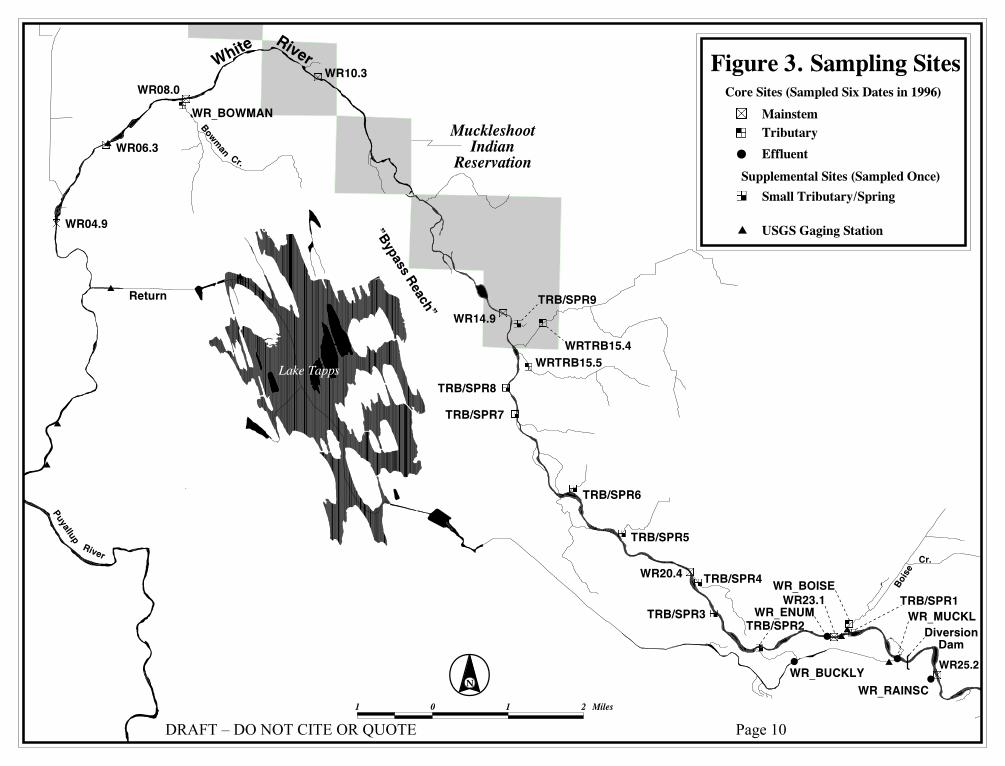
Sampling sites are listed in Table 2 and shown in Figure 3. Sampling sites consisted of: 1)effluent outfalls from the four point sources, 2) eight mainstem sites, and 3) four tributary sites.The uppermost mainstem site was just above the Rainier School outfall at river mile (RM) 25.2and the lower-most site was at RM 4.9. The remaining sites were chosen to represent the riverbetween these sites, based on available access. The uppermost site (RM 25.2) is not affected bypoint sources.
During each survey, remote data collection equipment was deployed (Hydrolab datasondes) thatcollected pH, temperature, dissolved oxygen, and conductivity data every 30 minutes. In general,the hydrolabs were set up the first day of each survey and set to run for 48 hours. Hydrolabswere used at three sites: WR25.2, WR14.9, and WR08.0. At the time the hydrolabs weredeployed and retrieved, field measurements were taken of pH, temperature, and dissolvedoxygen, for data quality assessment of the hydrolab data.
Grab samples and field measurements were collected from river sites on the second day. Theparameters measured are shown in Table 2. Field measurements consisted of streamflow,temperature, dissolved oxygen, pH, and conductivity. Laboratory parameters for the grabsamples consisted of ammonia, nitrate + nitrite, nitrite, orthophosphate, total phosphorus, totalnitrogen, alkalinity, fecal coliform bacteria, turbidity, total suspended solids, chloride, andchlorophyll a in the water column.
Composite samplers also collected 24-hour effluent samples at the three wastewater treatmentplants. Laboratory parameters for the composite samples consisted of the parameters listedabove, excluding alkalinity, turbidity, and chlorophyll a.
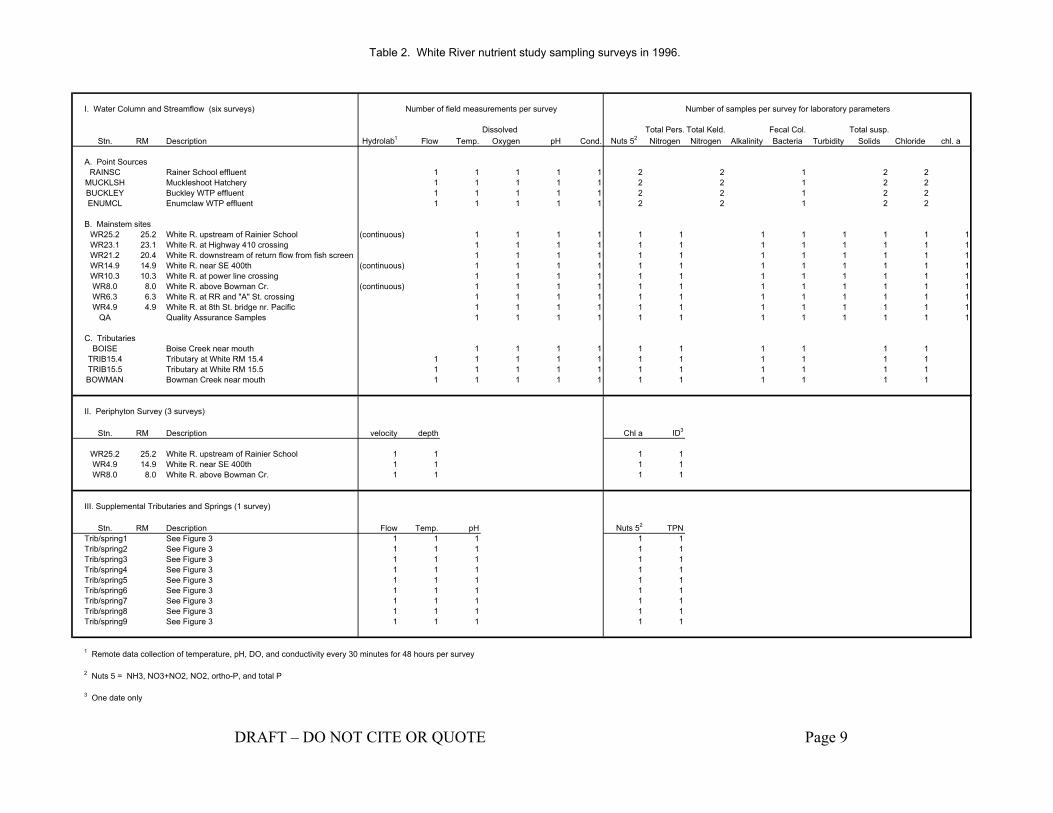
Table 2. White River nutrient study sampling surveys in 1996.
I. Water Column and Streamflow (six surveys) Number of field measurements per survey Number of samples per survey for laboratory parameters
Dissolved Total Pers. Total Keld. Fecal Col. Total susp.Stn. RM Description Hydrolab1 Flow Temp. Oxygen pH Cond. Nuts 52 Nitrogen Nitrogen Alkalinity Bacteria Turbidity Solids Chloride chl. a
A. Point SourcesRAINSC Rainer School effluent 1 1 1 1 1 2 2 1 2 2
MUCKLSH Muckleshoot Hatchery 1 1 1 1 1 2 2 1 2 2BUCKLEY Buckley WTP effluent 1 1 1 1 1 2 2 1 2 2ENUMCL Enumclaw WTP effluent 1 1 1 1 1 2 2 1 2 2
B. Mainstem sitesWR25.2 25.2 White R. upstream of Rainier School (continuous) 1 1 1 1 1 1 1 1 1 1 1 1WR23.1 23.1 White R. at Highway 410 crossing 1 1 1 1 1 1 1 1 1 1 1 1WR21.2 20.4 White R. downstream of return flow from fish screen 1 1 1 1 1 1 1 1 1 1 1 1WR14.9 14.9 White R. near SE 400th (continuous) 1 1 1 1 1 1 1 1 1 1 1 1WR10.3 10.3 White R. at power line crossing 1 1 1 1 1 1 1 1 1 1 1 1WR8.0 8.0 White R. above Bowman Cr. (continuous) 1 1 1 1 1 1 1 1 1 1 1 1WR6.3 6.3 White R. at RR and "A" St. crossing 1 1 1 1 1 1 1 1 1 1 1 1WR4.9 4.9 White R. at 8th St. bridge nr. Pacific 1 1 1 1 1 1 1 1 1 1 1 1
QA Quality Assurance Samples 1 1 1 1 1 1 1 1 1 1 1 1
C. TributariesBOISE Boise Creek near mouth 1 1 1 1 1 1 1 1 1 1
TRIB15.4 Tributary at White RM 15.4 1 1 1 1 1 1 1 1 1 1 1TRIB15.5 Tributary at White RM 15.5 1 1 1 1 1 1 1 1 1 1 1BOWMAN Bowman Creek near mouth 1 1 1 1 1 1 1 1 1 1 1
II. Periphyton Survey (3 surveys)
Stn. RM Description velocity depth Chl a ID3
WR25.2 25.2 White R. upstream of Rainier School 1 1 1 1WR4.9 14.9 White R. near SE 400th 1 1 1 1WR8.0 8.0 White R. above Bowman Cr. 1 1 1 1
III. Supplemental Tributaries and Springs (1 survey)
Stn. RM Description Flow Temp. pH Nuts 52 TPNTrib/spring1 See Figure 3 1 1 1 1 1Trib/spring2 See Figure 3 1 1 1 1 1Trib/spring3 See Figure 3 1 1 1 1 1Trib/spring4 See Figure 3 1 1 1 1 1Trib/spring5 See Figure 3 1 1 1 1 1Trib/spring6 See Figure 3 1 1 1 1 1Trib/spring7 See Figure 3 1 1 1 1 1Trib/spring8 See Figure 3 1 1 1 1 1Trib/spring9 See Figure 3 1 1 1 1 1
1 Remote data collection of temperature, pH, DO, and conductivity every 30 minutes for 48 hours per survey
2 Nuts 5 = NH3, NO3+NO2, NO2, ortho-P, and total P
3 One date only
DRAFT – DO NOT CITE OR QUOTE Page 9
$
$$
$
$$
$
$
#
#
##
WR_RAINSC
WR25.2
WR_MUCKLWR_ENUM
WR_BOISEWR23.1 TRB/SPR1
WR_BUCKLY
TRB/SPR2TRB/SPR3
TRB/SPR4WR20.4
TRB/SPR7
WRTRB15.5WRTRB15.4
WR14.9
WR10.3WR08.0
WR_BOWMAN
WR06.3
WR04.9
MuckleshootIndian
Reservation
"Bypass Reach"
Return
DiversionDam
White River
Bowman
Cr.
Puyallup
River
Boise
Lake Tapps
TRB/SPR9
TRB/SPR8
TRB/SPR6
TRB/SPR5
1 0 1 2 Miles
N
Figure 3. Sampling SitesCore Sites (Sampled Six Dates in 1996)
#
MainstemTributaryEffluent
Supplemental Sites (Sampled Once)Small Tributary/Spring
$ USGS Gaging Station
Cr.
DRAFT – DO NOT CITE OR QUOTE Page 10
DRAFT – DO NOT CITE OR QUOTE Page 11
All laboratory analyses were done by Manchester Environmental Laboratory. orthophosphatesamples were filtered in the field, and the chlorophyll a samples were filtered by the laboratory.No other samples were filtered. (Additional details on field equipment used and laboratorymethods are provided in the project plan, Erickson, 1996).
Total variation for field sampling and analytical variation was assessed by collecting replicatesamples of all parameters at one site during each survey. Quality control procedures by the labfollowed standard operating procedures described in MEL (1994). Field sampling andmeasurements followed quality control protocols described in the WAS protocols manual (WAS,1993). The pH and conductivity meters and Hydrolab datasondes were pre- and post-calibratedin accordance with the manufacturers’ instructions. The pH probe was calibrated with low-ionicstrength buffer which is closer to actual conditions than standard buffer solutions. Samples forlaboratory analysis were stored on ice and delivered to MEL within 24 hours of collection.
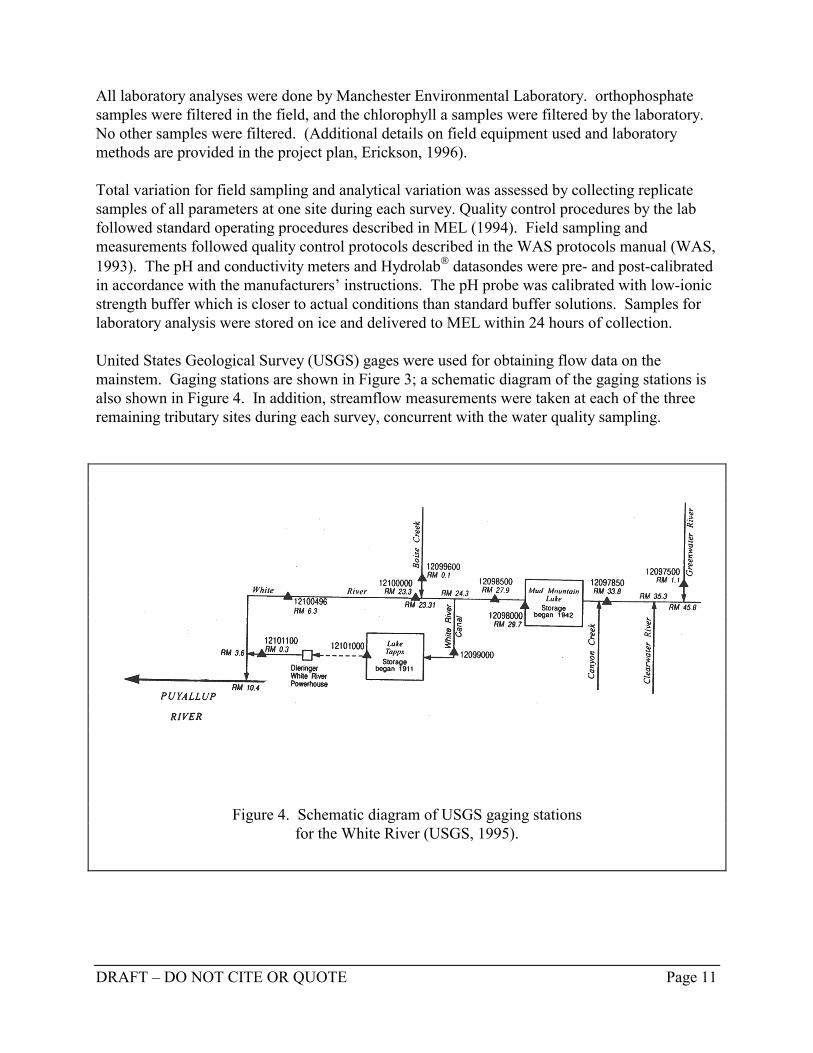
United States Geological Survey (USGS) gages were used for obtaining flow data on themainstem. Gaging stations are shown in Figure 3; a schematic diagram of the gaging stations isalso shown in Figure 4. In addition, streamflow measurements were taken at each of the threeremaining tributary sites during each survey, concurrent with the water quality sampling.
Figure 4. Schematic diagram of USGS gaging stationsfor the White River (USGS, 1995).
Page 12 DRAFT – DO NOT CITE OR QUOTE
2. Periphyton analyses
Periphyton studies were conducted during three dates (September 11, September 24, and October9) and at three sites each (RM 25.2, 14.9, and 8.0). The periphyton analyses consisted ofidentification, measurement of chlorophyll a, and measurement of average depth and watervelocity at the site. Algae samples were obtained by scraping a prescribed area from six rockstaken randomly from along the stream cross section at that site and composited into twocontainers (three rocks per container, which provided one sample and one replicate). On the firstdate, de-ionized water was added to each container to reach a total volume of 550 mL. Of this,50 mL of mixed solution was removed from each container and placed into a separate bottle foralgae identification. The samples for identification were preserved by adding Lugol’s solution.On subsequent dates, the bottles were filled to 500 mL and no algae ID was done. Theconversions to mg/m2 took into account the different quantities of dilution water.
3. Supplemental sampling of tributaries and springs
On the July 31 survey, in addition to the sampling described above, the river was floated in aninflatable boat between river miles 24 and 8 to visually inspect the river valley and to sampleadditional tributaries and springs that are not accessible by road. Nine additional sites weresampled. Field measurements and sample parameters consisted of temperature, pH, streamflow,nitrate+nitrite, ammonia, orthophosphate, and total phosphorus. The purpose of the float trip was toallow better quantification of nonpoint nutrient inputs. Site trib/spring2 is the Buckley effluentchannel. Site trib/spring3 is the fish passage return flow.
In 1997, additional nutrient and pH data were collected weekly from August 1 to November 14,1997, at four sites: river miles 25.2, 8.0, 6.3 and 4.9. pH was measured twice a day at each site,early in the morning and in mid-afternoon. Nutrient samples (ammonia, nitrate+nitrite, nitrite,orthophosphate, total phosphorus, and total nitrogen) were taken at river miles 25.2 and 8.0 in theafternoon.
Groundwater Study
A ground water study was undertaken to estimate groundwater nutrient loading to the WhiteRiver in the study area. John Tooley of the Department of Ecology led this effort; the results arepresented in Appendix B. The study concluded that nutrients in groundwater in the vicinity ofthe study area are likely being discharged laterally to White River tributary streams.
DRAFT – DO NOT CITE OR QUOTE Page 13
Results
Quality Assurance
A summary of the quality assurance review of the 1990, 1996, and 1997 sampling data ispresented in Appendix C. Some data were rejected for failing quality assurance criteria. Whenthe measured result was reported to be less than the detection limit, the value was assumed to beone-half of the detection limit. The Hydrolab pH data were found to be biased low by anaverage of 0.15 pH units; however, the data were not adjusted. The final data are tabulated inAppendix D.
pH
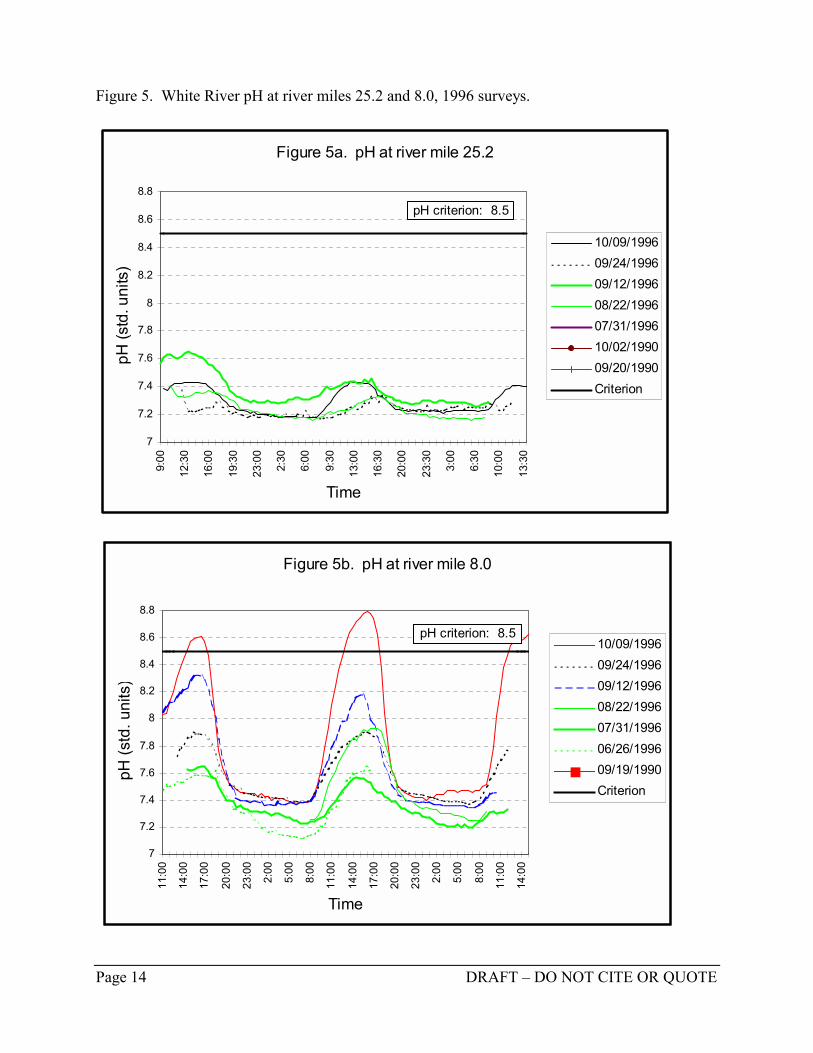
Figure 5 illustrates the pattern of pH found by the water quality surveys in 1996. Figure 5ashows pH at river mile 25.2, the uppermost site. Here pH varied only slightly over the course ofa day, and varied little over the season. The pH stayed fairly constant in the range of 7.2 to 7.5.
The pH pattern in the lower river is considerably different. Figure 5b illustrates pH at river mile8.0. Here there is considerably more variation over the course of a 24-hour day, showing theeffect of photosynthesis. In addition, there is more variation over the summer season, comparedto the upper river site. The night pH was fairly constant at about 7.4. The mid-afternoon pHranged from 7.6 in June and July to a high of 8.8 on October 9, 1996. This figure also illustratesthat the pH violated the state water quality standard of 8.5 on October 7-9, 1996.
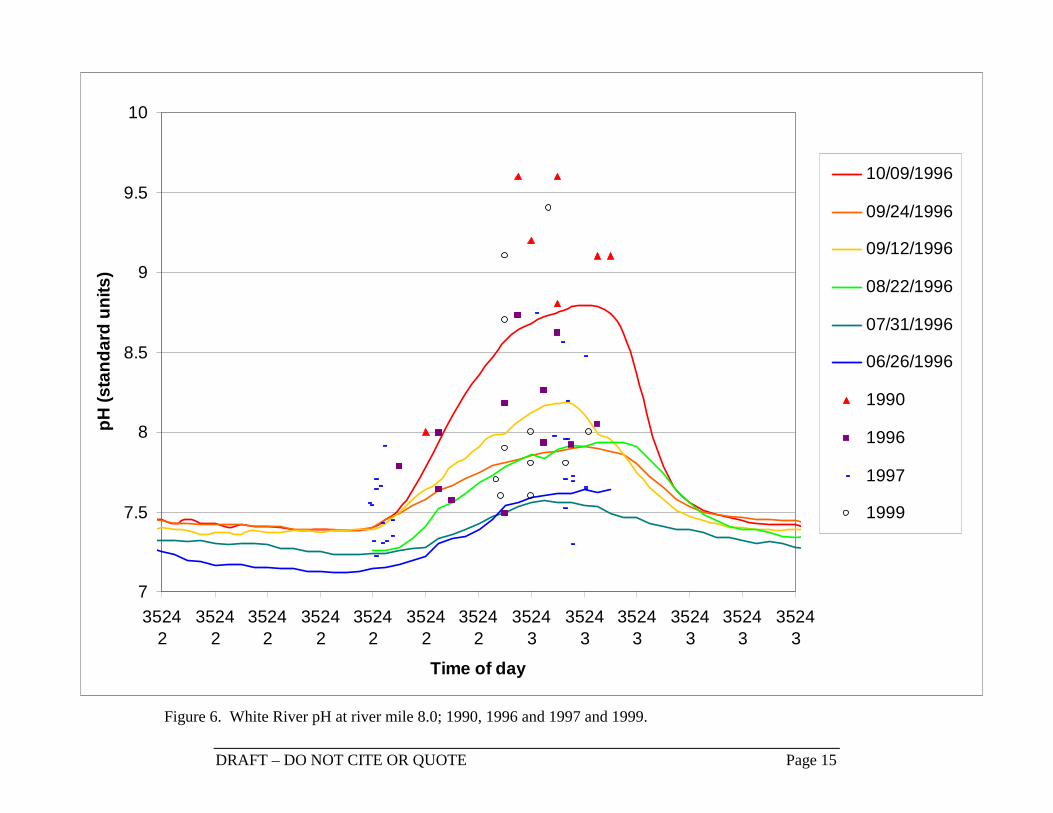
Figure 6 shows the Hydrolab data for river mile 8.0 overlain with all of the measured pH valuesfrom 1990, 1996, 1997, and 1999, plotted by time-of-day. The measured values are consistentwith the Hydrolab data, showing a range of possible values in the mid-afternoon and lowervalues in the early morning. The 1990 and 1999 pH measurements were quite high (maximum of9.6), and were significantly higher than the values measured in 1996 and 1997 (maximum of8.8). These higher values cannot be explained by higher nutrient concentrations, differences inturbidity nor streamflow levels. The White River appears to have significant year-to-yearvariation in pH values.
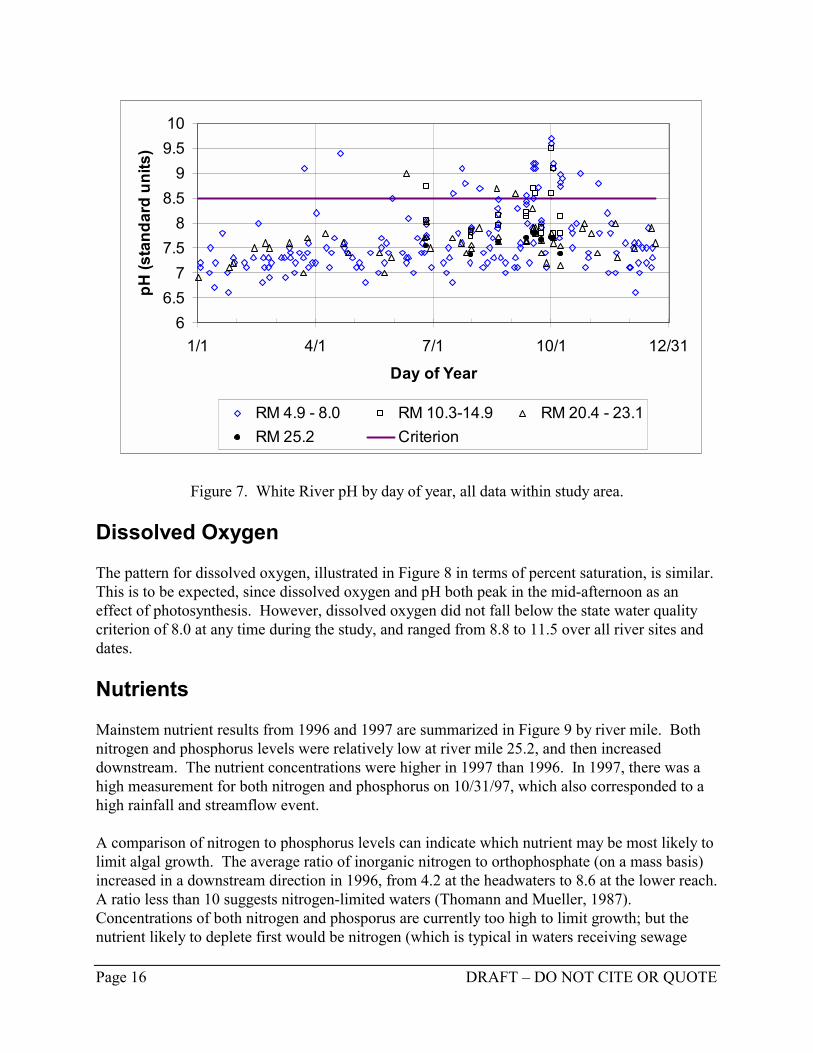
Figure 7 shows all of the historical pH data for the study area by day of year to show seasonalvariation. The ambient data were not collected at any particular time of the day, and therefore donot necessarily reflect the mid-afternoon maximum pH values for that day. Nevertheless, theambient record is helpful to show a seasonal pattern of potentially high pH values. The resultsshow that pH violations have been recorded as early as March 24 and as late as November 10.
Page 14 DRAFT – DO NOT CITE OR QUOTE
Figure 5. White River pH at river miles 25.2 and 8.0, 1996 surveys.
Figure 5a. pH at river mile 25.2
7
7.2
7.4
7.6
7.8
8
8.2
8.4
8.6
8.8
9:00
12:3
0
16:0
0
19:3
0
23:0
0
2:30
6:00
9:30
13:0
0
16:3
0
20:0
0
23:3
0
3:00
6:30
10:0
0
13:3
0
Time
pH (s
td. u
nits
)
10/09/199609/24/199609/12/199608/22/199607/31/199610/02/199009/20/1990Criterion
pH criterion: 8.5
Figure 5b. pH at river mile 8.0
7
7.2
7.4
7.6
7.8
8
8.2
8.4
8.6
8.8
11:0
0
14:0
0
17:0
0
20:0
0
23:0
0
2:00
5:00
8:00
11:0
0
14:0
0
17:0
0
20:0
0
23:0
0
2:00
5:00
8:00
11:0
0
14:0
0
Time
pH (s
td. u
nits
)
10/09/199609/24/199609/12/199608/22/199607/31/199606/26/199609/19/1990Criterion
pH criterion: 8.5
DRAFT – DO NOT CITE OR QUOTE Page 15
Figure 6. White River pH at river mile 8.0; 1990, 1996 and 1997 and 1999.
7
7.5
8
8.5
9
9.5
10
35242
35242
35242
35242
35242
35242
35242
35243
35243
35243
35243
35243
35243
Time of day
pH (s
tand
ard
units
)
10/09/1996
09/24/1996
09/12/1996
08/22/1996
07/31/1996
06/26/1996
1990
1996
1997
1999
Page 16 DRAFT – DO NOT CITE OR QUOTE
Figure 7. White River pH by day of year, all data within study area.
Dissolved Oxygen
The pattern for dissolved oxygen, illustrated in Figure 8 in terms of percent saturation, is similar.This is to be expected, since dissolved oxygen and pH both peak in the mid-afternoon as aneffect of photosynthesis. However, dissolved oxygen did not fall below the state water qualitycriterion of 8.0 at any time during the study, and ranged from 8.8 to 11.5 over all river sites anddates.
Nutrients
Mainstem nutrient results from 1996 and 1997 are summarized in Figure 9 by river mile. Bothnitrogen and phosphorus levels were relatively low at river mile 25.2, and then increaseddownstream. The nutrient concentrations were higher in 1997 than 1996. In 1997, there was ahigh measurement for both nitrogen and phosphorus on 10/31/97, which also corresponded to ahigh rainfall and streamflow event.
A comparison of nitrogen to phosphorus levels can indicate which nutrient may be most likely tolimit algal growth. The average ratio of inorganic nitrogen to orthophosphate (on a mass basis)increased in a downstream direction in 1996, from 4.2 at the headwaters to 8.6 at the lower reach.A ratio less than 10 suggests nitrogen-limited waters (Thomann and Mueller, 1987).Concentrations of both nitrogen and phosporus are currently too high to limit growth; but thenutrient likely to deplete first would be nitrogen (which is typical in waters receiving sewage
66.5
77.5
88.5
99.510
1/1 4/1 7/1 10/1 12/31
Day of Year
pH (s
tand
ard
units
)
RM 4.9 - 8.0 RM 10.3-14.9 RM 20.4 - 23.1RM 25.2 Criterion
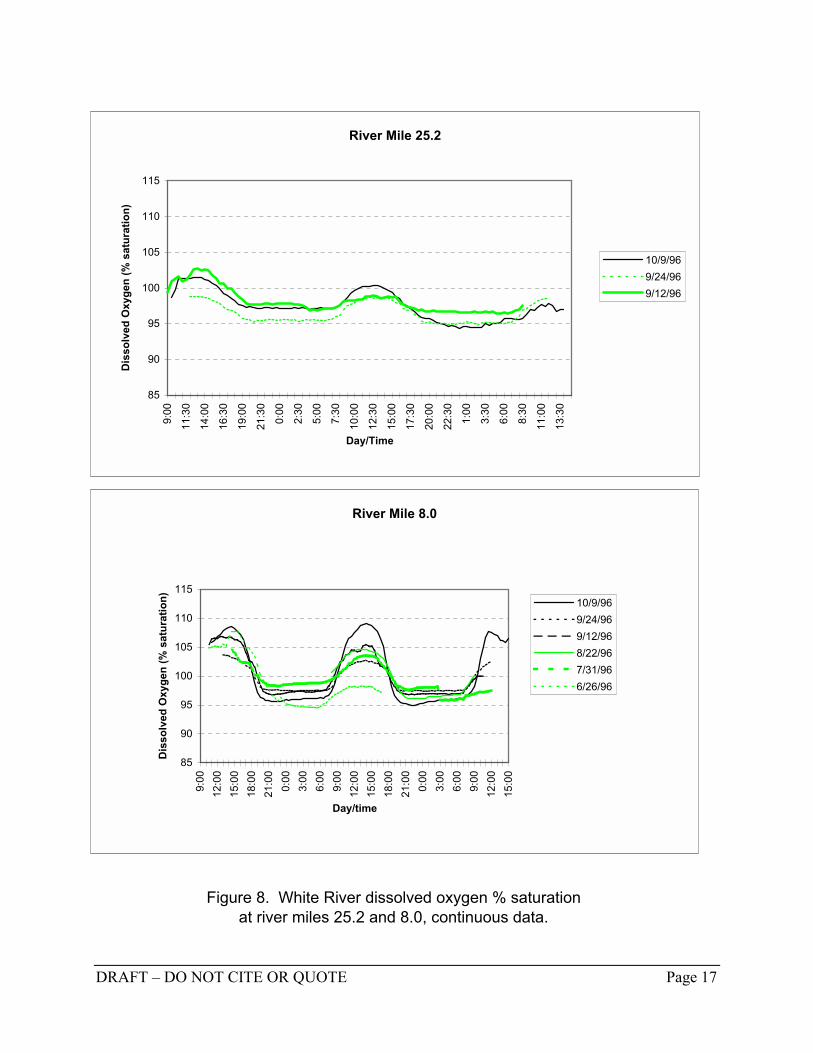
Figure 8. White River dissolved oxygen % saturation at river miles 25.2 and 8.0, continuous data.
River Mile 25.2
85
90
95
100
105
110
1159:
00
11:3
0
14:0
0
16:3
0
19:0
0
21:3
0
0:00
2:30
5:00
7:30
10:0
0
12:3
0
15:0
0
17:3
0
20:0
0
22:3
0
1:00
3:30
6:00
8:30
11:0
0
13:3
0
Day/Time
Dis
solv
ed O
xyge
n (%
sat
urat
ion)
10/9/969/24/969/12/96
River Mile 8.0
85
90
95
100
105
110
115
9:00
12:0
015
:00
18:0
021
:00
0:00
3:00
6:00
9:00
12:0
015
:00
18:0
021
:00
0:00
3:00
6:00
9:00
12:0
015
:00
Day/time
Dis
solv
ed O
xyge
n (%
sat
urat
ion) 10/9/96
9/24/969/12/968/22/967/31/966/26/96
DRAFT – DO NOT CITE OR QUOTE Page 17
Page 18 DRAFT – DO NOT CITE OR QUOTE
Figure 9. White River nutrient concentrations measured in 1996 and 1997, by river mile. Bars show mean, minimum, and maximum (except for outliers - circles) of data for each site.
10
100
1000
4 6 8 10 12 14 16 18 20 22 24 26River Mile
Inor
gani
c ni
troge
n co
ncen
tratio
n (u
g/L) 1996
1997
1
10
100
4 6 8 10 12 14 16 18 20 22 24 26River Mile
Orth
opho
spha
te c
once
ntra
tion
(ug/
L) 19961997
DRAFT – DO NOT CITE OR QUOTE Page 19
effluent). However, many factors go into determining what nutrient is most appropriate to targetfor reduction. Nitrogen is usually more naturally abundant and is very mobile in theenvironment. Also, nitrogen can be contributed to the river system from atmospheric sources. Inlow-nitrogen waters, nitrogen-fixing blue-green algae may become more predominant.Phosphorus is usually less abundant and more easily tied up in soil and sediments. Phosphorus ismore commonly targeted for nutrient reduction to control algal biomass for fresh water systems.
The relative contributions of nutrients to the lower White River are shown in Figure 10, based onaverage loads for the six 1996 surveys. The tributary/spring loads are based on one set ofsamples from 7/31/96; therefore they may not be directly comparable to the other loads, and havea higher level of uncertainty. This figure shows that the largest contributor of both nitrogen andphosphorus is the Enumclaw wastewater treatment plant. The second largest contribution ofnitrogen comes from sources upstream of the study area. Nonpoint sources of nitrogen(represented by tributaries) comprise about 31 percent of the total sources within the study area;Buckley and Rainier School wastewater treatment plants contribute only an additional 4 percent.For phosphorus, nonpoint sources in the study area are virtually absent. The Buckley wastewatertreatment plant contributes about 9 percent of the total orthophosphate inputs, and Rainier School2 percent.
Nutrient Profiles
To better understand the longitudinal pattern of nutrient concentrations, a mass balance modelwas used to simulate nutrient concentrations in the mainstem White River based on measuredinputs. The model was developed by Greg Pelletier as part of the Puyallup Total MaximumDaily Load study (Pelletier, 1994), and divides the study area into 0.2 mile segments. Thenutrient mass of each element is calculated based on the previous element concentration, pluspointload inputs, and minus nutrient uptake (set externally). The hydrodynamic elements werederived from the QUAL2E model described in Pelletier (1993). The purpose of the model was tosimulate stream nutrient concentrations longitudinally based on nutrient inputs, nutrient uptake,and streamflow levels. Model calibration details are presented in Appendix E.
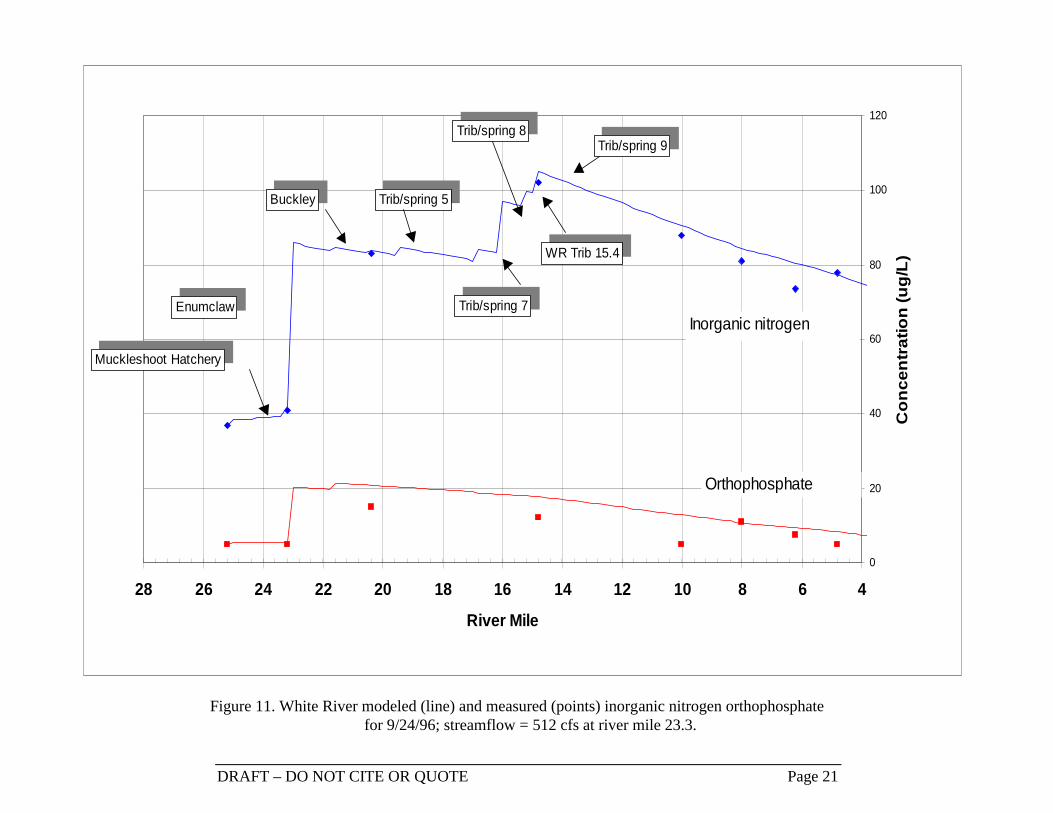
The result of modeling nitrogen and phosphorus for 9/24/96 is shown in Figure 11. The figureillustrates that between river miles 25 and 15, numerous sources contribute nitrogen to the river,the largest of which is the Enumclaw wastewater treatment plant. Other significant sources ofnitrogen between river miles 25 and 15 include trib/spring 8, trib/spring 9, and tributary 15.4, allof which represent non-point sources. For phosphorus, only two sources are significant:Enumclaw and, to a much lesser extent, Buckley wastewater treatment plants. In contrast to thenitrogen situation, there are no significant nonpoint sources of phosphorus between river mile 25and 15. Downstream of river mile 15, no additional sources of nutrients were observed. Nutrientconcentrations declined from this point downstream due to algal uptake.
Enumclaw WTP41%
WR-Trib 15.44%
Trib/spring 52%
Trib/spring 95%
Trib/spring 812%
Headwaters24%
Rainier School WTP2%
Other2%
Buckley WTP2%
Boise Creek3%
Trib/spring 73%
Inorganic Nitrogen
Enumclaw WTP65%
Headwaters22%
Buckley WTP9%
Rainier School WTP2%
Other2%
(Upstream of study area)
Ortho-phosphate
(Upstream of study area)
Figure 10. Relative contributions of nutrients to the lower White River. Average loads from 6 surveys in 1996 (tribs/springs one date only).
Page 20 DRAFT – DO NOT CITE OR QUOTE
DRAFT – DO NOT CITE OR QUOTE Page 21
Figure 11. White River modeled (line) and measured (points) inorganic nitrogen orthophosphatefor 9/24/96; streamflow = 512 cfs at river mile 23.3.
0
20
40
60
80
100
120
46810121416182022242628
River Mile
Con
cent
ratio
n (u
g/L)
Enumclaw
Muckleshoot Hatchery
Buckley Trib/spring 5
Trib/spring 7
Trib/spring 8
WR Trib 15.4
Trib/spring 9
Inorganic nitrogen
Orthophosphate
Page 22 DRAFT – DO NOT CITE OR QUOTE
Historical Nutrient Concentrations
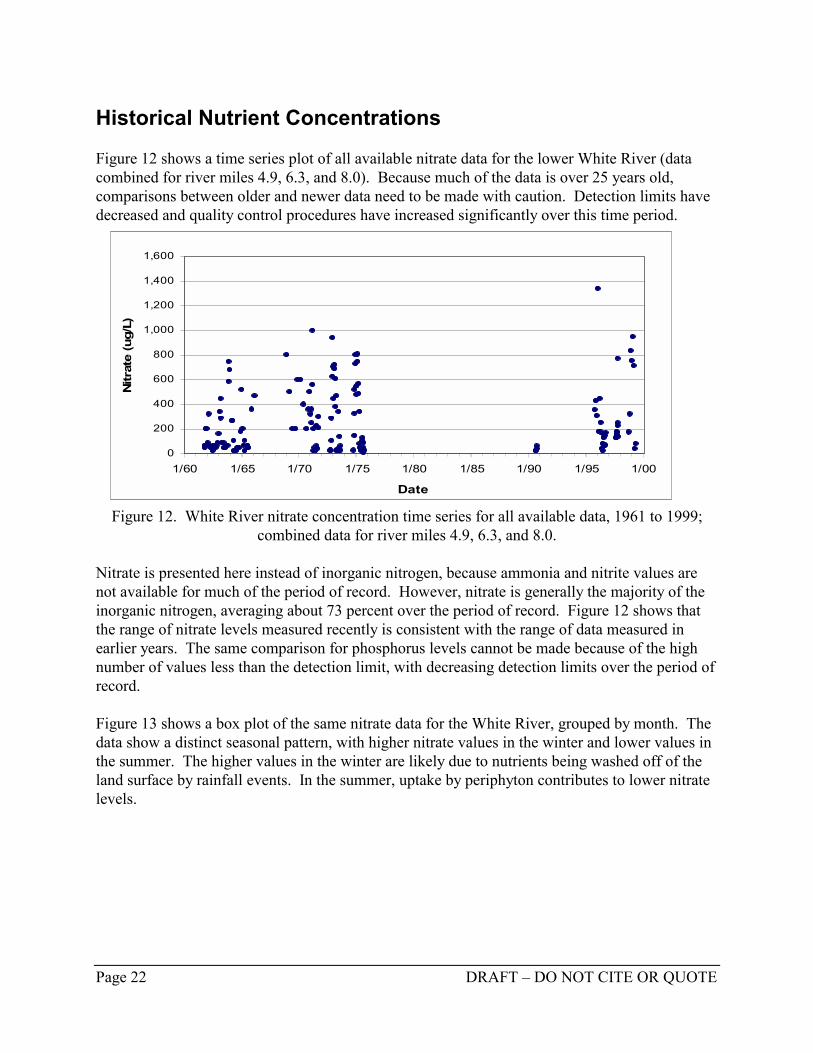
Figure 12 shows a time series plot of all available nitrate data for the lower White River (datacombined for river miles 4.9, 6.3, and 8.0). Because much of the data is over 25 years old,comparisons between older and newer data need to be made with caution. Detection limits havedecreased and quality control procedures have increased significantly over this time period.
Figure 12. White River nitrate concentration time series for all available data, 1961 to 1999;combined data for river miles 4.9, 6.3, and 8.0.
Nitrate is presented here instead of inorganic nitrogen, because ammonia and nitrite values arenot available for much of the period of record. However, nitrate is generally the majority of theinorganic nitrogen, averaging about 73 percent over the period of record. Figure 12 shows thatthe range of nitrate levels measured recently is consistent with the range of data measured inearlier years. The same comparison for phosphorus levels cannot be made because of the highnumber of values less than the detection limit, with decreasing detection limits over the period ofrecord.
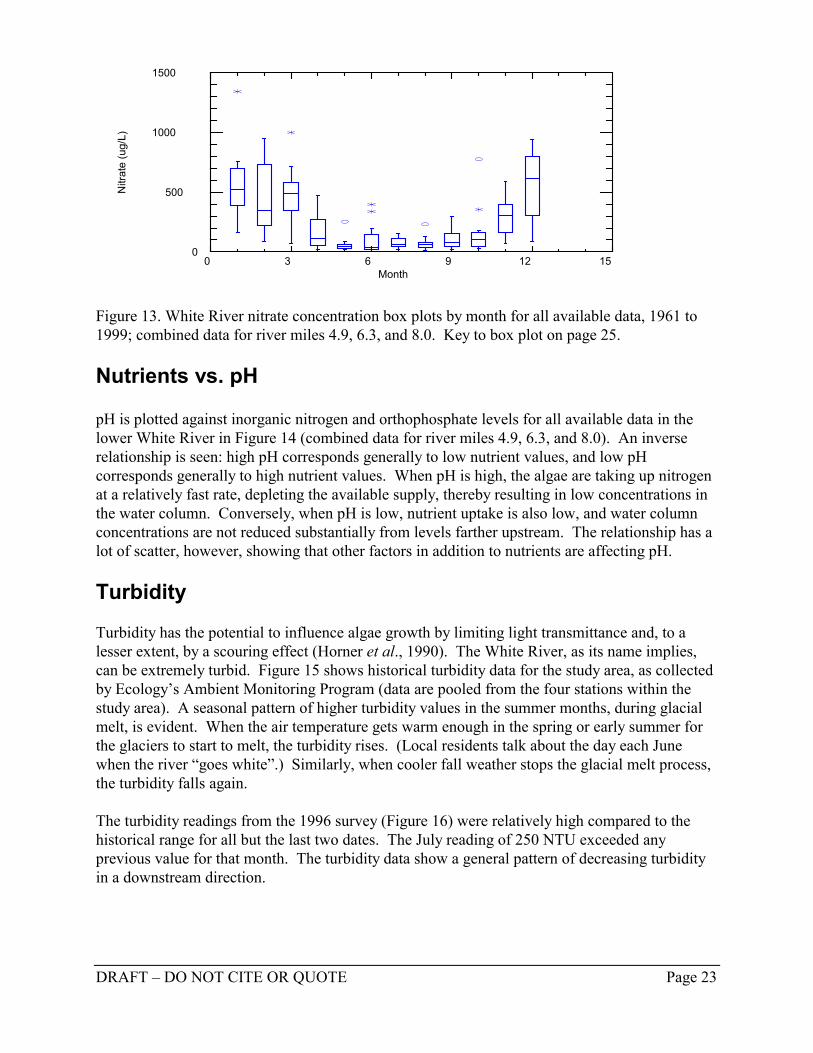
Figure 13 shows a box plot of the same nitrate data for the White River, grouped by month. Thedata show a distinct seasonal pattern, with higher nitrate values in the winter and lower values inthe summer. The higher values in the winter are likely due to nutrients being washed off of theland surface by rainfall events. In the summer, uptake by periphyton contributes to lower nitratelevels.
0
200
400
600
800
1,000
1,200
1,400
1,600
1/60 1/65 1/70 1/75 1/80 1/85 1/90 1/95 1/00
Date
Nitr
ate
(ug/
L)
DRAFT – DO NOT CITE OR QUOTE Page 23
Figure 13. White River nitrate concentration box plots by month for all available data, 1961 to1999; combined data for river miles 4.9, 6.3, and 8.0. Key to box plot on page 25.
Nutrients vs. pH
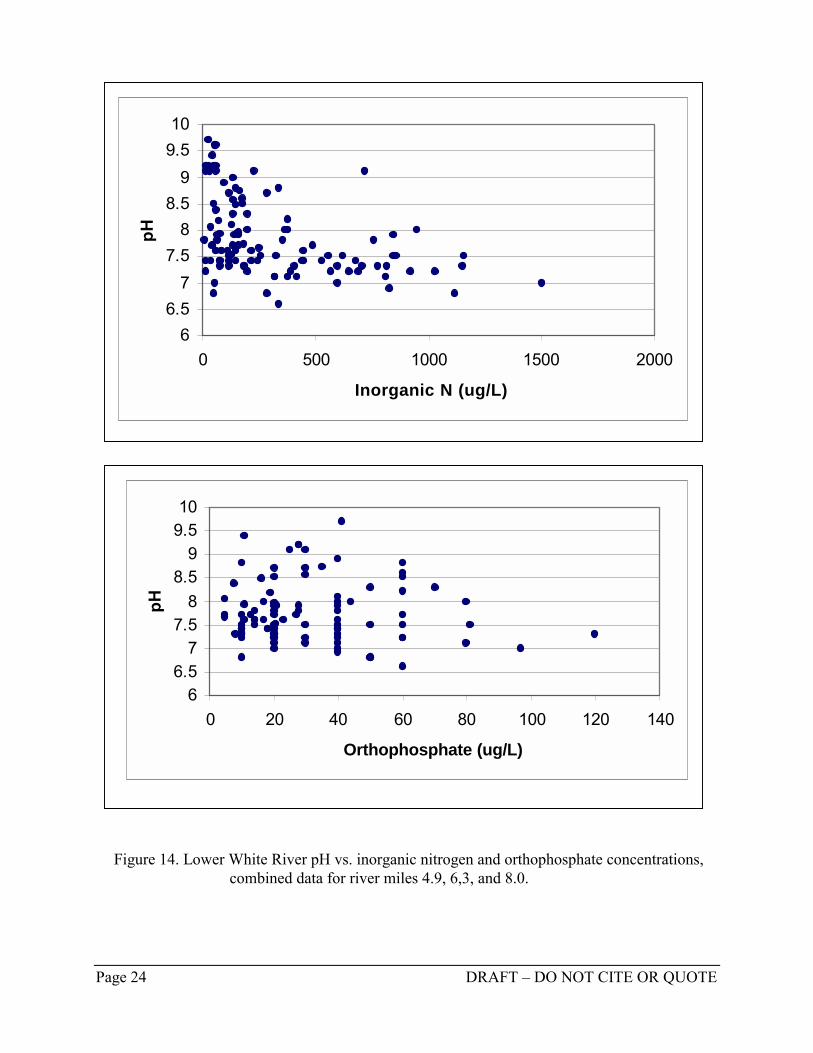
pH is plotted against inorganic nitrogen and orthophosphate levels for all available data in thelower White River in Figure 14 (combined data for river miles 4.9, 6.3, and 8.0). An inverserelationship is seen: high pH corresponds generally to low nutrient values, and low pHcorresponds generally to high nutrient values. When pH is high, the algae are taking up nitrogenat a relatively fast rate, depleting the available supply, thereby resulting in low concentrations inthe water column. Conversely, when pH is low, nutrient uptake is also low, and water columnconcentrations are not reduced substantially from levels farther upstream. The relationship has alot of scatter, however, showing that other factors in addition to nutrients are affecting pH.
Turbidity
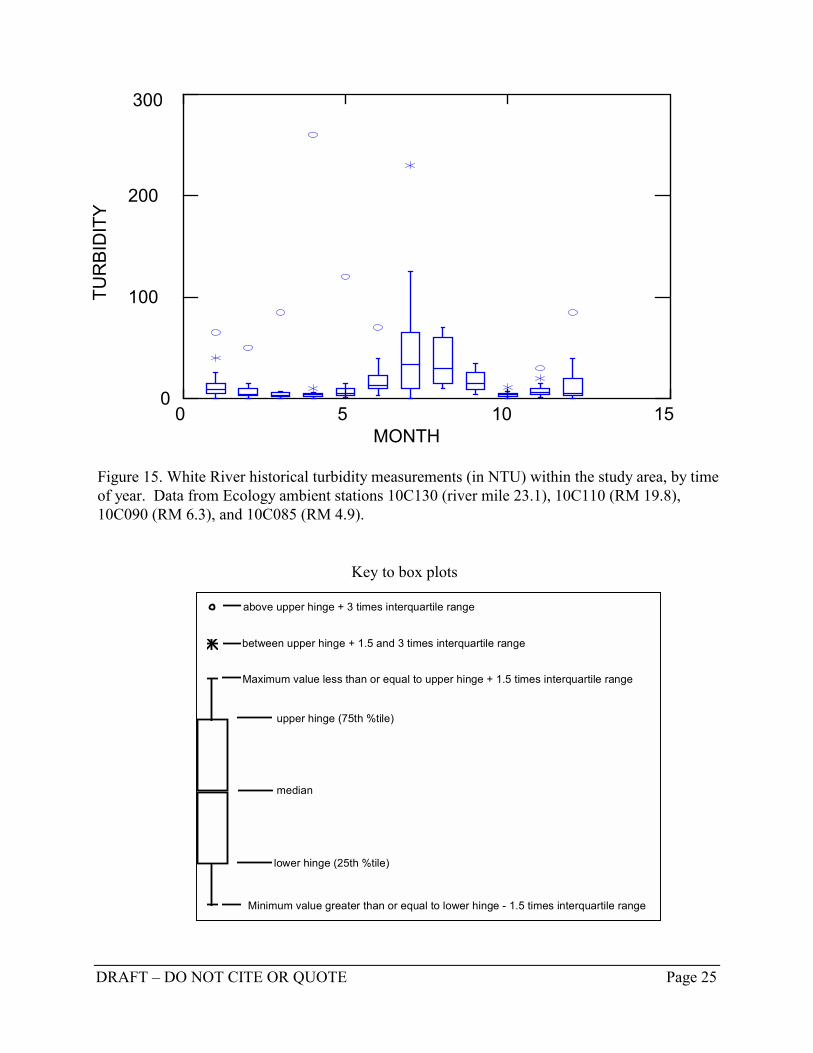
Turbidity has the potential to influence algae growth by limiting light transmittance and, to alesser extent, by a scouring effect (Horner et al., 1990). The White River, as its name implies,can be extremely turbid. Figure 15 shows historical turbidity data for the study area, as collectedby Ecology’s Ambient Monitoring Program (data are pooled from the four stations within thestudy area). A seasonal pattern of higher turbidity values in the summer months, during glacialmelt, is evident. When the air temperature gets warm enough in the spring or early summer forthe glaciers to start to melt, the turbidity rises. (Local residents talk about the day each Junewhen the river “goes white”.) Similarly, when cooler fall weather stops the glacial melt process,the turbidity falls again.
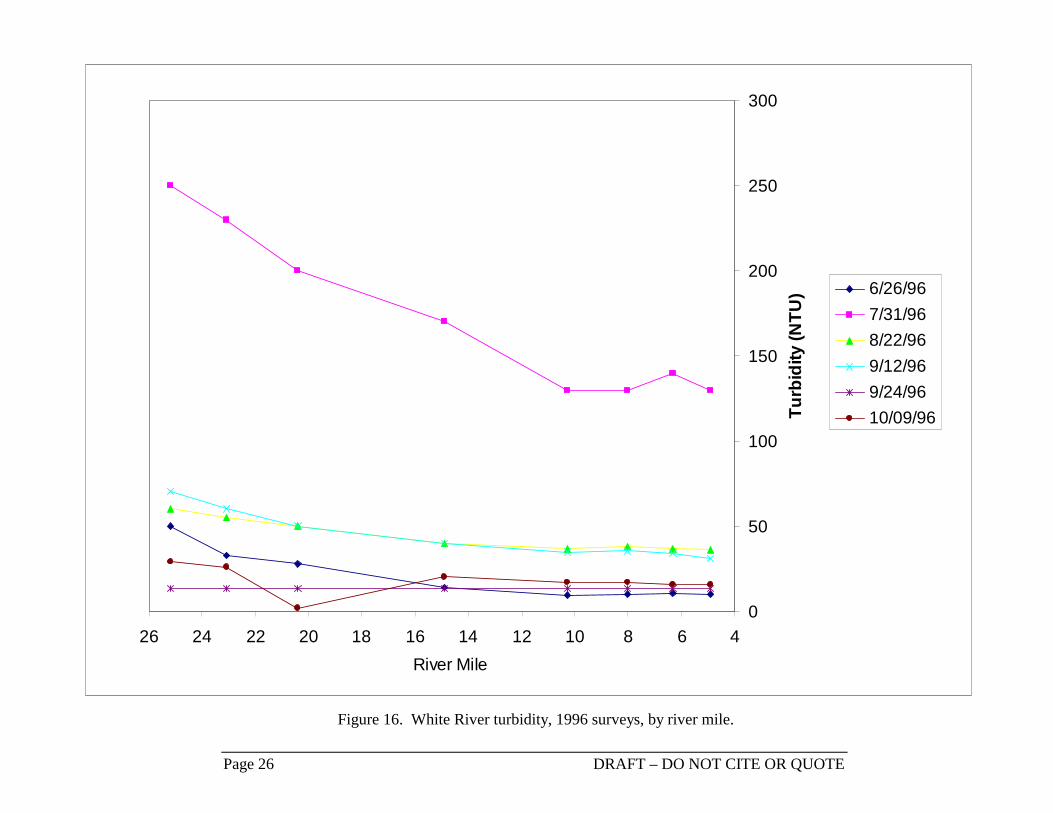
The turbidity readings from the 1996 survey (Figure 16) were relatively high compared to thehistorical range for all but the last two dates. The July reading of 250 NTU exceeded anyprevious value for that month. The turbidity data show a general pattern of decreasing turbidityin a downstream direction.
0 3 6 9 12 15Month
0
500
1000
1500
Nitr
ate
(ug/
L )
Page 24 DRAFT – DO NOT CITE OR QUOTE
Figure 14. Lower White River pH vs. inorganic nitrogen and orthophosphate concentrations, combined data for river miles 4.9, 6,3, and 8.0.
66.5
77.5
88.5
99.510
0 500 1000 1500 2000
Inorganic N (ug/L)
pH
66.5
77.5
88.5
99.510
0 20 40 60 80 100 120 140
Orthophosphate (ug/L)
pH
DRAFT – DO NOT CITE OR QUOTE Page 25
Figure 15. White River historical turbidity measurements (in NTU) within the study area, by timeof year. Data from Ecology ambient stations 10C130 (river mile 23.1), 10C110 (RM 19.8),10C090 (RM 6.3), and 10C085 (RM 4.9).
0 5 10 15MONTH
0
100
200
300TU
RBI
DIT
Y
between upper hinge + 1.5 and 3 times interquartile range
Maximum value less than or equal to upper hinge + 1.5 times interquartile range
upper hinge (75th %tile)
lower hinge (25th %tile)
median
Minimum value greater than or equal to lower hinge - 1.5 times interquartile range
above upper hinge + 3 times interquartile range
Key to box plots
Page 26 DRAFT – DO NOT CITE OR QUOTE
Figure 16. White River turbidity, 1996 surveys, by river mile.
0
50
100
150
200
250
300
468101214161820222426River Mile
Turb
idity
(NTU
) 6/26/967/31/968/22/969/12/969/24/9610/09/96
DRAFT – DO NOT CITE OR QUOTE Page 27
The low turbidity values in October coincided with high pH readings. Conversely, in July, whenthe turbidity was very high, the pH levels were not elevated, despite warm and sunny conditions.Efforts to measure actual light transmittance were not successful with the available equipment;however, the light extinction coefficient can be estimated from turbidity (U.S. EPA, 1985). Thecritical depth, at which 1 percent of the surface radiation remains, (Thomann and Mueller, 1987)can be compared to the actual depth. Based on these relationships and an average depth, thecritical turbidity is about 30 NTU. For turbidities greater than this, insufficient light would beexpected to reach the benthic layer. This critical turbidity was exceeded during the July andAugust sampling dates at river mile 8.0.
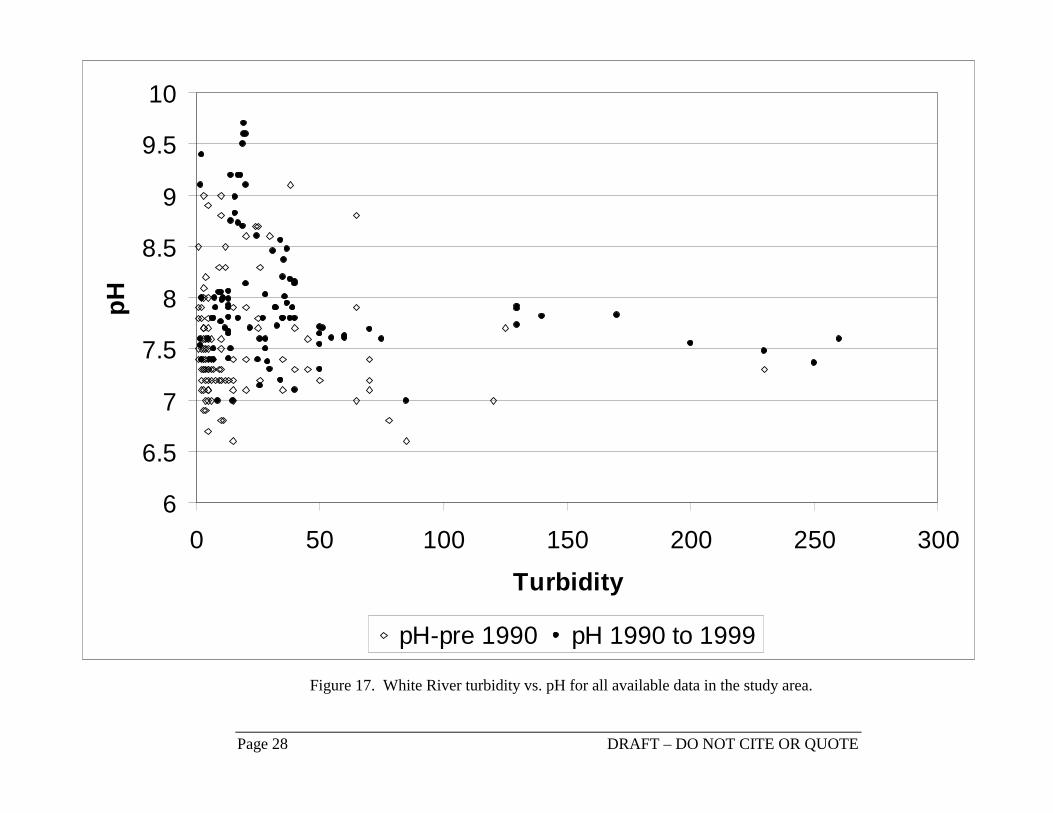
A plot of turbidity vs. pH for all available data in the study area is shown in Figure 17, with olderdata (which may be less reliable) differentiated from more recent data. Based on this figure, itappears that elevated pH levels usually occur when turbidity is less than about 50 NTUs. Mostoccurrences of pH above the criterion of 8.5 corresponded to turbidities less than about 30 NTUs.
Alkalinity
Alkalinity affects how abruptly the pH will rise in response to carbon uptake from algae. If thealkalinity is high, the response will be muted. If the alkalinity is low, the pH rise will bemagnified. Alkalinity values were consistently fairly low, ranging from 17 to 32 mg/L, with anaverage of 25 mg/L. The low alkalinity of these waters makes the lower White River moresusceptible to pH increases as a result of carbon uptake from photosynthesis. Therefore it is alsomore sensitive to nutrient inputs.
Chlorophyll a and Periphyton
Chlorophyll a values in the water column were low, averaging 1.2 ug/L, indicating thatphytoplankton was not a significant contributor to productivity in the study area.
Chlorophyll a measured in periphyton was used as the indicator of periphyton biomass (Figure18). The figure illustrates that periphyton biomass increased downstream, from very low levelsat river mile 25.2, increasing values at river mile 14.9, and the highest values at river mile 8.
Periphyton biomass was highest in October. These biomass figures are consistent with the pHresults that show higher pH downstream, and higher pH in October. It should be noted that theselevels of biomass are not considered high for streams in general. Periphytic algae is oftenconsidered to be at “nuisance” levels at 150 mg/m2 (Welch et al., 1989), primarily due tofilamentous green algae that break loose and clog water supply intake pipes and degrade theaesthetic environment. The levels in the White River are much lower than this threshold;however, they are high enough to cause elevated pH values in these low-alkalinity waters.
The periphyton community is comprised almost entirely of diatoms, with similar dominant taxaat all sites sampled (river miles 25.2, 14.9, and 8.0). Periphyton identification results arepresented in Appendix F. No nuisance filamentous green algae were observed.
Page 28 DRAFT – DO NOT CITE OR QUOTE
Figure 17. White River turbidity vs. pH for all available data in the study area.
6
6.5
7
7.5
8
8.5
9
9.5
10
0 50 100 150 200 250 300Turbidity
pH
pH-pre 1990 pH 1990 to 1999
DRAFT – DO NOT CITE OR QUOTE Page 29
0
20
40
60
80
510152025
River Mile
Chl
. a (m
g/m
2 )
9/12
9/24
10/9
25.2 14.9 8.0
Figure 18. White River periphyton biomass (chl. a) at three sites, 1996. Graph showsmean of duplicates and one standard deviation.
Temperature
Temperature affects the rate of algae growth, with higher temperatures resulting in higher growthrates. However, the highest pH reading during the 1996 survey occurred on October 9, when thewater temperature averaged 13.0° C, significantly lower that the average of 18.5° on July 31,when pH was low (and turbidity high). Therefore temperature does not appear to be thedominant factor in the pH problem. Temperature is an independent problem, however, adverselyaffecting aquatic life when it is too high. The temperature of the White River exceeded the statewater quality standard of 18°C during the June, July, and August surveys in 1996. The lowerWhite River is now proposed to be listed on the 1998 303(d) list for temperature.
Fecal Coliform Bacteria
The White River is listed on the 1996 and the proposed 1998 303(d) list for fecal coliformbacteria. This study was not designed to comprehensively address bacteria, because doing sowould involve a different type of sampling plan, including stormwater sampling and samplingduring the wet season. However, bacteria data were collected to add to the existing set ofinformation.
The bacteria results, summarized in Table 3, show that for the mainstem and tributary sites,Boise Creek stands out as having significantly higher bacteria levels. This site did not meet thestate criterion for Class A waters (geometric mean not to exceed 100 organisms/100 mL, and lessthan 10 percent of the samples not to exceed 200 organisms/100 mL). Of the mainstem sites,only WR23.1 violated the criterion. This site is just downstream of Boise Creek, and henceinfluenced by it.
Results for the point sources show that the Rainier School wastewater treatment plant was noteffectively disinfecting their effluent, nor meeting their monthly and weekly permit limit of 200and 400 organisms/100 mL, respectively. Results for the Enumclaw wastewater treatment plant
Page 30 DRAFT – DO NOT CITE OR QUOTE
ranged between 200 and 400 organisms/100 mL, with the exception of 9/24/96, when levels were2,200 org./100 mL. The Buckley wastewater treatment plant and the White River Hatcherylevels were consistently low.
Table 3. White River fecal coliform bacteria results.Site Geometric
Mean(#/100 mL)
Percent over100 org./200 mL
Water qualitycriterionviolated?
Mainstem sitesWR04.9 9 0%WR06.3 11 0%WR08.0 10 0%WR10.3 11 0%WR14.9 14 0%WR20.4 23 0%WR23.1 41 17% YesWR25.2 11 0%TributariesBoise Creek 284 83% YesBowman Creek 23 0%WRTRB15.4 17 0%WRTRB15.5 4 0%Point SourcesBuckley WTP 4Enumclaw WTP 560Rainier School WTP 11954White River Hatchery 2
DRAFT – DO NOT CITE OR QUOTE Page 31
Assimilative Capacity Analysis
As discussed in the introduction, this assimilative capacity study is the first step in developing atotal maximum daily load (TMDL) for nutrients in the lower White River. The assimilativecapacity defines the amount of nutrients that can be added to the White River without causingwater quality standards to be violated.
The relationship between nutrients and pH is complex. The pH of the White River is determinedby many factors, including the natural buffering capacity of the system (i.e. alkalinity levels) andthe amount of periphyton biomass and its photosynthetic activity. On most days, natural factorslimit photosynthesis so that pH does not exceed water quality standards. Those factors include:insufficient light reaching the river bottom (either due to clouds or turbidity), unsuitabletemperatures for periphyton growth, or insufficient nutrients. In addition, grazing of theperiphyton biomass or scouring by suspended sediment may keep periphyton biomass levelsdown to levels that do not cause significant pH problems. However, on some days, many or allof these factors are favorable for periphyton growth and its associated uptake of carbon, and theresult is pH levels in exceedence of the standards.
Of all of the factors affecting pH, most of them are natural characteristics of the system andcannot be controlled. It is not possible to significantly change the alkalinity, incident sunlight,turbidity, water velocity, grazing by invertebrates, substratum type, or suspended sediment levels.However, if nutrient levels are kept below those needed for extensive mats of periphyton todevelop, photosynthetic uptake of carbon will not cause pH to exceed standards. Thisassimilative capacity study determines the acceptable level of nutrients that will keep periphytonlevels low enough that pH standards are not violated.
Ideally, a mathematical model would be available to make this prediction. The ideal model forthis study would predict periphyton biomass over the course of the growing season and thentranslate that to changes in pH. Models have been developed to predict maximum biomass levelsbased on: nutrient concentrations, light, temperature, stream water velocity, grazing byinvertebrates, substratum type, and suspended sediment (Welch et al., 1989). Actual biomasslevels are usually lower than the predicted maximum due to less than optimum conditions in atleast some of the factors influencing growth (as well as losses). Unfortunately, scientificunderstanding has not progressed sufficiently to be able to accurately model periphyton biomassand nutrient/carbon uptake rates for a situation such as the White River.
In the absence of an ideal model, the assimilative capacity was evaluated in two ways:1. Comparison of upstream and downstream nutrient values and corresponding pH2. Comparison to literature values.
Page 32 DRAFT – DO NOT CITE OR QUOTE
1. Comparison of Upstream and Downstream Nutrient andpH Values
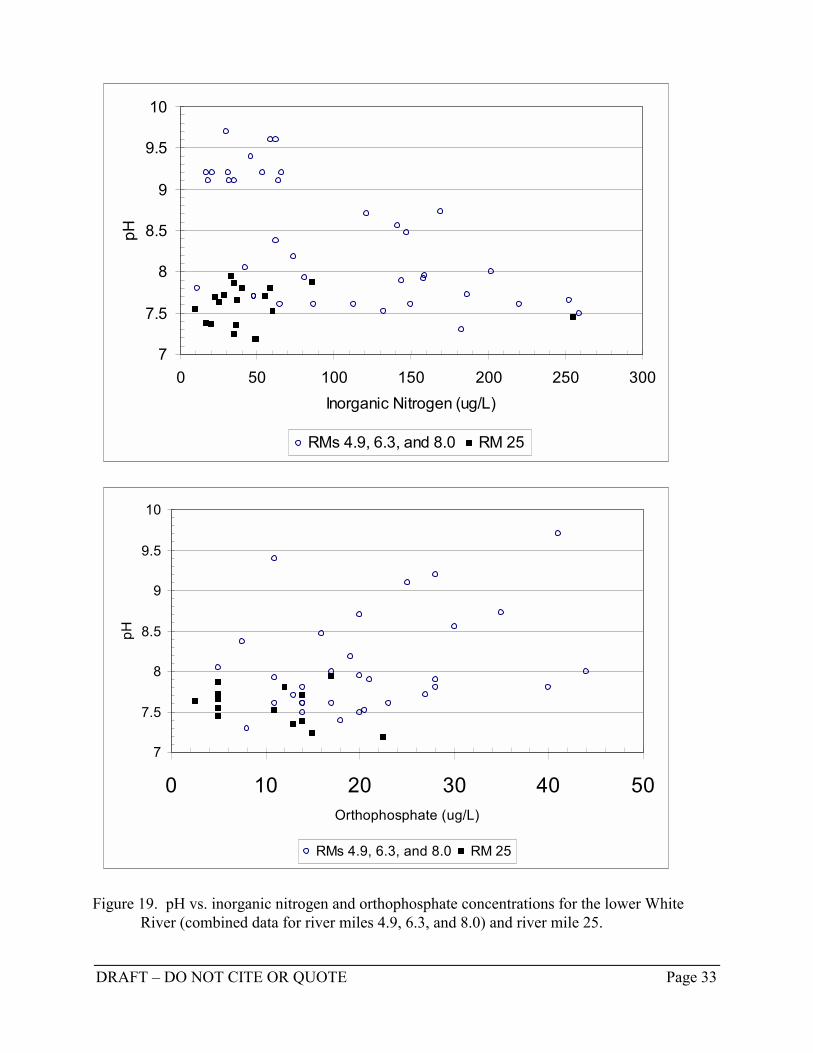
Figure 14, presented earlier, shows nutrient vs. pH data for the lower White River (combineddata for river miles 4.9, 6.3, and 8.0). Figure 19 shows the same information for data from 1990to 1999, focusing on the lower range of nutrient concentrations, and also includes thecorresponding data for river mile 25. The tabular data corresponding to Figure 19 is presented inAppendix G, Table G-1. The figure shows that high pH can occur at relatively low nutrientconcentrations, with many measurements of pH above 9.0 with inorganic nitrogen concentrationsbetween 17 and 66 ug/L. Corresponding phosphorus data were not available for most of thosesame measurements, but Figure 19 shows that the orthophosphate concentration was 11 ug/Lwhen the pH was 9.4.
These high pH readings on days with low nutrient concentrations show that there is not evidenceof nutrient limitation at inorganic nitrogen levels as low as 17 ug/L and orthophosphate levels of11 ug/L. This implies that nutrient concentrations would need to be lower than these levelsbefore the lack of nutrients would be limiting periphyton growth. However, it should be notedthat these high pH/low nutrient values are not proof that nutrient levels need to be lower thanthese thresholds before periphyton growth is limited. pH is representative of short-term carbonuptake and is a function of the periphyton biomass present at that time. It is possible that ifnutrient concentrations were consistently low throughout the growing season, periphytonbiomass would not build up sufficiently to cause pH exceedences. However, data are notavailable to test that scenario. Also, instantaneous photosynthetic rates are not always reflectiveof the corresponding instantaneous nutrient concentrations. Periphyton have been shown to beable to use previously-stored nutrients. Nevertheless, Figure 19 shows that with the existingnutrient regime in the lower White River, there is no evidence of nutrient limitation at inorganicnitrogen concentrations as low as 17 ug/L and orthophosphate concentrations as low as 11 ug/L.
Figure 19 also shows that upstream nutrient levels at river mile 25, the upstream point of thestudy area, are often above these indicated levels, with inorganic nitrogen often above 17 ug/Land orthophosphate often above 11 ug/L. Therefore, water coming into the study area is alreadyat nutrient levels that have the potential to cause pH excursions in the lower portion of the river.
The implication of this figure is that there is little or no assimilative capacity for additionalnutrients above the levels found at river mile 25.
2. Comparison to Literature Values
The literature shows that high biomass levels of periphyton, even mats of filamentous greens, candevelop at orthophosphate concentrations as low as 10 ug/L (Welch et al., 1989; Welch et al.,1992) and substantial mats of diatoms at 1 ug/L (Bothwell, 1985. The literature shows thatnutrient levels need to be very low before the growth of diatom-dominated periphyton mats islimited. These literature values also imply that there is very little, if any, assimilative capacityfor additional nutrients above the levels found at river mile 25.
DRAFT – DO NOT CITE OR QUOTE Page 33
Figure 19. pH vs. inorganic nitrogen and orthophosphate concentrations for the lower WhiteRiver (combined data for river miles 4.9, 6.3, and 8.0) and river mile 25.
7
7.5
8
8.5
9
9.5
10
0 50 100 150 200 250 300Inorganic Nitrogen (ug/L)
pH
RMs 4.9, 6.3, and 8.0 RM 25
7
7.5
8
8.5
9
9.5
10
0 10 20 30 40 50Orthophosphate (ug/L)
pH
RMs 4.9, 6.3, and 8.0 RM 25
Page 34 DRAFT – DO NOT CITE OR QUOTE
The above analyses indicate a very limited assimilative capacity in the lower White River fornutrient inputs downstream of river mile 25. However, there is a high degree of uncertainty indetermining the assimilative capacity because 1) all available data for the lower White River arefor conditions where nutrients do not appear to be limiting, and 2) scientifically-proven modelsare not available to predict pH levels at lower nutrient levels. Therefore it is difficult toextrapolate to nutrient-limiting conditions.
Sensitivity to Streamflow Levels
As discussed in the introduction, most of the study area is located within the bypass reach of thePuget Sound Energy White River hydroelectric project. The future of the hydroelectric project,and associated minimum instream flows, is currently being debated. Higher streamflows in thebypass reach provide additional dilution of nutrient inputs from the wastewater treatment plants,tributaries, and other sources.
Unfortunately, the available evidence does not indicate that higher streamflows would besufficient to keep pH from exceeding water quality standards. Figure 19 shows that nutrientconcentrations at river mile 25, upstream of the diversion, are often about the same as those atriver mile 8 where pH exceedences occur. In September 1990, when no streamflow diversionwas occurring due to flume maintenance, pH was still above 9. It is possible that higherstreamflows throughout the growing season would provide enough dilution that periphytonbiomass would be reduced and therefore pH exceedences also reduced. Higher streamflows mayalso increase scour of periphyton. Higher streamflows would also result in deeper water, whichwould reduce light reaching the stream bottom, especially during turbid periods, perhapsimpeding periphyton growth. However, these effects are speculative in nature and there are nodata to substantiate them. The available data and literature values imply that, even with nodiversion of streamflow, pH exceedences would still be likely to occur.
DRAFT – DO NOT CITE OR QUOTE Page 35
Conclusions
The lower White River experiences elevated pH, above the criterion of 8.5, at existing nutrientconcentrations. pH excursions have been recorded as early in the spring as March 24 and as lateas November 10. This sensitivity to nutrients is influenced by low alkalinity, which causes amore dramatic response of pH to carbon removal than in higher alkalinity waters.
For the purposes of limiting nutrients in the lower White River, either nitrogen or phosphorus canbe targeted. As discussed earlier, the ratio of nitrogen to phosphorus levels indicates that nitrogenis likely to be depleted first. However, it is much more difficult to make nitrogen the limitingnutrient for reducing periphyton growth than it is for phosphorus. Nitrogen is usually morenaturally abundant and is very mobile in the environment. Also, nitrogen can be contributed tothe river system from atmospheric sources. In low-nitrogen waters, nitrogen-fixing blue-greenalgae may become more predominant. Phosphorus is usually less abundant and more easily tiedup in soil and sediments. Phosphorus is the nutrient that should be targeted for nutrient reductionto address pH exceedences in the lower White River.
The largest contributor of pollutant loading for phosphorus is the Enumclaw wastewatertreatment plant (65 percent). The Buckley wastewater treatment plant also contributes asignificant amount of phosphorus (9 percent). Upstream sources contribute 22 percent ofphosphorus. These upstream sources are a combination of natural and nonpoint sources.
The assimilative capacity for the White River downstream of river mile 25 is very low. Theavailable data and scientific tools do not allow a precise loading capacity to be determined withcertainty.
Page 36 DRAFT – DO NOT CITE OR QUOTE
Recommendations
Phosphorus levels in the lower White River need to be reduced to the point that pH is no longerexceeding water quality standards. Available data and literature values indicate that verysubstantial reductions are necessary. The final TMDL for the lower White River, in order to beapproved by the U.S. Environmental Protection Agency (EPA), must be protective of the statewater quality standard for pH. The Clean Water Act states that technical uncertainty must becompensated with a higher margin of safety. One way to be compliant with the Clean Water Actwould be to set the assimilative capacity for phosphorus inputs from human-related sources tozero, and allow no pollutant loadings from point and nonpoint sources in the study area.
Another option is to approach the necessary phosphorus reductions incrementally. For example,start by implementing substantial phosphorus reductions, and monitor resulting pH. If pHcontinued to exceed standards, additional reductions would be needed. This could be consideredan example of using adaptive management in reaching the water quality standard. As a startingpoint, phosphorus loads should be reduced at least 50 percent from their current levels.
There are a variety of ways that phosphorus could be reduced incrementally in the Lower WhiteRiver. The major stakeholders in the watershed should participate in developing and assessingalternative phosphorus reduction strategies.
The Department of Ecology will be working with the cities of Enumclaw and Buckley, RainierSchool, the Muckleshoot and Puyallup Tribes, EPA, and other stakeholders to identify alternativeadaptive management strategies for reducing phosphorus inputs by at least 50% to the lowerWhite River. Alternatives will be evaluated in terms of feasibility, cost, and benefits. Theanalysis of alternatives will also need to take into account the uncertainty associated with theassimilative capacity estimate. For example, alternatives will be evaluated in terms of the riskassociated with over or underestimating the assimilative capacity in terms of sunk costs,environmental harm, etc. The preferred alternative will be selected from the range of alternativesconsidered, and include specific wasteload allocations for the existing point sources and loadallocations for the nonpoint sources in the study area. The allocations would be included in thefinal TMDL for the lower White River.
DRAFT – DO NOT CITE OR QUOTE Page 37
References
Bothwell, M., 1989. Phosphorus-Limited Growth Dynamics Of Lotic Periphytic DiatomCommunities: Areal Biomass And Cellular Growth Rate Responses. Can. J. Fish Aquat.Sci. 46: 1293-1301.
Emmett, K., 1995. Needs Assessment for the South Puget Sound Water Quality ManagementArea. Washington Department of Ecology, Olympia, WA. Publication number WQ-95-64.
Erickson, K., 1996. Assessment of pH Response to Nutrient Loading in the White River, FinalQuality Assurance Project Plan. Washington Department of Ecology, Olympia, WA.
European Inland Fisheries Advisory Commission, 1969. Water Quality Criteria for EuropeanFreshwater Fish - Extreme pH Values and Inland Fisheries. Prepared by EIFACWorking Party on Water Quality Criteria for European Freshwater Fish. Water Research,3:593.
Fisheries, 1975. A Catalog of Washington Streams and Salmon Utilization, Volume 1, PugetSound Region. Washington Department of Fisheries, Olympia, WA.
Hall, C. and R. Moll, 1975. Methods of Assessing Aquatic Primary Productivity. In PrimaryProductivity of the Biosphere, edited by Helmut Lieth and Robert Whittaker. Pringer-Verlag New York Inc., New York, NY.
Horner, R., E. Welch, M. Seeley, and J. Jacoby, 1990. Responses of Periphyton to Changes inCurrent Velocity, Suspended Sediments and Phosphorus Concentration. FreshwaterBiology, 24:215-232.
Ladley, R., B. Smith, and M. MacDonald, 1996. White River Spring Chinook MigratoryBehavior Investigation. Puyallup Tribe Fisheries Division, Puyallup, WA.
MEL, 1994. Manchester Environmental Laboratory, Lab Users Manual. WashingtonDepartment of Ecology, Environmental Investigations and Laboratory Services,Manchester Environmental Laboratory, Port Orchard, WA.
Pelletier, G., 1993. Puyallup River Total Maximum Daily Load for Biochemical OxygenDemand, Ammonia, and Residual Chlorine. Washington Department of Ecology,Olympia, WA.
Pelletier, G., 1994. Addendum to the 1993 Puyallup River TMDL Report. Memo from GregPelletier to Bill Backous, dated 7/22/94. Washington Department of Ecology, Olympia,WA.
Page 38 DRAFT – DO NOT CITE OR QUOTE
Piper, R., I. McElwain, L. Orme, J. McCraren, L. Fowler, and J. Leonard, 1982. Fish HatcheryManagement. U.S. Department of the Interior, Fish and Wildlife Service, Washington,DC.
Stumm, W. and J. Morgan, 1981. Aquatic Chemistry; An Introduction Emphasizing ChemicalEquilibria in Natural Waters. John Wiley & Sons, Inc., New York, NY.
Thomann, R. and J. Mueller, 1987. Principles of Surface Water Quality Modeling and Control.Harper Collins Publishers, New York, NY.
U.S. EPA, 1985. Water Quality Assessment: A Screening Procedure for Toxic andConventional Pollutants, Part II, EPA/600/6-85/002b. United States EnvironmentalProtection Agency, Office of Research and Development, Athens, Georgia.
U.S. EPA, 1986. Quality Criteria for Water, 1986. U.S. Environmental Protection Agency,EPA-440/5-86-001. United States Environmental Protection Agency, Division of Water,Washington, DC.
USGS, 1995. Water Resources Data, Washington, Water Year 1994. U.S. Geological SurveyWater-Data Report WA-94-1. U.S. Department of the Interior, U.S. Geological Survey,Tacoma, WA.
WAS, 1993. Field Sampling and Measurement Protocols for the Watershed AssessmentsSection. Washington Department of Ecology, Olympia, WA.
WDF&W, Puyallup Indian Tribe, and Muckleshoot Indian Tribe, 1996. Recovery Plan for WhiteRiver Spring Chinook Salmon. Washington Department of Fish and Wildlife, Olympia,WA.
Welch, E., R. Horner, and C. Patmont, 1989. Prediction of Nuisance Periphytic Biomass: AManagement Approach. Wat. Res. Vol. 23, pp. 401-405.
Welch, E., J. Quinn, and C. Hickey, 1992. Periphyton Biomass Related to Point-Source NutrientEnrichment in Seven New Zealand Streams. Wat. Res. Vol. 26, No. 5, pp. 669-675.

DRAFT – DO NOT CITE OR QUOTE
Appendices

DRAFT – DO NOT CITE OR QUOTE
Appendix A
Historical Data
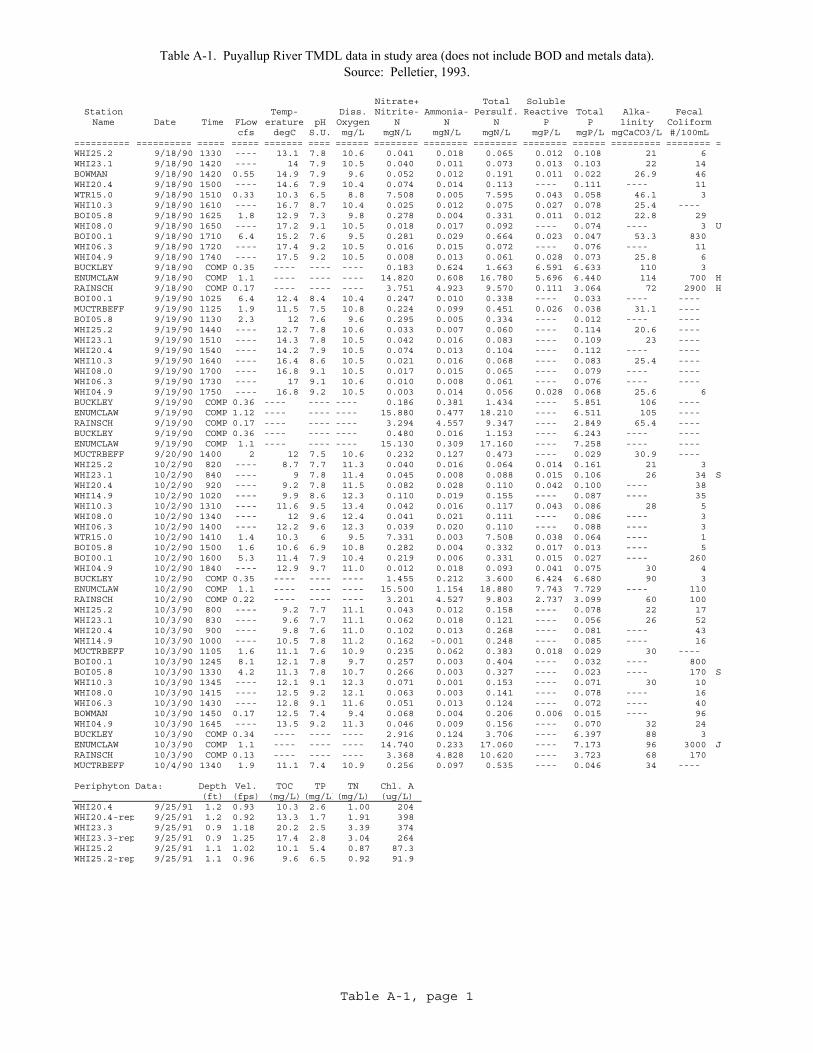
Table A-1. Puyallup River TMDL data in study area (does not include BOD and metals data). Source: Pelletier, 1993.
Nitrate+ Total SolubleStation Temp- Diss. Nitrite- Ammonia- Persulf. Reactive Total Alka- FecalName Date Time FLow erature pH Oxygen N N N P P linity Coliform
cfs degC S.U. mg/L mgN/L mgN/L mgN/L mgP/L mgP/L mgCaCO3/L #/100mL========== ========== ===== ===== ======= ==== ====== ======== ======== ======== ======== ====== ========= ======== =WHI25.2 9/18/90 1330 ---- 13.1 7.8 10.6 0.041 0.018 0.065 0.012 0.108 21 6WHI23.1 9/18/90 1420 ---- 14 7.9 10.5 0.040 0.011 0.073 0.013 0.103 22 14BOWMAN 9/18/90 1420 0.55 14.9 7.9 9.6 0.052 0.012 0.191 0.011 0.022 26.9 46WHI20.4 9/18/90 1500 ---- 14.6 7.9 10.4 0.074 0.014 0.113 ---- 0.111 ---- 11WTR15.0 9/18/90 1510 0.33 10.3 6.5 8.8 7.508 0.005 7.595 0.043 0.058 46.1 3WHI10.3 9/18/90 1610 ---- 16.7 8.7 10.4 0.025 0.012 0.075 0.027 0.078 25.4 ----BOI05.8 9/18/90 1625 1.8 12.9 7.3 9.8 0.278 0.004 0.331 0.011 0.012 22.8 29WHI08.0 9/18/90 1650 ---- 17.2 9.1 10.5 0.018 0.017 0.092 ---- 0.074 ---- 3 UBOI00.1 9/18/90 1710 6.4 15.2 7.6 9.5 0.281 0.029 0.664 0.023 0.047 53.3 830WHI06.3 9/18/90 1720 ---- 17.4 9.2 10.5 0.016 0.015 0.072 ---- 0.076 ---- 11WHI04.9 9/18/90 1740 ---- 17.5 9.2 10.5 0.008 0.013 0.061 0.028 0.073 25.8 6BUCKLEY 9/18/90 COMP 0.35 ---- ---- ---- 0.183 0.624 1.663 6.591 6.633 110 3ENUMCLAW 9/18/90 COMP 1.1 ---- ---- ---- 14.820 0.608 16.780 5.696 6.440 114 700 HRAINSCH 9/18/90 COMP 0.17 ---- ---- ---- 3.751 4.923 9.570 0.111 3.064 72 2900 HBOI00.1 9/19/90 1025 6.4 12.4 8.4 10.4 0.247 0.010 0.338 ---- 0.033 ---- ----MUCTRBEFF 9/19/90 1125 1.9 11.5 7.5 10.8 0.224 0.099 0.451 0.026 0.038 31.1 ----BOI05.8 9/19/90 1130 2.3 12 7.6 9.6 0.295 0.005 0.334 ---- 0.012 ---- ----WHI25.2 9/19/90 1440 ---- 12.7 7.8 10.6 0.033 0.007 0.060 ---- 0.114 20.6 ----WHI23.1 9/19/90 1510 ---- 14.3 7.8 10.5 0.042 0.016 0.083 ---- 0.109 23 ----WHI20.4 9/19/90 1540 ---- 14.2 7.9 10.5 0.074 0.013 0.104 ---- 0.112 ---- ----WHI10.3 9/19/90 1640 ---- 16.4 8.6 10.5 0.021 0.016 0.068 ---- 0.083 25.4 ----WHI08.0 9/19/90 1700 ---- 16.8 9.1 10.5 0.017 0.015 0.065 ---- 0.079 ---- ----WHI06.3 9/19/90 1730 ---- 17 9.1 10.6 0.010 0.008 0.061 ---- 0.076 ---- ----WHI04.9 9/19/90 1750 ---- 16.8 9.2 10.5 0.003 0.014 0.056 0.028 0.068 25.6 6BUCKLEY 9/19/90 COMP 0.36 ---- ---- ---- 0.186 0.381 1.434 ---- 5.851 106 ----ENUMCLAW 9/19/90 COMP 1.12 ---- ---- ---- 15.880 0.477 18.210 ---- 6.511 105 ----RAINSCH 9/19/90 COMP 0.17 ---- ---- ---- 3.294 4.557 9.347 ---- 2.849 65.4 ----BUCKLEY 9/19/90 COMP 0.36 ---- ---- ---- 0.480 0.016 1.153 ---- 6.243 ---- ----ENUMCLAW 9/19/90 COMP 1.1 ---- ---- ---- 15.130 0.309 17.160 ---- 7.258 ---- ----MUCTRBEFF 9/20/90 1400 2 12 7.5 10.6 0.232 0.127 0.473 ---- 0.029 30.9 ----WHI25.2 10/2/90 820 ---- 8.7 7.7 11.3 0.040 0.016 0.064 0.014 0.161 21 3WHI23.1 10/2/90 840 ---- 9 7.8 11.4 0.045 0.008 0.088 0.015 0.106 26 34 SWHI20.4 10/2/90 920 ---- 9.2 7.8 11.5 0.082 0.028 0.110 0.042 0.100 ---- 38WHI14.9 10/2/90 1020 ---- 9.9 8.6 12.3 0.110 0.019 0.155 ---- 0.087 ---- 35WHI10.3 10/2/90 1310 ---- 11.6 9.5 13.4 0.042 0.016 0.117 0.043 0.086 28 5WHI08.0 10/2/90 1340 ---- 12 9.6 12.4 0.041 0.021 0.111 ---- 0.086 ---- 3WHI06.3 10/2/90 1400 ---- 12.2 9.6 12.3 0.039 0.020 0.110 ---- 0.088 ---- 3WTR15.0 10/2/90 1410 1.4 10.3 6 9.5 7.331 0.003 7.508 0.038 0.064 ---- 1BOI05.8 10/2/90 1500 1.6 10.6 6.9 10.8 0.282 0.004 0.332 0.017 0.013 ---- 5BOI00.1 10/2/90 1600 5.3 11.4 7.9 10.4 0.219 0.006 0.331 0.015 0.027 ---- 260WHI04.9 10/2/90 1840 ---- 12.9 9.7 11.0 0.012 0.018 0.093 0.041 0.075 30 4BUCKLEY 10/2/90 COMP 0.35 ---- ---- ---- 1.455 0.212 3.600 6.424 6.680 90 3ENUMCLAW 10/2/90 COMP 1.1 ---- ---- ---- 15.500 1.154 18.880 7.743 7.729 ---- 110RAINSCH 10/2/90 COMP 0.22 ---- ---- ---- 3.201 4.527 9.803 2.737 3.099 60 100WHI25.2 10/3/90 800 ---- 9.2 7.7 11.1 0.043 0.012 0.158 ---- 0.078 22 17WHI23.1 10/3/90 830 ---- 9.6 7.7 11.1 0.062 0.018 0.121 ---- 0.056 26 52WHI20.4 10/3/90 900 ---- 9.8 7.6 11.0 0.102 0.013 0.268 ---- 0.081 ---- 43WHI14.9 10/3/90 1000 ---- 10.5 7.8 11.2 0.162 -0.001 0.248 ---- 0.085 ---- 16MUCTRBEFF 10/3/90 1105 1.6 11.1 7.6 10.9 0.235 0.062 0.383 0.018 0.029 30 ----BOI00.1 10/3/90 1245 8.1 12.1 7.8 9.7 0.257 0.003 0.404 ---- 0.032 ---- 800BOI05.8 10/3/90 1330 4.2 11.3 7.8 10.7 0.266 0.003 0.327 ---- 0.023 ---- 170 SWHI10.3 10/3/90 1345 ---- 12.1 9.1 12.3 0.071 0.001 0.153 ---- 0.071 30 10WHI08.0 10/3/90 1415 ---- 12.5 9.2 12.1 0.063 0.003 0.141 ---- 0.078 ---- 16WHI06.3 10/3/90 1430 ---- 12.8 9.1 11.6 0.051 0.013 0.124 ---- 0.072 ---- 40BOWMAN 10/3/90 1450 0.17 12.5 7.4 9.4 0.068 0.004 0.206 0.006 0.015 ---- 96WHI04.9 10/3/90 1645 ---- 13.5 9.2 11.3 0.046 0.009 0.156 ---- 0.070 32 24BUCKLEY 10/3/90 COMP 0.34 ---- ---- ---- 2.916 0.124 3.706 ---- 6.397 88 3ENUMCLAW 10/3/90 COMP 1.1 ---- ---- ---- 14.740 0.233 17.060 ---- 7.173 96 3000 JRAINSCH 10/3/90 COMP 0.13 ---- ---- ---- 3.368 4.828 10.620 ---- 3.723 68 170MUCTRBEFF 10/4/90 1340 1.9 11.1 7.4 10.9 0.256 0.097 0.535 ---- 0.046 34 ----
Periphyton Data: Depth Vel. TOC TP TN Chl. A(ft) (fps) (mg/L) (mg/L)(mg/L) (ug/L)
WHI20.4 9/25/91 1.2 0.93 10.3 2.6 1.00 204WHI20.4-rep 9/25/91 1.2 0.92 13.3 1.7 1.91 398WHI23.3 9/25/91 0.9 1.18 20.2 2.5 3.39 374WHI23.3-rep 9/25/91 0.9 1.25 17.4 2.8 3.04 264WHI25.2 9/25/91 1.1 1.02 10.1 5.4 0.87 87.3WHI25.2-rep 9/25/91 1.1 0.96 9.6 6.5 0.92 91.9
Table A-1, page 1
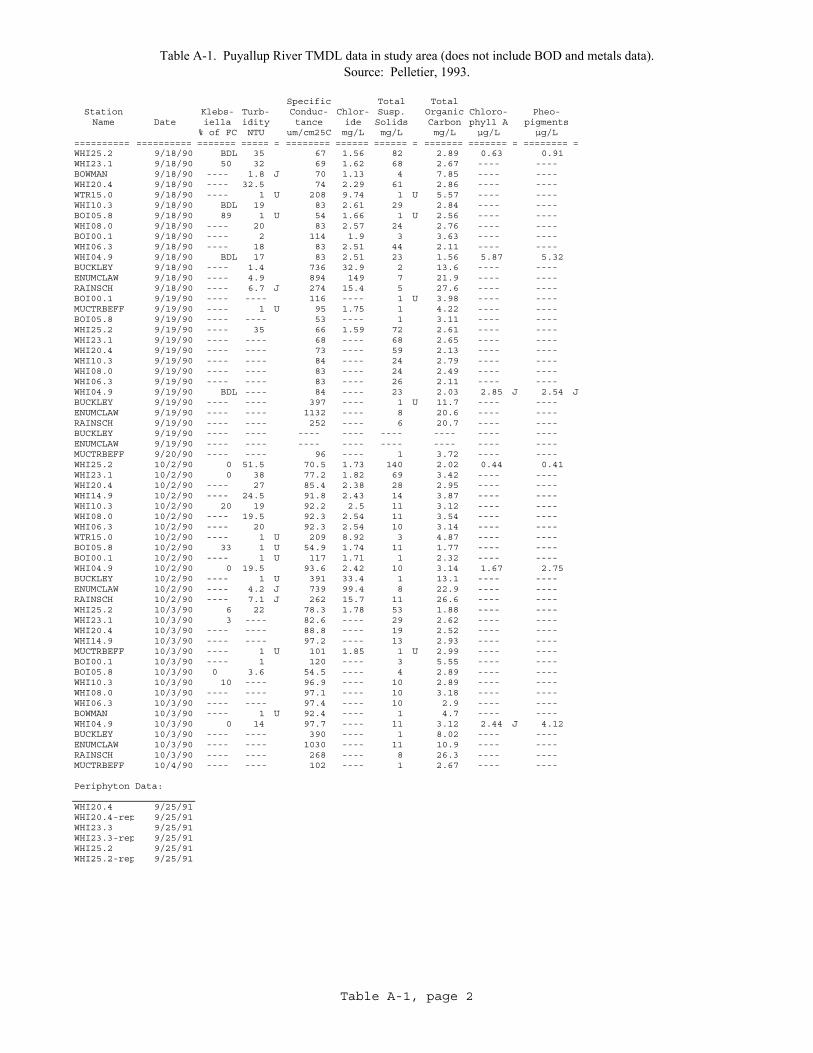
Table A-1. Puyallup River TMDL data in study area (does not include BOD and metals data). Source: Pelletier, 1993.
StationName Date
========== ==========WHI25.2 9/18/90WHI23.1 9/18/90BOWMAN 9/18/90WHI20.4 9/18/90WTR15.0 9/18/90WHI10.3 9/18/90BOI05.8 9/18/90WHI08.0 9/18/90BOI00.1 9/18/90WHI06.3 9/18/90WHI04.9 9/18/90BUCKLEY 9/18/90ENUMCLAW 9/18/90RAINSCH 9/18/90BOI00.1 9/19/90MUCTRBEFF 9/19/90BOI05.8 9/19/90WHI25.2 9/19/90WHI23.1 9/19/90WHI20.4 9/19/90WHI10.3 9/19/90WHI08.0 9/19/90WHI06.3 9/19/90WHI04.9 9/19/90BUCKLEY 9/19/90ENUMCLAW 9/19/90RAINSCH 9/19/90BUCKLEY 9/19/90ENUMCLAW 9/19/90MUCTRBEFF 9/20/90WHI25.2 10/2/90WHI23.1 10/2/90WHI20.4 10/2/90WHI14.9 10/2/90WHI10.3 10/2/90WHI08.0 10/2/90WHI06.3 10/2/90WTR15.0 10/2/90BOI05.8 10/2/90BOI00.1 10/2/90WHI04.9 10/2/90BUCKLEY 10/2/90ENUMCLAW 10/2/90RAINSCH 10/2/90WHI25.2 10/3/90WHI23.1 10/3/90WHI20.4 10/3/90WHI14.9 10/3/90MUCTRBEFF 10/3/90BOI00.1 10/3/90BOI05.8 10/3/90WHI10.3 10/3/90WHI08.0 10/3/90WHI06.3 10/3/90BOWMAN 10/3/90WHI04.9 10/3/90BUCKLEY 10/3/90ENUMCLAW 10/3/90RAINSCH 10/3/90MUCTRBEFF 10/4/90
Periphyton Data:
WHI20.4 9/25/91WHI20.4-rep 9/25/91WHI23.3 9/25/91WHI23.3-rep 9/25/91WHI25.2 9/25/91WHI25.2-rep 9/25/91
Specific Total TotalKlebs- Turb- Conduc- Chlor- Susp. Organic Chloro- Pheo-iella idity tance ide Solids Carbon phyll A pigments
% of FC NTU um/cm25C mg/L mg/L mg/L µg/L µg/L======= ===== = ======== ====== ====== = ======= ======= = ======== =
BDL 35 67 1.56 82 2.89 0.63 0.9150 32 69 1.62 68 2.67 ---- ----
---- 1.8 J 70 1.13 4 7.85 ---- -------- 32.5 74 2.29 61 2.86 ---- -------- 1 U 208 9.74 1 U 5.57 ---- ----
BDL 19 83 2.61 29 2.84 ---- ----89 1 U 54 1.66 1 U 2.56 ---- ----
---- 20 83 2.57 24 2.76 ---- -------- 2 114 1.9 3 3.63 ---- -------- 18 83 2.51 44 2.11 ---- ----
BDL 17 83 2.51 23 1.56 5.87 5.32---- 1.4 736 32.9 2 13.6 ---- -------- 4.9 894 149 7 21.9 ---- -------- 6.7 J 274 15.4 5 27.6 ---- -------- ---- 116 ---- 1 U 3.98 ---- -------- 1 U 95 1.75 1 4.22 ---- -------- ---- 53 ---- 1 3.11 ---- -------- 35 66 1.59 72 2.61 ---- -------- ---- 68 ---- 68 2.65 ---- -------- ---- 73 ---- 59 2.13 ---- -------- ---- 84 ---- 24 2.79 ---- -------- ---- 83 ---- 24 2.49 ---- -------- ---- 83 ---- 26 2.11 ---- ----
BDL ---- 84 ---- 23 2.03 2.85 J 2.54 J---- ---- 397 ---- 1 U 11.7 ---- -------- ---- 1132 ---- 8 20.6 ---- -------- ---- 252 ---- 6 20.7 ---- -------- ---- ---- ---- ---- ---- ---- -------- ---- ---- ---- ---- ---- ---- -------- ---- 96 ---- 1 3.72 ---- ----
0 51.5 70.5 1.73 140 2.02 0.44 0.410 38 77.2 1.82 69 3.42 ---- ----
---- 27 85.4 2.38 28 2.95 ---- -------- 24.5 91.8 2.43 14 3.87 ---- ----
20 19 92.2 2.5 11 3.12 ---- -------- 19.5 92.3 2.54 11 3.54 ---- -------- 20 92.3 2.54 10 3.14 ---- -------- 1 U 209 8.92 3 4.87 ---- ----
33 1 U 54.9 1.74 11 1.77 ---- -------- 1 U 117 1.71 1 2.32 ---- ----
0 19.5 93.6 2.42 10 3.14 1.67 2.75---- 1 U 391 33.4 1 13.1 ---- -------- 4.2 J 739 99.4 8 22.9 ---- -------- 7.1 J 262 15.7 11 26.6 ---- ----
6 22 78.3 1.78 53 1.88 ---- ----3 ---- 82.6 ---- 29 2.62 ---- ----
---- ---- 88.8 ---- 19 2.52 ---- -------- ---- 97.2 ---- 13 2.93 ---- -------- 1 U 101 1.85 1 U 2.99 ---- -------- 1 120 ---- 3 5.55 ---- ----0 3.6 54.5 ---- 4 2.89 ---- ----10 ---- 96.9 ---- 10 2.89 ---- ----
---- ---- 97.1 ---- 10 3.18 ---- -------- ---- 97.4 ---- 10 2.9 ---- -------- 1 U 92.4 ---- 1 4.7 ---- ----
0 14 97.7 ---- 11 3.12 2.44 J 4.12---- ---- 390 ---- 1 8.02 ---- -------- ---- 1030 ---- 11 10.9 ---- -------- ---- 268 ---- 8 26.3 ---- -------- ---- 102 ---- 1 2.67 ---- ----
Table A-1, page 2
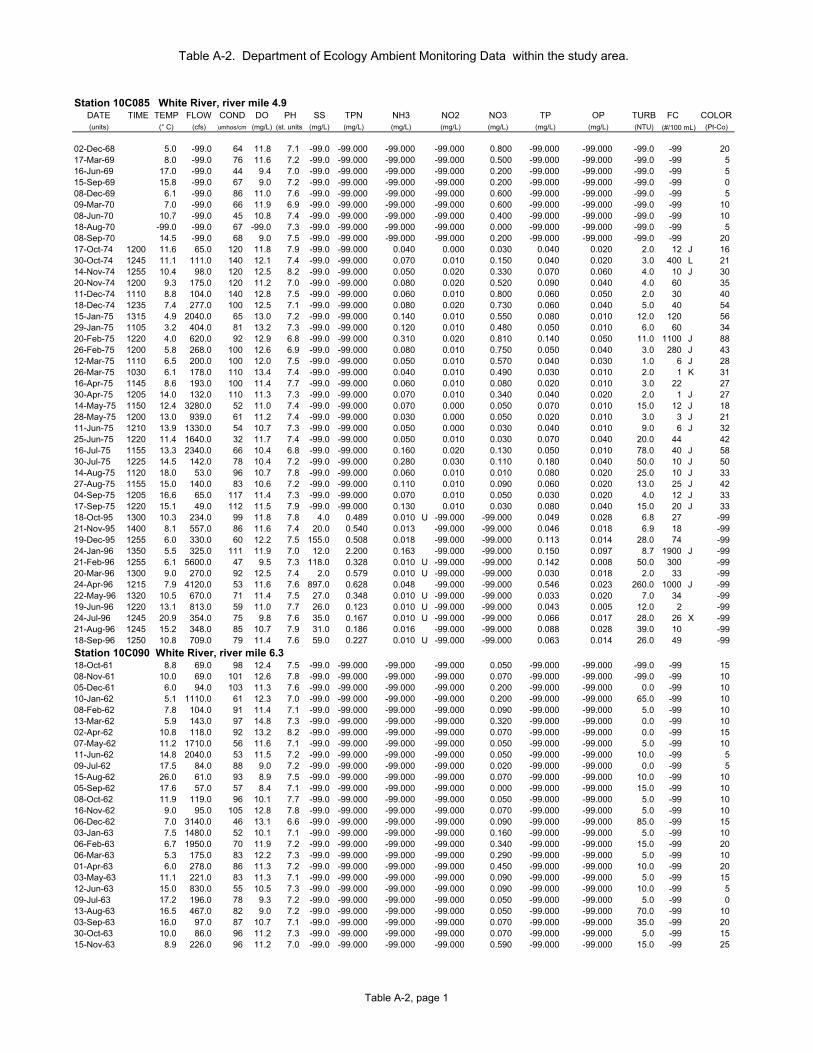
Table A-2. Department of Ecology Ambient Monitoring Data within the study area.
Station 10C085 White River, river mile 4.9DATE TIME TEMP FLOW COND DO PH SS TPN NH3 NO2 NO3 TP OP TURB FC COLOR(units) (° C) (cfs) (umhos/cm) (mg/L) (st. units) (mg/L) (mg/L) (mg/L) (mg/L) (mg/L) (mg/L) (mg/L) (NTU) (Pt-Co)
02-Dec-68 5.0 -99.0 64 11.8 7.1 -99.0 -99.000 -99.000 -99.000 0.800 -99.000 -99.000 -99.0 -99 2017-Mar-69 8.0 -99.0 76 11.6 7.2 -99.0 -99.000 -99.000 -99.000 0.500 -99.000 -99.000 -99.0 -99 516-Jun-69 17.0 -99.0 44 9.4 7.0 -99.0 -99.000 -99.000 -99.000 0.200 -99.000 -99.000 -99.0 -99 515-Sep-69 15.8 -99.0 67 9.0 7.2 -99.0 -99.000 -99.000 -99.000 0.200 -99.000 -99.000 -99.0 -99 008-Dec-69 6.1 -99.0 86 11.0 7.6 -99.0 -99.000 -99.000 -99.000 0.600 -99.000 -99.000 -99.0 -99 509-Mar-70 7.0 -99.0 66 11.9 6.9 -99.0 -99.000 -99.000 -99.000 0.600 -99.000 -99.000 -99.0 -99 1008-Jun-70 10.7 -99.0 45 10.8 7.4 -99.0 -99.000 -99.000 -99.000 0.400 -99.000 -99.000 -99.0 -99 1018-Aug-70 -99.0 -99.0 67 -99.0 7.3 -99.0 -99.000 -99.000 -99.000 0.000 -99.000 -99.000 -99.0 -99 508-Sep-70 14.5 -99.0 68 9.0 7.5 -99.0 -99.000 -99.000 -99.000 0.200 -99.000 -99.000 -99.0 -99 2017-Oct-74 1200 11.6 65.0 120 11.8 7.9 -99.0 -99.000 0.040 0.000 0.030 0.040 0.020 2.0 12 J 1630-Oct-74 1245 11.1 111.0 140 12.1 7.4 -99.0 -99.000 0.070 0.010 0.150 0.040 0.020 3.0 400 L 2114-Nov-74 1255 10.4 98.0 120 12.5 8.2 -99.0 -99.000 0.050 0.020 0.330 0.070 0.060 4.0 10 J 3020-Nov-74 1200 9.3 175.0 120 11.2 7.0 -99.0 -99.000 0.080 0.020 0.520 0.090 0.040 4.0 60 3511-Dec-74 1110 8.8 104.0 140 12.8 7.5 -99.0 -99.000 0.060 0.010 0.800 0.060 0.050 2.0 30 4018-Dec-74 1235 7.4 277.0 100 12.5 7.1 -99.0 -99.000 0.080 0.020 0.730 0.060 0.040 5.0 40 5415-Jan-75 1315 4.9 2040.0 65 13.0 7.2 -99.0 -99.000 0.140 0.010 0.550 0.080 0.010 12.0 120 5629-Jan-75 1105 3.2 404.0 81 13.2 7.3 -99.0 -99.000 0.120 0.010 0.480 0.050 0.010 6.0 60 3420-Feb-75 1220 4.0 620.0 92 12.9 6.8 -99.0 -99.000 0.310 0.020 0.810 0.140 0.050 11.0 1100 J 8826-Feb-75 1200 5.8 268.0 100 12.6 6.9 -99.0 -99.000 0.080 0.010 0.750 0.050 0.040 3.0 280 J 4312-Mar-75 1110 6.5 200.0 100 12.0 7.5 -99.0 -99.000 0.050 0.010 0.570 0.040 0.030 1.0 6 J 2826-Mar-75 1030 6.1 178.0 110 13.4 7.4 -99.0 -99.000 0.040 0.010 0.490 0.030 0.010 2.0 1 K 3116-Apr-75 1145 8.6 193.0 100 11.4 7.7 -99.0 -99.000 0.060 0.010 0.080 0.020 0.010 3.0 22 2730-Apr-75 1205 14.0 132.0 110 11.3 7.3 -99.0 -99.000 0.070 0.010 0.340 0.040 0.020 2.0 1 J 2714-May-75 1150 12.4 3280.0 52 11.0 7.4 -99.0 -99.000 0.070 0.000 0.050 0.070 0.010 15.0 12 J 1828-May-75 1200 13.0 939.0 61 11.2 7.4 -99.0 -99.000 0.030 0.000 0.050 0.020 0.010 3.0 3 J 2111-Jun-75 1210 13.9 1330.0 54 10.7 7.3 -99.0 -99.000 0.050 0.000 0.030 0.040 0.010 9.0 6 J 3225-Jun-75 1220 11.4 1640.0 32 11.7 7.4 -99.0 -99.000 0.050 0.010 0.030 0.070 0.040 20.0 44 4216-Jul-75 1155 13.3 2340.0 66 10.4 6.8 -99.0 -99.000 0.160 0.020 0.130 0.050 0.010 78.0 40 J 5830-Jul-75 1225 14.5 142.0 78 10.4 7.2 -99.0 -99.000 0.280 0.030 0.110 0.180 0.040 50.0 10 J 5014-Aug-75 1120 18.0 53.0 96 10.7 7.8 -99.0 -99.000 0.060 0.010 0.010 0.080 0.020 25.0 10 J 3327-Aug-75 1155 15.0 140.0 83 10.6 7.2 -99.0 -99.000 0.110 0.010 0.090 0.060 0.020 13.0 25 J 4204-Sep-75 1205 16.6 65.0 117 11.4 7.3 -99.0 -99.000 0.070 0.010 0.050 0.030 0.020 4.0 12 J 3317-Sep-75 1220 15.1 49.0 112 11.5 7.9 -99.0 -99.000 0.130 0.010 0.030 0.080 0.040 15.0 20 J 3318-Oct-95 1300 10.3 234.0 99 11.8 7.8 4.0 0.489 0.010 U -99.000 -99.000 0.049 0.028 6.8 27 -9921-Nov-95 1400 8.1 557.0 86 11.6 7.4 20.0 0.540 0.013 -99.000 -99.000 0.046 0.018 6.9 18 -9919-Dec-95 1255 6.0 330.0 60 12.2 7.5 155.0 0.508 0.018 -99.000 -99.000 0.113 0.014 28.0 74 -9924-Jan-96 1350 5.5 325.0 111 11.9 7.0 12.0 2.200 0.163 -99.000 -99.000 0.150 0.097 8.7 1900 J -9921-Feb-96 1255 6.1 5600.0 47 9.5 7.3 118.0 0.328 0.010 U -99.000 -99.000 0.142 0.008 50.0 300 -9920-Mar-96 1300 9.0 270.0 92 12.5 7.4 2.0 0.579 0.010 U -99.000 -99.000 0.030 0.018 2.0 33 -9924-Apr-96 1215 7.9 4120.0 53 11.6 7.6 897.0 0.628 0.048 -99.000 -99.000 0.546 0.023 260.0 1000 J -9922-May-96 1320 10.5 670.0 71 11.4 7.5 27.0 0.348 0.010 U -99.000 -99.000 0.033 0.020 7.0 34 -9919-Jun-96 1220 13.1 813.0 59 11.0 7.7 26.0 0.123 0.010 U -99.000 -99.000 0.043 0.005 12.0 2 -9924-Jul-96 1245 20.9 354.0 75 9.8 7.6 35.0 0.167 0.010 U -99.000 -99.000 0.066 0.017 28.0 26 X -9921-Aug-96 1245 15.2 348.0 85 10.7 7.9 31.0 0.186 0.016 -99.000 -99.000 0.088 0.028 39.0 10 -9918-Sep-96 1250 10.8 709.0 79 11.4 7.6 59.0 0.227 0.010 U -99.000 -99.000 0.063 0.014 26.0 49 -99Station 10C090 White River, river mile 6.318-Oct-61 8.8 69.0 98 12.4 7.5 -99.0 -99.000 -99.000 -99.000 0.050 -99.000 -99.000 -99.0 -99 1508-Nov-61 10.0 69.0 101 12.6 7.8 -99.0 -99.000 -99.000 -99.000 0.070 -99.000 -99.000 -99.0 -99 1005-Dec-61 6.0 94.0 103 11.3 7.6 -99.0 -99.000 -99.000 -99.000 0.200 -99.000 -99.000 0.0 -99 1010-Jan-62 5.1 1110.0 61 12.3 7.0 -99.0 -99.000 -99.000 -99.000 0.200 -99.000 -99.000 65.0 -99 1008-Feb-62 7.8 104.0 91 11.4 7.1 -99.0 -99.000 -99.000 -99.000 0.090 -99.000 -99.000 5.0 -99 1013-Mar-62 5.9 143.0 97 14.8 7.3 -99.0 -99.000 -99.000 -99.000 0.320 -99.000 -99.000 0.0 -99 1002-Apr-62 10.8 118.0 92 13.2 8.2 -99.0 -99.000 -99.000 -99.000 0.070 -99.000 -99.000 0.0 -99 1507-May-62 11.2 1710.0 56 11.6 7.1 -99.0 -99.000 -99.000 -99.000 0.050 -99.000 -99.000 5.0 -99 1011-Jun-62 14.8 2040.0 53 11.5 7.2 -99.0 -99.000 -99.000 -99.000 0.050 -99.000 -99.000 10.0 -99 509-Jul-62 17.5 84.0 88 9.0 7.2 -99.0 -99.000 -99.000 -99.000 0.020 -99.000 -99.000 0.0 -99 515-Aug-62 26.0 61.0 93 8.9 7.5 -99.0 -99.000 -99.000 -99.000 0.070 -99.000 -99.000 10.0 -99 1005-Sep-62 17.6 57.0 57 8.4 7.1 -99.0 -99.000 -99.000 -99.000 0.000 -99.000 -99.000 15.0 -99 1008-Oct-62 11.9 119.0 96 10.1 7.7 -99.0 -99.000 -99.000 -99.000 0.050 -99.000 -99.000 5.0 -99 1016-Nov-62 9.0 95.0 105 12.8 7.8 -99.0 -99.000 -99.000 -99.000 0.070 -99.000 -99.000 5.0 -99 1006-Dec-62 7.0 3140.0 46 13.1 6.6 -99.0 -99.000 -99.000 -99.000 0.090 -99.000 -99.000 85.0 -99 1503-Jan-63 7.5 1480.0 52 10.1 7.1 -99.0 -99.000 -99.000 -99.000 0.160 -99.000 -99.000 5.0 -99 1006-Feb-63 6.7 1950.0 70 11.9 7.2 -99.0 -99.000 -99.000 -99.000 0.340 -99.000 -99.000 15.0 -99 2006-Mar-63 5.3 175.0 83 12.2 7.3 -99.0 -99.000 -99.000 -99.000 0.290 -99.000 -99.000 5.0 -99 1001-Apr-63 6.0 278.0 86 11.3 7.2 -99.0 -99.000 -99.000 -99.000 0.450 -99.000 -99.000 10.0 -99 2003-May-63 11.1 221.0 83 11.3 7.1 -99.0 -99.000 -99.000 -99.000 0.090 -99.000 -99.000 5.0 -99 1512-Jun-63 15.0 830.0 55 10.5 7.3 -99.0 -99.000 -99.000 -99.000 0.090 -99.000 -99.000 10.0 -99 509-Jul-63 17.2 196.0 78 9.3 7.2 -99.0 -99.000 -99.000 -99.000 0.050 -99.000 -99.000 5.0 -99 013-Aug-63 16.5 467.0 82 9.0 7.2 -99.0 -99.000 -99.000 -99.000 0.050 -99.000 -99.000 70.0 -99 1003-Sep-63 16.0 97.0 87 10.7 7.1 -99.0 -99.000 -99.000 -99.000 0.070 -99.000 -99.000 35.0 -99 2030-Oct-63 10.0 86.0 96 11.2 7.3 -99.0 -99.000 -99.000 -99.000 0.070 -99.000 -99.000 5.0 -99 1515-Nov-63 8.9 226.0 96 11.2 7.0 -99.0 -99.000 -99.000 -99.000 0.590 -99.000 -99.000 15.0 -99 25
(#/100 mL)
Table A-2, page 1
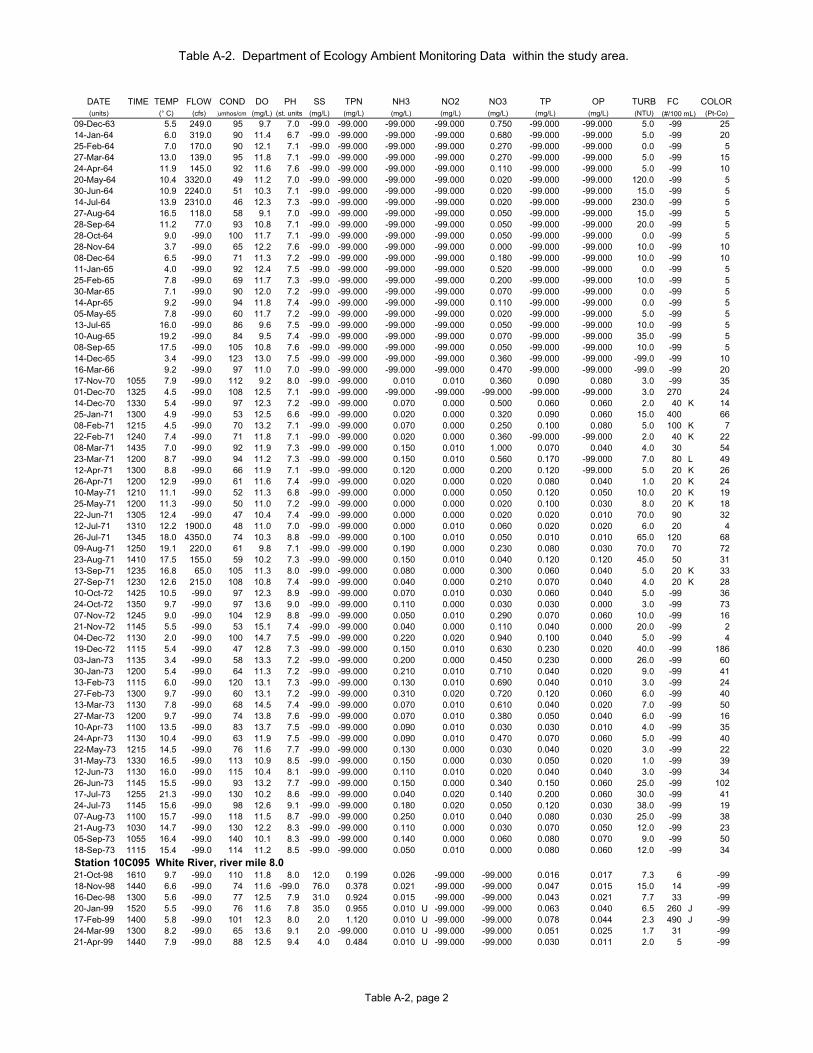
Table A-2. Department of Ecology Ambient Monitoring Data within the study area.
DATE TIME TEMP FLOW COND DO PH SS TPN NH3 NO2 NO3 TP OP TURB FC COLOR(units) (° C) (cfs) (umhos/cm) (mg/L) (st. units) (mg/L) (mg/L) (mg/L) (mg/L) (mg/L) (mg/L) (mg/L) (NTU) (Pt-Co)(#/100 mL)
09-Dec-63 5.5 249.0 95 9.7 7.0 -99.0 -99.000 -99.000 -99.000 0.750 -99.000 -99.000 5.0 -99 2514-Jan-64 6.0 319.0 90 11.4 6.7 -99.0 -99.000 -99.000 -99.000 0.680 -99.000 -99.000 5.0 -99 2025-Feb-64 7.0 170.0 90 12.1 7.1 -99.0 -99.000 -99.000 -99.000 0.270 -99.000 -99.000 0.0 -99 527-Mar-64 13.0 139.0 95 11.8 7.1 -99.0 -99.000 -99.000 -99.000 0.270 -99.000 -99.000 5.0 -99 1524-Apr-64 11.9 145.0 92 11.6 7.6 -99.0 -99.000 -99.000 -99.000 0.110 -99.000 -99.000 5.0 -99 1020-May-64 10.4 3320.0 49 11.2 7.0 -99.0 -99.000 -99.000 -99.000 0.020 -99.000 -99.000 120.0 -99 530-Jun-64 10.9 2240.0 51 10.3 7.1 -99.0 -99.000 -99.000 -99.000 0.020 -99.000 -99.000 15.0 -99 514-Jul-64 13.9 2310.0 46 12.3 7.3 -99.0 -99.000 -99.000 -99.000 0.020 -99.000 -99.000 230.0 -99 527-Aug-64 16.5 118.0 58 9.1 7.0 -99.0 -99.000 -99.000 -99.000 0.050 -99.000 -99.000 15.0 -99 528-Sep-64 11.2 77.0 93 10.8 7.1 -99.0 -99.000 -99.000 -99.000 0.050 -99.000 -99.000 20.0 -99 528-Oct-64 9.0 -99.0 100 11.7 7.1 -99.0 -99.000 -99.000 -99.000 0.050 -99.000 -99.000 0.0 -99 528-Nov-64 3.7 -99.0 65 12.2 7.6 -99.0 -99.000 -99.000 -99.000 0.000 -99.000 -99.000 10.0 -99 1008-Dec-64 6.5 -99.0 71 11.3 7.2 -99.0 -99.000 -99.000 -99.000 0.180 -99.000 -99.000 10.0 -99 1011-Jan-65 4.0 -99.0 92 12.4 7.5 -99.0 -99.000 -99.000 -99.000 0.520 -99.000 -99.000 0.0 -99 525-Feb-65 7.8 -99.0 69 11.7 7.3 -99.0 -99.000 -99.000 -99.000 0.200 -99.000 -99.000 10.0 -99 530-Mar-65 7.1 -99.0 90 12.0 7.2 -99.0 -99.000 -99.000 -99.000 0.070 -99.000 -99.000 0.0 -99 514-Apr-65 9.2 -99.0 94 11.8 7.4 -99.0 -99.000 -99.000 -99.000 0.110 -99.000 -99.000 0.0 -99 505-May-65 7.8 -99.0 60 11.7 7.2 -99.0 -99.000 -99.000 -99.000 0.020 -99.000 -99.000 5.0 -99 513-Jul-65 16.0 -99.0 86 9.6 7.5 -99.0 -99.000 -99.000 -99.000 0.050 -99.000 -99.000 10.0 -99 510-Aug-65 19.2 -99.0 84 9.5 7.4 -99.0 -99.000 -99.000 -99.000 0.070 -99.000 -99.000 35.0 -99 508-Sep-65 17.5 -99.0 105 10.8 7.6 -99.0 -99.000 -99.000 -99.000 0.050 -99.000 -99.000 10.0 -99 514-Dec-65 3.4 -99.0 123 13.0 7.5 -99.0 -99.000 -99.000 -99.000 0.360 -99.000 -99.000 -99.0 -99 1016-Mar-66 9.2 -99.0 97 11.0 7.0 -99.0 -99.000 -99.000 -99.000 0.470 -99.000 -99.000 -99.0 -99 2017-Nov-70 1055 7.9 -99.0 112 9.2 8.0 -99.0 -99.000 0.010 0.010 0.360 0.090 0.080 3.0 -99 3501-Dec-70 1325 4.5 -99.0 108 12.5 7.1 -99.0 -99.000 -99.000 -99.000 -99.000 -99.000 -99.000 3.0 270 2414-Dec-70 1330 5.4 -99.0 97 12.3 7.2 -99.0 -99.000 0.070 0.000 0.500 0.060 0.060 2.0 40 K 1425-Jan-71 1300 4.9 -99.0 53 12.5 6.6 -99.0 -99.000 0.020 0.000 0.320 0.090 0.060 15.0 400 6608-Feb-71 1215 4.5 -99.0 70 13.2 7.1 -99.0 -99.000 0.070 0.000 0.250 0.100 0.080 5.0 100 K 722-Feb-71 1240 7.4 -99.0 71 11.8 7.1 -99.0 -99.000 0.020 0.000 0.360 -99.000 -99.000 2.0 40 K 2208-Mar-71 1435 7.0 -99.0 92 11.9 7.3 -99.0 -99.000 0.150 0.010 1.000 0.070 0.040 4.0 30 5423-Mar-71 1200 8.7 -99.0 94 11.2 7.3 -99.0 -99.000 0.150 0.010 0.560 0.170 -99.000 7.0 80 L 4912-Apr-71 1300 8.8 -99.0 66 11.9 7.1 -99.0 -99.000 0.120 0.000 0.200 0.120 -99.000 5.0 20 K 2626-Apr-71 1200 12.9 -99.0 61 11.6 7.4 -99.0 -99.000 0.020 0.000 0.020 0.080 0.040 1.0 20 K 2410-May-71 1210 11.1 -99.0 52 11.3 6.8 -99.0 -99.000 0.000 0.000 0.050 0.120 0.050 10.0 20 K 1925-May-71 1200 11.3 -99.0 50 11.0 7.2 -99.0 -99.000 0.000 0.000 0.020 0.100 0.030 8.0 20 K 1822-Jun-71 1305 12.4 -99.0 47 10.4 7.4 -99.0 -99.000 0.000 0.000 0.020 0.020 0.010 70.0 90 3212-Jul-71 1310 12.2 1900.0 48 11.0 7.0 -99.0 -99.000 0.000 0.010 0.060 0.020 0.020 6.0 20 426-Jul-71 1345 18.0 4350.0 74 10.3 8.8 -99.0 -99.000 0.100 0.010 0.050 0.010 0.010 65.0 120 6809-Aug-71 1250 19.1 220.0 61 9.8 7.1 -99.0 -99.000 0.190 0.000 0.230 0.080 0.030 70.0 70 7223-Aug-71 1410 17.5 155.0 59 10.2 7.3 -99.0 -99.000 0.150 0.010 0.040 0.120 0.120 45.0 50 3113-Sep-71 1235 16.8 65.0 105 11.3 8.0 -99.0 -99.000 0.080 0.000 0.300 0.060 0.040 5.0 20 K 3327-Sep-71 1230 12.6 215.0 108 10.8 7.4 -99.0 -99.000 0.040 0.000 0.210 0.070 0.040 4.0 20 K 2810-Oct-72 1425 10.5 -99.0 97 12.3 8.9 -99.0 -99.000 0.070 0.010 0.030 0.060 0.040 5.0 -99 3624-Oct-72 1350 9.7 -99.0 97 13.6 9.0 -99.0 -99.000 0.110 0.000 0.030 0.030 0.000 3.0 -99 7307-Nov-72 1245 9.0 -99.0 104 12.9 8.8 -99.0 -99.000 0.050 0.010 0.290 0.070 0.060 10.0 -99 1621-Nov-72 1145 5.5 -99.0 53 15.1 7.4 -99.0 -99.000 0.040 0.000 0.110 0.040 0.000 20.0 -99 204-Dec-72 1130 2.0 -99.0 100 14.7 7.5 -99.0 -99.000 0.220 0.020 0.940 0.100 0.040 5.0 -99 419-Dec-72 1115 5.4 -99.0 47 12.8 7.3 -99.0 -99.000 0.150 0.010 0.630 0.230 0.020 40.0 -99 18603-Jan-73 1135 3.4 -99.0 58 13.3 7.2 -99.0 -99.000 0.200 0.000 0.450 0.230 0.000 26.0 -99 6030-Jan-73 1200 5.4 -99.0 64 11.3 7.2 -99.0 -99.000 0.210 0.010 0.710 0.040 0.020 9.0 -99 4113-Feb-73 1115 6.0 -99.0 120 13.1 7.3 -99.0 -99.000 0.130 0.010 0.690 0.040 0.010 3.0 -99 2427-Feb-73 1300 9.7 -99.0 60 13.1 7.2 -99.0 -99.000 0.310 0.020 0.720 0.120 0.060 6.0 -99 4013-Mar-73 1130 7.8 -99.0 68 14.5 7.4 -99.0 -99.000 0.070 0.010 0.610 0.040 0.020 7.0 -99 5027-Mar-73 1200 9.7 -99.0 74 13.8 7.6 -99.0 -99.000 0.070 0.010 0.380 0.050 0.040 6.0 -99 1610-Apr-73 1100 13.5 -99.0 83 13.7 7.5 -99.0 -99.000 0.090 0.010 0.030 0.030 0.010 4.0 -99 3524-Apr-73 1130 10.4 -99.0 63 11.9 7.5 -99.0 -99.000 0.090 0.010 0.470 0.070 0.060 5.0 -99 4022-May-73 1215 14.5 -99.0 76 11.6 7.7 -99.0 -99.000 0.130 0.000 0.030 0.040 0.020 3.0 -99 2231-May-73 1330 16.5 -99.0 113 10.9 8.5 -99.0 -99.000 0.150 0.000 0.030 0.050 0.020 1.0 -99 3912-Jun-73 1130 16.0 -99.0 115 10.4 8.1 -99.0 -99.000 0.110 0.010 0.020 0.040 0.040 3.0 -99 3426-Jun-73 1145 15.5 -99.0 93 13.2 7.7 -99.0 -99.000 0.150 0.000 0.340 0.150 0.060 25.0 -99 10217-Jul-73 1255 21.3 -99.0 130 10.2 8.6 -99.0 -99.000 0.040 0.020 0.140 0.200 0.060 30.0 -99 4124-Jul-73 1145 15.6 -99.0 98 12.6 9.1 -99.0 -99.000 0.180 0.020 0.050 0.120 0.030 38.0 -99 1907-Aug-73 1100 15.7 -99.0 118 11.5 8.7 -99.0 -99.000 0.250 0.010 0.040 0.080 0.030 25.0 -99 3821-Aug-73 1030 14.7 -99.0 130 12.2 8.3 -99.0 -99.000 0.110 0.000 0.030 0.070 0.050 12.0 -99 2305-Sep-73 1055 16.4 -99.0 140 10.1 8.3 -99.0 -99.000 0.140 0.000 0.060 0.080 0.070 9.0 -99 5018-Sep-73 1115 15.4 -99.0 114 11.2 8.5 -99.0 -99.000 0.050 0.010 0.000 0.080 0.060 12.0 -99 34Station 10C095 White River, river mile 8.021-Oct-98 1610 9.7 -99.0 110 11.8 8.0 12.0 0.199 0.026 -99.000 -99.000 0.016 0.017 7.3 6 -9918-Nov-98 1440 6.6 -99.0 74 11.6 -99.0 76.0 0.378 0.021 -99.000 -99.000 0.047 0.015 15.0 14 -9916-Dec-98 1300 5.6 -99.0 77 12.5 7.9 31.0 0.924 0.015 -99.000 -99.000 0.043 0.021 7.7 33 -9920-Jan-99 1520 5.5 -99.0 76 11.6 7.8 35.0 0.955 0.010 U -99.000 -99.000 0.063 0.040 6.5 260 J -9917-Feb-99 1400 5.8 -99.0 101 12.3 8.0 2.0 1.120 0.010 U -99.000 -99.000 0.078 0.044 2.3 490 J -9924-Mar-99 1300 8.2 -99.0 65 13.6 9.1 2.0 -99.000 0.010 U -99.000 -99.000 0.051 0.025 1.7 31 -9921-Apr-99 1440 7.9 -99.0 88 12.5 9.4 4.0 0.484 0.010 U -99.000 -99.000 0.030 0.011 2.0 5 -99
Table A-2, page 2
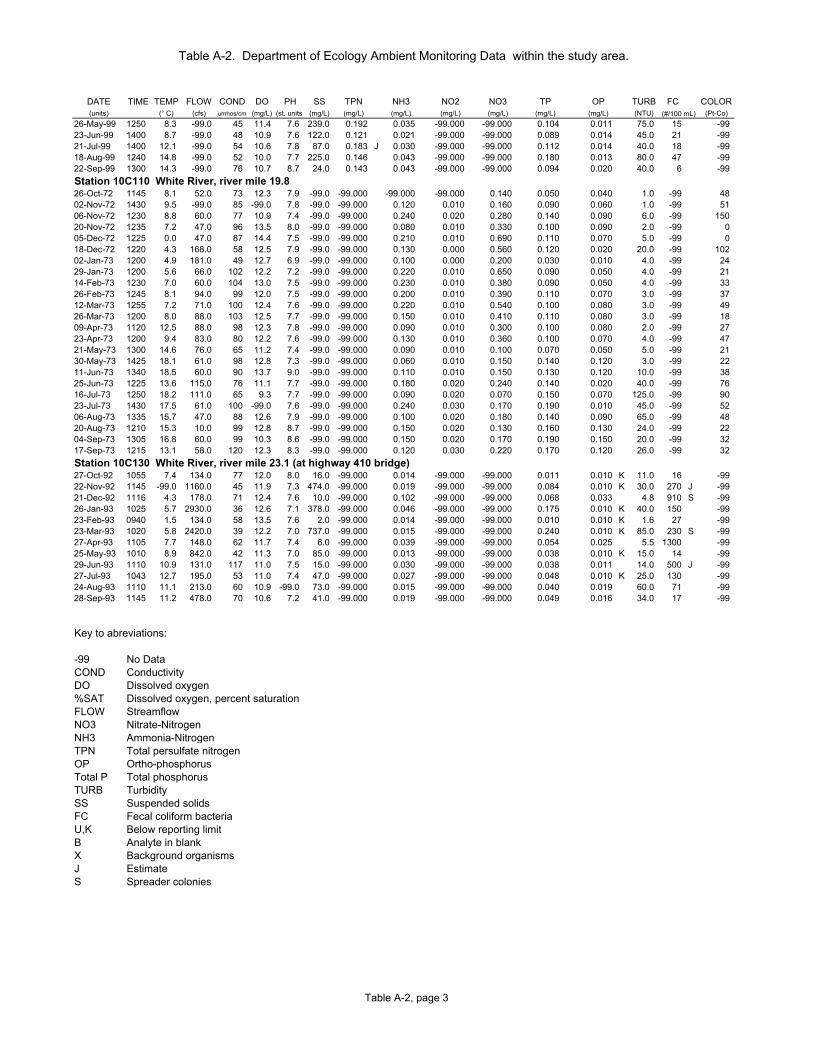
Table A-2. Department of Ecology Ambient Monitoring Data within the study area.
DATE TIME TEMP FLOW COND DO PH SS TPN NH3 NO2 NO3 TP OP TURB FC COLOR(units) (° C) (cfs) (umhos/cm) (mg/L) (st. units) (mg/L) (mg/L) (mg/L) (mg/L) (mg/L) (mg/L) (mg/L) (NTU) (Pt-Co)(#/100 mL)
26-May-99 1250 8.3 -99.0 45 11.4 7.6 239.0 0.192 0.035 -99.000 -99.000 0.104 0.011 75.0 15 -9923-Jun-99 1400 8.7 -99.0 48 10.9 7.6 122.0 0.121 0.021 -99.000 -99.000 0.089 0.014 45.0 21 -9921-Jul-99 1400 12.1 -99.0 54 10.6 7.8 87.0 0.183 J 0.030 -99.000 -99.000 0.112 0.014 40.0 18 -9918-Aug-99 1240 14.8 -99.0 52 10.0 7.7 225.0 0.146 0.043 -99.000 -99.000 0.180 0.013 80.0 47 -9922-Sep-99 1300 14.3 -99.0 76 10.7 8.7 24.0 0.143 0.043 -99.000 -99.000 0.094 0.020 40.0 6 -99Station 10C110 White River, river mile 19.826-Oct-72 1145 8.1 52.0 73 12.3 7.9 -99.0 -99.000 -99.000 -99.000 0.140 0.050 0.040 1.0 -99 4802-Nov-72 1430 9.5 -99.0 85 -99.0 7.8 -99.0 -99.000 0.120 0.010 0.160 0.090 0.060 1.0 -99 5106-Nov-72 1230 8.8 60.0 77 10.9 7.4 -99.0 -99.000 0.240 0.020 0.280 0.140 0.090 6.0 -99 15020-Nov-72 1235 7.2 47.0 96 13.5 8.0 -99.0 -99.000 0.080 0.010 0.330 0.100 0.090 2.0 -99 005-Dec-72 1225 0.0 47.0 87 14.4 7.5 -99.0 -99.000 0.210 0.010 0.690 0.110 0.070 5.0 -99 018-Dec-72 1220 4.3 168.0 58 12.5 7.9 -99.0 -99.000 0.130 0.000 0.560 0.120 0.020 20.0 -99 10202-Jan-73 1200 4.9 181.0 49 12.7 6.9 -99.0 -99.000 0.100 0.000 0.200 0.030 0.010 4.0 -99 2429-Jan-73 1200 5.6 66.0 102 12.2 7.2 -99.0 -99.000 0.220 0.010 0.650 0.090 0.050 4.0 -99 2114-Feb-73 1230 7.0 60.0 104 13.0 7.5 -99.0 -99.000 0.230 0.010 0.380 0.090 0.050 4.0 -99 3326-Feb-73 1245 8.1 94.0 99 12.0 7.5 -99.0 -99.000 0.200 0.010 0.390 0.110 0.070 3.0 -99 3712-Mar-73 1255 7.2 71.0 100 12.4 7.6 -99.0 -99.000 0.220 0.010 0.540 0.100 0.080 3.0 -99 4926-Mar-73 1200 8.0 88.0 103 12.5 7.7 -99.0 -99.000 0.150 0.010 0.410 0.110 0.080 3.0 -99 1809-Apr-73 1120 12.5 88.0 98 12.3 7.8 -99.0 -99.000 0.090 0.010 0.300 0.100 0.080 2.0 -99 2723-Apr-73 1200 9.4 83.0 80 12.2 7.6 -99.0 -99.000 0.130 0.010 0.360 0.100 0.070 4.0 -99 4721-May-73 1300 14.6 76.0 65 11.2 7.4 -99.0 -99.000 0.090 0.010 0.100 0.070 0.050 5.0 -99 2130-May-73 1425 18.1 61.0 98 12.8 7.3 -99.0 -99.000 0.060 0.010 0.150 0.140 0.120 3.0 -99 2211-Jun-73 1340 18.5 60.0 90 13.7 9.0 -99.0 -99.000 0.110 0.010 0.150 0.130 0.120 10.0 -99 3825-Jun-73 1225 13.6 115.0 76 11.1 7.7 -99.0 -99.000 0.180 0.020 0.240 0.140 0.020 40.0 -99 7616-Jul-73 1250 18.2 111.0 65 9.3 7.7 -99.0 -99.000 0.090 0.020 0.070 0.150 0.070 125.0 -99 9023-Jul-73 1430 17.5 61.0 100 -99.0 7.6 -99.0 -99.000 0.240 0.030 0.170 0.190 0.010 45.0 -99 5206-Aug-73 1335 15.7 47.0 88 12.6 7.9 -99.0 -99.000 0.100 0.020 0.180 0.140 0.090 65.0 -99 4820-Aug-73 1210 15.3 10.0 99 12.8 8.7 -99.0 -99.000 0.150 0.020 0.130 0.160 0.130 24.0 -99 2204-Sep-73 1305 16.8 60.0 99 10.3 8.6 -99.0 -99.000 0.150 0.020 0.170 0.190 0.150 20.0 -99 3217-Sep-73 1215 13.1 58.0 120 12.3 8.3 -99.0 -99.000 0.120 0.030 0.220 0.170 0.120 26.0 -99 32Station 10C130 White River, river mile 23.1 (at highway 410 bridge)27-Oct-92 1055 7.4 134.0 77 12.0 8.0 16.0 -99.000 0.014 -99.000 -99.000 0.011 0.010 K 11.0 16 -9922-Nov-92 1145 -99.0 1160.0 45 11.9 7.3 474.0 -99.000 0.019 -99.000 -99.000 0.084 0.010 K 30.0 270 J -9921-Dec-92 1116 4.3 178.0 71 12.4 7.6 10.0 -99.000 0.102 -99.000 -99.000 0.068 0.033 4.8 910 S -9926-Jan-93 1025 5.7 2930.0 36 12.6 7.1 378.0 -99.000 0.046 -99.000 -99.000 0.175 0.010 K 40.0 150 -9923-Feb-93 0940 1.5 134.0 58 13.5 7.6 2.0 -99.000 0.014 -99.000 -99.000 0.010 0.010 K 1.6 27 -9923-Mar-93 1020 5.8 2420.0 39 12.2 7.0 737.0 -99.000 0.015 -99.000 -99.000 0.240 0.010 K 85.0 230 S -9927-Apr-93 1105 7.7 148.0 62 11.7 7.4 6.0 -99.000 0.039 -99.000 -99.000 0.054 0.025 5.5 1300 -9925-May-93 1010 8.9 842.0 42 11.3 7.0 85.0 -99.000 0.013 -99.000 -99.000 0.038 0.010 K 15.0 14 -9929-Jun-93 1110 10.9 131.0 117 11.0 7.5 15.0 -99.000 0.030 -99.000 -99.000 0.038 0.011 14.0 500 J -9927-Jul-93 1043 12.7 195.0 53 11.0 7.4 47.0 -99.000 0.027 -99.000 -99.000 0.048 0.010 K 25.0 130 -9924-Aug-93 1110 11.1 213.0 60 10.9 -99.0 73.0 -99.000 0.015 -99.000 -99.000 0.040 0.019 60.0 71 -9928-Sep-93 1145 11.2 478.0 70 10.6 7.2 41.0 -99.000 0.019 -99.000 -99.000 0.049 0.016 34.0 17 -99
Key to abreviations:
-99 No DataCOND ConductivityDO Dissolved oxygen%SAT Dissolved oxygen, percent saturationFLOW StreamflowNO3 Nitrate-NitrogenNH3 Ammonia-NitrogenTPN Total persulfate nitrogenOP Ortho-phosphorusTotal P Total phosphorusTURB TurbiditySS Suspended solidsFC Fecal coliform bacteriaU,K Below reporting limitB Analyte in blankX Background organismsJ EstimateS Spreader colonies
Table A-2, page 3
DRAFT – DO NOT CITE OR QUOTE
Appendix B
Assessment of pH Response to Nutrient Loadingin the Lower White River
Nutrient Loading from Groundwaterby John TooleyJanuary 1997
Objective
Estimate groundwater nutrient loading to the White River Bypass Channel.
Approach
Review historical groundwater water quality literature from projects in the White River drainage,King County and Pierce County.
Review any appropriate surface water/ground water interaction analyses for the White River area.
Compile available groundwater quality information in the area, and summarize nutrientcharacteristics from these data.
Geology
The geology around the bypass reach, like that of rest of the Puget Sound lowland, is greatlyinfluenced by the Pleistocene glaciation of the Puget lobe of the Cordilleran Ice Sheet. Therepeated invasion of the ice, with warm periods in between, resulted in a complex assemblage ofcoarse outwash gravels, finer alluvial sands, fine lacustrine sediments, and poorly sorted tills.This process formed broad outwash plains through which rivers have since down cut to theircurrent locations.
In addition to repeated glaciation, this area was subjected to periodic eruptions of ash and debrisflows from Mount Rainier. About 5700 years ago the Osceola mudflow originated on thesummit of the northeastern side of Mount Rainier and flowed down the White River valley andspilled into the Puyallup and Green river basins. The composition of the clay content of themudflow indicates that it originated as a huge deep-seated landslide which cut into the core ofMt. Rainier. The resulting mudflow had an estimated volume of 89 mi.3 and covered an area ofat least 195 mi.2 with up to 100 ft. thick layer of clay rich sediments (Dragovich, 1994).
This mudflow covers the drift plains surrounding the White River bypass reach with mixture ofclay-rich gravel, cobbles and boulders. The soils formed on these deposits are poorly drained and
DRAFT – DO NOT CITE OR QUOTE
have a slow permeability. Ecology (1995) reports that these mudflow deposits create an aquitardthat confines the underlying aquifers and perches water tables in the overlying aquifers.
Hydrologic Investigations
Dinicola (1990) found that glacial till and mudflow deposits produced recharge rates much lessthan outwash deposits. After initial infiltration water generally moves laterally along the top ofthe contact until it intercepts a stream channel of land surface. Such seeps were observed alongthe White River bluffs.
Rates of discharge to Soos Creek Basin in Southwest King County are reported as .3 to 3ft3/sec./mi. (Morgan and Jones, 1996). Unfortunately rates of discharge to major streams are notavailable.
In a setting quite similar to the White River bypass reach, hydraulic gradient showed an expecteddown-valley gradient, but not a strong gradient towards the river. Unfortunately this observationwas during May 1980 and does not represent low flow conditions (Lum et al., 1984).
Groundwater Quality Information
There are over 180 public water supply wells within 2 miles of the White River bypass channel.Monitoring data from these wells should give and general indication of nitrate concentration inthe deeper groundwater systems. 1994 data from twenty Class 1 & 2 public water supply wellsshowed nitrate concentration ranging from 0 to 4.8 mg/l Nitrate Nitrogen. More recent data froma larger sampling of wells is currently being acquired from Washington Department of Health.
Groundwater data from wells around the Muckleshoot Indian Reservation showed nitrate valuesranging from 0 to 9 mg/l Nitrate Nitrogen. The highest values were reported in a well only 25 ftdeep (Applied Geotechnology 1991).
Conclusions
Available information indicates that downward movement of nutrients from nonpoint sources(dairies, septic systems, fertilizers, etc.) surrounding the bypass reach is probably inhibited by thepresence of the Osceola Mudflow aquitard which forces nutrients in the water table aquifer to bedischarged laterally to tributary streams.
The rate of discharge of groundwater directly to the White River bypass reach is unknown andwould probably be fairly difficult to measure.
DRAFT – DO NOT CITE OR QUOTE
References – Appendix B
Applied Geotechnology Inc. 1991. Supplemental Hydrogeologic Evaluation and InitialGroundwater Management Planning Muckleshoot Indian Reservation.
Dinicola, R. S., 1990. Characterization and simulation of rainfall-runoff relations for headwaterbasins in western King and Snohomish Counties, Washington: U.S. Geological SurveyWater-Resources Investigations Report 89-4052, 52 p.
Dragonvich, J. D., P.T. Pringle, T. J. Walsh, 1994. Extent and Geometry of the Mid-HoloceneOsceola Mudflow in the Puget Lowland--Implications for Holocene Sedimentation andPaleography. Washington Geology, Vol. 22, No. 3, p. 3-26.
Lum, W.E., R.C. Alvord, and B.W. Drost, 1984. Availability of Water from the Alluvial Aquiferin Port of the Green River Valley, King County, Washington. U.S. Geological SurveyWater Resources Investigations Report 83-4178, Tacoma, WA.
Morgan, D.S., and J.L. Jones, 1996. Numerical Model Analysis of the Effects of Ground-WaterWithdrawals On Discharge to Streams and Springs in Small Basins Typical of the PugetSound Lowland, Washington, U.S. Geological Survey Open File Report 95-470, Tacoma,WA, 73 p.
Washington Department of Ecology, 1995. Draft Initial Watershed Assessment of WaterResources Inventory Area 10, Puyallup-White Watershed, Open-File Technical Report95-08, Washington Dept. of Ecology, Olympia, WA, 69 p.
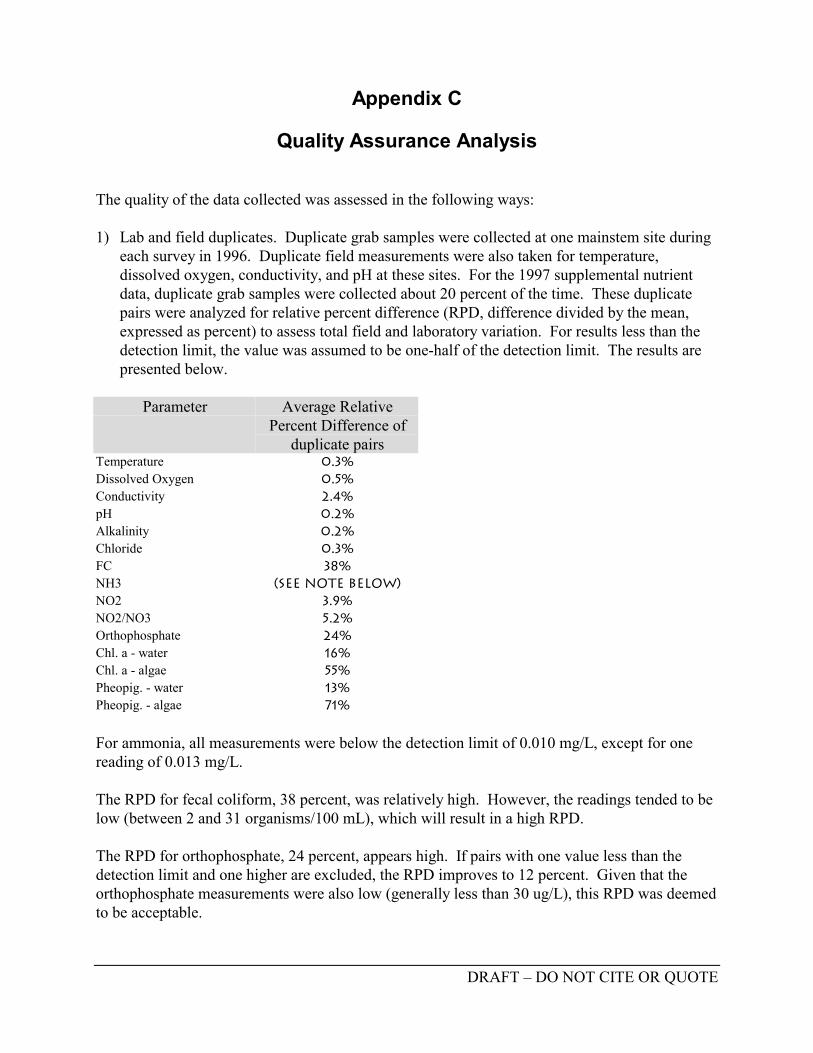
DRAFT – DO NOT CITE OR QUOTE
Appendix C
Quality Assurance Analysis
The quality of the data collected was assessed in the following ways:
1) Lab and field duplicates. Duplicate grab samples were collected at one mainstem site duringeach survey in 1996. Duplicate field measurements were also taken for temperature,dissolved oxygen, conductivity, and pH at these sites. For the 1997 supplemental nutrientdata, duplicate grab samples were collected about 20 percent of the time. These duplicatepairs were analyzed for relative percent difference (RPD, difference divided by the mean,expressed as percent) to assess total field and laboratory variation. For results less than thedetection limit, the value was assumed to be one-half of the detection limit. The results arepresented below.
Parameter Average Relative
Percent Difference ofduplicate pairs
Temperature 0.3% Dissolved Oxygen 0.5% Conductivity 2.4% pH 0.2% Alkalinity 0.2% Chloride 0.3% FC 38% NH3 (see note below) NO2 3.9% NO2/NO3 5.2% Orthophosphate 24% Chl. a - water 16% Chl. a - algae 55% Pheopig. - water 13% Pheopig. - algae 71%
For ammonia, all measurements were below the detection limit of 0.010 mg/L, except for onereading of 0.013 mg/L. The RPD for fecal coliform, 38 percent, was relatively high. However, the readings tended to below (between 2 and 31 organisms/100 mL), which will result in a high RPD. The RPD for orthophosphate, 24 percent, appears high. If pairs with one value less than thedetection limit and one higher are excluded, the RPD improves to 12 percent. Given that theorthophosphate measurements were also low (generally less than 30 ug/L), this RPD was deemedto be acceptable.
DRAFT – DO NOT CITE OR QUOTE
1) Comparison of total vs. sum of components for nitrogen and phosphorus. Total nitrogen wascompared to the sum of ammonia and nitrate+nitrite. Total phosphorus was compared toorthophosphate. If the total was less than the sum of the components, the results wereinvestigated further. This comparison revealed a problem with orthophosphate data from the7/31/96 survey of mainstem sites: in each case, the orthophosphate was significantly higherthan the total phosphorus. In addition, the orthophosphate values were much greater than anyother date. Therefore, these orthophosphate values for the 7/31/96 data set were rejected.
2) Hydrolab data – The hydrolabs were usually deployed for about 48 hours. The data were
verified by the following QA checks:
a) Pre-calibration of dissolved oxygen, temperature, conductivity, and pH prior totraveling to the site.
b) Field measurements of dissolved oxygen and pH at the time of deployment and thetime of retrieval.
c) Field measurements of dissolved oxygen, temperature, conductivity, and pH duringthe normal water quality survey routine (usually roughly mid-way through the 48 hours).
d) Post-calibration after traveling back from the site.
The results showed that some data sets needed to be rejected due to hydrolab drift for dissolvedoxygen and pH. If the hydrolab pH measurement differed by more than 0.5 pH units comparedto the field meter reading, the data set was rejected.
Of the remaining data sets, the average difference between the hydrolab and field meter readingfor pH was 0.24 standard units. This comparison also showed that the hydrolab tended to bebiased low, compared to the field meter reading, with an average bias of –0.15 standard units.
Data collected in 1990 was checked for adherence to quality assurance protocols. Three pHvalues were rejected due to lack of quality assurance documentation.
All of the data not rejected for reasons listed above were considered to be of acceptable qualityfor this study.

DRAFT – DO NOT CITE OR QUOTE
Appendix D
Project Data
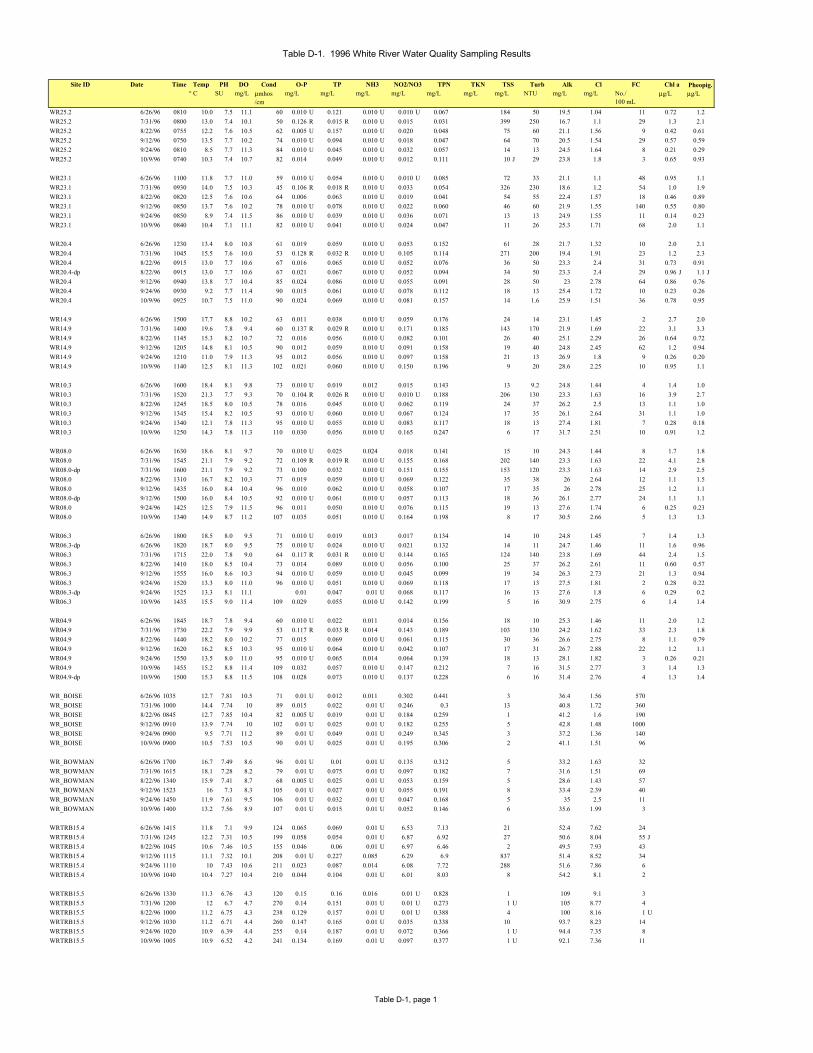
Table D-1. 1996 White River Water Quality Sampling Results
Site ID Date Time Temp PH DO Cond O-P TP NH3 NO2/NO3 TPN TKN TSS Turb Alk Cl FC Chl a° C SU mg/L µmhos
/cmmg/L mg/L mg/L mg/L mg/L mg/L mg/L NTU mg/L mg/L No./
100 mLµg/L µg/L
WR25.2 6/26/96 0810 10.0 7.5 11.1 60 0.010 U 0.121 0.010 U 0.010 U 0.067 184 50 19.5 1.04 11 0.72 1.2WR25.2 7/31/96 0800 13.0 7.4 10.1 50 0.126 R 0.015 R 0.010 U 0.015 0.031 399 250 16.7 1.1 29 1.3 2.1WR25.2 8/22/96 0755 12.2 7.6 10.5 62 0.005 U 0.157 0.010 U 0.020 0.048 75 60 21.1 1.56 9 0.42 0.61WR25.2 9/12/96 0750 13.5 7.7 10.2 74 0.010 U 0.094 0.010 U 0.018 0.047 64 70 20.5 1.54 29 0.57 0.59WR25.2 9/24/96 0810 8.5 7.7 11.3 84 0.010 U 0.045 0.010 U 0.032 0.057 14 13 24.5 1.64 8 0.21 0.29WR25.2 10/9/96 0740 10.3 7.4 10.7 82 0.014 0.049 0.010 U 0.012 0.111 10 J 29 23.8 1.8 3 0.65 0.93
WR23.1 6/26/96 1100 11.8 7.7 11.0 59 0.010 U 0.054 0.010 U 0.010 U 0.085 72 33 21.1 1.1 48 0.95 1.1WR23.1 7/31/96 0930 14.0 7.5 10.3 45 0.106 R 0.018 R 0.010 U 0.033 0.054 326 230 18.6 1.2 54 1.0 1.9WR23.1 8/22/96 0820 12.5 7.6 10.6 64 0.006 0.063 0.010 U 0.019 0.041 54 55 22.4 1.57 18 0.46 0.89WR23.1 9/12/96 0850 13.7 7.6 10.2 78 0.010 U 0.078 0.010 U 0.022 0.060 46 60 21.9 1.55 140 0.55 0.80WR23.1 9/24/96 0850 8.9 7.4 11.5 86 0.010 U 0.039 0.010 U 0.036 0.071 13 13 24.9 1.55 11 0.14 0.23WR23.1 10/9/96 0840 10.4 7.1 11.1 82 0.010 U 0.041 0.010 U 0.024 0.047 11 26 25.3 1.71 68 2.0 1.1
WR20.4 6/26/96 1230 13.4 8.0 10.8 61 0.019 0.059 0.010 U 0.053 0.152 61 28 21.7 1.32 10 2.0 2.1WR20.4 7/31/96 1045 15.5 7.6 10.0 53 0.128 R 0.032 R 0.010 U 0.105 0.114 271 200 19.4 1.91 23 1.2 2.3WR20.4 8/22/96 0915 13.0 7.7 10.6 67 0.016 0.065 0.010 U 0.052 0.076 36 50 23.3 2.4 31 0.73 0.91WR20.4-dp 8/22/96 0915 13.0 7.7 10.6 67 0.021 0.067 0.010 U 0.052 0.094 34 50 23.3 2.4 29 0.96 J 1.1 JWR20.4 9/12/96 0940 13.8 7.7 10.4 85 0.024 0.086 0.010 U 0.055 0.091 28 50 23 2.78 64 0.86 0.76WR20.4 9/24/96 0930 9.2 7.7 11.4 90 0.015 0.061 0.010 U 0.078 0.112 18 13 25.4 1.72 10 0.23 0.26WR20.4 10/9/96 0925 10.7 7.5 11.0 90 0.024 0.069 0.010 U 0.081 0.157 14 1.6 25.9 1.51 36 0.78 0.95
WR14.9 6/26/96 1500 17.7 8.8 10.2 63 0.011 0.038 0.010 U 0.059 0.176 24 14 23.1 1.45 2 2.7 2.0WR14.9 7/31/96 1400 19.6 7.8 9.4 60 0.137 R 0.029 R 0.010 U 0.171 0.185 143 170 21.9 1.69 22 3.1 3.3WR14.9 8/22/96 1145 15.3 8.2 10.7 72 0.016 0.056 0.010 U 0.082 0.101 26 40 25.1 2.29 26 0.64 0.72WR14.9 9/12/96 1205 14.8 8.1 10.5 90 0.012 0.059 0.010 U 0.091 0.158 19 40 24.8 2.45 62 1.2 0.94WR14.9 9/24/96 1210 11.0 7.9 11.3 95 0.012 0.056 0.010 U 0.097 0.158 21 13 26.9 1.8 9 0.26 0.20WR14.9 10/9/96 1140 12.5 8.1 11.3 102 0.021 0.060 0.010 U 0.150 0.196 9 20 28.6 2.25 10 0.95 1.1
WR10.3 6/26/96 1600 18.4 8.1 9.8 73 0.010 U 0.019 0.012 0.015 0.143 13 9.2 24.8 1.44 4 1.4 1.0WR10.3 7/31/96 1520 21.3 7.7 9.3 70 0.104 R 0.026 R 0.010 U 0.010 U 0.188 206 130 23.3 1.63 16 3.9 2.7WR10.3 8/22/96 1245 18.5 8.0 10.5 78 0.016 0.045 0.010 U 0.062 0.119 24 37 26.2 2.5 13 1.1 1.0WR10.3 9/12/96 1345 15.4 8.2 10.5 93 0.010 U 0.060 0.010 U 0.067 0.124 17 35 26.1 2.64 31 1.1 1.0WR10.3 9/24/96 1340 12.1 7.8 11.3 95 0.010 U 0.055 0.010 U 0.083 0.117 18 13 27.4 1.81 7 0.28 0.18WR10.3 10/9/96 1250 14.3 7.8 11.3 110 0.030 0.056 0.010 U 0.165 0.247 6 17 31.7 2.51 10 0.91 1.2
WR08.0 6/26/96 1630 18.6 8.1 9.7 70 0.010 U 0.025 0.024 0.018 0.141 15 10 24.3 1.44 8 1.7 1.8WR08.0 7/31/96 1545 21.1 7.9 9.2 72 0.109 R 0.019 R 0.010 U 0.155 0.168 202 140 23.3 1.63 22 4.1 2.8WR08.0-dp 7/31/96 1600 21.1 7.9 9.2 73 0.100 0.032 0.010 U 0.151 0.155 153 120 23.3 1.63 14 2.9 2.5WR08.0 8/22/96 1310 16.7 8.2 10.3 77 0.019 0.059 0.010 U 0.069 0.122 35 38 26 2.64 12 1.1 1.5WR08.0 9/12/96 1435 16.0 8.4 10.4 96 0.010 0.062 0.010 U 0.058 0.107 17 35 26 2.78 25 1.2 1.1WR08.0-dp 9/12/96 1500 16.0 8.4 10.5 92 0.010 U 0.061 0.010 U 0.057 0.113 18 36 26.1 2.77 24 1.1 1.1WR08.0 9/24/96 1425 12.5 7.9 11.5 96 0.011 0.050 0.010 U 0.076 0.115 19 13 27.6 1.74 6 0.25 0.23WR08.0 10/9/96 1340 14.9 8.7 11.2 107 0.035 0.051 0.010 U 0.164 0.198 8 17 30.5 2.66 5 1.3 1.3
WR06.3 6/26/96 1800 18.5 8.0 9.5 71 0.010 U 0.019 0.013 0.017 0.134 14 10 24.8 1.45 7 1.4 1.3WR06.3-dp 6/26/96 1820 18.7 8.0 9.5 75 0.010 U 0.024 0.010 U 0.021 0.132 14 11 24.7 1.46 11 1.6 0.96WR06.3 7/31/96 1715 22.0 7.8 9.0 64 0.117 R 0.031 R 0.010 U 0.144 0.165 124 140 23.8 1.69 44 2.4 1.5WR06.3 8/22/96 1410 18.0 8.5 10.4 73 0.014 0.089 0.010 U 0.056 0.100 25 37 26.2 2.61 11 0.60 0.57WR06.3 9/12/96 1555 16.0 8.6 10.3 94 0.010 U 0.059 0.010 U 0.045 0.099 19 34 26.3 2.73 21 1.3 0.94WR06.3 9/24/96 1520 13.3 8.0 11.0 96 0.010 U 0.051 0.010 U 0.069 0.118 17 13 27.5 1.81 2 0.28 0.22WR06.3-dp 9/24/96 1525 13.3 8.1 11.1 0.01 0.047 0.01 U 0.068 0.117 16 13 27.6 1.8 6 0.29 0.2WR06.3 10/9/96 1435 15.5 9.0 11.4 109 0.029 0.055 0.010 U 0.142 0.199 5 16 30.9 2.75 6 1.4 1.4
WR04.9 6/26/96 1845 18.7 7.8 9.4 60 0.010 U 0.022 0.011 0.014 0.156 18 10 25.3 1.46 11 2.0 1.2WR04.9 7/31/96 1730 22.2 7.9 9.9 53 0.117 R 0.033 R 0.014 0.143 0.189 103 130 24.2 1.62 33 2.3 1.8WR04.9 8/22/96 1440 18.2 8.0 10.2 77 0.015 0.069 0.010 U 0.061 0.115 30 36 26.6 2.75 8 1.1 0.79WR04.9 9/12/96 1620 16.2 8.5 10.3 95 0.010 U 0.064 0.010 U 0.042 0.107 17 31 26.7 2.88 22 1.2 1.1WR04.9 9/24/96 1550 13.5 8.0 11.0 95 0.010 U 0.065 0.014 0.064 0.139 18 13 28.1 1.82 3 0.26 0.21WR04.9 10/9/96 1455 15.2 8.8 11.4 109 0.032 0.057 0.010 U 0.147 0.212 7 16 31.5 2.77 3 1.4 1.3WR04.9-dp 10/9/96 1500 15.3 8.8 11.5 108 0.028 0.073 0.010 U 0.137 0.228 6 16 31.4 2.76 4 1.3 1.4
WR_BOISE 6/26/96 1035 12.7 7.81 10.5 71 0.01 U 0.012 0.011 0.302 0.441 3 36.4 1.56 570WR_BOISE 7/31/96 1000 14.4 7.74 10 89 0.015 0.022 0.01 U 0.246 0.3 13 40.8 1.72 360WR_BOISE 8/22/96 0845 12.7 7.85 10.4 82 0.005 U 0.019 0.01 U 0.184 0.259 1 41.2 1.6 190WR_BOISE 9/12/96 0910 13.9 7.74 10 102 0.01 U 0.025 0.01 U 0.182 0.255 5 42.8 1.48 1000WR_BOISE 9/24/96 0900 9.5 7.71 11.2 89 0.01 U 0.049 0.01 U 0.249 0.345 3 37.2 1.36 140WR_BOISE 10/9/96 0900 10.5 7.53 10.5 90 0.01 U 0.025 0.01 U 0.195 0.306 2 41.1 1.51 96
WR_BOWMAN 6/26/96 1700 16.7 7.49 8.6 96 0.01 U 0.01 0.01 U 0.135 0.312 5 33.2 1.63 32WR_BOWMAN 7/31/96 1615 18.1 7.28 8.2 79 0.01 U 0.075 0.01 U 0.097 0.182 7 31.6 1.51 69WR_BOWMAN 8/22/96 1340 15.9 7.41 8.7 68 0.005 U 0.025 0.01 U 0.053 0.159 5 28.6 1.43 57WR_BOWMAN 9/12/96 1523 16 7.3 8.3 105 0.01 U 0.027 0.01 U 0.055 0.191 8 33.4 2.39 40WR_BOWMAN 9/24/96 1450 11.9 7.61 9.5 106 0.01 U 0.032 0.01 U 0.047 0.168 5 35 2.5 11WR_BOWMAN 10/9/96 1400 13.2 7.56 8.9 107 0.01 U 0.015 0.01 U 0.052 0.146 6 35.6 1.99 3
WRTRB15.4 6/26/96 1415 11.8 7.1 9.9 124 0.065 0.069 0.01 U 6.53 7.13 21 52.4 7.62 24WRTRB15.4 7/31/96 1245 12.2 7.31 10.5 199 0.058 0.054 0.01 U 6.87 6.92 27 50.6 8.04 55 JWRTRB15.4 8/22/96 1045 10.6 7.46 10.5 155 0.046 0.06 0.01 U 6.97 6.46 2 49.5 7.93 43WRTRB15.4 9/12/96 1115 11.1 7.32 10.1 208 0.01 U 0.227 0.085 6.29 6.9 837 51.4 8.52 34WRTRB15.4 9/24/96 1110 10 7.43 10.6 211 0.023 0.087 0.014 6.08 7.72 288 51.6 7.86 6WRTRB15.4 10/9/96 1040 10.4 7.27 10.4 210 0.044 0.104 0.01 U 6.01 8.03 8 54.2 8.1 2
WRTRB15.5 6/26/96 1330 11.3 6.76 4.3 120 0.15 0.16 0.016 0.01 U 0.828 1 109 9.1 3WRTRB15.5 7/31/96 1200 12 6.7 4.7 270 0.14 0.151 0.01 U 0.01 U 0.273 1 U 105 8.77 4WRTRB15.5 8/22/96 1000 11.2 6.75 4.3 238 0.129 0.157 0.01 U 0.01 U 0.388 4 100 8.16 1 UWRTRB15.5 9/12/96 1030 11.2 6.71 4.4 260 0.147 0.165 0.01 U 0.035 0.338 10 93.7 8.23 14WRTRB15.5 9/24/96 1020 10.9 6.39 4.4 255 0.14 0.187 0.01 U 0.072 0.366 1 U 94.4 7.35 8WRTRB15.5 10/9/96 1005 10.9 6.52 4.2 241 0.134 0.169 0.01 U 0.097 0.377 1 U 92.1 7.36 11
Pheopig.
Table D-1, page 1
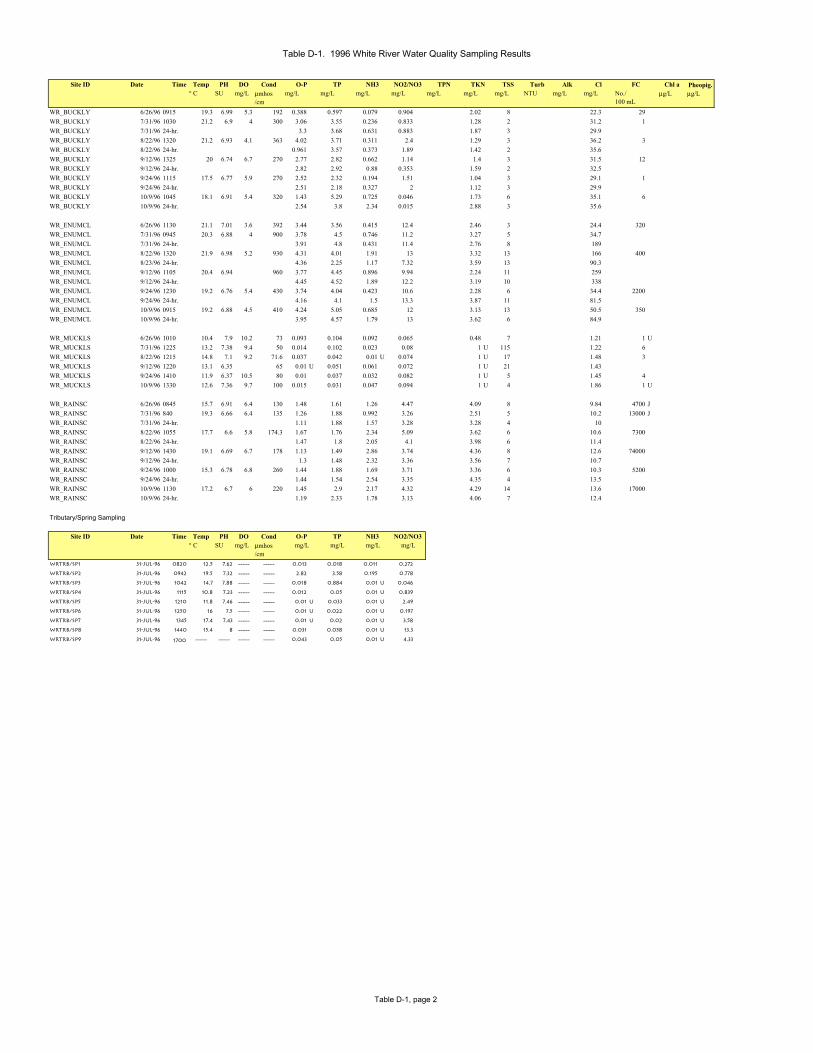
Table D-1. 1996 White River Water Quality Sampling Results
Site ID Date Time Temp PH DO Cond O-P TP NH3 NO2/NO3 TPN TKN TSS Turb Alk Cl FC Chl a° C SU mg/L µmhos
/cmmg/L mg/L mg/L mg/L mg/L mg/L mg/L NTU mg/L mg/L No./
100 mLµg/L µg/L
Pheopig.
WR_BUCKLY 6/26/96 0915 19.3 6.99 5.3 192 0.388 0.597 0.079 0.904 2.02 8 22.3 29WR_BUCKLY 7/31/96 1030 21.2 6.9 4 300 3.06 3.55 0.236 0.833 1.28 2 31.2 1WR_BUCKLY 7/31/96 24-hr. 3.3 3.68 0.631 0.883 1.87 3 29.9WR_BUCKLY 8/22/96 1320 21.2 6.93 4.1 363 4.02 3.71 0.311 2.4 1.29 3 36.2 3WR_BUCKLY 8/22/96 24-hr. 0.961 3.57 0.373 1.89 1.42 2 35.6WR_BUCKLY 9/12/96 1325 20 6.74 6.7 270 2.77 2.82 0.662 1.14 1.4 3 31.5 12WR_BUCKLY 9/12/96 24-hr. 2.82 2.92 0.88 0.353 1.59 2 32.5WR_BUCKLY 9/24/96 1115 17.5 6.77 5.9 270 2.52 2.32 0.194 1.51 1.04 3 29.1 1WR_BUCKLY 9/24/96 24-hr. 2.51 2.18 0.327 2 1.12 3 29.9WR_BUCKLY 10/9/96 1045 18.1 6.91 5.4 320 1.43 5.29 0.725 0.046 1.73 6 35.1 6WR_BUCKLY 10/9/96 24-hr. 2.54 3.8 2.34 0.015 2.88 3 35.6
WR_ENUMCL 6/26/96 1130 21.1 7.01 3.6 392 3.44 3.56 0.415 12.4 2.46 3 24.4 320WR_ENUMCL 7/31/96 0945 20.3 6.88 4 900 3.78 4.5 0.746 11.2 3.27 5 34.7WR_ENUMCL 7/31/96 24-hr. 3.91 4.8 0.431 11.4 2.76 8 189WR_ENUMCL 8/22/96 1320 21.9 6.98 5.2 930 4.31 4.01 1.91 13 3.32 13 166 400WR_ENUMCL 8/23/96 24-hr. 4.36 2.25 1.17 7.32 3.59 13 90.3WR_ENUMCL 9/12/96 1105 20.4 6.94 960 3.77 4.45 0.896 9.94 2.24 11 259WR_ENUMCL 9/12/96 24-hr. 4.45 4.52 1.89 12.2 3.19 10 338WR_ENUMCL 9/24/96 1230 19.2 6.76 5.4 430 3.74 4.04 0.423 10.6 2.28 6 34.4 2200WR_ENUMCL 9/24/96 24-hr. 4.16 4.1 1.5 13.3 3.87 11 81.5WR_ENUMCL 10/9/96 0915 19.2 6.88 4.5 410 4.24 5.05 0.685 12 3.13 13 50.5 350WR_ENUMCL 10/9/96 24-hr. 3.95 4.57 1.79 13 3.62 6 84.9
WR_MUCKLS 6/26/96 1010 10.4 7.9 10.2 73 0.093 0.104 0.092 0.065 0.48 7 1.21 1 UWR_MUCKLS 7/31/96 1225 13.2 7.38 9.4 50 0.014 0.102 0.023 0.08 1 U 115 1.22 6WR_MUCKLS 8/22/96 1215 14.8 7.1 9.2 71.6 0.037 0.042 0.01 U 0.074 1 U 17 1.48 3WR_MUCKLS 9/12/96 1220 13.1 6.35 65 0.01 U 0.051 0.061 0.072 1 U 21 1.43WR_MUCKLS 9/24/96 1410 11.9 6.37 10.5 80 0.01 0.037 0.032 0.082 1 U 5 1.45 4WR_MUCKLS 10/9/96 1330 12.6 7.36 9.7 100 0.015 0.031 0.047 0.094 1 U 4 1.86 1 U
WR_RAINSC 6/26/96 0845 15.7 6.91 6.4 130 1.48 1.61 1.26 4.47 4.09 8 9.84 4700 JWR_RAINSC 7/31/96 840 19.3 6.66 6.4 135 1.26 1.88 0.992 3.26 2.51 5 10.2 13000 JWR_RAINSC 7/31/96 24-hr. 1.11 1.88 1.57 3.28 3.28 4 10WR_RAINSC 8/22/96 1055 17.7 6.6 5.8 174.3 1.67 1.76 2.34 5.09 3.62 6 10.6 7300WR_RAINSC 8/22/96 24-hr. 1.47 1.8 2.05 4.1 3.98 6 11.4WR_RAINSC 9/12/96 1430 19.1 6.69 6.7 178 1.13 1.49 2.86 3.74 4.36 8 12.6 74000WR_RAINSC 9/12/96 24-hr. 1.3 1.48 2.32 3.36 3.56 7 10.7WR_RAINSC 9/24/96 1000 15.3 6.78 6.8 260 1.44 1.88 1.69 3.71 3.36 6 10.3 5200WR_RAINSC 9/24/96 24-hr. 1.44 1.54 2.54 3.35 4.35 4 13.5WR_RAINSC 10/9/96 1130 17.2 6.7 6 220 1.45 2.9 2.17 4.32 4.29 14 13.6 17000WR_RAINSC 10/9/96 24-hr. 1.19 2.33 1.78 3.13 4.06 7 12.4
Tributary/Spring Sampling
Site ID Date Time Temp PH DO Cond O-P TP NH3 NO2/NO3° C SU mg/L µmhos
/cmWRtrb/sp1 31-Jul-96 0820 12.5 7.62 ----- ----- 0.013 0.018 0.011 0.272
WRtrb/sp2 31-Jul-96 0942 19.5 7.32 ----- ----- 2.82 3.58 0.195 0.778
WRtrb/sp3 31-Jul-96 1042 14.7 7.88 ----- ----- 0.018 0.884 0.01 U 0.046
WRtrb/sp4 31-Jul-96 1115 10.8 7.23 ----- ----- 0.012 0.05 0.01 U 0.839
WRtrb/sp5 31-Jul-96 1210 11.8 7.46 ----- ----- 0.01 U 0.033 0.01 U 2.49
WRtrb/sp6 31-Jul-96 1250 16 7.5 ----- ----- 0.01 U 0.022 0.01 U 0.197
WRtrb/sp7 31-Jul-96 1345 17.4 7.43 ----- ----- 0.01 U 0.02 0.01 U 3.58
WRtrb/sp8 31-Jul-96 1440 15.4 8 ----- ----- 0.031 0.058 0.01 U 13.3
WRtrb/sp9 31-Jul-96 1700 ----- ----- ----- ----- 0.043 0.05 0.01 U 4.33
mg/L mg/L mg/L mg/L
Table D-1, page 2
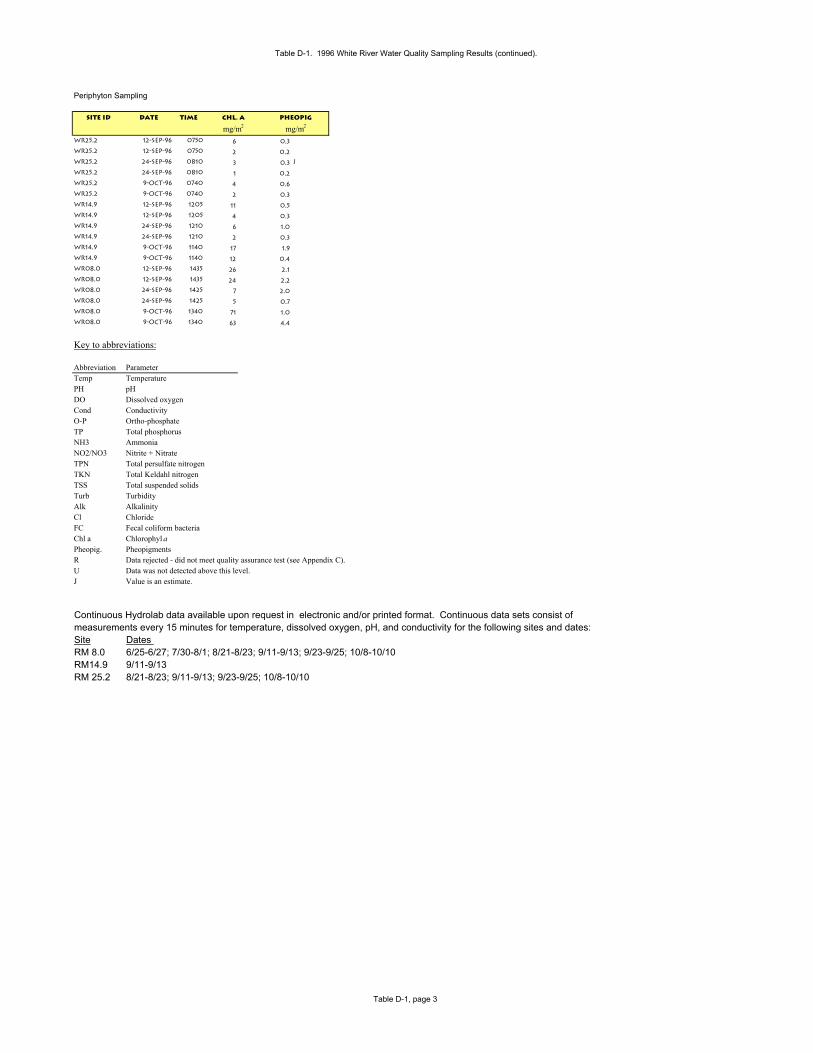
Table D-1. 1996 White River Water Quality Sampling Results (continued).
Periphyton Sampling
Site ID Date Time Chl. a PHEOPIG
WR25.2 12-Sep-96 0750 6 0.3
WR25.2 12-Sep-96 0750 2 0.2
WR25.2 24-Sep-96 0810 3 0.3 J
WR25.2 24-Sep-96 0810 1 0.2
WR25.2 9-Oct-96 0740 4 0.6
WR25.2 9-Oct-96 0740 2 0.3
WR14.9 12-Sep-96 1205 11 0.5
WR14.9 12-Sep-96 1205 4 0.3
WR14.9 24-Sep-96 1210 6 1.0
WR14.9 24-Sep-96 1210 2 0.3
WR14.9 9-Oct-96 1140 17 1.9
WR14.9 9-Oct-96 1140 12 0.4
WR08.0 12-Sep-96 1435 26 2.1
WR08.0 12-Sep-96 1435 24 2.2
WR08.0 24-Sep-96 1425 7 2.0
WR08.0 24-Sep-96 1425 5 0.7
WR08.0 9-Oct-96 1340 71 1.0
WR08.0 9-Oct-96 1340 63 4.4
Key to abbreviations:
Abbreviation ParameterTemp TemperaturePH pHDO Dissolved oxygenCond ConductivityO-P Ortho-phosphateTP Total phosphorusNH3 AmmoniaNO2/NO3 Nitrite + NitrateTPN Total persulfate nitrogenTKN Total Keldahl nitrogenTSS Total suspended solidsTurb TurbidityAlk AlkalinityCl ChlorideFC Fecal coliform bacteriaChl a Chlorophyl aPheopig. PheopigmentsR Data rejected - did not meet quality assurance test (see Appendix C).U Data was not detected above this level.J Value is an estimate.
Continuous Hydrolab data available upon request in electronic and/or printed format. Continuous data sets consist ofmeasurements every 15 minutes for temperature, dissolved oxygen, pH, and conductivity for the following sites and dates:Site Dates RM 8.0 6/25-6/27; 7/30-8/1; 8/21-8/23; 9/11-9/13; 9/23-9/25; 10/8-10/10RM14.9 9/11-9/13RM 25.2 8/21-8/23; 9/11-9/13; 9/23-9/25; 10/8-10/10
mg/m2 mg/m2
Table D-1, page 3
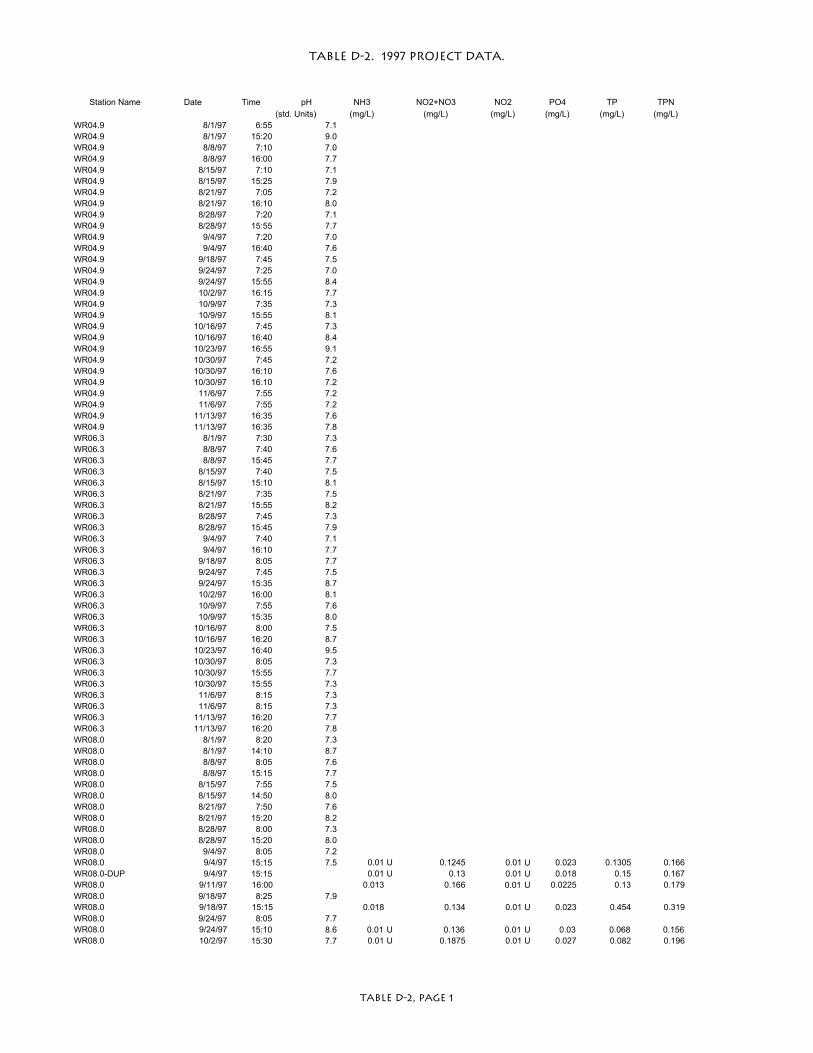
Table D-2. 1997 Project Data.
Station Name Date Time pH NH3 NO2+NO3 NO2 PO4 TP TPN(std. Units) (mg/L) (mg/L) (mg/L) (mg/L) (mg/L) (mg/L)
WR04.9 8/1/97 6:55 7.1WR04.9 8/1/97 15:20 9.0WR04.9 8/8/97 7:10 7.0WR04.9 8/8/97 16:00 7.7WR04.9 8/15/97 7:10 7.1WR04.9 8/15/97 15:25 7.9WR04.9 8/21/97 7:05 7.2WR04.9 8/21/97 16:10 8.0WR04.9 8/28/97 7:20 7.1WR04.9 8/28/97 15:55 7.7WR04.9 9/4/97 7:20 7.0WR04.9 9/4/97 16:40 7.6WR04.9 9/18/97 7:45 7.5WR04.9 9/24/97 7:25 7.0WR04.9 9/24/97 15:55 8.4WR04.9 10/2/97 16:15 7.7WR04.9 10/9/97 7:35 7.3WR04.9 10/9/97 15:55 8.1WR04.9 10/16/97 7:45 7.3WR04.9 10/16/97 16:40 8.4WR04.9 10/23/97 16:55 9.1WR04.9 10/30/97 7:45 7.2WR04.9 10/30/97 16:10 7.6WR04.9 10/30/97 16:10 7.2WR04.9 11/6/97 7:55 7.2WR04.9 11/6/97 7:55 7.2WR04.9 11/13/97 16:35 7.6WR04.9 11/13/97 16:35 7.8WR06.3 8/1/97 7:30 7.3WR06.3 8/8/97 7:40 7.6WR06.3 8/8/97 15:45 7.7WR06.3 8/15/97 7:40 7.5WR06.3 8/15/97 15:10 8.1WR06.3 8/21/97 7:35 7.5WR06.3 8/21/97 15:55 8.2WR06.3 8/28/97 7:45 7.3WR06.3 8/28/97 15:45 7.9WR06.3 9/4/97 7:40 7.1WR06.3 9/4/97 16:10 7.7WR06.3 9/18/97 8:05 7.7WR06.3 9/24/97 7:45 7.5WR06.3 9/24/97 15:35 8.7WR06.3 10/2/97 16:00 8.1WR06.3 10/9/97 7:55 7.6WR06.3 10/9/97 15:35 8.0WR06.3 10/16/97 8:00 7.5WR06.3 10/16/97 16:20 8.7WR06.3 10/23/97 16:40 9.5WR06.3 10/30/97 8:05 7.3WR06.3 10/30/97 15:55 7.7WR06.3 10/30/97 15:55 7.3WR06.3 11/6/97 8:15 7.3WR06.3 11/6/97 8:15 7.3WR06.3 11/13/97 16:20 7.7WR06.3 11/13/97 16:20 7.8WR08.0 8/1/97 8:20 7.3WR08.0 8/1/97 14:10 8.7WR08.0 8/8/97 8:05 7.6WR08.0 8/8/97 15:15 7.7WR08.0 8/15/97 7:55 7.5WR08.0 8/15/97 14:50 8.0WR08.0 8/21/97 7:50 7.6WR08.0 8/21/97 15:20 8.2WR08.0 8/28/97 8:00 7.3WR08.0 8/28/97 15:20 8.0WR08.0 9/4/97 8:05 7.2WR08.0 9/4/97 15:15 7.5 0.01 U 0.1245 0.01 U 0.023 0.1305 0.166WR08.0-DUP 9/4/97 15:15 0.01 U 0.13 0.01 U 0.018 0.15 0.167WR08.0 9/11/97 16:00 0.013 0.166 0.01 U 0.0225 0.13 0.179WR08.0 9/18/97 8:25 7.9WR08.0 9/18/97 15:15 0.018 0.134 0.01 U 0.023 0.454 0.319WR08.0 9/24/97 8:05 7.7WR08.0 9/24/97 15:10 8.6 0.01 U 0.136 0.01 U 0.03 0.068 0.156WR08.0 10/2/97 15:30 7.7 0.01 U 0.1875 0.01 U 0.027 0.082 0.196
Table D-2, page 1
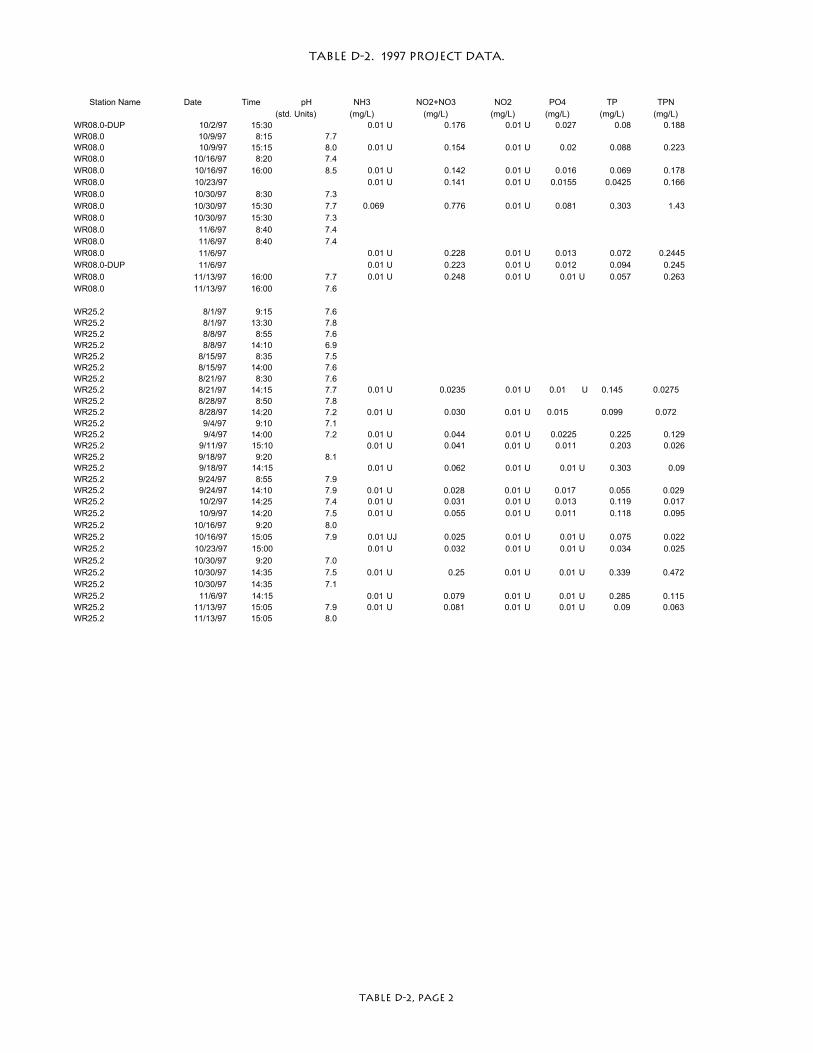
Table D-2. 1997 Project Data.
Station Name Date Time pH NH3 NO2+NO3 NO2 PO4 TP TPN(std. Units) (mg/L) (mg/L) (mg/L) (mg/L) (mg/L) (mg/L)
WR08.0-DUP 10/2/97 15:30 0.01 U 0.176 0.01 U 0.027 0.08 0.188WR08.0 10/9/97 8:15 7.7WR08.0 10/9/97 15:15 8.0 0.01 U 0.154 0.01 U 0.02 0.088 0.223WR08.0 10/16/97 8:20 7.4WR08.0 10/16/97 16:00 8.5 0.01 U 0.142 0.01 U 0.016 0.069 0.178WR08.0 10/23/97 0.01 U 0.141 0.01 U 0.0155 0.0425 0.166WR08.0 10/30/97 8:30 7.3 WR08.0 10/30/97 15:30 7.7 0.069 0.776 0.01 U 0.081 0.303 1.43WR08.0 10/30/97 15:30 7.3 WR08.0 11/6/97 8:40 7.4 WR08.0 11/6/97 8:40 7.4 WR08.0 11/6/97 0.01 U 0.228 0.01 U 0.013 0.072 0.2445WR08.0-DUP 11/6/97 0.01 U 0.223 0.01 U 0.012 0.094 0.245WR08.0 11/13/97 16:00 7.7 0.01 U 0.248 0.01 U 0.01 U 0.057 0.263WR08.0 11/13/97 16:00 7.6
WR25.2 8/1/97 9:15 7.6WR25.2 8/1/97 13:30 7.8WR25.2 8/8/97 8:55 7.6WR25.2 8/8/97 14:10 6.9WR25.2 8/15/97 8:35 7.5WR25.2 8/15/97 14:00 7.6WR25.2 8/21/97 8:30 7.6WR25.2 8/21/97 14:15 7.7 0.01 U 0.0235 0.01 U 0.01 U 0.145 0.0275WR25.2 8/28/97 8:50 7.8WR25.2 8/28/97 14:20 7.2 0.01 U 0.030 0.01 U 0.015 0.099 0.072WR25.2 9/4/97 9:10 7.1WR25.2 9/4/97 14:00 7.2 0.01 U 0.044 0.01 U 0.0225 0.225 0.129WR25.2 9/11/97 15:10 0.01 U 0.041 0.01 U 0.011 0.203 0.026WR25.2 9/18/97 9:20 8.1WR25.2 9/18/97 14:15 0.01 U 0.062 0.01 U 0.01 U 0.303 0.09WR25.2 9/24/97 8:55 7.9WR25.2 9/24/97 14:10 7.9 0.01 U 0.028 0.01 U 0.017 0.055 0.029WR25.2 10/2/97 14:25 7.4 0.01 U 0.031 0.01 U 0.013 0.119 0.017WR25.2 10/9/97 14:20 7.5 0.01 U 0.055 0.01 U 0.011 0.118 0.095WR25.2 10/16/97 9:20 8.0WR25.2 10/16/97 15:05 7.9 0.01 UJ 0.025 0.01 U 0.01 U 0.075 0.022WR25.2 10/23/97 15:00 0.01 U 0.032 0.01 U 0.01 U 0.034 0.025 WR25.2 10/30/97 9:20 7.0WR25.2 10/30/97 14:35 7.5 0.01 U 0.25 0.01 U 0.01 U 0.339 0.472 WR25.2 10/30/97 14:35 7.1 WR25.2 11/6/97 14:15 0.01 U 0.079 0.01 U 0.01 U 0.285 0.115WR25.2 11/13/97 15:05 7.9 0.01 U 0.081 0.01 U 0.01 U 0.09 0.063WR25.2 11/13/97 15:05 8.0
Table D-2, page 2
DRAFT – DO NOT CITE OR QUOTE
Appendix E
Mainstem Nutrient Profile Modeling
Introduction
To better understand the nutrient dynamics, a mass balance model was used to simulate nutrientconcentrations in the mainstem White River. The model was developed by Greg Pelletier as partof the Puyallup Total Maximum Daily Load study (Pelletier, 1994), and divides the study areainto 0.2 mile segments. The nutrient mass of each element is calculated based on the previouselement concentration, plus pointload inputs, and minus nutrient uptake (set externally). Thehydrodynamic elements were derived from the QUAL2E model described in Pelletier (1993).The basic model structure is shown in Table E-1. The purpose of the model was to model streamnutrient concentrations longitudinally based on nutrient inputs, nutrient uptake, and streamflowlevels.
Mass Balance Model Calibration
There were potentially six complete sets of data that could be used with the mass balance model,each collected in 1996. However, only one data set, from 9/24/96, had data that represented thesame block of water as it traveled downstream. This is important because of the highly variableeffluent characteristics of the Enumclaw discharge. In addition, streamflow can varysignificantly over the course of a day due to natural variations, as well as operations at MudMountain dam and the diversion works. Therefore the 9/24/96 dataset was used to calibrate themass balance model.
On 9/24/96, no water was being diverted to Lake Tapps (due to flume maintenance). Therefore,streamflow was relatively high on this date, and nutrient concentrations relatively low.
Hydrodynamics
The mass balance model was first checked for goodness-of-fit of the hydrodynamics. The 9/24/96streamflow average daily values from USGS gages 12-1000-00, 12-0996-00 and12-0990-00 and the measured tributary streamflows for 9/24/96 were input into the model. Inaddition, the small tributary/spring flows as measured or estimated on 7/31/96 were also entered intothe model. The predicted streamflow was compared to USGS gage 12-1004-96. The fit was verygood (Table E-2). This would indicate that there is not a lot of groundwater inflow to this stretch ofthe White River, or additional unmeasured tributaries. This is consistent with the conclusions of theground water study (Appendix B), that suggested that groundwater is likely to discharge to tributariesof the White River, as opposed to flowing directly to the river.
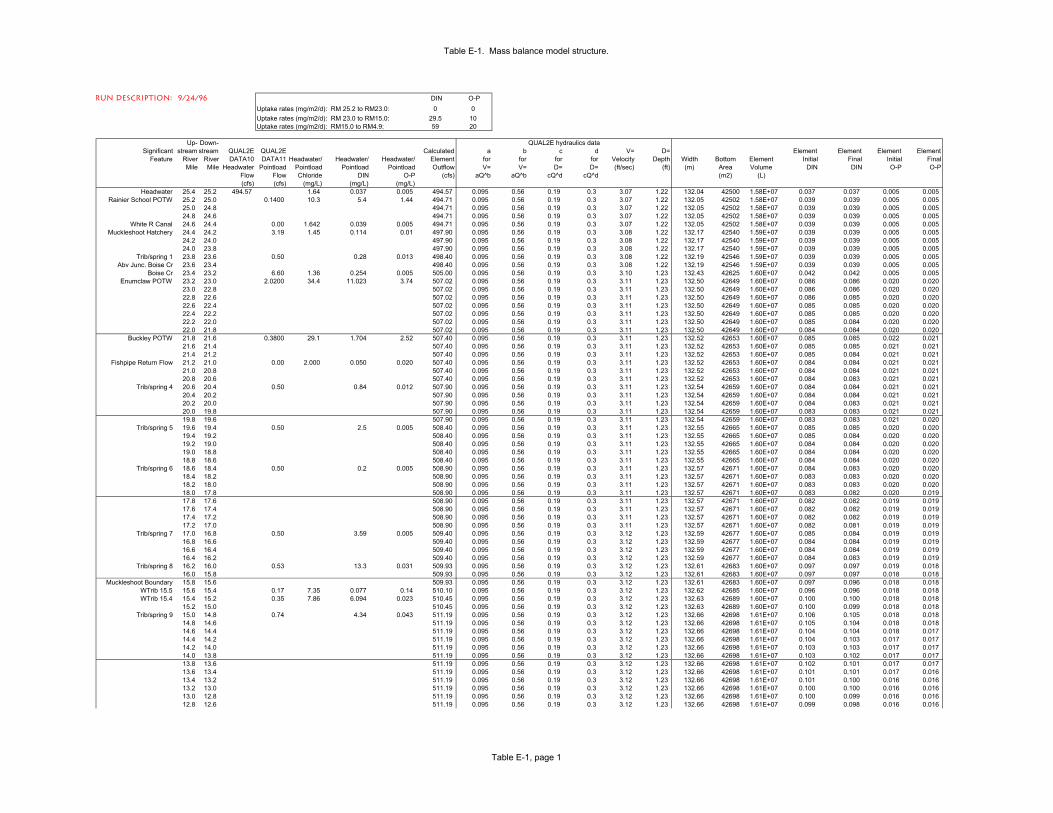
Table E-1. Mass balance model structure.
run description: 9/24/96 DIN O-PUptake rates (mg/m2/d): RM 25.2 to RM23.0: 0 0Uptake rates (mg/m2/d): RM 23.0 to RM15.0: 29.5 10Uptake rates (mg/m2/d): RM15.0 to RM4.9: 59 20
Up- Down-Significant stream stream QUAL2E QUAL2E Calculated a b c d V= D= Element Element Element Element
Feature River River DATA10 DATA11 Headwater/ Headwater/ Headwater/ Element for for for for Velocity Depth Width Bottom Element Initial Final Initial FinalMile Mile Headwater Pointload Pointload Pointload Pointload Outflow V= V= D= D= (ft/sec) (ft) (m) Area Volume DIN DIN O-P O-P
Flow Flow Chloride DIN O-P (cfs) aQ^b aQ^b cQ^d cQ^d (m2) (L)(cfs) (cfs) (mg/L) (mg/L) (mg/L)
Headwater 25.4 25.2 494.57 1.64 0.037 0.005 494.57 0.095 0.56 0.19 0.3 3.07 1.22 132.04 42500 1.58E+07 0.037 0.037 0.005 0.005Rainier School POTW 25.2 25.0 0.1400 10.3 5.4 1.44 494.71 0.095 0.56 0.19 0.3 3.07 1.22 132.05 42502 1.58E+07 0.039 0.039 0.005 0.005
25.0 24.8 494.71 0.095 0.56 0.19 0.3 3.07 1.22 132.05 42502 1.58E+07 0.039 0.039 0.005 0.00524.8 24.6 494.71 0.095 0.56 0.19 0.3 3.07 1.22 132.05 42502 1.58E+07 0.039 0.039 0.005 0.005
White R Canal 24.6 24.4 0.00 1.642 0.039 0.005 494.71 0.095 0.56 0.19 0.3 3.07 1.22 132.05 42502 1.58E+07 0.039 0.039 0.005 0.005Muckleshoot Hatchery 24.4 24.2 3.19 1.45 0.114 0.01 497.90 0.095 0.56 0.19 0.3 3.08 1.22 132.17 42540 1.59E+07 0.039 0.039 0.005 0.005
24.2 24.0 497.90 0.095 0.56 0.19 0.3 3.08 1.22 132.17 42540 1.59E+07 0.039 0.039 0.005 0.00524.0 23.8 497.90 0.095 0.56 0.19 0.3 3.08 1.22 132.17 42540 1.59E+07 0.039 0.039 0.005 0.005
Trib/spring 1 23.8 23.6 0.50 0.28 0.013 498.40 0.095 0.56 0.19 0.3 3.08 1.22 132.19 42546 1.59E+07 0.039 0.039 0.005 0.005Abv Junc. Boise Cr 23.6 23.4 498.40 0.095 0.56 0.19 0.3 3.08 1.22 132.19 42546 1.59E+07 0.039 0.039 0.005 0.005
Boise Cr 23.4 23.2 6.60 1.36 0.254 0.005 505.00 0.095 0.56 0.19 0.3 3.10 1.23 132.43 42625 1.60E+07 0.042 0.042 0.005 0.005Enumclaw POTW 23.2 23.0 2.0200 34.4 11.023 3.74 507.02 0.095 0.56 0.19 0.3 3.11 1.23 132.50 42649 1.60E+07 0.086 0.086 0.020 0.020
23.0 22.8 507.02 0.095 0.56 0.19 0.3 3.11 1.23 132.50 42649 1.60E+07 0.086 0.086 0.020 0.02022.8 22.6 507.02 0.095 0.56 0.19 0.3 3.11 1.23 132.50 42649 1.60E+07 0.086 0.085 0.020 0.02022.6 22.4 507.02 0.095 0.56 0.19 0.3 3.11 1.23 132.50 42649 1.60E+07 0.085 0.085 0.020 0.02022.4 22.2 507.02 0.095 0.56 0.19 0.3 3.11 1.23 132.50 42649 1.60E+07 0.085 0.085 0.020 0.02022.2 22.0 507.02 0.095 0.56 0.19 0.3 3.11 1.23 132.50 42649 1.60E+07 0.085 0.084 0.020 0.02022.0 21.8 507.02 0.095 0.56 0.19 0.3 3.11 1.23 132.50 42649 1.60E+07 0.084 0.084 0.020 0.020
Buckley POTW 21.8 21.6 0.3800 29.1 1.704 2.52 507.40 0.095 0.56 0.19 0.3 3.11 1.23 132.52 42653 1.60E+07 0.085 0.085 0.022 0.02121.6 21.4 507.40 0.095 0.56 0.19 0.3 3.11 1.23 132.52 42653 1.60E+07 0.085 0.085 0.021 0.02121.4 21.2 507.40 0.095 0.56 0.19 0.3 3.11 1.23 132.52 42653 1.60E+07 0.085 0.084 0.021 0.021
Fishpipe Return Flow 21.2 21.0 0.00 2.000 0.050 0.020 507.40 0.095 0.56 0.19 0.3 3.11 1.23 132.52 42653 1.60E+07 0.084 0.084 0.021 0.02121.0 20.8 507.40 0.095 0.56 0.19 0.3 3.11 1.23 132.52 42653 1.60E+07 0.084 0.084 0.021 0.02120.8 20.6 507.40 0.095 0.56 0.19 0.3 3.11 1.23 132.52 42653 1.60E+07 0.084 0.083 0.021 0.021
Trib/spring 4 20.6 20.4 0.50 0.84 0.012 507.90 0.095 0.56 0.19 0.3 3.11 1.23 132.54 42659 1.60E+07 0.084 0.084 0.021 0.02120.4 20.2 507.90 0.095 0.56 0.19 0.3 3.11 1.23 132.54 42659 1.60E+07 0.084 0.084 0.021 0.02120.2 20.0 507.90 0.095 0.56 0.19 0.3 3.11 1.23 132.54 42659 1.60E+07 0.084 0.083 0.021 0.02120.0 19.8 507.90 0.095 0.56 0.19 0.3 3.11 1.23 132.54 42659 1.60E+07 0.083 0.083 0.021 0.02119.8 19.6 507.90 0.095 0.56 0.19 0.3 3.11 1.23 132.54 42659 1.60E+07 0.083 0.083 0.021 0.020
Trib/spring 5 19.6 19.4 0.50 2.5 0.005 508.40 0.095 0.56 0.19 0.3 3.11 1.23 132.55 42665 1.60E+07 0.085 0.085 0.020 0.02019.4 19.2 508.40 0.095 0.56 0.19 0.3 3.11 1.23 132.55 42665 1.60E+07 0.085 0.084 0.020 0.02019.2 19.0 508.40 0.095 0.56 0.19 0.3 3.11 1.23 132.55 42665 1.60E+07 0.084 0.084 0.020 0.02019.0 18.8 508.40 0.095 0.56 0.19 0.3 3.11 1.23 132.55 42665 1.60E+07 0.084 0.084 0.020 0.02018.8 18.6 508.40 0.095 0.56 0.19 0.3 3.11 1.23 132.55 42665 1.60E+07 0.084 0.084 0.020 0.020
Trib/spring 6 18.6 18.4 0.50 0.2 0.005 508.90 0.095 0.56 0.19 0.3 3.11 1.23 132.57 42671 1.60E+07 0.084 0.083 0.020 0.02018.4 18.2 508.90 0.095 0.56 0.19 0.3 3.11 1.23 132.57 42671 1.60E+07 0.083 0.083 0.020 0.02018.2 18.0 508.90 0.095 0.56 0.19 0.3 3.11 1.23 132.57 42671 1.60E+07 0.083 0.083 0.020 0.02018.0 17.8 508.90 0.095 0.56 0.19 0.3 3.11 1.23 132.57 42671 1.60E+07 0.083 0.082 0.020 0.01917.8 17.6 508.90 0.095 0.56 0.19 0.3 3.11 1.23 132.57 42671 1.60E+07 0.082 0.082 0.019 0.01917.6 17.4 508.90 0.095 0.56 0.19 0.3 3.11 1.23 132.57 42671 1.60E+07 0.082 0.082 0.019 0.01917.4 17.2 508.90 0.095 0.56 0.19 0.3 3.11 1.23 132.57 42671 1.60E+07 0.082 0.082 0.019 0.01917.2 17.0 508.90 0.095 0.56 0.19 0.3 3.11 1.23 132.57 42671 1.60E+07 0.082 0.081 0.019 0.019
Trib/spring 7 17.0 16.8 0.50 3.59 0.005 509.40 0.095 0.56 0.19 0.3 3.12 1.23 132.59 42677 1.60E+07 0.085 0.084 0.019 0.01916.8 16.6 509.40 0.095 0.56 0.19 0.3 3.12 1.23 132.59 42677 1.60E+07 0.084 0.084 0.019 0.01916.6 16.4 509.40 0.095 0.56 0.19 0.3 3.12 1.23 132.59 42677 1.60E+07 0.084 0.084 0.019 0.01916.4 16.2 509.40 0.095 0.56 0.19 0.3 3.12 1.23 132.59 42677 1.60E+07 0.084 0.083 0.019 0.019
Trib/spring 8 16.2 16.0 0.53 13.3 0.031 509.93 0.095 0.56 0.19 0.3 3.12 1.23 132.61 42683 1.60E+07 0.097 0.097 0.019 0.01816.0 15.8 509.93 0.095 0.56 0.19 0.3 3.12 1.23 132.61 42683 1.60E+07 0.097 0.097 0.018 0.018
Muckleshoot Boundary 15.8 15.6 509.93 0.095 0.56 0.19 0.3 3.12 1.23 132.61 42683 1.60E+07 0.097 0.096 0.018 0.018WTrib 15.5 15.6 15.4 0.17 7.35 0.077 0.14 510.10 0.095 0.56 0.19 0.3 3.12 1.23 132.62 42685 1.60E+07 0.096 0.096 0.018 0.018WTrib 15.4 15.4 15.2 0.35 7.86 6.094 0.023 510.45 0.095 0.56 0.19 0.3 3.12 1.23 132.63 42689 1.60E+07 0.100 0.100 0.018 0.018
15.2 15.0 510.45 0.095 0.56 0.19 0.3 3.12 1.23 132.63 42689 1.60E+07 0.100 0.099 0.018 0.018Trib/spring 9 15.0 14.8 0.74 4.34 0.043 511.19 0.095 0.56 0.19 0.3 3.12 1.23 132.66 42698 1.61E+07 0.106 0.105 0.018 0.018
14.8 14.6 511.19 0.095 0.56 0.19 0.3 3.12 1.23 132.66 42698 1.61E+07 0.105 0.104 0.018 0.01814.6 14.4 511.19 0.095 0.56 0.19 0.3 3.12 1.23 132.66 42698 1.61E+07 0.104 0.104 0.018 0.01714.4 14.2 511.19 0.095 0.56 0.19 0.3 3.12 1.23 132.66 42698 1.61E+07 0.104 0.103 0.017 0.01714.2 14.0 511.19 0.095 0.56 0.19 0.3 3.12 1.23 132.66 42698 1.61E+07 0.103 0.103 0.017 0.01714.0 13.8 511.19 0.095 0.56 0.19 0.3 3.12 1.23 132.66 42698 1.61E+07 0.103 0.102 0.017 0.01713.8 13.6 511.19 0.095 0.56 0.19 0.3 3.12 1.23 132.66 42698 1.61E+07 0.102 0.101 0.017 0.01713.6 13.4 511.19 0.095 0.56 0.19 0.3 3.12 1.23 132.66 42698 1.61E+07 0.101 0.101 0.017 0.01613.4 13.2 511.19 0.095 0.56 0.19 0.3 3.12 1.23 132.66 42698 1.61E+07 0.101 0.100 0.016 0.01613.2 13.0 511.19 0.095 0.56 0.19 0.3 3.12 1.23 132.66 42698 1.61E+07 0.100 0.100 0.016 0.01613.0 12.8 511.19 0.095 0.56 0.19 0.3 3.12 1.23 132.66 42698 1.61E+07 0.100 0.099 0.016 0.01612.8 12.6 511.19 0.095 0.56 0.19 0.3 3.12 1.23 132.66 42698 1.61E+07 0.099 0.098 0.016 0.016
QUAL2E hydraulics data
Table E-1, page 1
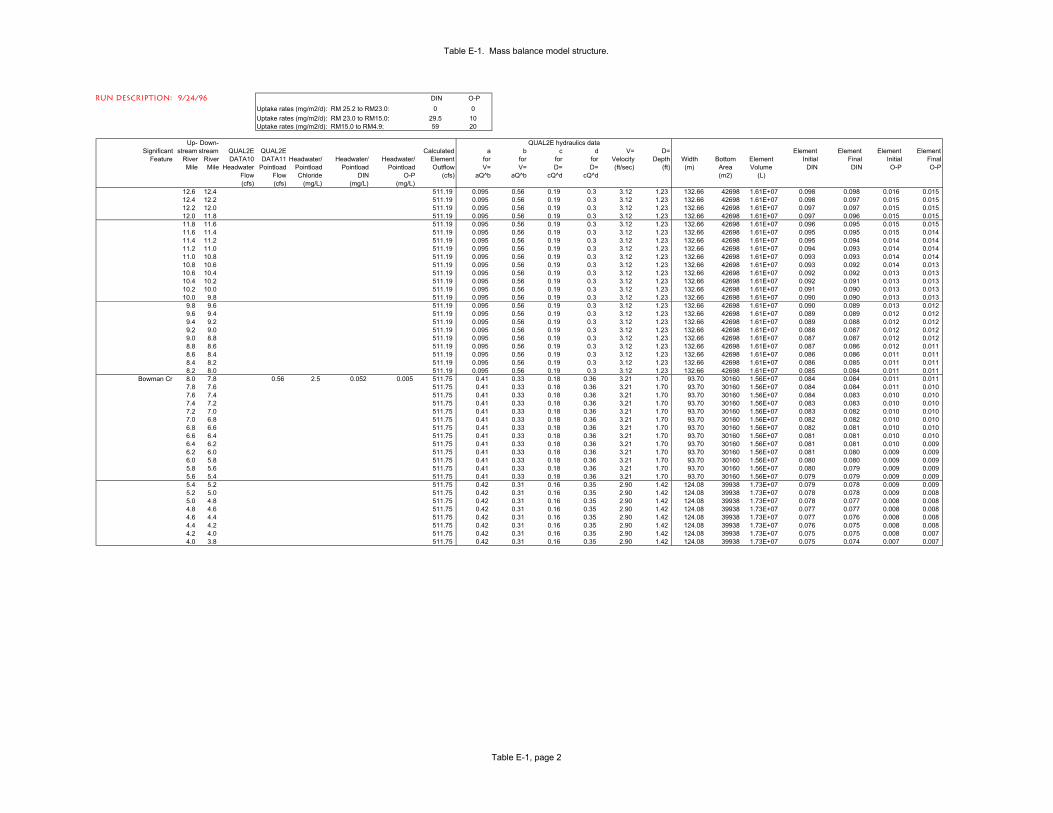
Table E-1. Mass balance model structure.
run description: 9/24/96 DIN O-PUptake rates (mg/m2/d): RM 25.2 to RM23.0: 0 0Uptake rates (mg/m2/d): RM 23.0 to RM15.0: 29.5 10Uptake rates (mg/m2/d): RM15.0 to RM4.9: 59 20
Up- Down-Significant stream stream QUAL2E QUAL2E Calculated a b c d V= D= Element Element Element Element
Feature River River DATA10 DATA11 Headwater/ Headwater/ Headwater/ Element for for for for Velocity Depth Width Bottom Element Initial Final Initial FinalMile Mile Headwater Pointload Pointload Pointload Pointload Outflow V= V= D= D= (ft/sec) (ft) (m) Area Volume DIN DIN O-P O-P
Flow Flow Chloride DIN O-P (cfs) aQ^b aQ^b cQ^d cQ^d (m2) (L)(cfs) (cfs) (mg/L) (mg/L) (mg/L)
QUAL2E hydraulics data
12.6 12.4 511.19 0.095 0.56 0.19 0.3 3.12 1.23 132.66 42698 1.61E+07 0.098 0.098 0.016 0.01512.4 12.2 511.19 0.095 0.56 0.19 0.3 3.12 1.23 132.66 42698 1.61E+07 0.098 0.097 0.015 0.01512.2 12.0 511.19 0.095 0.56 0.19 0.3 3.12 1.23 132.66 42698 1.61E+07 0.097 0.097 0.015 0.01512.0 11.8 511.19 0.095 0.56 0.19 0.3 3.12 1.23 132.66 42698 1.61E+07 0.097 0.096 0.015 0.01511.8 11.6 511.19 0.095 0.56 0.19 0.3 3.12 1.23 132.66 42698 1.61E+07 0.096 0.095 0.015 0.01511.6 11.4 511.19 0.095 0.56 0.19 0.3 3.12 1.23 132.66 42698 1.61E+07 0.095 0.095 0.015 0.01411.4 11.2 511.19 0.095 0.56 0.19 0.3 3.12 1.23 132.66 42698 1.61E+07 0.095 0.094 0.014 0.01411.2 11.0 511.19 0.095 0.56 0.19 0.3 3.12 1.23 132.66 42698 1.61E+07 0.094 0.093 0.014 0.01411.0 10.8 511.19 0.095 0.56 0.19 0.3 3.12 1.23 132.66 42698 1.61E+07 0.093 0.093 0.014 0.01410.8 10.6 511.19 0.095 0.56 0.19 0.3 3.12 1.23 132.66 42698 1.61E+07 0.093 0.092 0.014 0.01310.6 10.4 511.19 0.095 0.56 0.19 0.3 3.12 1.23 132.66 42698 1.61E+07 0.092 0.092 0.013 0.01310.4 10.2 511.19 0.095 0.56 0.19 0.3 3.12 1.23 132.66 42698 1.61E+07 0.092 0.091 0.013 0.01310.2 10.0 511.19 0.095 0.56 0.19 0.3 3.12 1.23 132.66 42698 1.61E+07 0.091 0.090 0.013 0.01310.0 9.8 511.19 0.095 0.56 0.19 0.3 3.12 1.23 132.66 42698 1.61E+07 0.090 0.090 0.013 0.013
9.8 9.6 511.19 0.095 0.56 0.19 0.3 3.12 1.23 132.66 42698 1.61E+07 0.090 0.089 0.013 0.0129.6 9.4 511.19 0.095 0.56 0.19 0.3 3.12 1.23 132.66 42698 1.61E+07 0.089 0.089 0.012 0.0129.4 9.2 511.19 0.095 0.56 0.19 0.3 3.12 1.23 132.66 42698 1.61E+07 0.089 0.088 0.012 0.0129.2 9.0 511.19 0.095 0.56 0.19 0.3 3.12 1.23 132.66 42698 1.61E+07 0.088 0.087 0.012 0.0129.0 8.8 511.19 0.095 0.56 0.19 0.3 3.12 1.23 132.66 42698 1.61E+07 0.087 0.087 0.012 0.0128.8 8.6 511.19 0.095 0.56 0.19 0.3 3.12 1.23 132.66 42698 1.61E+07 0.087 0.086 0.012 0.0118.6 8.4 511.19 0.095 0.56 0.19 0.3 3.12 1.23 132.66 42698 1.61E+07 0.086 0.086 0.011 0.0118.4 8.2 511.19 0.095 0.56 0.19 0.3 3.12 1.23 132.66 42698 1.61E+07 0.086 0.085 0.011 0.0118.2 8.0 511.19 0.095 0.56 0.19 0.3 3.12 1.23 132.66 42698 1.61E+07 0.085 0.084 0.011 0.011
Bowman Cr 8.0 7.8 0.56 2.5 0.052 0.005 511.75 0.41 0.33 0.18 0.36 3.21 1.70 93.70 30160 1.56E+07 0.084 0.084 0.011 0.0117.8 7.6 511.75 0.41 0.33 0.18 0.36 3.21 1.70 93.70 30160 1.56E+07 0.084 0.084 0.011 0.0107.6 7.4 511.75 0.41 0.33 0.18 0.36 3.21 1.70 93.70 30160 1.56E+07 0.084 0.083 0.010 0.0107.4 7.2 511.75 0.41 0.33 0.18 0.36 3.21 1.70 93.70 30160 1.56E+07 0.083 0.083 0.010 0.0107.2 7.0 511.75 0.41 0.33 0.18 0.36 3.21 1.70 93.70 30160 1.56E+07 0.083 0.082 0.010 0.0107.0 6.8 511.75 0.41 0.33 0.18 0.36 3.21 1.70 93.70 30160 1.56E+07 0.082 0.082 0.010 0.0106.8 6.6 511.75 0.41 0.33 0.18 0.36 3.21 1.70 93.70 30160 1.56E+07 0.082 0.081 0.010 0.0106.6 6.4 511.75 0.41 0.33 0.18 0.36 3.21 1.70 93.70 30160 1.56E+07 0.081 0.081 0.010 0.0106.4 6.2 511.75 0.41 0.33 0.18 0.36 3.21 1.70 93.70 30160 1.56E+07 0.081 0.081 0.010 0.0096.2 6.0 511.75 0.41 0.33 0.18 0.36 3.21 1.70 93.70 30160 1.56E+07 0.081 0.080 0.009 0.0096.0 5.8 511.75 0.41 0.33 0.18 0.36 3.21 1.70 93.70 30160 1.56E+07 0.080 0.080 0.009 0.0095.8 5.6 511.75 0.41 0.33 0.18 0.36 3.21 1.70 93.70 30160 1.56E+07 0.080 0.079 0.009 0.0095.6 5.4 511.75 0.41 0.33 0.18 0.36 3.21 1.70 93.70 30160 1.56E+07 0.079 0.079 0.009 0.0095.4 5.2 511.75 0.42 0.31 0.16 0.35 2.90 1.42 124.08 39938 1.73E+07 0.079 0.078 0.009 0.0095.2 5.0 511.75 0.42 0.31 0.16 0.35 2.90 1.42 124.08 39938 1.73E+07 0.078 0.078 0.009 0.0085.0 4.8 511.75 0.42 0.31 0.16 0.35 2.90 1.42 124.08 39938 1.73E+07 0.078 0.077 0.008 0.0084.8 4.6 511.75 0.42 0.31 0.16 0.35 2.90 1.42 124.08 39938 1.73E+07 0.077 0.077 0.008 0.0084.6 4.4 511.75 0.42 0.31 0.16 0.35 2.90 1.42 124.08 39938 1.73E+07 0.077 0.076 0.008 0.0084.4 4.2 511.75 0.42 0.31 0.16 0.35 2.90 1.42 124.08 39938 1.73E+07 0.076 0.075 0.008 0.0084.2 4.0 511.75 0.42 0.31 0.16 0.35 2.90 1.42 124.08 39938 1.73E+07 0.075 0.075 0.008 0.0074.0 3.8 511.75 0.42 0.31 0.16 0.35 2.90 1.42 124.08 39938 1.73E+07 0.075 0.074 0.007 0.007
Table E-1, page 2
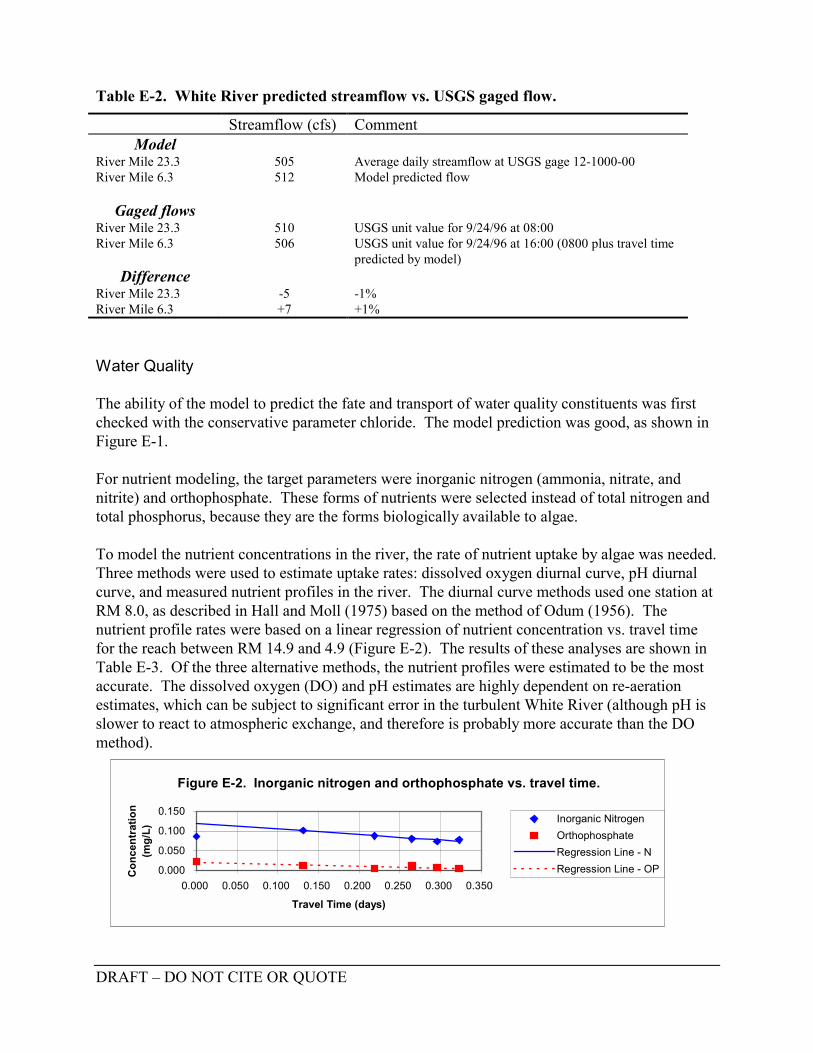
DRAFT – DO NOT CITE OR QUOTE
Table E-2. White River predicted streamflow vs. USGS gaged flow.
Streamflow (cfs) CommentModel
River Mile 23.3 505 Average daily streamflow at USGS gage 12-1000-00River Mile 6.3 512 Model predicted flow
Gaged flowsRiver Mile 23.3 510 USGS unit value for 9/24/96 at 08:00River Mile 6.3 506 USGS unit value for 9/24/96 at 16:00 (0800 plus travel time
predicted by model)Difference
River Mile 23.3 -5 -1%River Mile 6.3 +7 +1%
Water Quality
The ability of the model to predict the fate and transport of water quality constituents was firstchecked with the conservative parameter chloride. The model prediction was good, as shown inFigure E-1.
For nutrient modeling, the target parameters were inorganic nitrogen (ammonia, nitrate, andnitrite) and orthophosphate. These forms of nutrients were selected instead of total nitrogen andtotal phosphorus, because they are the forms biologically available to algae.
To model the nutrient concentrations in the river, the rate of nutrient uptake by algae was needed.Three methods were used to estimate uptake rates: dissolved oxygen diurnal curve, pH diurnalcurve, and measured nutrient profiles in the river. The diurnal curve methods used one station atRM 8.0, as described in Hall and Moll (1975) based on the method of Odum (1956). Thenutrient profile rates were based on a linear regression of nutrient concentration vs. travel timefor the reach between RM 14.9 and 4.9 (Figure E-2). The results of these analyses are shown inTable E-3. Of the three alternative methods, the nutrient profiles were estimated to be the mostaccurate. The dissolved oxygen (DO) and pH estimates are highly dependent on re-aerationestimates, which can be subject to significant error in the turbulent White River (although pH isslower to react to atmospheric exchange, and therefore is probably more accurate than the DOmethod).
Figure E-2. Inorganic nitrogen and orthophosphate vs. travel time.
0.000
0.050
0.100
0.150
0.000 0.050 0.100 0.150 0.200 0.250 0.300 0.350
Travel Time (days)
Con
cent
ratio
n (m
g/L)
Inorganic NitrogenOrthophosphateRegression Line - NRegression Line - OP
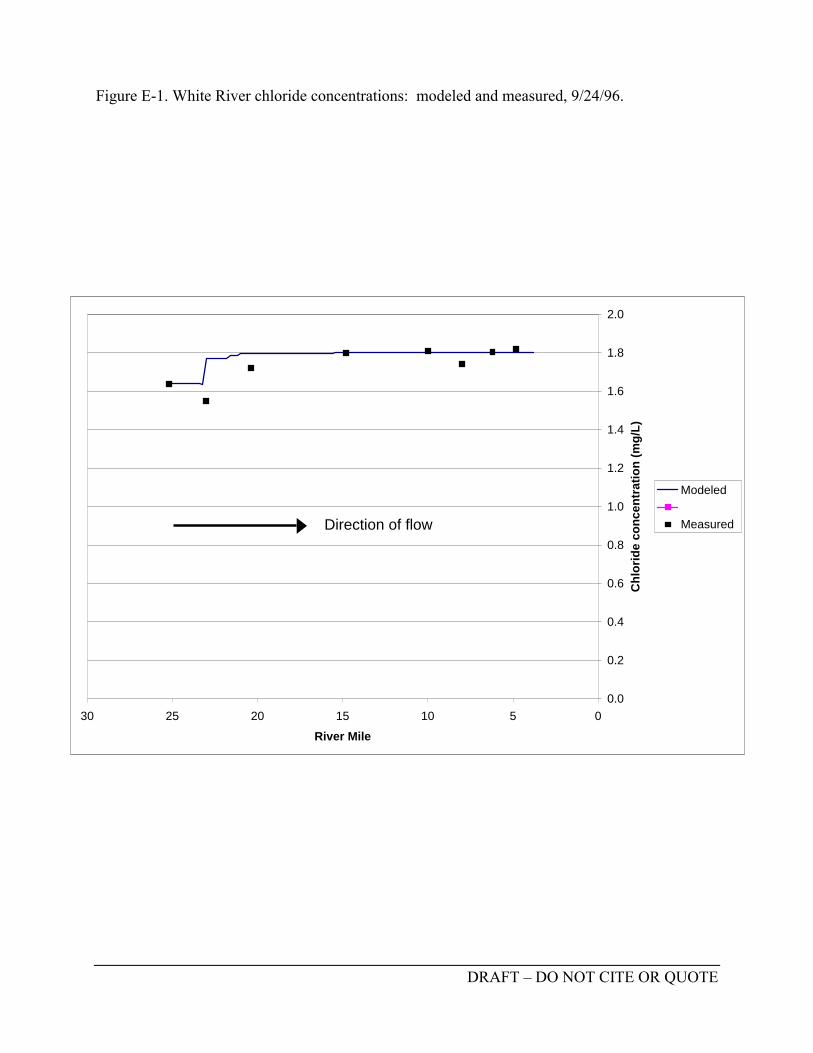
DRAFT – DO NOT CITE OR QUOTE
Figure E-1. White River chloride concentrations: modeled and measured, 9/24/96.
0.0
0.2
0.4
0.6
0.8
1.0
1.2
1.4
1.6
1.8
2.0
051015202530River Mile
Chl
orid
e co
ncen
trat
ion
(mg/
L)
Modeled
Measured Direction of flow
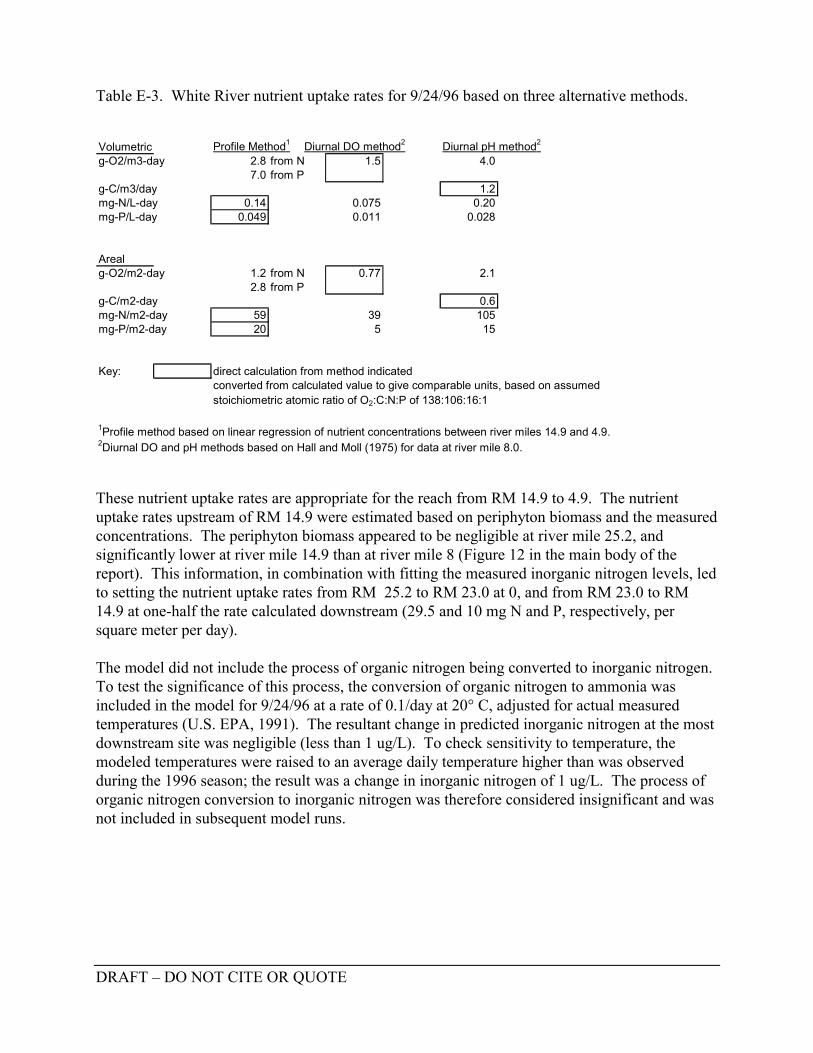
DRAFT – DO NOT CITE OR QUOTE
Table E-3. White River nutrient uptake rates for 9/24/96 based on three alternative methods.
These nutrient uptake rates are appropriate for the reach from RM 14.9 to 4.9. The nutrientuptake rates upstream of RM 14.9 were estimated based on periphyton biomass and the measuredconcentrations. The periphyton biomass appeared to be negligible at river mile 25.2, andsignificantly lower at river mile 14.9 than at river mile 8 (Figure 12 in the main body of thereport). This information, in combination with fitting the measured inorganic nitrogen levels, ledto setting the nutrient uptake rates from RM 25.2 to RM 23.0 at 0, and from RM 23.0 to RM14.9 at one-half the rate calculated downstream (29.5 and 10 mg N and P, respectively, persquare meter per day).
The model did not include the process of organic nitrogen being converted to inorganic nitrogen.To test the significance of this process, the conversion of organic nitrogen to ammonia wasincluded in the model for 9/24/96 at a rate of 0.1/day at 20° C, adjusted for actual measuredtemperatures (U.S. EPA, 1991). The resultant change in predicted inorganic nitrogen at the mostdownstream site was negligible (less than 1 ug/L). To check sensitivity to temperature, themodeled temperatures were raised to an average daily temperature higher than was observedduring the 1996 season; the result was a change in inorganic nitrogen of 1 ug/L. The process oforganic nitrogen conversion to inorganic nitrogen was therefore considered insignificant and wasnot included in subsequent model runs.
Volumetric Profile Method1 Diurnal DO method2 Diurnal pH method2
g-O2/m3-day 2.8 from N 1.5 4.07.0 from P
g-C/m3/day 1.2mg-N/L-day 0.14 0.075 0.20mg-P/L-day 0.049 0.011 0.028
Arealg-O2/m2-day 1.2 from N 0.77 2.1
2.8 from Pg-C/m2-day 0.6mg-N/m2-day 59 39 105mg-P/m2-day 20 5 15
Key: direct calculation from method indicatedconverted from calculated value to give comparable units, based on assumedstoichiometric atomic ratio of O2:C:N:P of 138:106:16:1
1Profile method based on linear regression of nutrient concentrations between river miles 14.9 and 4.9.2Diurnal DO and pH methods based on Hall and Moll (1975) for data at river mile 8.0.
DRAFT – DO NOT CITE OR QUOTE
References – Appendix E
Hall, C. and R. Moll, 1975. Methods of Assessing Aquatic Primary Productivity. In PrimaryProductivity of the Biosphere, edited by Helmut Lieth and Robert Whittaker. Pringer-Verlag New York Inc., New York, NY.
Odum, H., 1956. Primary Production of Flowing Waters. Limnol. Oceanogr. 2:85-97.
Pelletier, G., 1993. Puyallup River Total Maximum Daily Load for Biochemical OxygenDemand, Ammonia, and Residual Chlorine. Washington Department of Ecology,Olympia, WA.
Pelletier, G., 1994. Addendum to the 1993 Puyallup River TMDL Report. Memo from GregPelletier to Bill Backous, dated 7/22/94. Washington Department of Ecology, Olympia,WA.
U.S. EPA, 1991. Instruction materials for the workshop on “The Stream Water Quality andUncertainty Model, QUAL2E”, June 24-28, 1991. U.S. Environmental ProtectionAgency, Center for Exposure Assessment Modeling (CEAM) of the Office of Researchand Development, Athens, GA.

DRAFT – DO NOT CITE OR QUOTE
Appendix F
Periphyton Identification
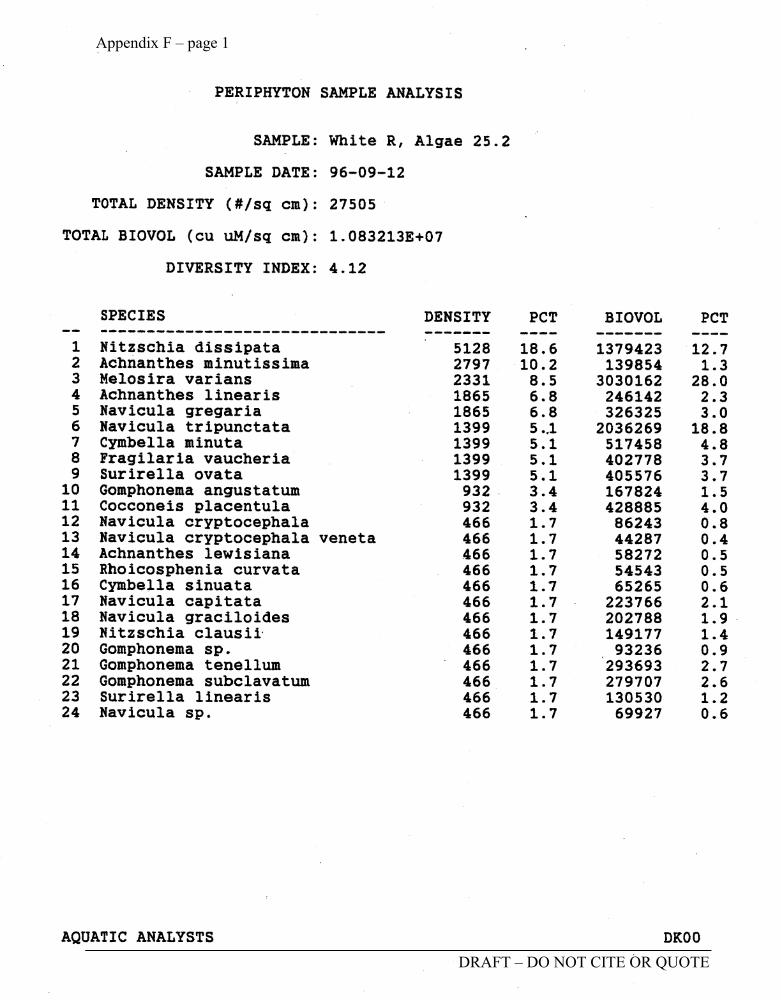
Appendix F – page 1
DRAFT – DO NOT CITE OR QUOTE
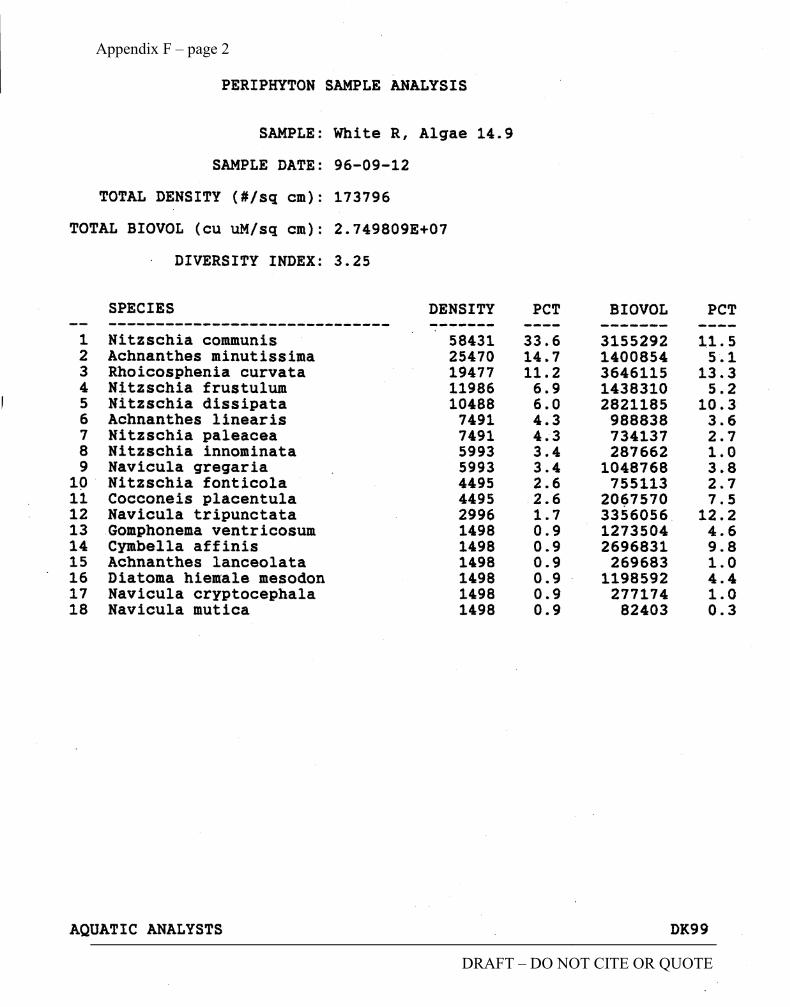
DRAFT – DO NOT CITE OR QUOTE
Appendix F – page 2
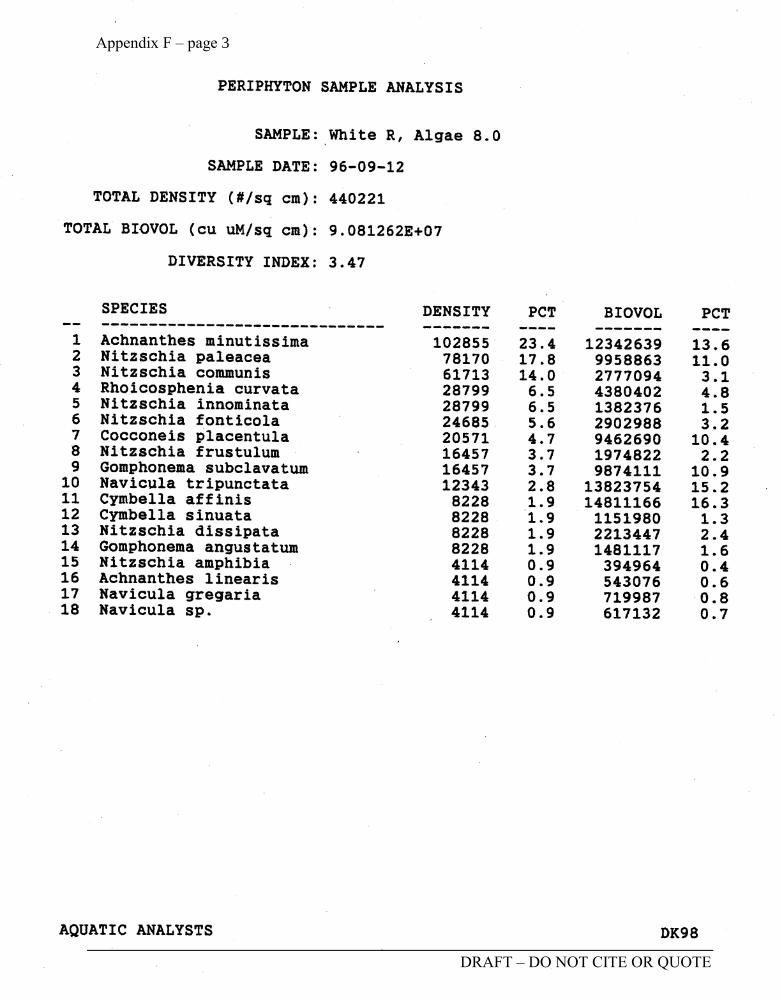
Appendix F – page 3
DRAFT – DO NOT CITE OR QUOTE

DRAFT – DO NOT CITE OR QUOTE
Appendix G
Tabular Data for Figure 19
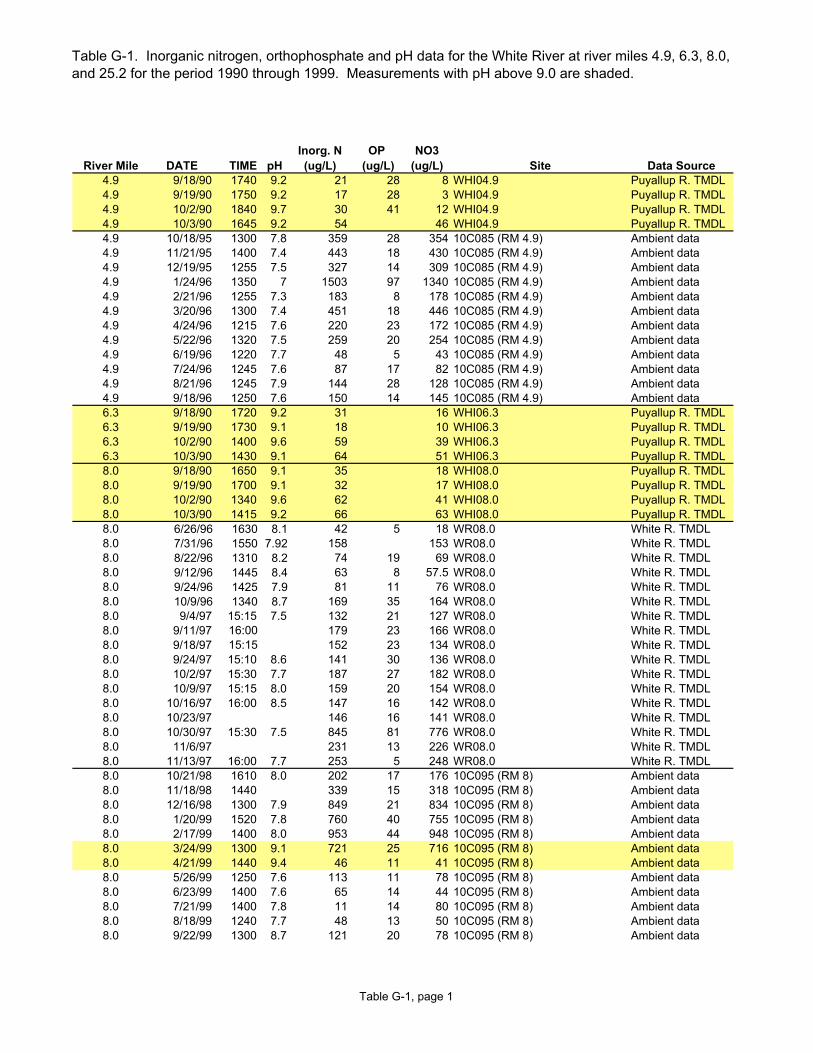
Table G-1. Inorganic nitrogen, orthophosphate and pH data for the White River at river miles 4.9, 6.3, 8.0, and 25.2 for the period 1990 through 1999. Measurements with pH above 9.0 are shaded.
River Mile DATE TIME pHInorg. N (ug/L)
OP (ug/L)
NO3 (ug/L) Site Data Source
4.9 9/18/90 1740 9.2 21 28 8 WHI04.9 Puyallup R. TMDL4.9 9/19/90 1750 9.2 17 28 3 WHI04.9 Puyallup R. TMDL4.9 10/2/90 1840 9.7 30 41 12 WHI04.9 Puyallup R. TMDL4.9 10/3/90 1645 9.2 54 46 WHI04.9 Puyallup R. TMDL4.9 10/18/95 1300 7.8 359 28 354 10C085 (RM 4.9) Ambient data4.9 11/21/95 1400 7.4 443 18 430 10C085 (RM 4.9) Ambient data4.9 12/19/95 1255 7.5 327 14 309 10C085 (RM 4.9) Ambient data4.9 1/24/96 1350 7 1503 97 1340 10C085 (RM 4.9) Ambient data4.9 2/21/96 1255 7.3 183 8 178 10C085 (RM 4.9) Ambient data4.9 3/20/96 1300 7.4 451 18 446 10C085 (RM 4.9) Ambient data4.9 4/24/96 1215 7.6 220 23 172 10C085 (RM 4.9) Ambient data4.9 5/22/96 1320 7.5 259 20 254 10C085 (RM 4.9) Ambient data4.9 6/19/96 1220 7.7 48 5 43 10C085 (RM 4.9) Ambient data4.9 7/24/96 1245 7.6 87 17 82 10C085 (RM 4.9) Ambient data4.9 8/21/96 1245 7.9 144 28 128 10C085 (RM 4.9) Ambient data4.9 9/18/96 1250 7.6 150 14 145 10C085 (RM 4.9) Ambient data6.3 9/18/90 1720 9.2 31 16 WHI06.3 Puyallup R. TMDL6.3 9/19/90 1730 9.1 18 10 WHI06.3 Puyallup R. TMDL6.3 10/2/90 1400 9.6 59 39 WHI06.3 Puyallup R. TMDL6.3 10/3/90 1430 9.1 64 51 WHI06.3 Puyallup R. TMDL8.0 9/18/90 1650 9.1 35 18 WHI08.0 Puyallup R. TMDL8.0 9/19/90 1700 9.1 32 17 WHI08.0 Puyallup R. TMDL8.0 10/2/90 1340 9.6 62 41 WHI08.0 Puyallup R. TMDL8.0 10/3/90 1415 9.2 66 63 WHI08.0 Puyallup R. TMDL8.0 6/26/96 1630 8.1 42 5 18 WR08.0 White R. TMDL8.0 7/31/96 1550 7.92 158 153 WR08.0 White R. TMDL8.0 8/22/96 1310 8.2 74 19 69 WR08.0 White R. TMDL8.0 9/12/96 1445 8.4 63 8 57.5 WR08.0 White R. TMDL8.0 9/24/96 1425 7.9 81 11 76 WR08.0 White R. TMDL8.0 10/9/96 1340 8.7 169 35 164 WR08.0 White R. TMDL8.0 9/4/97 15:15 7.5 132 21 127 WR08.0 White R. TMDL8.0 9/11/97 16:00 179 23 166 WR08.0 White R. TMDL8.0 9/18/97 15:15 152 23 134 WR08.0 White R. TMDL8.0 9/24/97 15:10 8.6 141 30 136 WR08.0 White R. TMDL8.0 10/2/97 15:30 7.7 187 27 182 WR08.0 White R. TMDL8.0 10/9/97 15:15 8.0 159 20 154 WR08.0 White R. TMDL8.0 10/16/97 16:00 8.5 147 16 142 WR08.0 White R. TMDL8.0 10/23/97 146 16 141 WR08.0 White R. TMDL8.0 10/30/97 15:30 7.5 845 81 776 WR08.0 White R. TMDL8.0 11/6/97 231 13 226 WR08.0 White R. TMDL8.0 11/13/97 16:00 7.7 253 5 248 WR08.0 White R. TMDL8.0 10/21/98 1610 8.0 202 17 176 10C095 (RM 8) Ambient data8.0 11/18/98 1440 339 15 318 10C095 (RM 8) Ambient data8.0 12/16/98 1300 7.9 849 21 834 10C095 (RM 8) Ambient data8.0 1/20/99 1520 7.8 760 40 755 10C095 (RM 8) Ambient data8.0 2/17/99 1400 8.0 953 44 948 10C095 (RM 8) Ambient data8.0 3/24/99 1300 9.1 721 25 716 10C095 (RM 8) Ambient data8.0 4/21/99 1440 9.4 46 11 41 10C095 (RM 8) Ambient data8.0 5/26/99 1250 7.6 113 11 78 10C095 (RM 8) Ambient data8.0 6/23/99 1400 7.6 65 14 44 10C095 (RM 8) Ambient data8.0 7/21/99 1400 7.8 11 14 80 10C095 (RM 8) Ambient data8.0 8/18/99 1240 7.7 48 13 50 10C095 (RM 8) Ambient data8.0 9/22/99 1300 8.7 121 20 78 10C095 (RM 8) Ambient data
Table G-1, page 1
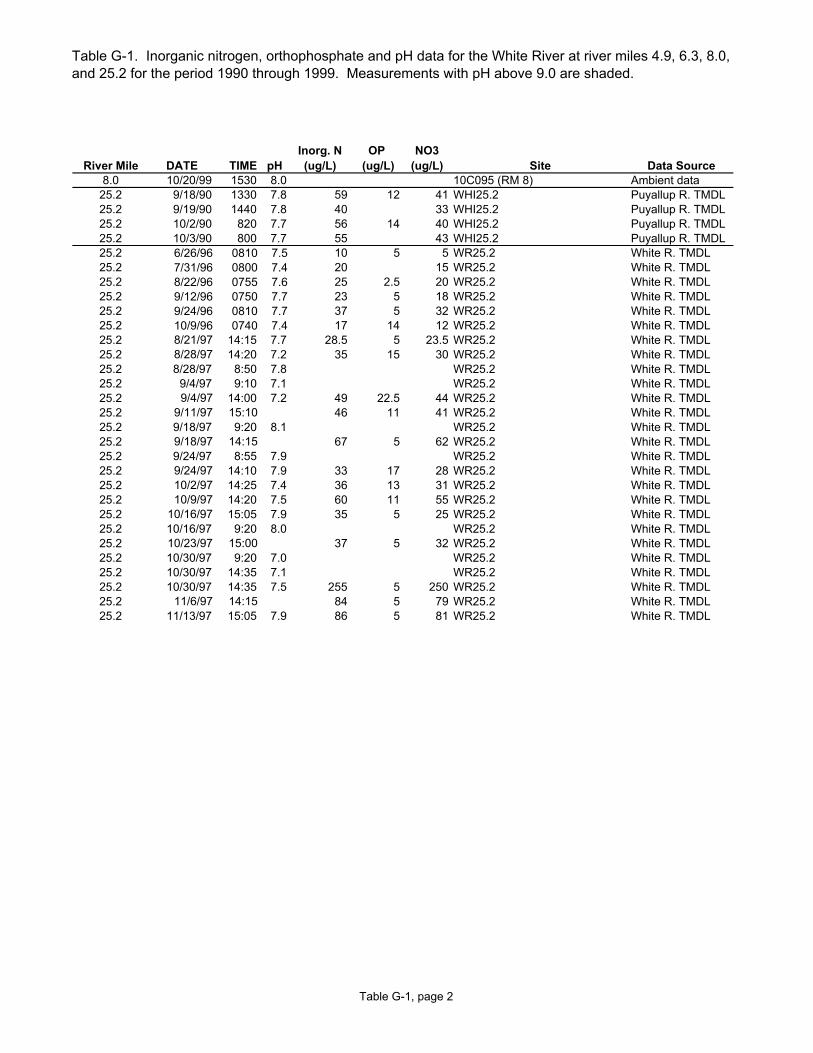
Table G-1. Inorganic nitrogen, orthophosphate and pH data for the White River at river miles 4.9, 6.3, 8.0, and 25.2 for the period 1990 through 1999. Measurements with pH above 9.0 are shaded.
River Mile DATE TIME pHInorg. N (ug/L)
OP (ug/L)
NO3 (ug/L) Site Data Source
8.0 10/20/99 1530 8.0 10C095 (RM 8) Ambient data25.2 9/18/90 1330 7.8 59 12 41 WHI25.2 Puyallup R. TMDL25.2 9/19/90 1440 7.8 40 33 WHI25.2 Puyallup R. TMDL25.2 10/2/90 820 7.7 56 14 40 WHI25.2 Puyallup R. TMDL25.2 10/3/90 800 7.7 55 43 WHI25.2 Puyallup R. TMDL25.2 6/26/96 0810 7.5 10 5 5 WR25.2 White R. TMDL25.2 7/31/96 0800 7.4 20 15 WR25.2 White R. TMDL25.2 8/22/96 0755 7.6 25 2.5 20 WR25.2 White R. TMDL25.2 9/12/96 0750 7.7 23 5 18 WR25.2 White R. TMDL25.2 9/24/96 0810 7.7 37 5 32 WR25.2 White R. TMDL25.2 10/9/96 0740 7.4 17 14 12 WR25.2 White R. TMDL25.2 8/21/97 14:15 7.7 28.5 5 23.5 WR25.2 White R. TMDL25.2 8/28/97 14:20 7.2 35 15 30 WR25.2 White R. TMDL25.2 8/28/97 8:50 7.8 WR25.2 White R. TMDL25.2 9/4/97 9:10 7.1 WR25.2 White R. TMDL25.2 9/4/97 14:00 7.2 49 22.5 44 WR25.2 White R. TMDL25.2 9/11/97 15:10 46 11 41 WR25.2 White R. TMDL25.2 9/18/97 9:20 8.1 WR25.2 White R. TMDL25.2 9/18/97 14:15 67 5 62 WR25.2 White R. TMDL25.2 9/24/97 8:55 7.9 WR25.2 White R. TMDL25.2 9/24/97 14:10 7.9 33 17 28 WR25.2 White R. TMDL25.2 10/2/97 14:25 7.4 36 13 31 WR25.2 White R. TMDL25.2 10/9/97 14:20 7.5 60 11 55 WR25.2 White R. TMDL25.2 10/16/97 15:05 7.9 35 5 25 WR25.2 White R. TMDL25.2 10/16/97 9:20 8.0 WR25.2 White R. TMDL25.2 10/23/97 15:00 37 5 32 WR25.2 White R. TMDL25.2 10/30/97 9:20 7.0 WR25.2 White R. TMDL25.2 10/30/97 14:35 7.1 WR25.2 White R. TMDL25.2 10/30/97 14:35 7.5 255 5 250 WR25.2 White R. TMDL25.2 11/6/97 14:15 84 5 79 WR25.2 White R. TMDL25.2 11/13/97 15:05 7.9 86 5 81 WR25.2 White R. TMDL
Table G-1, page 2

DRAFT – DO NOT CITE OR QUOTE