
REVERSE THAT OSMOSIS, A TECHNOLOGY UPDATE WITH SOME ...
14
1 REVERSE THAT OSMOSIS, A TECHNOLOGY UPDATE WITH SOME KIWI EXPERIENCES Chris Taylor, AWT Water Ltd ABSTRACT Reverse Osmosis (RO) technology has been around for many years and has been developed to provide a sound option in separation processing for a variety of industries. Traditional demineralisation for water treatment was through ion exchange, with some industry still favouring this route, however RO has made significant inroads in surpassing the adoption of ion exchange for many industrial separation processes. The reasons for this are presented. In New Zealand, RO is seldom adopted for municipal drinking water treatment for a variety of reasons, with the membrane classes microfiltration (MF) and ultrafiltration (UF) being more appropriate. This is in stark contrast with Australia, with some very large membrane seawater desalination projects being constructed, albeit more out of necessity than choice. This paper goes on to highlight the basic design concepts and terminology in respect of RO, including the membrane materials commonly used and the key design and operating parameters. The paper further goes on to review two New Zealand industrial applications of RO technology, one for boron removal from a geothermal groundwater and one for residual nitrate removal. The concept designs are presented highlighting differences in the design approach, costs and risks. KEYWORDS Membrane, ion exchange, Spiral Wound Cellulose Acetate (SWCA), Thin Film Composite (TFC), Silt Density Index (SDI), Clean-in-Place (CIP).
Transcript of REVERSE THAT OSMOSIS, A TECHNOLOGY UPDATE WITH SOME ...
1
REVERSE THAT OSMOSIS, A TECHNOLOGY UPDATE WITH SOME KIWI EXPERIENCES
Chris Taylor, AWT Water Ltd
ABSTRACT
Reverse Osmosis (RO) technology has been around for many years and has been developed to provide a sound option in separation processing for a variety of industries.
Traditional demineralisation for water treatment was through ion exchange, with some industry still favouring this route, however RO has made significant inroads in surpassing the adoption of ion exchange for many industrial separation processes. The reasons for this are presented.
In New Zealand, RO is seldom adopted for municipal drinking water treatment for a variety of reasons, with the membrane classes microfiltration (MF) and ultrafiltration (UF) being more appropriate. This is in stark contrast with Australia, with some very large membrane seawater desalination projects being constructed, albeit more out of necessity than choice.
This paper goes on to highlight the basic design concepts and terminology in respect of RO, including the membranematerials commonly used and the key design and operating parameters.
The paper further goes on to review two New Zealand industrial applications o f RO technology, one for boron removal from a geothermal groundwater and one for residual nitrate removal. The concept designs are presented highlighting differences in the design approach, costs and risks.
KEYWORDS
Membrane, ion exchange, Spiral Wound Cellulose Acetate (SWCA), Thin Film Composite (TFC), Silt Density Index (SDI), Clean-in-Place (CIP).

2
Figure 1: Reverse Osmosis principle, c/o www.Purepro.net
Figure 2: Yuma Desalination Plant, photo c/o www.usbr.gov.lr
1 INTRODUCTION
Reverse Osmosis (RO) involves the separation of
dissolved species, or solutes (typically salts) through reversing the natural osmotic gradient which occurs between solutions of differing solute concentrations, across a semi permeable membrane. Separation is driven by applied hydraulic pressure. Figure 1 opposite illustrates this principle.
1.1 RO – A BRIEF HISTORY
The following summary provides a timeline of key RO discoveries and innovations:
1748, discovery of the process of osmosis through a semi permeable membrane was first observed, Jean Antoine Nollet (Fr);
The first membrane desalination experiments did not take place for another 200 years until the late 1940’s and mid 1950 by two US Universities;
1959, Loeb and Sourirajan of UCLA produced the first asymmetric RO membrane1. This was a major breakthrough and was pivotal on leading to the commercial viability of membrane desalination;
1965, first desalination plant constructed,
capacity 19 m3/d, California. Operating at 41 bar g, 34 L/m2/h flux and 50 percent recovery. Other plants followed in Florida and California due to limitation of fresh water and increased industrialisation;
1977, first membrane softening plant, Pelican
Bay, Florida. Membranes specifically for Natural Organic Matter (NOM2) removal then followed;
1992, largest US desalination plant based, Yuma (Az), 275 ML/d ( Figure 2, opposite). Plant used for desalinating excess irrigation water flowing in to Colorado River.
1.2 DISTINCTION OF RO RELATIVE TO OTHER MEMBRANE PROCESSES
RO is among the membrane class in water treatment which include s:
Microfiltration (MF);
Ultrafiltration (UF);
Nanofiltration (NF);
1 Asymmetric membranes are formed from a single material that develops in to active and support layers during the casting
process.2 Waters with NOM are characterised by presence of colour and organic material.

3
Figure 3 depicts the contamination spectrum which governs species removed by the respective membrane class. Note there is significant overlap, particularly between MF and UF class.
Figure 3 Contamination Spectrum
Whereas MF and UF may be physicochemically defined as ‘filters’ in that they remove particulate matter, RO provides separation of ionic (dissolved) species and therefore is not classed as a filtration process. RO are defined and differentiated by the types of species rejected, pore dimensions and operating pressures.
RO manufacturers achieve specific separation goals by manipulating chemical formulations of the membrane material and character to achieve permeation capabilities and rejection characteristics. Over the last 15-20 years, intense development has been in the Low Pressure (LP) market, with the key drivers of improving energy economiesand widening the application base.
Figure 4 shows a typical RO flow schematic, with pretreatment (sand and cartridge filtration) followed by the ROitself. The RO elements are housed in pressure vessels, mounted horizontally or vertically. These are typically 100 mm or 200 mm in diameter. Chemicals are required for controlling scale formation (antiscalent) and for periodic Clean-in-Place (CIP) operations.

4
Figure 4 Typical RO System Schematic Diagram c/o www.thewatertreatments.com

5
Figure 5: RO Block Diagram
2 DESIGN BASICS
RO technology requires specialist design expertise, which is typically delivered by the membrane supplier in tandem with the process designer. In many ways the RO can be considered ‘black box’ technology therefore it is important that the designer (e.g. consultant) works closely with the membrane supplier to achieve the design goals, both in the design and construct phases of a project. Relevant design activities include :
Se lecting the basic desired performance criteria: capacity, recovery, rejection and permeate water quality;
Evaluating alternatives for membrane equipment and operation, including selecting the type of membrane element (e.g. SWCA 3 or TFC4) and determine the array configuration5;
Se lect feed water pretreatment requirements;
Se lect concentrate treatment and disposal requirements.
Many of these need to be performed concurrently and iterativelyto determine the most economical design. Because the complexity of the calculations and dependence on membrane suppliers
information and performance data, array design if often undertaken with specialist design software provided by the membrane manufacturer. Figure 5 opposite below shows a typical block diagram for an RO system.
T he basis for design includes the required net capacity, characteristics of the feed water quality, including the turbidity, total dissolved solids (TDS) and Silt Density Index (SDI) from laboratory or historical data. Pilot testing is often advisable t o inform the full scale design criteria, manage scale up risks and navigate commercial viability.
Figure 6 Advanced 3D Design of RO Facility. Image c/o Pure Aqua Inc.
3 Spiral Wound Cellulose Acetate
4 Thin Film Composite
5 Number of stages, number of passes, number of elements in a pressure vessel, number of vessels in each stage

6
2.1 TERMINOLOGY
Some key basic terms relevant to the design process are outlined as follows:
FluxThe membrane flux is the quantity of water passage through a fixed membrane area over time. In SI Units the flux is
expressed as L/m2/h. This is a key design criterion and membrane suppliers nominate the flux to determine the required membrane area (m2) for a given application. Flux rates require normalisation6.
RecoveryRecovery is the quantity of water processed through the membrane unit expressed as a percentage of the feed. Typically this rate is 75-80% however figures as high as 90-95% can be achieved. The level of recovery depends largely on the feed water T otal Dissolved Solids (TDS) concentration, in addition to other factors, including the membrane characteristic itself. A higher recovery rate can be achieved at higher operating pressures, albeit at a cost ,and the economics of doing so must be assessed over the operating life of the plant. A portion of the reject may be
recycled to the head of the RO to maximise recovery with a portion bled to drain to avoid overconcentration (and therefore scale forming risk) in the recycle loop.
Clean-in-Place (CIP) IntervalAs pointed out above, membrane suppliers use particular software programmes as a selection aide for their application engineering regarding their membrane range 7. The outputs include indication of CIP interval. This is important as a low interval (high frequency) may entail higher downtime, chemical demand and waste production than would otherwise be desired. CIP may be minimised through effective pretreatment and antiscalent dosing for example. A typical interval is 30-60 days of continuous operation.
2.2 THE IMPORTANCE OF PRETREATM ENT
Almost all RO applications require pretreatment. T his is typically to prevent or arrest scaling, that is the precipitation of salts or contaminants that are deleterious to membrane performance. Scaling can cause irreversible fouling on the membrane should be minimised. Avoidance strategies may include:
pH8 adjustment ;
antiscalant dosing.
The manipulation of pH changes the solubility of precipitates whereas, whereas antiscalants interfere with crystal formation or slow the rate of precipitation formation. A case study example illustrating this is discussed later in the paper.
A cost trade off exists between methods of preventing scaling, operating at a lower recovery or the use of pretreatment processes and chemicals. In some cases, it may be more cost effective to operate at a lower recovery to minimise pretreatment costs. Pretreatment and membrane equipment costs must be considered simultaneously and the design recovery set at the point that minimises overall system costs over the design life.
Particle RemovalParticulate matter must be predominantly removed before the membrane as this may clog the feed channels and foul
the membrane. In general, membrane suppliers require pre filtration to 5 m particle, for example through well designed and operated granular filtration or cartridge filtration. Additional treatment stages may be necessary for surface waters including granular filtration or membrane filtration (MF or UF class).
6 Normalisation simplifies raw operational data into meaningful and accurate trends for operators. The process removes potentially confusing conflicts between process variables including pressure, temperature and osmotic pressure.7 E.g. ROSA (Reverse Osmosis System Analysis), c/o DOW Water and Process Solutions
8 Hydrogen ion concentration

7
Figure 7 Spiral Wound modules c/o www.aquaaccess.com
Biofilm preventionBiofilm prevention may include disinfection through prechlorination or preozonation, however some membrane materials are incompatible with disinfectant residuals and this must be addressed in the design process. The membrane supplier application engineers advice should be sought to match the chemical treatment regime with the membrane type.
2.3 TYPES OF MEMBRANE M ODULE
Spiral Wound (SW) ModulesSpiral- wo und modules (Figure 7, opposite) use a sandwich of flat sheet membranes and supports, wrapped spirally around acollection tube. The feed flows in against one end of the rolled spiral and along one side of the membrane sandwich. The support layers are designed to minimise pressure drop and allow a high packing density.
The spiral-wound modules can be designed by e quipment suppliers to promote turbulence and therefore increase the mass transfer across the membrane or to provide an uninterrupted flow path to decrease membrane fouling. Spiral wo und modules offer greater packing densities than other membrane types, but maintenance can
be challenging in compact environments. Figure 8 belo w shows a typical SWCA RO plant, capacity estimated at 40 ML/d.
Figure 8 Industrial SWCA RO plant
8
Figure 9 Single Hollow Fibre Section, image c/o www.pall.com
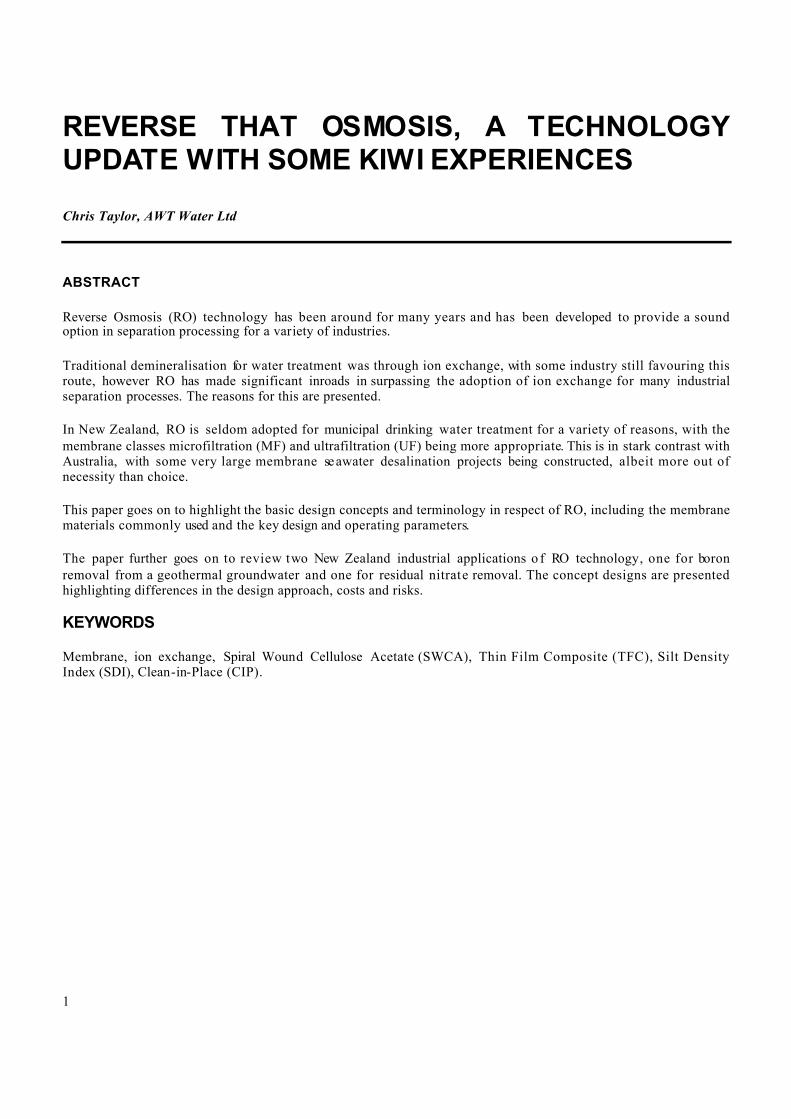
Hollow Fibre ModulesHollow fibre modules consist of small diameter membrane fibres (less than 1 mm in diameter) bundled within cylindrical pressure vessels. Figure 9 opposite shows a section of a single hollow fibre under microscope. The fibres are pressurised from the outside and the permeate flows to the interior bore or lumen of the fibre and down the length of the fibre to the product header. Fibres can also be pressurised from the inside, but greater mechanical strength of
the fibres is necessary to prevent fibre rupture. By feeding on the shell side (outside) of the fibres, a lower pressure drop is encountered down the bore of the fibre since the permeate flow rate is less than the feed flow rate. Hollow fibre modules offer the greatest packing densities.
Tubular ModulesTubular modules have membranes supported within the inner part of tubes. The operator can easily service feed and permeate channels to remove fouling layers during CIP operations. Tubular modules are somewhat resistant to
fouling when operated with a turbulent feed flow. This is accomplished with larger flow channels than those usedwith hollow fibre and spiral wound modules. The drawbacks of tubular modules are their high energy requirementsfor pumping large volumes of water, high capital costs, and low membrane surface area per unit volume of module.
9
3 RO VERSUS ION EXCHANGE – WHICH IS BEST?
Ion exchange is primarily used for water softening and demineralisation.
Applications for municipal water treatment can include removal of hardness (softening), nitrate and arsenic removal. Boiler feed water supplies are commonly demineralised as a prerequisite to avoid scale formation in boilers.
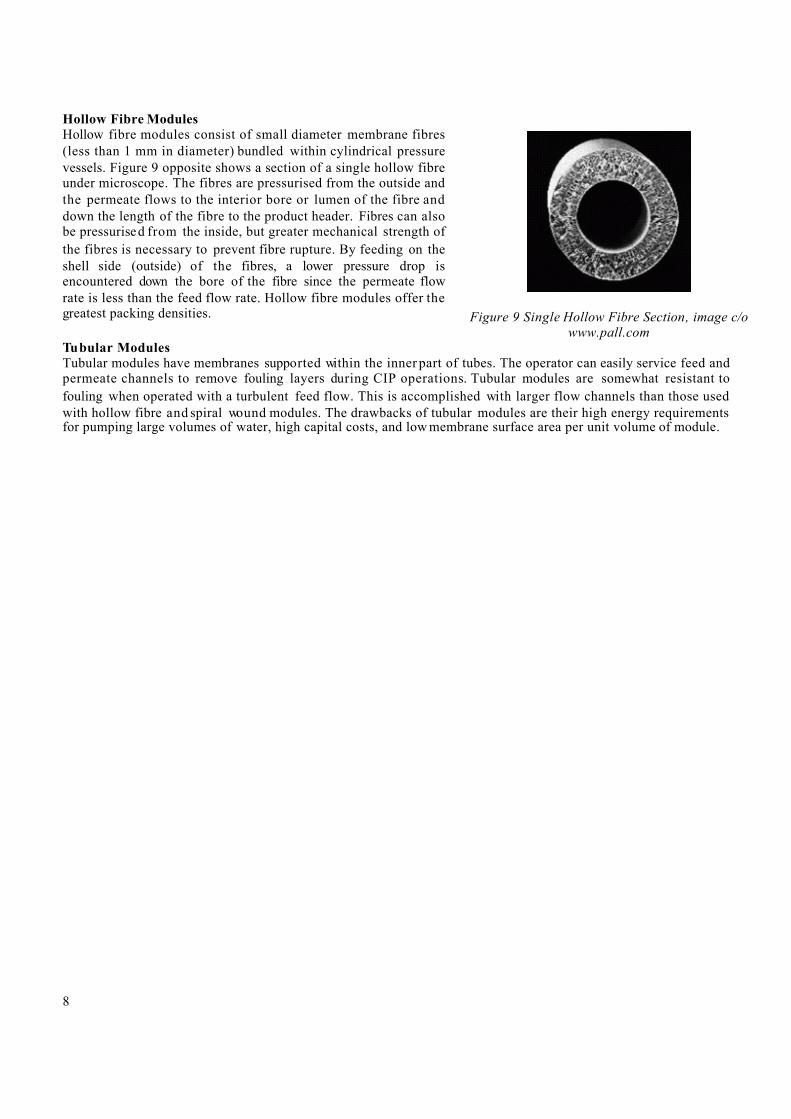
Like RO, the process takes place in pressure vessels however these are typically vertical, lined steel vessels with the media resting on a nozzle plate. System operating pressures are typically 4-8 bar g. Figure 10opposite shows a conventional ion exchanger arrangement .
For many years, ion exchange was traditionally used in water treatment for removing ionic species or contaminants however this trend has changed, particularly over the last 20 years or so, in favour of membrane treatment .
The following key factors have contributed to this general trend:
Lowering unit prices of membranes;
Low Pressure (LP) genre of membranes, in turn reducing power consumption from traditional high pressure membrane applications;
Improved whole of life costs for capital ownership;
Improved active membrane life;
Improve recovery rates and reduced waste (from brine reject);
Improved resistance to fouling and development of antiscalent technology.
Ion exchange still plays an important separation process role, with a number of New Zealand multi site industrials retaining favour for ion exchange. To the author’s knowledge, no municipal water treatment plants have adopted ion exchange in New Zealand. This contrasts with UK, where during the 1960s and 1970s in particular, many ion exchange softening plants were installed. This trend did not carry over to New Zealand however with hard water addressed through other means, if at all9.
9In 2006-7 Whanganui District Council considered ion exchange for softening the bulk Kai Iwi supply (total hardness > 200
mg/L as CaCO3).
Figure 10 Conventional ion exchanger arrangement

10
4 RECENT INNOVATONS IN RO TECHNOLOGY
In recent years a number of innovations have been developed by membrane suppliers including:
Improvements to LP membrane performance, particularly in terms of energy consumption and membrane
life;
Development of high rejection and high flux membranes;
Contaminant tracing models for design and operations optimisation. An example of this follows in Section
4.1;
Use of materials research to improve flux and permeability characteristics.
4.1 NALCO 3D TRASAR10
This technology is marketed by Nalco for the performance management of membrane systems. The system enables monitoring and control of antiscalant programmes and monitoring of key parameters for the membrane systemincluding flows, pressures, feed water temperature and conductivit ies.
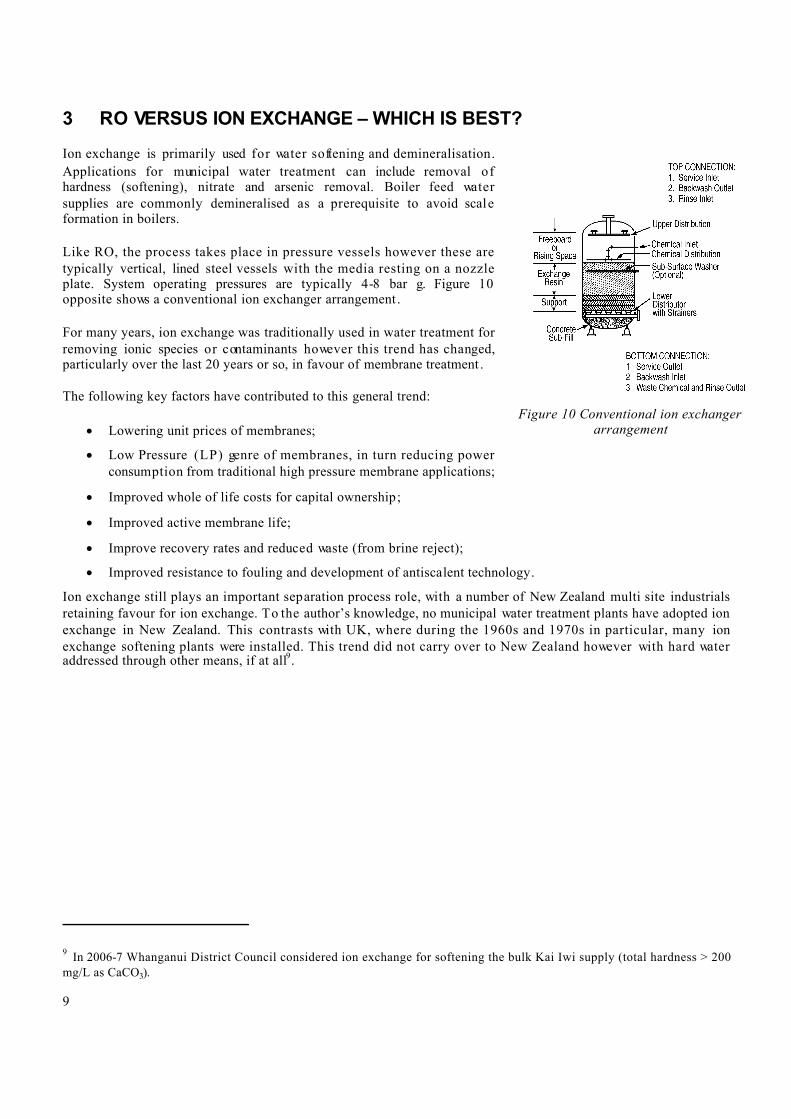
The samples and signals from sensors needed for monitoring, control and normalisation calculations for the 3D TRASAR® system are shown overleaf in Figure 11.
Fluorometers A, B and C measure the fluorescence values of the untreated feedwater (background), treated feedwater and concentrate;
C1 feed conductivity and temperature values are obtained from 3D TRASAR probes. C2 permeate conductivity is taken from an existing customer sensor;
P1, P2, P4 pressure values are taken from existing customer sensors. There is no sensor for P5 permeate pressure, needed for normalisation;
F1 permeate flow and F2 concentrate flows are taken from existing customer sensors.
The following additional signals are also received by the customer’s control unit:
Pressure values (pre- and post-sand filters);
Pressure values (post-cartridge filters);
pH and ORP from fluorometer B;
Concentrate conductivity from fluorometer C.
10 Section material c/o Nalco
11
Figure 11 Schematic showing the layout of data-gathering points used to control the antiscalant programme
Benefits claimed by the manufacturer include:
Consistent operation of the RO plant, particularly avoiding problems from scaling and the related costs of
membrane cleaning or replacement;
Progressive reduction in the treatment programme components, lowering cost of ownership;
Enhanced dosage control & increased dosage accuracy;
Reduced environmental impact due to lower feed water needs and lower concentrate rejection .
For further information refer to www.nalco.com.

12
5 NEW ZEALAND CASE STUDIES
As pointed out above, New Zealand has no RO plants servicing local authorities for public water supplies. The key reasons for this are:
Abundance of fresh water ecosystems, and
Limited salinity intrusion to drinking water catchments.
AWT Water assisted in a feasibility study for a local authority Client during 2010 for a side stream RO application tender design, however this project was deferred.
The author has assisted Christchurch City Council in assessments of RO desalination as a water supply option for Akaroa Township (populat ion circa. 400) since 2005. This town has sometimes serious water supply security challenges. The project has advanced since this time and is now in advanced stage of design, based upon pressure UF technology.
The following section outlines some selected RO case studies in the industrial market.
5.1 WATER PROCESSING FACILITY (CLIENT CONFIDENTIAL)
Application details:
Capacity: 20 m3/h;
Design: twin pass;
Membranes per vessel: 6;
Tube material: FRP;
Function: boron (borate, H2BO3) removal, pH > 10;
Membrane recovery: 80%;
Membrane type: DOW FilmTec SW30;
CIP interval: weekly.
The raw water feed is a deep geothermal groundwater, operating at greater that 20 degrees Celsius. The water contains high levels of silica and boron and is moderately hard.
This system operates at 12-14 bar g and provides separation of precipitated boron (borate form) from the feed waterthrough a two stage process. This is achieved through alkali dosing prior to the second stage. Pre treatment includes granular media sand filtration, GAC filtration, base exchange softening and cartridge filtration.
AWT Water assisted the operators with improvement strategy to improve membrane recovery including revised CIP Standard Operating Procedures (SOPs).

13
Figure 13 Boric Acid and Borate Solubility Curves, diagram c/o www.lenntech.nl
Figure 13 indicates the target pH range for borate precipitation however removal must be balanced with costs of alkali dosing.
5.2 MILK PROCESSING FACIL ITY (CLIENT CONFIDENTIAL)
Application details:
Capacity: 120 m3/h;
Design: 2 skids, single pass, 2 stage;
Membranes per vessel: 6;
Tube material: FRP;
Function: nitrate removal to < 1.0 mg/L NO3;
Membrane recovery: 85%;
Membrane type: DOW FilmTec TFC SW30;
CIP interval: monthly.
The raw water feed is a groundwater with high natural nitrate presence (> 50 mg/L NO3). The product water is used for various process water end uses including boiler feed. The system may be expanded to replace demand from a poorly designed ion exchange plant.
This system operates at 6 bar g and operates in direct filtration with 5 m guard filters to protect the membrane elements. T he filters are integrally mounted on the RO skids.

14
6 SUMMARY AND CONCLUSIONS
RO has and will continue to be an important water treatment process around the world, however New Zealand does
not require RO presently for the reasons discussed. It is possible that RO may be adopted in the future if water quality declines and saline intrusion increases within our drinking water catchments.
The largest RO plant constructed to data is Yuma (Az, US) at 275 ML/d, 1992. This plant was based upon an irrigation application.
Pretreatment is crucial to remove particulate matter and the bulk of organic material in the feedwater before the RO membrane. The technology of antiscalant dosing has improved markedly in recent years and this can assist in prolonging active membrane life, albeit the costs must be sighted and managed during the design process.
Designers must liaise with the membrane supplier for specific performance advice and support. This may necessitate pilot testing to inform full scale design.
A number of advances have been made in recent years including Lo w Pressure (LP) technology and state-of-the-art monitoring systems to improve reliability and achieve a lower whole of life cost burden. An example of such a system (3D TRASAR) is cited.
Although no municipal RO plants exist in New Zealand for drinking water supply, a num ber of industrial applications use RO including milk processing, power generation and food and beverage industries.
REFERENCES
1 Water Treatment : Principles and Design, 2nd Edition, Wiley Publishing, MWH Inc., ISBN: 978-0-471-11018-7, 2005.
2 Technology Transfer Capsule Report, Reverse Osmosis, US EPA Office of Research and Department EPA/625/R-961009 (1996).
3 Nalco Corporation, Case Study CH-1158E, 3D TRASER, www.nalco.com
4 Nalco Chemical Company, Technifax®, Ion exchange processes, 1998.
Figures obtained from various public domain sources. If further information is required regarding source please contact the author.