Reverse
283
Going Backwards: Reverse Logistics Trends and Practices
-
Upload
tehakelew-tefera -
Category
Business
-
view
183 -
download
2
Transcript of Reverse

Going Backwards:Reverse Logistics Trends and
Practices

Going Backwards:Reverse Logistics Trends and
Practices
University of Nevada, RenoCenter for Logistics Management
Dr. Dale S. RogersDr. Ronald S. Tibben-Lembke
1998, Reverse Logistics Executive Council

Contents in Brief
CHAPTER 1: SIZE AND IMPORTANCE OF REVERSE LOGISTICS 1
CHAPTER 2: MANAGING RETURNS 37
CHAPTER 3: DISPOSITION AND THE SECONDARY MARKET 73
CHAPTER 4: REVERSE LOGISTICS AND THE ENVIRONMENT 101
CHAPTER 5: EUROPEAN REVERSE LOGISTICS 137
CHAPTER 6: INDUSTRY SNAPSHOTS 159
CHAPTER 7: FUTURE TRENDS AND CONCLUSIONS 187
APPENDIX A: LETTER/COPY OF SURVEY 211
APPENDIX B: DATA TABULATION 219
APPENDIX C: FOR MORE INFORMATION 235
APPENDIX D: EDI 180 TRANSACTION SET 241
GLOSSARY 255
ENDNOTES 267
INDEX 277
ABOUT THE AUTHORS 281

vi Rogers and Tibben-Lembke

Reverse Logistics vii
Table of ContentsCONTENTS IN BRIEF .....................................................................................V
TABLE OF CONTENTS .................................................................................VII
LIST OF TABLES ..........................................................................................XI
LIST OF FIGURES .......................................................................................XIII
AUTHORS’ NOTES ......................................................................................XV
REVERSE LOGISTICS EXECUTIVE COUNCIL MEMBERS ...............................XVII
PREFACE...................................................................................................XIX
CHAPTER 1: SIZE AND IMPORTANCE OF REVERSE LOGISTICS 1
1.1 IMPORTANCE OF REVERSE LOGISTICS.................................................11.2 REVERSE LOGISTICS ACTIVITIES ........................................................91.3 STRATEGIC USE OF REVERSE LOGISTICS .......................................... 141.4 REVERSE LOGISTICS CHALLENGES................................................... 271.5 BARRIERS TO GOOD REVERSE LOGISTICS ......................................... 32
CHAPTER 2: MANAGING RETURNS 37
2.1 IMPROVE RETURN "GATEKEEPING".................................................. 382.2 COMPACT DISPOSITION CYCLE TIME................................................ 422.3 REVERSE LOGISTICS INFORMATION SYSTEMS ................................... 432.4 CENTRALIZED RETURN CENTERS ..................................................... 502.5 ZERO RETURNS ............................................................................... 602.6 REMANUFACTURE AND REFURBISHMENT ......................................... 642.7 ASSET RECOVERY ........................................................................... 662.8 NEGOTIATION ................................................................................. 682.9 FINANCIAL MANAGEMENT .............................................................. 692.10 OUTSOURCING REVERSE LOGISTICS ................................................. 70
CHAPTER 3: DISPOSITION AND THE SECONDARY MARKET 73
3.1 OVERVIEW OF THE REVERSE LOGISTICS FLOW ................................. 733.2 RETURNED PRODUCT TYPES ............................................................ 753.3 PRODUCT DISPOSITION .................................................................... 783.4 MATERIAL FLOW ............................................................................ 863.5 SECONDARY MARKETS.................................................................... 893.6 SECONDARY MARKET FIRMS ........................................................... 923.7 STRATEGIC ELEMENTS OF THE SECONDARY MARKET ....................... 99
CHAPTER 4: REVERSE LOGISTICS AND THE ENVIRONMENT 101
4.1 LANDFILL COSTS AND AVAILABILITY ............................................ 1034.2 TRANSPORT PACKAGING ............................................................... 113

viii Rogers and Tibben-Lembke
4.3 RETURNABLE PACKAGING CONSIDERATIONS ................................. 1254.4 PRODUCT TAKE-BACK................................................................... 133
CHAPTER 5: EUROPEAN REVERSE LOGISTICS 137
5.1 GERMAN PACKAGING LAWS .......................................................... 1375.2 TRANSPORT PACKAGING ............................................................... 1465.3 PRODUCT TAKE-BACK................................................................... 1495.4 EUROPEAN CONCLUSIONS ............................................................. 157
CHAPTER 6: INDUSTRY SNAPSHOTS 159
6.1 PUBLISHING INDUSTRY.................................................................. 1596.2 COMPUTER / ELECTRONIC INDUSTRY ............................................. 1676.3 AUTOMOTIVE INDUSTRY ............................................................... 1756.4 RETAIL INDUSTRY ......................................................................... 1826.5 CONCLUSIONS............................................................................... 185
CHAPTER 7: FUTURE TRENDS AND CONCLUSIONS 187
7.1 REDUCING THE REVERSE LOGISTICS FLOW..................................... 1877.2 MANAGING REVERSE LOGISTICS FLOW .......................................... 2027.3 CONCLUSIONS............................................................................... 209
APPENDIX A: LETTER/COPY OF SURVEY 211
APPENDIX B: DATA TABULATION 219
APPENDIX C: FOR MORE INFORMATION 235
APPENDIX D: EDI 180 TRANSACTION SET 241
D.1 EDI BASICS .................................................................................. 241D.2 EDI 180 TRANSACTION SET .......................................................... 245D.3 CRITICISMS OF THE 180 SET .......................................................... 249D.4 COMPLETE 180 TRANSACTION SET TABLE ..................................... 252
GLOSSARY 255
ENDNOTES 267
INDEX 277
ABOUT THE AUTHORS 281

Reverse Logistics ix

Reverse Logistics xi
List of Tables1.1 Supply Chain Position of Survey Respondents..............31.2 Sample Return Percentages..............................................71.3 Common Reverse Logistics Activities ...........................101.4 Characterization of Items in Reverse Flow ...................131.5 Strategic Role of Returns ................................................181.6 Problem Returns Symptoms...........................................301.7 Barriers to Reverse Logistics ..........................................33
2.1 Key Reverse Logistics Management Elements .............372.2 Return Reason Codes......................................................482.3 Disposition Codes ...........................................................492.4 Impact on Profitability ...................................................562.5 Typical Benefits of a Centralized Return Center ..........602.6 Remanufacturing and Refurbishing Categories ...........64
3.1 Reasons for Returns ........................................................74
4.1 Costs of Utilizing Reusable Containers....................... 129
6.1 Book Returns as a Percentage of Gross Revenue........ 1616.2 Comparison of Disposal Options between
Retailers and Manufacturers ........................................ 1846.3 Comparison of Technologies Utilized to Assist
Reverse Logistics Processes, byRetail and Manufacturing Segments ........................... 185
7.1 Key Reverse Logistics Management Elements ........... 208
D.1 Sample EDI Transaction Purchase Order.................... 243D.2 RDR Segment Diagram Key......................................... 246

xii Rogers and Tibben-Lembke
D.3 1292 Returns Disposition Data Element...................... 246D.4 1293 Return Request Reason Data Element ................ 247D.5 1294 Return Response Reason Data Element.............. 248D.6 180 Transaction Set Table ............................................. 253

Reverse Logistics xiii
List of Figures
1.1 Size of Research Respondents .......................................41.2 Return Policy Distribution...........................................201.3 Change in Return Policies............................................221.4 Kenneth Cole Advertisement ......................................241.5 The Chasm between Manufacturers and Retailers....28
3.1 Flow of Returns and Secondary Market Goods.........90
4.1 Rigid Plastic Totes ...................................................... 1174.2 Rigid Plastic Totes with Integral Lids....................... 1174.3 Folding Plastic Bulk Containers................................ 1184.4 Folded Plastic Bulk Container................................... 1194.5 Collapsible Wooden Container ................................. 1194.6 Disassembled Containers Fold Flat .......................... 1204.7 Sectional Wooden Containers ................................... 121
5.1 German “Green Dot” Symbol ................................... 1395.2 Flow of Materials in German DSD............................ 1415.3 Transportation Packaging Coded for Recycling
In Germany ................................................................. 147
6.1 Independent Booksellers’ Market Share................... 1646.2 Problems with Computer Lifecycles......................... 168
7.1 Inventory-Driven Carrying Costs ............................. 190
D.1 EDI Transaction Structure ......................................... 242

Reverse Logistics xv
Authors’ NotesThere are many people who have made this piece of workpossible. This project has truly been a group effort. Withoutthe assistance of several student research assistants thiswork could have not been completed. Mihaela Ghiuca, the1998-99 Reverse Logistics Executive Council Fellowshipstudent; Jacob Brothers, now of Minute Maid; HeatherGoulding, now of Skyway Logistics; Jin Hong and LilySchwartz of Sun Microsystems; Ruohong Zhao of DellComputer; and Ayub Khambaty, now of Chrysler; haveprovided many hours of research support. Additionally,Sandy Davis of GENCO, Jennie Tibben-Lembke and DeanaRogers provided valuable editorial assistance. Genet Sauer,Program Manager of the University of Nevada Center forLogistics Management, spent many hours keeping us ontrack and making this book a reality. She has been a greathelp to us and added to the fun of this project.
The amount of assistance and support from GENCODistribution System has been phenomenal. In particular,Herb Shear, Jerry Davis, Dan Eisenhuth, Curtis Greve,Dwight “Buzzy” Wyland, and Frank Koch spent many hoursin support of this project. GENCO is a third party logisticsservice supplier that specializes in reverse logistics. Theirfunding made this project possible. Their willingness tomake suppliers, customers, competitors, and themselvesavailable for interviews was extremely helpful. They are agood bunch of people who have done all they could to assistthe research. We are very grateful for their support.

xvi Rogers and Tibben-Lembke
We would also like to thank the Reverse Logistics ExecutiveCouncil for their ideas and financial support. Peter Junger ofNintendo of America, Ed Winter of Kmart Corporation, andClay Valstad from Sears, Roebuck and Company stand outas being especially helpful.
Finally, without the support of our families, this task wouldhave been hopeless. We have spent many hours away fromhome trying to learn new things.
Given the caliber of our support team, it would seemimpossible that there might be errors or omissions containedin this book. However, it is possible that we omittedsomething in the execution of this project. Reverse logisticsis a fairly new field that stands open both to much study ofcurrent practice and potential improvements. If there areany inadvertent mistakes or omissions, they are completelyour responsibility.
Dale S. RogersRonald S. Tibben-LembkeReno, NevadaAugust 1998

Reverse Logistics xvii
Reverse Logistics Executive Council FoundingMembers
Avery DennisonBlack & Decker Inc.Braun, Inc.Canadian Tire Corp.CosmairEgghead SoftwareFederated Department StoresGENCO Distribution SystemHome Shopping NetworkKmart CorporationLevi Strauss & Co.NikeNintendo of AmericaPolo / Ralph LaurenSears, Roebuck, & Co.Sharp Electronics Corp.Sony Electronics Inc.Surplus DirectTarget StoresThompson Consumer Electronics

xviii Rogers and Tibben-Lembke

Reverse Logistics xix
Preface
The purpose of this book is twofold: to present an overviewand introduction to reverse logistics, and to provide insightson how to manage reverse logistics well.
Reverse logistics is a new and emerging area, and as such,only a limited amount of information has been published todate. When possible, we have tried to present additionalsources of information for the interested reader. However,in some chapters, such as Chapter 3 on Secondary Markets,no written information exists. When documentation wasunavailable, information was gained through interviews,many of which were conducted on the condition ofanonymity.

Chapter 1: Size and Importance ofReverse Logistics
1.1 Importance of Reverse Logistics
Research ScopeThis project intends to define the state of the art in reverselogistics, and to determine trends and best reverse logisticspractices. Part of the research charter was to determine theextent of reverse logistics activity in the United States. Mostof the literature examined in preparation for this researchemphasized the “green” or environmental aspects of reverselogistics. In this project, green issues are discussed, but theprimary focus is on economic and supply chain issuesrelating to reverse logistics. The objective was to determinecurrent practices, examine those practices, and developinformation surrounding trends in reverse logisticspractices.
To accomplish this task, the research team interviewed over150 managers that have responsibility for reverse logistics.Visits were made to firms to examine, firsthand, reverselogistics processes. Also, a questionnaire was developedand mailed to 1,200 reverse logistics managers. There were147 undeliverable questionnaires. From among the 1,053that reached their destinations, 311 usable questionnaireswere returned for a 29.53 percent response rate. A copy ofthe questionnaire is included in Appendix A.

2 Rogers and Tibben-Lembke
What is Reverse Logistics?Logistics is defined by The Council of Logistics Managementas:
The process of planning, implementing, and controlling theefficient, cost effective flow of raw materials, in-processinventory, finished goods and related information from thepoint of origin to the point of consumption for the purpose ofconforming to customer requirements.
Reverse logistics includes all of the activities that arementioned in the definition above. The difference is thatreverse logistics encompasses all of these activities as theyoperate in reverse. Therefore, reverse logistics is:
The process of planning, implementing, and controlling theefficient, cost effective flow of raw materials, in-processinventory, finished goods and related information from thepoint of consumption to the point of origin for the purpose ofrecapturing value or proper disposal.
More precisely, reverse logistics is the process of movinggoods from their typical final destination for the purpose ofcapturing value, or proper disposal.
Remanufacturing and refurbishing activities also may beincluded in the definition of reverse logistics. Reverselogistics is more than reusing containers and recyclingpackaging materials. Redesigning packaging to use lessmaterial, or reducing the energy and pollution fromtransportation are important activities, but they might be

Chapter 1: Importance of Reverse Logistics 3
better placed in the realm of “green” logistics. If no goods ormaterials are being sent “backward,” the activity probably isnot a reverse logistics activity.
Reverse logistics also includes processing returnedmerchandise due to damage, seasonal inventory, restock,salvage, recalls, and excess inventory. It also includesrecycling programs, hazardous material programs, obsoleteequipment disposition, and asset recovery.
Respondent BaseCompanies included in this research are manufacturers,wholesalers, retailers, and service firms. In some cases, afirm may occupy more than one supply chain position. Forexample, many of the manufacturers are also retailers andwholesalers. The supply chain position of the researchrespondents is depicted in Table 1.1.
Table 1.1Supply Chain Position
Supply Chain Position Percentage ofRespondents
Manufacturer 64.0%Wholesaler 29.9%Retailer 28.9%Service Provider 9.0%

4 Rogers and Tibben-Lembke
Most of the firms included in the research are very largecompanies. As is depicted in Figure 1.1 below, nearly half ofthe firms have annual sales of $1 billion or larger.
Interest in Reverse LogisticsAwareness of the art and science of logistics continues toincrease. Additionally, great interest in reverse logistics hasbeen piqued. Many companies that previously did notdevote much time or energy to the management andunderstanding of reverse logistics, have begun to payattention. These firms are benchmarking return operationswith best-in-class operators. Some firms are even becoming
0%5%
10%15%20%25%30%35%40%45%50%
Per
cen
t of
Res
pon
den
ts
<$10M
$50-$100 M
$200-$500 M
> $1 B
Annual Sales
Figure 1.1Size of Research Respondents

Chapter 1: Importance of Reverse Logistics 5
ISO certified on their return processes. Third partiesspecializing in returns have seen a great increase in thedemand for their services.
In addition to this research project, several other academicendeavors focusing on the reverse flow of product are inprocess. Leading-edge companies are recognizing thestrategic value of having a reverse logistics managementsystem in place to keep goods on the retail shelf and in thewarehouse fresh and in demand.
Size of Reverse LogisticsA conservative estimate is that reverse logistics accounts fora significant portion of U.S. logistics costs. Logistics costsare estimated to account for approximately 10.7 percent ofthe U.S. economy.1 However, the exact amount of reverselogistics activity is difficult to determine because mostcompanies do not know how large these are. Of the firmsincluded in this research, reverse logistics costs accountedfor approximately four percent of their total logistics costs.Applying this mean percentage to Gross Domestic Product(GDP), reverse logistics costs are estimated to beapproximately a half percent of the total U.S. GDP. Delaneyestimates that logistics costs accounted for $862 billion in1997. The estimate of this research, based on the respondentsample, is that reverse logistics costs amounted toapproximately $35 billion in 1997. The magnitude andimpact of reverse logistics varies by industry and channelposition. It also varies depending on the firm’s channelchoice. However, it is clear that the overall amount of

6 Rogers and Tibben-Lembke
reverse logistics activities in the economy is large and stillgrowing.
Within specific industries, reverse logistics activities can becritical for the firm. Generally, in firms where the value ofthe product is largest, or where the return rate is greatest,much more effort has been spent in improving returnprocesses. The auto parts industry is a good example. Theremanufactured auto parts market is estimated (by the AutoParts Remanufacturers Association) to be $36 billion.2 Forexample, 90 to 95 percent of all starters and alternators soldfor replacement are remanufactured. By one conservativeestimate, there are currently 12,000 automobile dismantlersand remanufacturers operating in the United States.
Rebuilding and remanufacturing conserves a considerableamount of resources. According to the ARPA, about 50percent of the original starter is recovered in the rebuildingprocess. This may result in saving several million gallons ofcrude oil, steel, and other metals. ARPA estimates that rawmaterials saved by remanufacturing worldwide would fill155,000 railroad cars annually. That many rail cars wouldmake a train over 1,100 miles long.
Return PercentagesThe reverse logistics process can be broken into two generalareas, depending on whether the reverse flow consistsprimarily of products, or primarily of packaging. Forproduct returns, a high percentage is represented bycustomer returns. Overall customer returns are estimated tobe approximately six percent across all retailers. Return

Chapter 1: Importance of Reverse Logistics 7
percentages for selected industries are shown in Table 1.2.In each case, return percentages were established by severaldifferent firms.
Table 1.2Sample Return Percentages
Industry PercentMagazine Publishing 50%Book Publishers 20-30%Book Distributors 10-20%Greeting Cards 20-30%Catalog Retailers 18-35%Electronic Distributors 10-12%Computer Manufacturers 10-20%CD-ROMs 18-25%Printers 4-8%Mail Order Computer Manufacturers 2-5%Mass Merchandisers 4-15%Auto Industry (Parts) 4-6%Consumer Electronics 4-5%Household Chemicals 2-3%
Clearly, return rates vary significantly by industry. Formany industries, learning to manage the reverse flow is ofprime importance.

8 Rogers and Tibben-Lembke
Direct RetailersComparatively, direct or catalog companies have higherreturn rates than most other retail channels. It is notunusual for a direct retailer to have return rates above 35percent. The mean level is approximately 25 percent. Thesecatalog firms have had to improve their management of thereturn process. An exception to this is build-to-order, directcomputer manufacturers that have lower rates of return thancomputer manufacturers that sell through traditional retailchannels.
Most catalog firms have developed returns programsinternally. They utilize their reverse logistics capabilitiesstrategically. As the old saying goes, necessity is the motherof invention. Because return rates for many of the catalogretailers have traditionally been high, a reduction in both thenumber of returns and the cost of those returns was needed.
One particularly good example of skillful reverse logisticsmanagement is the J.C. Penney Catalog Division. Theystruggled for many years with high rates of return. Theircatalog division operated independently from their retailstore division. By thinking about the profitability of thewhole corporation, and laying aside some difficultaccounting practices, they have been able to develop asystem that rewards the retail store managers for working toreduce expensive returns. When consumers decide to returna catalog purchase, they bring it back to the nearest store.The store managers are incented to disposition the itemthrough the retail store. If the item is not sold in the store,then it is sent back to the catalog distribution center. In

Chapter 1: Importance of Reverse Logistics 9
Chapter 2, the difficulties of running one distribution centerboth forward and backward are discussed. J.C. Penney hasbeen able to efficiently marry forward and backwarddistribution, primarily because reverse logistics is a priorityfor catalog distribution.
1.2 Reverse Logistics Activities
Typical reverse logistics activities would be the processes acompany uses to collect used, damaged, unwanted (stockbalancing returns), or outdated products, as well aspackaging and shipping materials from the end-user or thereseller.
Once a product has been returned to a company, the firmhas many disposal options from which to choose. Some ofthese activities are summarized in Table 1.3. If the productcan be returned to the supplier for a full refund, the firmmay choose this option first. If the product has not beenused, it may be resold to a different customer, or it may besold through an outlet store. If it is not of sufficient qualityto be sold through either of these options, it may be sold to asalvage company that will export the product to a foreignmarket.
If the product cannot be sold “as is,” or if the firm cansignificantly increase the selling price by reconditioning,refurbishing or remanufacturing the product, the firm mayperform these activities before selling the product. If thefirm does not perform these activities in-house, a third party

10 Rogers and Tibben-Lembke
firm may be contracted, or the product can be sold outrightto a reconditioning/remanufacturing/refurbishing firm.
After performing these activities, the product may be sold asa reconditioned or remanufactured product, but not as new.If the product cannot be reconditioned in any way, becauseof its poor condition, legal implications, or environmentalrestrictions, the firm will try to dispose of the product for theleast cost. Any valuable materials that can be reclaimed will
Table 1.3Common Reverse Logistics Activities
Material Reverse Logistics ActivitiesProducts Return to Supplier
ResellSell via OutletSalvageReconditionRefurbishRemanufactureReclaim MaterialsRecycleLandfill
Packaging ReuseRefurbishReclaim MaterialsRecycleSalvage

Chapter 1: Importance of Reverse Logistics 11
be reclaimed, and any other recyclable materials will beremoved before the remainder is finally sent to a landfill.
Generally, packaging materials returned to a firm will bereused. Clearly, reusable totes and pallets will be usedmany times before disposal. Often, damaged totes andpallets can be refurbished and returned to use. This workmay be done in-house, or using companies whose solemission is to fix broken pallets and refurbish packaging.Once repairs can no longer be made, the reusable transportpackaging must be disposed of. However, before it is sent toa landfill, all salvageable materials will be reclaimed.
European firms are required by law to take back transportpackaging used for their products. To reduce costs, firmsattempt to reuse as much of these materials as possible, andreclaim the materials when they can no longer be reused.
Reverse Flow of GoodsThe activities shown in Table 1.3 are the types that aregenerally considered the core of reverse logistics processes.Each of these activities gives rise to some interestingquestions, many of which will be addressed in this research.However, from a logistics perspective, the larger issuecommon to all of these activities is how the firm shouldeffectively and efficiently get the products from where theyare not wanted to where they can be processed, reused, andsalvaged. Also, the firm must determine the “disposition” ofeach product. That is, for each product, the firm mustdecide the final destination for products inserted into thereverse logistics flow.

12 Rogers and Tibben-Lembke
Classifying Reverse Logistics ActivitiesClearly, reverse logistics can include a wide variety ofactivities. These activities can be divided as follows:whether the goods in the reverse flow are coming from theend user or from another member of the distribution channelsuch as a retailer or distribution center; and whether thematerial in the reverse flow is a product or a packagingmaterial. These two factors help to provide a basicframework for characterizing reverse logistics activities,although other important classification factors exist.Regardless of their final destination, all products in thereverse flow must be collected and sorted before being senton to their next destinations. Where products are insertedinto the reverse flow is a prime determinant in the resultingreverse logistics system.
In Table 1.4, a number of reasons for products in the reverseflow have been placed within the context of this framework.If a product enters the reverse logistics flow from acustomer, it may be a defective product, or, the consumermay have claimed it was defective in order to be able toreturn it. The consumer may believe it to be defective eventhough it is really in perfect order. This category of returnsis called “non-defective defectives.”
If the product has not yet reached the end of its useful life,the consumer may have returned the product for service, ordue to a manufacturer recall. If the product has reached theend of its useful life, the customer may, in some cases, returnthe product to the manufacturer so the manufacturer candispose of the product properly, or reclaim materials.

Chapter 1: Importance of Reverse Logistics 13
If a supply chain partner returns a product, it is because thefirm has excess product due to an over-ordered marketingpromotion, or because the product failed to sell as well asdesired. Also, the product may have come to the end of itslife, or to the end of its regular selling season. Finally, theproduct may have been damaged in transit.
Given the relatively limited usage of reusable packaging inthe U.S., it is reasonable to say that the majority of reverse
Table 1.4Characterization of Items in Reverse Flow,
by Type and Origin
Source of Reverse FlowSupply Chain Partners End Users
Prod
ucts
Stock Balancing ReturnsMarketing ReturnsEnd of Life/SeasonTransit Damage
Defective/UnwantedProducts
Warranty ReturnsRecallsEnvironmental
Disposal Issues
Pack
agin
g
Reusable TotesMulti-Trip PackagingDisposal Requirements
ReuseRecyclingDisposal Restrictions

14 Rogers and Tibben-Lembke
logistics activities are related to the products only, and not topackaging. There are exceptions to this perception. Anumber of domestic firms are beginning to use reusablecontainers—such as plastic totes and knockdown cages.However, as will be described in Chapter 5, Europeanmanufacturers are required to take back the packaging forthat item. In such an environment, packaging and relatedmaterials account for a very significant amount of reverselogistics activities. As more U.S. firms establish a presencein Europe, reusable packaging will become morecommonplace.
1.3 Strategic Use of Reverse Logistics
Reverse Logistics as a Strategic WeaponWhen companies think about strategic variables, they arecontemplating business elements that have a long-termbottom line impact. Strategic variables must be managed forthe viability of the firm. They are more than just tactical oroperational responses to a problem or a situation.
Not long ago, the only strategic variables a firm was likely toemphasize were business functions, such as finance ormarketing. During the late 1970s and 1980s, some forward-thinking companies began to view their logistics capabilitiesas strategic.
Although more and more firms have begun to view theirability to take back material through the supply chain as an

Chapter 1: Importance of Reverse Logistics 15
important capability, the majority of these firms have not yetdecided to emphasize reverse logistics as a strategic variable.
There is no question that the handling of reverse logisticschallenges is an essential, strategic capability. In acelebrated case a few years ago, the McNeil Laboratoriesdivision of Johnson & Johnson experienced a very seriousthreat when someone poisoned several people by placingcyanide inside unopened bottles of Tylenol, a Johnson &Johnson flagship product. This horrible act happened twicein the space of a few years. The second time, Johnson &Johnson was prepared with a fine-tuned reverse logisticssystem and immediately cleansed the channel of anypossibly tainted product. Because Johnson & Johnson actedso quickly and competently, a mere three days after thecrisis, McNeil Laboratories experienced an all-time recordsales day. Undoubtedly, the public would not haveresponded so positively had Johnson & Johnson not beenable to quickly and efficiently handle its recalled productthrough its existing system in reverse. Clearly, the Tylenolincident is an extreme example, but it illustrates how reverselogistics capabilities can be strategic, and how they candramatically impact the firm.
Another example of how reverse logistics can be used byretailers as a strategic variable is by keeping consumerproduct fresh and interesting. According to quote DanEisenhuth, executive vice president for asset recovery atGENCO Distribution System, “Retailers used to liquidate tocompensate for ‘screw-ups.’ Today they do it to stay fresh.”

16 Rogers and Tibben-Lembke
The most important asset a retail store has is its retail space.To maximize profit per square foot of selling space, storeshave to keep the fresh goods visible. Grocery stores, withrazor-thin profits of one to two percent, realized long agothat it is critical to keep only products that will sell on theshelf. Supermarkets have to turn their inventoriesfrequently to prevent spoilage loss, and to maximize thereturn on their space. Now, non-grocery retailers havebegun to adapt supermarket ideas to their own businesses.
Grocery retailers started building reclamation centers in the1970s. These reclamation centers were places where old andnon-selling product would be sent. In many instances,reclamation centers would be attached to a store. Later on,supermarket chains began shipping obsolete or bad productto one central reclamation center for processing. Thesereclamation centers gave birth to the concept of centralizedreturn centers, which will be discussed in greater detail inChapter 2.
Reverse logistics is strategically used to allow forwardchannel participants—such as retailers and wholesalers—toreduce the risk of buying products that may not be “hotselling” items. For example, a record company developed aprogram to adjust return rates for various productsdepending on variables such as name recognition of theindividual recording artist. This program produces a win-win environment for both the producer and the retailer, notto mention the consumer, who gets a broader selection. Theprogram gives the company the ability to develop new artistfranchises. Had the record company not implemented this

Chapter 1: Importance of Reverse Logistics 17
program, its retailers would likely be willing to only carry“sure-thing” products.
Another example of the strategic use of returns is theelectronic distributor that, during a period of volatilememory chip prices, created a program to help resellersbetter control their inventory and balance stocks. Byallowing resellers to return anything within a reasonabletime frame, customers were encouraged to keep inventorylow and make purchases just-in-time.
Strategic uses of reverse logistics capabilities increase theswitching costs of changing suppliers. A goal of almostevery business is to lock customers in so that they will notmove to another supplier. There are many ways to developlinkages that make it difficult and unprofitable for customersto switch to another supplier. An important service asupplier can offer to its customers is the ability to take backunsold or defective merchandise quickly, and credit thecustomers in a timely manner.
If retailers do not have a strategic vision of reverse logisticstoday, it is likely that they will be in trouble tomorrow.Retailers in high-return categories—such as catalog, toys,and electronics—can easily go out of business if they do nothave a strong reverse logistics program. Given thecompetitive pressure on North American retailers, bottomline contributions provided by good reverse logisticsprograms are important to the firms’ overall profitability.For more than one mass merchandiser included in theresearch, the bottom line impact of good reverse logistics

18 Rogers and Tibben-Lembke
was large. Another large retailer found that 25 percent ofthe profit of the entire firm was derived from its reverselogistics improvements during its initial phase.
In this research project, the research team examined severalways that reverse logistics can be utilized in a strategicmanner. These strategic uses of reverse logistics arepresented in Table 1.5 below.
Competitive ReasonsResearch respondents said they initiated reverse logistics asa strategic variable for competitive reasons. Most retailersand manufacturers have liberalized their return policies overthe last few years due of competitive pressures. While thetrend toward liberalization of return policies has begun toshift a little, firms still believe that a satisfied customer istheir most important asset. Part of satisfying customers
Table 1.5Strategic Role of Returns
Role PercentageCompetitive Reasons 65.2%Clean Channel 33.4%Legal Disposal Issues 28.9%Recapture Value 27.5%Recover Assets 26.5%Protect Margin 18.4%

Chapter 1: Importance of Reverse Logistics 19
involves taking back their unwanted products or productsthat the customers believe do not meet needs.
Generally, customers who believe that an item does not meettheir needs, will return it, regardless of whether it functionsproperly or not. In an interesting example of this behavior,one retailer recently reported the return of two ouija boards.Ouija boards are childrens’ toys that, supposedly, allowcontact with the spirit world. On one ouija board there wasa note describing that it did not work because “…no matterhow hard we tried, we could not get any good answers fromthe ‘other side’…” The other ouija board returner said thatthe reason for return was: too many spirits responded to theouija board session, and things became too scary. In bothcases, the consumers were allowed to return these“defective” products.
These competitive pressures appear to be, in large part,cultural. North American consumers and businesses aremuch quicker to return goods than those in most othercountries. In fact, in many other countries, returns are neverallowed. Some of the international managers and academicsinterviewed in the course of this research believed that ifliberal returns were ever allowed in their country, bothbusinesses and consumers would abuse them. However, itis clear that in some countries, business return models aremoving closer to North American models. It is likely thatover the next few years international firms will feel strongpressure to liberalize their return policies, and improve theirreverse logistics capabilities.
20 Rogers and Tibben-Lembke
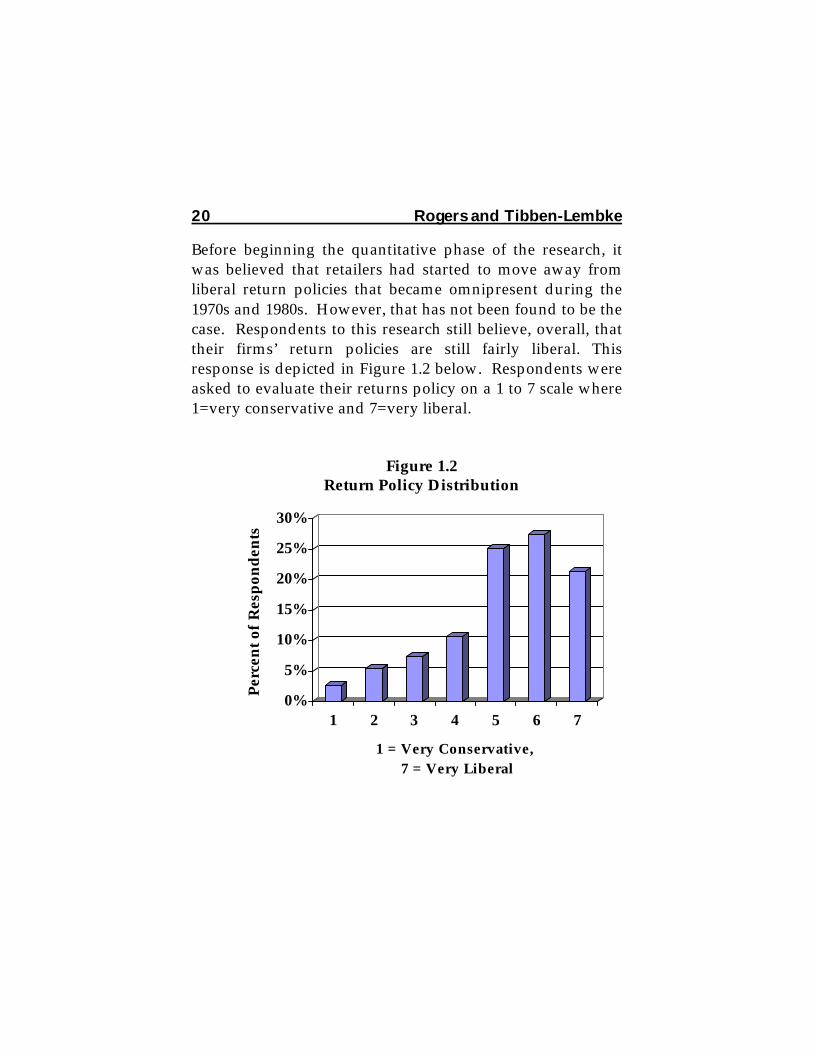
Before beginning the quantitative phase of the research, itwas believed that retailers had started to move away fromliberal return policies that became omnipresent during the1970s and 1980s. However, that has not been found to be thecase. Respondents to this research still believe, overall, thattheir firms’ return policies are still fairly liberal. Thisresponse is depicted in Figure 1.2 below. Respondents wereasked to evaluate their returns policy on a 1 to 7 scale where1=very conservative and 7=very liberal.
0%
5%
10%
15%
20%
25%
30%
Per
cen
t of
Res
pon
den
ts
1 2 3 4 5 6 7
1 = Very Conservative, 7 = Very Liberal
Figure 1.2Return Policy Distribution

Chapter 1: Importance of Reverse Logistics 21
Return Policy ChangesSome firms have begun to take a more aggressive stancewith customers, and have attempted to reduce the numberof returns. Because of customer service pressures, it isdifficult to make a preemptive step, if other firms operatingin the same industry have liberal return policies. If oneplayer in the industry has a liberal return policy, it isdifficult for other firms in that industry to tighten theirreturn policies.
Some retailers are beginning to rethink liberal returnpolicies, and balance their value as a marketing tool againstthe cost of those policies. Return policies are tightening3, asretailers look for ways to analyze the returns process, and torecapture dollars that were previously written on theexpense side of the ledger.
One reason for a generous return policy is that it leads toimproved risk sharing between sellers and consumers. Insome channels, consumers can return anything to theretailers, the retailers and wholesalers have liberal returnarrangements with manufacturers, and manufacturers endup taking responsibility for the entire product life cycle.These liberal return policies occasionally turn into “ReturnAbuse” policies, where the manufacturers end up taking aninordinate amount of risk.
It is interesting to note that, overall, the research respondentsdo not believe that their firms’ policies have changed much.In the light of celebrated examples, such as the case of anelectronics retailer that began charging customers a

22 Rogers and Tibben-Lembke
restocking fee when returning product, the research teamexpected to find that return policies had begun to tighten.While tightening of return policies may develop over thenext few years, as of this writing, it has not yet happened.
In Figure 1.3, perceived changes in the returns policies arepresented. As can be seen from this graph, returns policiesdo not appear to be shifting very much.
Good Corporate CitizenshipAnother set of competitive reasons are those that distinguisha firm by doing well for other people. Some firms will usetheir reverse logistics capabilities for altruistic reasons, suchas philanthropy. For example, Hanna Andersson, a $50
0%5%
10%15%
20%25%30%35%40%45%
Per
cen
t of
Res
pon
den
ts
1 2 3 4 5 6 7
1 = More Conservative, 7 = More Liberal
Figure 1.3Change in Return Policies

Chapter 1: Importance of Reverse Logistics 23
million direct retailer of infants and toddlers clothes,developed a program called Hannadowns. In theHannadowns program, customers are asked to mail backtheir childrens’ gently worn Hanna Andersson clothes. Thecompany then will give those customers 20 percent off thepurchase price of new Hanna Andersson clothes. For HannaAndersson, this program has been very successful. In 1996,133,000 garments and accessories were returned. Thesereturns were then distributed to schools, homeless shelters,and other charities.4
In a second example, a shoe manufacturer and retailer,Kenneth Cole Productions, encourages consumers to returnold shoes to Kenneth Cole stores during the month ofFebruary. In return for bringing in an old pair of shoes, thecustomer receives a 20 percent discount on a new pair ofKenneth Cole shoes.
In Figure 1.4 below, an advertisement for the Kenneth Coleshoe donation program is depicted. This program has beenvery successful in providing shoes to those in need.
Nike also encourages consumers to bring their used shoesback to the store where they were purchased. These shoesare shipped back to Nike, where they are shredded andmade into basketball courts and running tracks. Instead ofgiving consumer discounts, like Andersson or Kenneth Cole,Nike donates the material to make basketball courts, anddonates funds to help build and maintain those courts.Managing these unnecessary reverse flows is costly.

24 Rogers and Tibben-Lembke
However, these activities enhance the value of the brand andare a marketing incentive to purchase their products.
In each of these examples, firms are utilizing reverselogistics strategically. They are acting as good corporatecitizens, by contributing to the good of the community andassisting people who are probably less fortunate than theirtypical customers. While these policies may not be the
Figure 1.4Kenneth Cole Productions
Shoe Return Advertisement

Chapter 1: Importance of Reverse Logistics 25
reason all customers purchase their products, they areconsidered a marketing incentive. It is using reverselogistics to not just be environmentally friendly, but to incentcustomers at a real cost to their businesses.
Clean ChannelReverse logistics competencies are also used to clean outcustomer inventories, so that those same customers canpurchase more new goods. Auto companies have fairlyliberal return policies in place, and a large reverse logisticsnetwork which allows them to bring back parts andcomponents from their dealers. These parts are oftenremanufactured, so that value is reclaimed. If new partsheld by the dealer are not selling well, the auto companieswill give the dealers a generous return allowance, so thatthey can buy new parts that they really need, and therefore,service the ultimate consumer better. Most auto dealers, andmany dealers in other industries, are family-basedbusinesses with limited supplies of capital to invest ininventories. They often have less than state of the artinventory management capabilities. It is in the best interestof parts suppliers to clean out their inventories, reducecredit-line constraints, and improve customer satisfaction.
Protect MarginNearly 20 percent of the firms included in the research usetheir reverse logistics capabilities to protect their margins.This strategic usage of reverse logistics is closely related tocleaning out the channel. Firms cleanse their inventoriesand the inventories of their customers and their customers’customers utilizing reverse logistics processes. Some firms

26 Rogers and Tibben-Lembke
are proactive in their management of downstreaminventory, as opposed to merely being reactive. These firmshave programs in place that maximizes inventory freshness.Fresher inventories can demand better prices, which in turn,protects margin.
Legal Disposal IssuesAnother set of reasons named as being strategic deals withlegal disposal issues. Over 25 percent of the respondentssaid that legal disposal issues are a major concern. Aslandfill fees increase, and options for disposal of hazardousmaterial decrease, legally disposing of non-salvageablematerials becomes more difficult. Firms have to thinkcarefully about these issues. One company included in thisresearch had previously managed hazardous wastecarelessly, and experienced trouble with the EnvironmentalProtection Agency. The result of this conflict was theprimary determinant in the configuration of itsmanufacturing and distribution systems. This firm nowwants to make sure that anything that comes out of itsfacilities is disposed of properly.
Recapture Value and Recover AssetsOver 20 percent of the firms included in the research saidthat recapturing value and recovering assets were strategic.Firms that have recently begun asset recovery programsfound that a surprisingly large portion of their bottom-lineprofits is derived from asset recovery programs. Theseprograms add profit derived from materials that werepreviously discarded, which makes them essentially free.

Chapter 1: Importance of Reverse Logistics 27
ConclusionsWhile many companies have yet to recognize the strategicpotential of efficient reverse logistics, it is clear that the tideis beginning to turn. There is more interest in reverselogistics now than ever before. Firms are beginning to makeserious investments in their reverse logistics systems andorganizations. One clear indication of the strategicimportance of a business element is the amount of moneyspent on managing that element.
Given the volume of returned products experienced in someindustries, it is not surprising that the firms in thoseindustries consider returns a strategic and core competency.It appears likely that companies in industries that generallydo not place much value on good reverse logistics practices,will, over the next few years, find that making investmentsin their return systems will enhance their profitability. It isclear that for many firms, excellent reverse logistics practicesadd considerably to their bottom line.
1.4 Reverse Logistics Challenges
Retailer – Manufacturer ConflictOne of the difficulties in managing returns is the differencein the objectives of manufacturers and retailers. Thedistance between them on many issues can make thedifference seem like a chasm, as shown in Figure 1.5.

28 Rogers and Tibben-Lembke
Whenever a retailer wants to return an item, the retailer andthe manufacturer may disagree on any one of the following:
• Condition of the item• Value of the item• Timeliness of response
Often from the retailer’s perspective, every product was sentback in pristine condition, and any damages must haveoccurred in transit or must be manufacturing defects. Themanufacturer may suspect the retailer of abusing returnprivileges because of poor planning, or of returning productdamaged by the retailer. Once the condition of the item is
RetailerManufacturer
Chasm
Figure 1.5The Chasm Between Manufacturer and Retailer
Source: Clay Valstad, Sears, Roebuck and Co.

Chapter 1: Importance of Reverse Logistics 29
agreed upon, the value that the retailer should receive mustbe determined. The retailer may claim full credit, and themanufacturer may have a dozen reasons why it should notreceive full credit. These issues can be difficult to sort out.After they have all been decided, the refund never comesquickly enough to suit the retailer.
Retailer returns to the supplier are a method of reducinginventories near the end of a quarter. Retailers maysuddenly move material back to the supplier, or at leastnotify the supplier that they are going to do so, andnegotiate the details later.
For similar reasons, manufacturers can be slow to recognizereturns as a subtraction from sales. They may want to delayreturns until a later accounting period, or, they may notwant to credit the returned items at their full price.
Sometimes the retailer simply deducts the cost of the itemsfrom an invoice. Often, that invoice is not the same one forthe goods being returned.
In the end, both parties need to realize that they have todevelop a working partnership to derive mutual benefit.Obviously, neither can live without the other; they need towork together to reduce the number of returns coming backand speed up the processing of those that do come back.Inefficiencies that lengthen the time for processing returnscause harm to both firms.

30 Rogers and Tibben-Lembke
Problem Return SymptomsDr. Richard Dawe of the Fritz Institute of InternationalLogistics identified six symptoms of problem returns.5Those six symptoms are depicted in Table 1.6 below.
If a large amount of returns inventory is being held in thewarehouse, clearly there is a problem with the way the firmis handling returns. If a large number of unauthorized orunidentified items are being discovered, again, there mustbe a significant problem with the return process.
Piles of unprocessed returns are easy to observe.Unfortunately, some of these other symptoms Dr. Daweidentified are not as easily observed. One of the findings of
Symptoms• Returns arriving faster than processing or disposal• Large amount of returns inventory held in the
warehouse• Unidentified or unauthorized returns• Lengthy processing cycle times• Unknown total cost of the returns process• Customers have lost confidence in the repair
activity.
Table 1.6Problem Return Symptoms

Chapter 1: Importance of Reverse Logistics 31
this research is that shortening returns processing time isimportant for handling returns well. If firms do not monitorthe length of their processing cycle times, they have no wayto determine how well they are doing in this area. One ofthe biggest challenges facing firms dealing with reverselogistics is a lack of information about the process. Againand again, we have seen companies that do not have anyformalized systems for monitoring their reverse logisticsactivities. As the old saying goes, if you aren’t measuring it,you aren’t managing it.
Cause and EffectPoor data collection leads to uncertainty about return causes.In the long run, the most valuable outcome of sound reverselogistics management is the accumulation of data.Improving the return process and efficiently handling thereturned products decreases costs. However, being able tosee defective products and to track return issues by reasoncodes can be more useful than simply improving returnhandling efficiencies. In forward distribution, it is moreimportant to be able to manage information effectively thanto mange inventory. Generally, those firms that manageinformation well also manage their inventories effectively.Those that do not manage well the data surrounding theirlogistics processes, do not generally manage theirinventories effectively. This same rule applies to reverselogistics as well.
Reactive ResponseOver the last few years, many companies have practicedreverse logistics primarily because of government regulation

32 Rogers and Tibben-Lembke
or pressure from environmental agencies; not for economicgain. For most of these companies, reverse logistics has notbeen as strongly emphasized as other business activities.For many firms, it has not been possible to justify a largeinvestment in improving reverse logistics systems andcapabilities because generally, not enough analysis iscompleted. Like the captain of the Titanic, whose disregardof iceberg warnings brought so much devastation,executives usually disregard reverse logistics issues.
1.5 Barriers to Good Reverse Logistics
As we continued to examine the firms included in thisresearch project, it was clear that for many companies, it isdifficult to successfully execute reverse logistics because ofvery real internal and external barriers. We asked the 300research respondents about what kinds of issues cause themdifficulty in completing their reverse logistics mission.These answers were grouped around the followingcategories: importance of reverse logistics relative to otherissues, company policies, lack of systems, competitive issues,management inattention, financial resources, personnelresources, and legal issues. The responses are listed belowin Table 1.7.
Very few of the firms interviewed manage their reverselogistics costs at the operational level. Since successfullycompleting the reverse logistics mission is clearly a problemfor many firms, it is obvious that numerous barriers to goodreverse logistics exist. According to the research

Chapter 1: Importance of Reverse Logistics 33
respondents, the relative unimportance of reverse logisticsissues (39.2 percent) is the largest barrier to good reverselogistics management. These companies said that reverselogistics was just not a priority. Some firms included in theresearch mentioned that they have difficulty cost-justifying areverse logistics system. As one executive said, “after all, itis junk. You can’t expect my VP to want to invest in junk.”While it is not necessarily junk, it is often viewed as suchand therefore is not worthy of much investment.
For many of the firms examined, this attitude is changing.For example, in the book industry, reverse logistics hastraditionally not been recognized as a significant factor.Recently, high returns have pushed many publishers to
Table 1.7Barriers to Reverse Logistics
Barrier PercentageImportance of reverse logistics relativeto other issues
39.2%
Company policies 35.0%Lack of systems 34.3%Competitive issues 33.7%Management inattention 26.8%Financial resources 19.0%Personnel resources 19.0%Legal issues 14.1%

34 Rogers and Tibben-Lembke
operate in the red. It is clear that, in the long run, thesepublishers cannot continue to overlook the necessity of goodreverse logistics management. As discussed in more detailin Chapter 6, returns are now considered to be extremelyimportant in the book industry.
The second largest number of respondents mentionedrestrictive company policies (35.0 percent). This responsemay be related to management inattention and the lack ofimportance of reverse logistics. It also is related to corporatestrategy for handling returns and non-salable items.Because companies do not want to see their “junk”cannibalizing their first quality or “A” channel, they oftendevelop policies that make it very difficult to handle returnsefficiently, and to recover much secondary value from thosereturns. One trend that is interesting, however, is that thependulum currently appears to be swinging towardeliminating difficult policies and attempting to handlereturns effectively, in order to recover value from what canbe a very valuable resource.
Lack of systems is another serious problem for 34 percent ofthe respondent base. In the course of this research project,very few good reverse logistics management systems werefound.
Competitive issues (33.7 percent) and managementinattention (26.8 percent) also hamper reverse logisticsefforts. Financial and personnel issues were cited as barriersby 19 percent of those surveyed. This number was lowerthan expected although it is not insignificant. For most

Chapter 1: Importance of Reverse Logistics 35
firms, executive attention and policies are much greaterproblems than adequate access to resources.
The problem that appears to have the smallest impact onreverse logistics managers is legal issues. This finding iscontrary to what was expected. The conventional wisdomhas been that over the last few years, most companies havepracticed reverse logistics primarily because of governmentregulation or pressure from environmental agencies, and notfor economic gain. While this may be true, legal issues donot appear to be a major problem for most of the firmsincluded in our research.

Chapter 2: Managing Returns
There are many different kinds of reverse logistics activities.As discussed in Chapter 1, much of the focus of this researchproject was directed at examining the return flow of productfrom a retailer back through the supply chain toward itsoriginal source, or to some other disposition.
The management of this flow of materials is the focus ofChapter 2. As it will become clear, the diverse modalities forhandling returns utilized by the research respondents caneither positively or negatively impact a company’s bottomline. What follows is a detailed examination of those factorsdefined by the research team as key reverse logisticsmanagement elements.
Table 2.1Key Reverse Logistics Management Elements
• Gatekeeping• Compacting Disposition Cycle Time• Reverse Logistics Information Systems• Centralized Return Centers• Zero Returns• Remanufacture and Refurbishment• Asset Recovery• Negotiation• Financial Management• Outsourcing

38 Rogers and Tibben-Lembke
2.1 Improve Return “Gatekeeping”
For years, retailers and manufacturers have focused solelyon massaging profitability into and out of the inventorymanagement process—but only from a forward distributionperspective. Our research shows that the time has come togive similarly focused attention to the reverse logisticsmanagement function—and every company has one. Pointof entry into the reverse logistics pipeline—or“gatekeeping,” as we call it— deserves much more attention.Gatekeeping is the screening of defective and unwarrantedreturned merchandise at the entry point into the reverselogistics process. Good gatekeeping is the first critical factorin making the entire reverse flow manageable and profitable.
Successful companies have satisfied customers. Retailsuccess stories, such as that of L.L. Bean, can be attributed, inlarge part, to excellent customer service through customer-oriented marketing, which often includes a liberal returnpolicy. L.L. Bean is famous for being willing to accept worn-out apparel and giving the customer full credit. L.L. Beanaccepts all of the risk associated with purchasing one of theirproducts. This policy is a significant marketing incentive.During the late 1980s and early 1990s, many companiesstudied L.L. Bean as an example of excellent customerservice. The concept of absorbing the risk that a productmight be faulty, damaged, or simply unwanted, attractscustomers, increases sales, and at the same time, causesmajor problems for retailers.

Chapter 2: Managing Returns 39
While liberal return policies draw customers, they can alsoencourage consumer abuse. For example, at one GENCOretail centralized return center visited by the research team,some of the items brought into the center were not even soldby the retailer to which they were returned. Retail storepersonnel should have never accepted those items asreturns. However, without good systems in place and welltrained personnel at store level, this kind of abuse occursmore often than retailers would like to admit.
In the book industry, publishers allow bookstores to returnany product for credit. Often, the return rates on a specificbook actually determine its profitability. Conversely, bookdistributors, who are the largest customers of publishers,only take back a certain percentage of the books that theysell to bookstores. Book retailers are painfully aware of thepolicy mismatch between publishers and distributors. Oncethe stores return their quota of allowable returns to theirdistributors, they begin sending the remainder of theirreturns back to the publisher—even though they bought thebooks from the distributor and not directly from thepublisher. In some cases, book retailers do not even try toship the product back to their distributors because of tighterdistributor policies.
Using this strategy forces the publisher to incur the lion’sshare of the cost for book returns. Since the publisherprobably sold the books originally to the distributor at alower price than the direct price to the retail bookseller, thepublisher’s profits are diminished, while the distributor

40 Rogers and Tibben-Lembke
avoids incurring the expense of handling the return. Thissystem hardly seems efficient or fair.
During the course of our research, several retailers voicedconcern and consternation over the difficulty in screeningdefective, and unwarranted returned merchandise at thestore level. Store-level clerks and front-line personnel areoften unwilling or unable to gatekeep the returns process.Retailers need to do better training of the sales associates.They can also develop systems to take the decisions out ofthe hands of the associate.
Nintendo, the electronic game manufacturer, has developeda particularly innovative gatekeeping system. They rebateretailers $0.50 if they register the game player sold to theconsumer at the point of sale. Nintendo and the retailer canthen can determine if the product is in warranty, and also ifit is being returned inside the allowed time window. Theydeveloped special packaging with a window that allows theserial number to be scanned by the retailer’s point-of-salescanner. This information updates a database that a retailercan access when the customer brings back a Nintendomachine.
The impact from this new system on their bottom line wassubstantial. After implementing this system, Nintendoexperienced more than an 80 percent drop in return rates—to less than 2 percent of sales. However, for mostmanufacturers and retailers, it is too expensive to register atthe point of sale $20 items. In most systems, once the salesassociate makes a decision about a return, that decision is

Chapter 2: Managing Returns 41
usually not overturned. Systematic problems are magnifiedbecause many sales associates do not receive much trainingin this area.
Failure in returns gatekeeping can also create significantfriction between supplier and customer firms, not tomention lost revenue. For example, the stock price of aspecialty apparel manufacturer fell dramatically at the endof 1996. This drop was due to, in large part, the inability ofthe specialty retailer who sold the product to appropriatelymanage returns to the manufacturer. The retailer, a storefound in most suburban shopping malls, accounts forapproximately one third of the manufacturer’s revenues.Here’s what caused the problem.
Instead of using a centralized return processing center,which significantly expedites the reverse logistics pipeline,the retailer accumulated store returns and sent them back tothe manufacturer in infrequent, large batches. This practice,coupled with a breakdown in manufacturer-retailercommunication channels, created mountains of returnedproduct on which the retailer only received a fraction of theoriginal cost. Subsequently, the retailer’s third quarterprofits suffered, and buying volumes were reduced with themanufacturer. Needless to say, Wall Street reactednegatively. The manufacturer’s stock fell to a third of itshigh point for the year. As of this writing, both firms havebeen seriously wounded. These are wounds that could havebeen avoided if the gatekeeping function of their returnprocess had been a priority—not a postscript.
42 Rogers and Tibben-Lembke
2.2 Compact Disposition Cycle Time
Another critical element to successful reverse logisticsmanagement is having short disposition cycle times.
The companies that are best at managing their reverselogistics processes are adept at gatekeeping, as describedabove. These firms are also able to reduce cycle timesrelated to return product decisions, movement, andprocessing. One executive described difficulties in managingthe return process and said, “You know, this stuff isn’t likefine wine. It doesn’t get any better with age.”
While most returned product does not age well, it is clearthat many firms have not discovered how to avert a lengthyaging process on their returns. For many of the firmsstudied, returns are exception-driven processes. Often,when material often comes back in to a distribution center,it is not clear whether the items are: defective, can be reusedor refurbished, or need to be sent to a landfill. The challengeof running a distribution system in forward is difficult; it isharder still for companies to allocate resources to managethe system in reverse.
Part of the difficulty that firms have in compactingdisposition cycle time is that there does not seem to be muchreward for taking responsibility and making a timelydecision as to how product should be dispositioned.Employees have difficulty making decisions when thedecision rules are not clearly stated and exceptions are oftenmade. It is easier to pass the product back to the previous

Chapter 2: Managing Returns 43
stage in the channel, because that reduces both personal andcompany risk.
2.3 Reverse Logistics Information Systems
One of the most serious problems that firms face in theexecution of a reverse logistics operation is the dearth ofgood information systems. Very few firms have successfullyautomated the information surrounding the return process.Based on the response of firms included in the research,reverse logisticians seem to feel that nearly zero goodreverse logistics management information systems arecommercially available. Because information systemsresources are usually stretched to their limit, those resourcesare usually not available for reverse logistics applications.An information systems department queue for buildingapplications not determined to be core processes is oftengreater than one year. Some information systemsdepartments have queues that stretch out beyond two years.Given this difficulty, reverse logistics applications typicallyare not a priority for information systems departments.
To work well, a reverse logistics information system has tobe flexible. In addition to the problems described above,automation of those processes is difficult because reverselogistics processes have so many exceptions. Reverselogistics is typically a boundary-spanning process betweenfirms or business units of the same company. Developingsystems that have to work across boundaries adds additionalcomplexity to the problem.

44 Rogers and Tibben-Lembke
For the retailer, a system that tracks returns at store level isdesirable. The system should create a database at the storelevel so that the retailer can begin tracking returned productand follow it all the way back through the pipeline.
One of the best firms included in this research developed avery simple system to assist in the compacting of thedisposition cycle times. In addition to an investment incomputer systems, they have designed manual systems toimprove returns processing. They use a three-color system.A store employee receives instructions about the returnedgood from decision rules built in to the point-of-saleterminal at the service desk. The point-of-sale terminalretrieves the return policy for that particular item. The storeclerk places a yellow sticker on the item if it is to be returnedto the vendor. A green sticker means that the item is to beplaced on the salvage pallet. If the system indicates “red,”the item is an exception article and has to be researched.This particular firm tries to keep the number of red stickersto a minimum. Because the disposition decision is made bythe system and does not rely on individual judgements formost returns, disposition cycle time is dramatically reduced.
Additionally, because of their systems, this firm has thebenefit of tracking returns, and measuring cycle times andvendor performance. This firm’s buyers have much betterinformation in their hands when they talk to suppliers andnegotiate allowances. Also, the stores can see if theconsumers are committing “return abuse,” and are trying totake advantage of the store. These benefits have been

Chapter 2: Managing Returns 45
realized because this firm has recognized the bottom-lineimpact of reverse logistics and assigned its resources to workon reverse logistics systems problems.
Returns Transaction ProcessingIn a truly integrated supply chain, everyone in the supplychain can track product as it moves forward through thechannel. While there are very few supply chains that reallyfunction this well, there are virtually none that work inreverse. Most firms cannot track returns within their ownorganization, much less somewhere outside of their firm.
RetailerIn a returns processing system that may reside at acentralized return center, several transactions can occur. Agood system might include the following steps. The firsttransaction will likely be financial, where an inventorycategory will be updated. A chargeback to reconcile with thevendor, or something similar, will occur. A retailer maywant to reorder first quality product from its supplierimmediately. Then, routing for processing or a storagelocation within the processing center will be determined. Areverse warehouse management system may be required forthis step.
ManufacturerThe manufacturer will generate a return authorization (RA).This is often a manual process. RAs could be generatedelectronically, including an automatic check to see if thereturn should be authorized. Next, the likely financialimpact of the return could be generated. These capabilities

46 Rogers and Tibben-Lembke
would be very helpful in better managing returns. The nextstep is to automate pickup of product and an advancedshipping notification (ASN) could be cut.
After it is shipped, it is received. Currently, mostmanufacturers manually receive returns. Once the materialis received, a database is created for reconciliation. Becausemost manufacturers manually receive material, this databaseis created slowly—if it is created at all. This sluggishnessresults in slowing the reconciliation and the disposition ofthe returns.
EDI StandardsElectronic data interchange (EDI) standards to facilitate thisboundary spanning have been developed to handle returns.The 180 transaction set was developed to manage the flow ofinformation surrounding the return process. However, fewof the research respondents have implemented the 180 EDItransaction set. The majority of the respondent firms haveimplemented some EDI functionality. They just have notput many resources into developing EDI linkages for thereturn flow of goods. One executive said that: “I can getsuppliers to send me ASNs all day. I just can’t get anyone totell me product is coming back to the warehouse.” Acomplete description of the 180 transaction set is given inAppendix D.
Some of the firms interviewed voiced the opinion thateventually, the internet will replace the implementation ofEDI transactions. In an application such as reverse logistics,where resources are always difficult to gather, inexpensive

Chapter 2: Managing Returns 47
browser-based return interfaces may be one answer to thesystems problem. In addition to being less expensive,internet-style interfaces can usually be developed morequickly than costly mainframe applications. Additionally,GENCO, IBM, HP, and other firms are testing license platesand two-dimensional bar codes to fill gaps between systems.Hardware firms such as Symbol and Telxon are developingsolutions for reverse logistics applications.
A good reverse logistics system can remove functionalityfrom the back of a retail store. One retail firm interviewedfor this research project found that after they installed areverse logistics system, they were able to reduce headcount.
A good system allows the firm to quickly obtain credit forreturned product, which improves cash flow managementthrough the reverse logistics pipeline. A company canchange suppliers, liquidate the old supplier’s product, andget through final resolution much more quickly than if thereverse logistics information flow is not automated.
Return Reason and Disposition CodesPart of good returns transaction processing is understandingwhy the items were returned and how they should bedispositioned. Listed below in Table 2.2 are possiblestandardized return reason codes.

48 Rogers and Tibben-Lembke
Repair / Service Codes• Factory Repair – Return to vendor for repair• Service / Maintenance• Agent Order Error – Sales agent ordering error• Customer Order Error – Ordered wrong material• Entry Error – System processing error• Shipping Error – Shipped wrong material• Incomplete Shipment – Ordered items missing• Wrong Quantity• Duplicate Shipment• Duplicate Customer Order• Not Ordered• Missing Part
Damaged / Defective• Damaged – Cosmetic• Dead on Arrival – Did not work• Defective – Not working correctly
Contractual Agreements• Stock Excess – Too much stock on hand• Stock Adjustment – Rotation of stock• Obsolete – Outdated
Other• Freight Claim – Damaged during shipment• Miscellaneous
Table 2.2Return Reason Codes

Chapter 2: Managing Returns 49
In Table 2.3 below, potential disposition codes are presented.
Table 2.3Disposition Codes
Disposal• Scrap / Destroy• Secure Disposal• Secure Disposal (Videotaped)• Donate to Charity• Third Party Disposal• Salvage• Third Party Sale (Secondary Markets)
Repair / Modify• Rework• Remanufacture / Refurbish• Modify (Configurable or Upgradable
Products)• Repair• Return to Vendor
Other• Use as Is• Resale• Exchange• Miscellaneous

50 Rogers and Tibben-Lembke
Several companies included in the research have also taken alarger, more difficult step in compacting disposition cycletimes. This step is the development of a centralized returncenter (CRC) network. While it is not intuitively clear thatestablishing CRCs would reduce cycle times, in every firmstudied that moved to the CRC concept, disposition timesdecreased. This reduction in time is most likely due toimproved information systems and clearly understoodprocedures for handling returned material. In most casesexamined, this reduction in cycle time directly andpositively impacted the firm’s bottom line.
2.4 Centralized Return Centers
Centralized return centers (CRCs) are processing facilitiesdevoted to handling returns quickly and efficiently. CRCshave been utilized for many years, but in the last few years,they have become much more popular as more retailers andmanufacturers have decided to devote specialized buildingsand workforces to managing and processing returns.
In a centralized system, all products for the reverse logisticspipline are brought to a central facility, where they aresorted, processed, and then shipped to their nextdestinations. This system has the benefit of creating thelargest possible volumes for each of the reverse logistics flowcustomers, which often leads to higher revenues for thereturned items. It also allows the firm to maximize its returnon the items, due, in part, to sortation specialists who

Chapter 2: Managing Returns 51
develop expertise in certain areas and can consistently findthe best destination for each product.
Generally, centralized return centers work in the followingmanner. The retail stores send product back to one or morecentralized return centers. If the retailer is a large, nationalor international company, it is likely that it will have morethan one CRC. For example, Kmart Corporation has fourCRCs in its system, and Sears, Roebuck and Company hasthree. The CRC then accumulates the returned product forprocessing. Generally, the CRC will make a decision aboutthe appropriate disposition for the product, based onguidelines set by the retailer and manufacturers.
One of the most important activities is the sortation step.During this part of the process, employees make decisionsabout whether the product can be resold or if it has to bescrapped. Obviously, determining the best channel fordispositioning of the product is of critical importance inmaximizing revenue from the products in the reverselogistics pipeline.
Based on the research interviews, centralized return centersare an important part of a reverse logistics managementstrategy. These centers impose order on the reverse flow.Generally, they are associated with information systemimprovement. To run a CRC, a firm must have some sort ofreverse logistics system in place. In almost every instance,research respondents said that centralized return centers hada positive impact on the bottom line. In one case, a largecompany said that the combination of implementing
52 Rogers and Tibben-Lembke
centralized return centers, moving to an asset recoveryprogram, and improving its reverse logistics informationsystems improved the corporate bottom line by 25 percent.
The amount of product that a network of CRCs processes forthe large retailers can be huge. One retailer included in theresearch ran over $800 million of product through itsnetwork of CRCs during fiscal 1997.
CRCs also simplify in-store processes. It is often difficult toget disposition decision uniformity across a chain of storesfor several reasons. The employees working the customerservice desk may be not properly trained, new, or notterribly concerned about returns.
ConsistencySending returns back to a CRC results in more consistentdecisions being made about product disposition. Becauseprocesses are standardized, errors are more easily identifiedand avoided. The quality of returns processing generallyimproves as the firm moves to a centralized processingmodel.
Space UtilizationRetail stores generally have very limited space in the store todevote to returns. Usually, a retail store wants to devote asmuch space as possible to the selling floor. A retailer doesnot want to devote much space to hold non-selling returns.

Chapter 2: Managing Returns 53
Labor SavingsBy centralizing returns processing, a retailer minimizes thelabor required to complete the processing of returns. Oneproperly trained employee at the CRC can generally domore in less time than the combined efforts of severalcustomer service desk employees.
Transportation CostsMany of the companies included in this research also foundthat their reverse logistics-related transportation costsdecline due to consolidation. With a CRC model, a retaileror manufacturer can utilize “milk runs” to pick up returnedgoods. This way, a company can move more pallets andfewer boxes, increasing consolidation and thereby reducingfreight costs.
The downside to a completely centralized system is thathandling and transportation costs can increase because allproducts must be transported from the retail locations to thecentralized facility. If a product is going to be thrown away,transporting it to a centralized facility just to throw it awayincreases costs, but does not increase revenues, because theproduct is still thrown away.
However, the cost savings, reduced disposition time, andimproved revenues associated with the implementation ofCRCs more than make up for transportation costs incurred ifthe product is to be scrapped. In many cases, products thatare going to be thrown away would not be processed at theretail store, anyway.

54 Rogers and Tibben-Lembke
Improved Customer ServiceFrom the manufacturers’ point of view, the centralizedmodel can improve customer service. It can speed thereconciliation process, improve return materialauthorization (RMA) verification, and be part of developingimportant management information. Because ofconsolidation of returns, a manufacturer can more easilybecome aware of trends in returns. Also, good reverselogistics management can be a marketing strategy to keepcustomers loyal. Processing the transaction quickly andgiving the customer credit helps to build customer loyalty.Some firms believe that their returns management processesgive them a great opportunity to please the customer.
Establishing CRCs is a sign of commitment from the firm toincorporate returns management into the overall corporatestrategic plan. It means that someone such as the generalmanager of the CRC has the job of making sure that returnsare handled properly.
Compacting Disposition TimeFirms included in the research that established a CRC foundthat their disposition cycle times were reduced.
Centralized return centers tend to expedite the reverselogistics pipeline. Before implementing a CRC, retailerswould accumulate store returns and send them back to themanufacturer in infrequent, unorganized, large batches.Because returns were not normally the first priority of thestore or the distribution center, returned goods would pileup in large amounts. This inefficient handling would result

Chapter 2: Managing Returns 55
in the loss of value as the returned product sat for a longperiod of time and was often damaged. Retailers wouldreceive less credit from the manufacturers or distributorsthan their original purchase price. For products such aspersonal computers, this situation is catastrophic, as theproduct loses value everyday it sits idle.
One retailer included in the research uses the fasterprocessing and systems linkages that are part of its CRCnetwork to assist the corporation in managing its bottom linefrom one quarter to the next. From an accounting point ofview, this company transfers the inventory back to thesupplier once a bill of lading is cut. The director of reverselogistics often receives calls near the end of the month or endof the quarter asking him if he can, for example, “get rid of$4 million and shift it back on the vendors before the periodcloses.”
Profit ImpactReturns have a lower impact on the profitability of thosefirms utilizing outsourced centralized return centers thanthose not using outsourced centralized return centers. AsTable 2.4 shows, companies that used an in-house CRCfound that reverse logistics costs reduced profitability by 4.8percent, while those companies that used a third party tomanage their CRC found profitability reduced by 3.7percent.
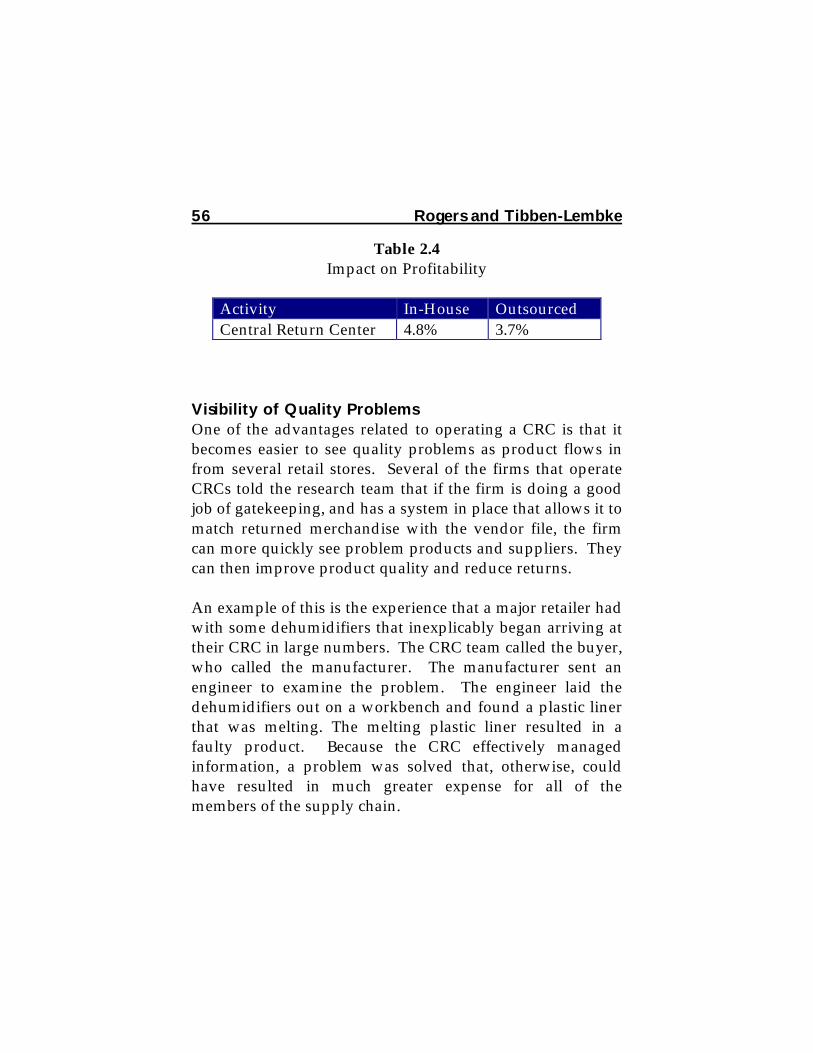
56 Rogers and Tibben-Lembke
Table 2.4Impact on Profitability
Activity In-House OutsourcedCentral Return Center 4.8% 3.7%
Visibility of Quality ProblemsOne of the advantages related to operating a CRC is that itbecomes easier to see quality problems as product flows infrom several retail stores. Several of the firms that operateCRCs told the research team that if the firm is doing a goodjob of gatekeeping, and has a system in place that allows it tomatch returned merchandise with the vendor file, the firmcan more quickly see problem products and suppliers. Theycan then improve product quality and reduce returns.
An example of this is the experience that a major retailer hadwith some dehumidifiers that inexplicably began arriving attheir CRC in large numbers. The CRC team called the buyer,who called the manufacturer. The manufacturer sent anengineer to examine the problem. The engineer laid thedehumidifiers out on a workbench and found a plastic linerthat was melting. The melting plastic liner resulted in afaulty product. Because the CRC effectively managedinformation, a problem was solved that, otherwise, couldhave resulted in much greater expense for all of themembers of the supply chain.

Chapter 2: Managing Returns 57
By tracking hundreds of return authorizations, a firm canbuild a data warehouse that contains return reasons. If aquality problem exists with a product, consolidation ofreturns will highlight those quality difficulties more quicklythan if returns dribble in slowly from retail customer servicedesks. A consumer electronics company was seeing highreturn rates on personal CD players. Jogging while wearingor carrying one of these portable CD players made themskip. The returns were sent to a CRC where they wereprocessed. Management information for a large number ofthese CD players was developed, which gave the firmimportant feedback and enabled it to solve the problem.
In another example, a firm that manufactures breadmachines was experiencing a high rate of return onapparently operable machines. The problem was that thepicture on the box showed a perfectly formed loaf of bread.The bread machine, however, actually produced a loaf thatlooked like a ball. It was not until the manufacturer couldview management information that was derived from anumber of returns that they understood the actual problem.
In the electronics industry, or in other industries thatproduce and sell “high learning products,” a large numberof returns are not really defective. A high learning productis one that requires users to do more than simply unwrap itand put it in their mouths, play with it, or simply turn it on.Products that require user knowledge or expertise for properoperation often come back in large numbers. The ones thatactually work are “non-defective defective” products. Thereis really not anything wrong with them, but the consumer

58 Rogers and Tibben-Lembke
could not figure out how to make them work. By utilizing aCRC and seeing the return reasons in larger numbers, themanufacturer and the retailer can work together to improvethe manual, develop a quickstart sheet, give an 800 phonenumber, or come up with another solution to reduce thenon-defective defectives. For some products, the highestpercentage of returns is actually non-defective defectives.
Forward and BackwardA large number of firms interviewed believes thatdistribution centers will not work well both forward andbackward. While at first this belief did not seem logical tothe research team, many distribution centers that attempt toefficiently process both forward and reverse supply chainflows have much difficulty. The problem may be relatedmore to focus than to actual capability. If the distributioncenter manager has to make a choice between efficientlyexecuting forward logistics versus reverse logistics, thedistribution center manager will focus on forwarddistribution. In every situation, forward distributionmanagement is the top priority of a distribution center thathas new product flow as one of its responsibilities.
A few of the research respondents said that cycle timeprocessing is negatively affected when one distributioncenter handles both forward and reverse shipments. Indistribution centers that have a limited number of dockdoors and dock space, product coming back tends to bemishandled and the processing of that material is oftenpostponed.

Chapter 2: Managing Returns 59
This problem of utilizing a distribution center to work bothforward and backward is one of the reasons that severalfirms are seeking out specialists. It is difficult for executivesto justify the expense of constructing and staffing a largebuilding dedicated to handling “failures”–which is exactlyhow returned product is often perceived inside thecompany.
Some firms included in the research are able to performforward and reverse logistics operations in the same facilityby carefully segregating both the flow of product and theemployees. This separation allows the reverse logisticsemployees to focus on the return flow and not be distractedby forward distribution activities.
Accounting IssuesIn a good CRC, information systems interact withaccounting and other systems. In theory, stores should beable to do this well, but unfortunately, most cannot. For themost part, retailers want to perform tasks that are part of thenormal retail process. A CRC assists the retailer and enablesit to make faster disposition decisions about returnedproduct.
To summarize, the benefits resulting from a centralizedreturn center are presented in Table 2.5.

60 Rogers and Tibben-Lembke
2.5 Zero Returns
In zero return programs, the manufacturer or distributordoes not permit products to come back through the returnchannel. Instead, they give the retailer or other downstreamentity a return allowance, and develop rules and guidelinesfor acceptable disposition of the product. A typical returnallowance in many industries is three-and-a-half to fourpercent of sales to the retailer.
1. Simplified store procedures2. Improved supplier relationships3. Better returns inventory control4. Improved inventory turns5. Reduced administrative costs6. Reduced store level costs7. Reduced shrinkage8. Refocus on retailer core competencies9 Reduced landfill
10. Improved management information
Table 2.5Typical Benefits from a
Centralized Return Center

Chapter 2: Managing Returns 61
A zero returns policy, properly executed, can result insubstantially lower costs, according to the researchrespondents. Firms using zero returns can reduce thevariability of returns costs, by pre-setting the maximumdollar amount of returned product. Stabilizing return ratesusing a zero returns program promotes planning and fiscalhealth.
Zero returns enables the firm to avoid physically acceptingreturns altogether, a strategy being adopted by someconsumer product companies, and several electronicscompanies.
Interestingly, most retailers do not track the cost of returns.Instead, merchandise buyers factor the return allowance intotheir pricing, which ignores the cost of returns.
While zero returns release upstream channel participantsfrom dealing with the physical portion of reverse logisticsmanagement, it does not reduce much of the physicalburden placed on downstream channel participants.
Thus far, zero return programs have reportedly had mixedresults. At a large consumer products company, zeroreturns appear to have reduced the handling costs related toreturns. However, much of the product that this firmearmarks as scrap-in-the-field is, instead, showing up inalternative channels, such as “dollar” stores and fleamarkets. Cannibalization of the “A” or primary channel isalways a concern when considering a zero returns program.

62 Rogers and Tibben-Lembke
How Zero Returns WorkIn a typical zero returns program, a supplier tells itscustomers that no product will be accepted for return, onceordered. Instead, the supplier will give the customer adiscount off of the invoiced amount. Depending on thesupplier, the retailer either destroys the product, or disposesof it in some other manner.
In another model being utilized in the computer industry,the retailer returns all product to a central point on openreturn material authorization (RMA). Usable product ispaid for and shipped to a third party for refurbishment anddisposition. Ineligible or unusable product is disposed ofbased on a predefined set of rules. In this model, the goalfor the retailer is to enlist as many manufacturers as possibleto participate, to enable centralized receiving, auditing, andpayment processing. From the computer manufacturer’spoint of view, all product from the channel is returned to therefurbishing third party. The product is audited by anindependent entity to determine its usability and theretailer’s credit entitlement. All aspects of the RMA processand the disposition of the returned product are handled bythe third party.
In this model, ineligible product becomes moot, because thethird party settles claims between retailers andmanufacturers. The result for the retailer may be fasterreconciliation and payment; simplified, easier returnsprocessing; and cheaper, reduced inventory awaiting returnto the vendor. For the manufacturers, this model may resultin a faster recovery process, better RMA administration, and

Chapter 2: Managing Returns 63
a renewed focus on selling new products, which is theirprimary goal.
2% / 6% ProblemA notable problem with zero return policies is one that canbe referred to as the “2% / 6%” problem. Because of theconsiderable power that large retailers have in the channel, itis hard for manufacturers to decree an appropriate returnsallowance and stick to it. For example, if a manufacturer isselling product to Kmart, and sets a six percent returns cap,Kmart would agree to that cap if the returns of themanufacturer’s product do not exceed six percent. In fact,Kmart would probably be very happy if its actual returnsrate was two percent while it was receiving credit for sixpercent returns. Kmart would be able to use the additionalreturn cap money as a rebate.
However, if the manufacturer sets a two percent return capand the actual return rate is six percent, Kmart is not likelyto consent to the manufacturer’s set return cap percentage.The retailer would instead insist that the manufacturer coverthe entire six percent returns. Because of the power of thelarge retailers, most manufacturers are not in a position toargue about the return cap percentage. This, coupled withthe inability of the manufacturer to truly control thedisposition of the product, means that the retailer has lessrisk than the manufacturer from a zero returns program. Aneffective zero returns programs requires that both the buyerand seller truly understand what their actual costs are.

64 Rogers and Tibben-Lembke
2.6 Remanufacture and Refurbishment
Thierry, et al. (1995) defined five categories of remanufactureand refurbishment. These five categories, shown in Table2.6, are repair, refurbishing, remanufacturing,cannibalization, and recycling. The first three categories:repair, refurbishing, and remanufacturing, involve productrecondition and upgrade. These options differ with respectto the degree of improvement. Repair involves the leastamount of effort to upgrade the product, and remanufactureinvolves the greatest.
Cannibalization is simply the recovery of a restricted set ofreusable parts from used products. Recycling is the reuse ofmaterials that were part of another product or subassembly.1
Remanufacturing and refurbishing of used product is on therise. Even NASA spacecraft are being built withremanufactured and refurbished tools. A prime
1. Repair2. Refurbishing3. Remanufacturing4. Cannibalization5. Recycling
Table 2.6Remanufacturing and Refurbishment Categories

Chapter 2: Managing Returns 65
subcontractor for NASA utilizes remanufactured machinetools to produce complex spherical components forspacecraft. Remanufacturing was chosen over purchasingnew equipment to generate cost savings. Customization ofthe machines was inevitable to adapt them to desiredcomputer numerical control and spindle combinationstandards. In this particular case, older machines were builtwith heavier castings. Because the mass of these oldermachines is greater than newer models, they can absorbvibrations more effectively, and improve workpiece quality.Remanufacturing offers many advantages over the purchaseof new machinery. In this particular example, cost savingsranged from 40 percent to 60 percent.
Sun Microsystems remanufactures and refurbishes spareparts internationally. In both Asia and Latin America, Sunbrings back spares designated as FRUs, or field replaceableunits. These units are repaired either in the U.S. or locally,in Latin America and Asia, depending on part value anddifficulty of refurbishing the part. These parts are thenrestocked for reuse at a central distribution point or a RSL(Remote Stocking Location). Spares may be located inMiami, Florida for Latin America, or Singapore and otherRSLs for Asia. The parts are then reused for repairs. At thetime of repair, they are brought up to the current “rev”(revision) level and refurbished to new.
Hewlett-Packard also uses remanufactured parts as serviceparts. They are able to receive failed parts and assemblies,remanufacture and refurbish those items, and then use themas their primary materials throughout their service network.

66 Rogers and Tibben-Lembke
They can reuse a valuable asset and reduce the costsassociated with servicing computers and other complexmachinery.
2.7 Asset Recovery
Asset recovery is the classification and disposition ofreturned goods, surplus, obsolete, scrap, waste and excessmaterial products, and other assets, in a way that maximizesreturns to the owner, while minimizing costs and liabilitiesassociated with the dispositions. This definition is similar tothe one that the Investment Recovery Association uses todefine investment recovery. The objective of asset recoveryis to recover as much of the economic (and ecological) valueas reasonably possible, thereby reducing the ultimatequantities of waste.2
Asset recovery has become an important business activityfor many companies. The importance of asset recovery to theprofitability of the company depends on the ability of thatcompany to recover as much economic value as possiblefrom used products, while minimizing negative impactssuch as environmental problems.
The attitude of many firms towards used products has beento ignore them, and avoid dealing with them after they areoriginally sold. Manufacturers in the United States, typically,are not responsible for products after customer use. Mostproducts are designed to minimize materials, assembly, anddistribution costs, and ignore the repair, reuse, and disposal

Chapter 2: Managing Returns 67
requirements. Manufacturers have generally believed thatthe costs of incorporating these requirements wouldoutweigh the benefits.
The market for products in the asset recovery process iscovered in the discussion of secondary markets in Chapter 3.The research found that secondary markets bothdomestically and internationally are growing rapidly.
The asset recovery process can include defacing the returnedproducts. Many retailers and manufacturers do want theirbrand recognizable when the products enters the secondarymarket. Defacing may include removing the manufacturer’sname or peeling off price stickers.
Asset Recovery SupplyFirms that specialize in reclaiming value from used productenjoy a large supply of product from many differentpotential sources. Materials are placed into the returnstream for several different reasons. One return flow typecommon in Europe is the result of laws requiringmanufacturers to take back used products. Products comingoff a lease or rental agreement make up another source ofsupply. Products that fail or have quality problems areanother source of returned product. Quantities of this kindof return can depend on product warranties and servicecontracts. Forecasting return flows of defective products isoften difficult. Failure or quality defect rates can depend onthe type of product. For example, electronic items tend tofail early in life, whereas mechanical components fail as theyage.

68 Rogers and Tibben-Lembke
2.8 Negotiation
Deal-making is a key part of the reverse logistics process. Inthe forward flow of goods, prices are often set by brandmanagers and marketing specialists. Reverse logistics oftenincludes a bargaining phase, where the value of returnedmaterial is negotiated without pricing guidelines. Thesenegotiations may be handled loosely. In addition, one ormore of the negotiation partners often does not fullyunderstand the real value of the returned materials, creatingopportunities for third parties to operate on the margin.These third parties often employ some of the sharpestlogisticians. One executive told the research team that “ifyou want to meet a great negotiator, go talk to someone thathandles scrap paper.”
Sometimes the negotiations are handled by specialist thirdparties. These third parties act in an advisory capacity to theprimary participants in the supply chain who are working totransfer ownership of the material back to the originalsource.
Also, third parties can manage the physical processing of thematerials. Companies, such as GENCO Distribution Systemor DamageTrak, are examples of these kinds of firms.Generally, the same third party does not handle the valuenegotiations and physical processing of the product for boththe retailer and the upstream manufacturer. There areexceptions to this rule, but usually retailers andmanufacturers want different third parties acting on theirbehalf to eliminate potential conflict of interest.

Chapter 2: Managing Returns 69
2.9 Financial Management
Financial management issues are the primary determinantsin the structure of a reverse logistics system, and the mannerin which product is dispositioned. Most firms need toimprove internal accounting processes. Accountingproblems drive the actions of managers. In a few firmsincluded in the research, accounting issues drove storemanagers to sidestep normal return systems. In these cases,internal policies and controls moved them to inefficient,incorrect behaviors.
An example of a policy-created problem surfaced in theresearch. Merchandise designated to go back to the supplierdue to overstocks, or because it is not selling, is earmarkedfor processing through a centralized return center.However, internal accounting takes a markdown on thoseitems that move through the centralized return center, andstores expense those items. When the centralized returncenter processes the material, they get full credit, and thestores are punished. The stores do not want to be punishedso they slow the flow back to the vendor to postpone thenegative financial impact as long as possible. This delaycauses a store-level backup of material that should bedispositioned. In addition, the loss of consolidationopportunities increases transportation costs.
Often, the cost of returns is charged against the salesdepartment. While this policy may generally be areasonable one, it can complicate reverse logistics processes.If sales personnel are penalized for returns, they will go out

70 Rogers and Tibben-Lembke
of their way to slow down or demolish the quick recognitionof returns and the speedy disposition of returned material.Issues related to chargebacks and bottom line responsibilityfor returns must be a key consideration when developing agood reverse logistics management system. As mentionedpreviously, the greatest roadblocks to successful reverselogistics are company policies. Generally, company policiesthat pose difficulties are related to accounting issues.
Sorting out what a supplier is to be paid, when deals andpromotions are factored in, can be a challenge. However,returns are often the number one issue in reconcilingaccounts receivables. Because these issues are often sodifficult to manage, third parties have begun to specialize inhandling accounting and reconciliation issues.
2.10 Outsourcing Reverse Logistics
Many companies are outsourcing most or all of theirlogistics activities. Some of these firms are extending theiroutsourcing to the reverse product flow, including manyfirms that participated in our research. These firms areusing their reverse logistics outsource supplier as abenchmark to help determine what and how reverseactivities should be performed, and how much thoseactivities should cost. Often, these outsource suppliersperform reverse activities better, and their customers findthat using these service firms reduce the administrativehassle of doing it themselves. These outsource suppliershave become specialists in managing the reverse flow, and

Chapter 2: Managing Returns 71
performing key value-added services, such asremanufacturing and refurbishing.

Chapter 3: Disposition and the SecondaryMarket
3.1 Overview of the Reverse Logistics Flow
In this chapter, product disposition options and thesecondary market are examined. Once a product is initiallyprocessed, a decision is made about where to send theproduct: either return to vendor, to the landfill, or to thesecondary market.
There are a variety of reasons why a product may enter thereverse logistics flow. They are summarized in Table 3.1below. There are, of course, more reasons why a productwill enter the reverse logistics system, but these are the mostcommon.
Often, two identical products will follow different routes todifferent destinations, depending on where in thedistribution channel they enter the reverse logistics flow.For example, a book that is returned to a store by a customermay not end up at the same place as a book returned by thestore to its supplier due to overstocking. Neither of thesebooks may end up in the same place as the books returnedby the distributor.
When a product has been replaced by a new version, aretailer may continue to sell the old version until it is gone,perhaps at a discount. The product may never enter thesecondary market. If the product does enter the reverse
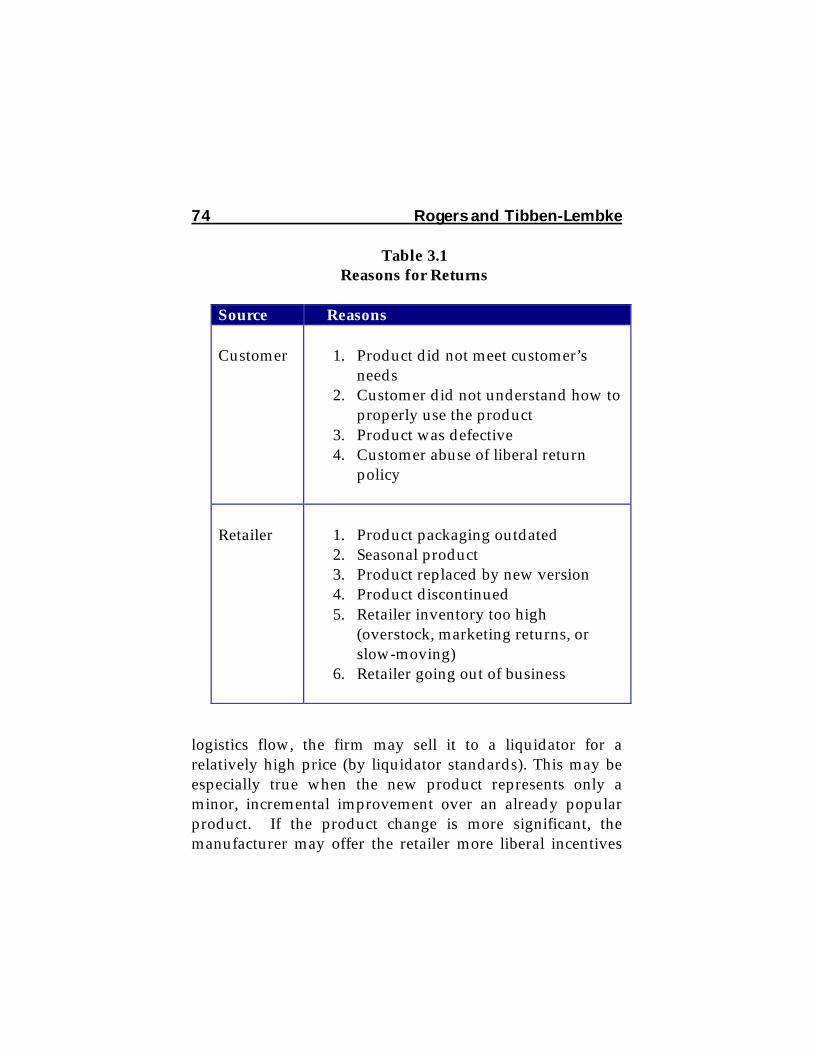
74 Rogers and Tibben-Lembke
logistics flow, the firm may sell it to a liquidator for arelatively high price (by liquidator standards). This may beespecially true when the new product represents only aminor, incremental improvement over an already popularproduct. If the product change is more significant, themanufacturer may offer the retailer more liberal incentives
Table 3.1Reasons for Returns
Source Reasons
Customer 1. Product did not meet customer’sneeds
2. Customer did not understand how toproperly use the product
3. Product was defective4. Customer abuse of liberal return
policy
Retailer 1. Product packaging outdated2. Seasonal product3. Product replaced by new version4. Product discontinued5. Retailer inventory too high
(overstock, marketing returns, orslow-moving)
6. Retailer going out of business

Chapter 3: Secondary Markets 75
to sell off the remaining old product. When significantproduct modifications are made, the retailer may be morelikely to pull the old product from its shelves, and send it tothe secondary market.
When a product has been discontinued because ofdisappointing sales, firms are more likely to have difficultyfinding a buyer for the product, even at a greatly reducedprice. Retailers may attempt to dispose of the inventory, butit may be difficult through the typical retail channels.Product price in a secondary market is likely to be greatlyreduced.
3.2 Returned Product Types
Retail products in a reverse logistics flow can be separatedinto the following categories:
1. Close-Outs: first quality products that theretailer has decided to no longer carry;
2. Buy-Outs or “lifts”: where one manufacturerbuys out retailers’ supply of competitor’sproduct;
3. Job-Outs: first quality seasonal, holidaymerchandise;
4. Surplus: first quality overstock, overrun,marketing returns, slow-moving merchandise;
5. Defective: products discovered to be defective;6. Non-Defective Defectives: products thought
incorrectly to be defective ;

76 Rogers and Tibben-Lembke
7. Salvage: damaged items, and8. Returns: products returned by customers.
Close-OutsIn a reverse logistics flow, close-out items are first-qualityitems that the retailer has discontinued from its product mix.In such a case, the retailer may have decided to stop carryingproducts sold by a certain vendor, in a particular productline. When a firm determines that it is no longer going tocarry a particular item or product line, it may contact anumber of outside firms to ask for bids on removing all ofthe product from its stores.
Buy-OutsBuy-outs occur where one manufacturer buys out a retailer’sentire supply of a competitor’s product. This purchase freesshelf space so that the manufacturer can put its productwhere the competitor’s product was previously. It alsoreduces the retailer’s risk. The retailer can dispose of slow-moving merchandise, and replace it with product that will,hopefully, sell better, without incurring any cost in thetransition.
Job-OutsJob-out items have come to the end of their normal saleslives. Some products—like swimsuits and snow shovels—are only popular during a certain time of the year. When astore reaches the end of a product’s sales period, the firmmust either sell it at a discount, or attempt to recover someof its value through its reverse logistics system. Unlikeclose-outs, a retailer is more likely to have an ongoing

Chapter 3: Secondary Markets 77
relationship with a job-out firm. As different products reachthe end of their selling seasons, the retailer may send theproducts to the same job-out companies.
SurplusSurplus is first-quality items that the company has in excess,but will continue to sell. The firm may have overestimateddemand and ordered too many.
Surplus items also result from an overzealous manufacturer.This may be due to inaccurate forecasts, or becauseproduction constraints require a minimum productionquantity, which is greater than the demand.
Marketing returns may also be a large source of excessproduct for the distributor. The distributor or the vendormay offer a special promotion, which provides the retaileran incentive to purchase a larger than usual order. If theretailer is unable to sell the product, the distributor mayexperience a significant increase in returns.
DefectivesDefective items have been discovered by the retailer or bythe customer to be truly defective. In many cases, a firm willinform the manufacturer of the defect and the manufacturerwill compensate the retailer with a new product orrepayment, in the form of a check or a credit.
Non-Defective DefectivesOften, a customer will claim that a product is defective inorder to return it, when, in fact, it is not defective. However,

78 Rogers and Tibben-Lembke
it is usually not until the product reaches a returnsprocessing center that it is discovered to be non-defective.
Non-defective defectives often arise because a customer haspurchased an item, and attempted to use it withoutsuccessfully reading the instruction book. The customerthen concludes that the product is defective, when in fact, itwould have functioned properly had the instructions beenfollowed.
SalvageSalvage items have been used or damaged, and can nolonger be sold as new. Salvage items lose value relative tothe amount use or damage. The most difficult part ofmanaging salvage is determining its value.
ReturnsReturns are products that have been opened and used by thecustomer. Customer returns are generally handled similarlyto salvage or surplus items. Even if a return is not defective,it usually cannot be sold as first quality.
3.3 Product Disposition
Products in the reverse logistics system are primarilydisposed of through one of these seven channels:
1. Return to Vendor2. Sell as New3. Sell Via Outlet or Discount

Chapter 3: Secondary Markets 79
4. Sell to Secondary Market5. Donate to Charity6. Remanufacture / Refurbish7. Materials Reclamation / Recycling / Landfill
Depending on the condition of the item, contractualobligations with the vendor, and the demand for theproduct, the firm may have one or more of the above optionsfor each item.
Return to VendorRetailers return products to the vendor because of defects,marketing returns, obsolescence, or overstocks. Marketingreturns occur when the vendor has created an incentive forthe retailer to order a larger quantity than usual, and theretailer has proven unable to sell the additional units. Theretailer needs to be able to return the items.
Vendors also allow returns when they have a motivation tohelp the retailer avoid inventory obsolescence. In the autoindustry, for example, the major auto companies allow theirdealers to return a limited amount of their inventory eachyear. This enables the dealers to remove obsolete items frominventory, which frees space and capital to purchaseadditional, new inventory, and allows the dealers to betterserve the customer.
Returns to vendors can also result from selling product onconsignment or through a similar arrangement. In aconsignment arrangement, the retailer does not assumeownership of the product. If the product does not sell, the

80 Rogers and Tibben-Lembke
manufacturer is usually responsible for removing theproduct. It is unlikely that consignment inventory will everenter into the retailer’s reverse logistics flow. A somewhatsimilar situation is experienced when a manufacturer sendsproducts to the retailer with the understanding that anyunsold product may be returned for full credit, except that inthis situation, there is a greater likelihood that the goodsmay be processed through the retailer’s reverse logisticssystem.
If a customer returns a product as defective, and themanufacturer compensates the retailer, the manufacturermay specify that the retailer must return the product. Inasking for the product back the manufacturer may have twomotivations. First, the manufacturer may want to identifythe exact nature of the defect to determine its cause, andeliminate the defect in the future. The manufacturer mayalso wish to evaluate the number of non-defective defectives.By inspecting each item, the vendor gathers managementinformation that helps to determine other dispositionoptions. Depending on the product, the vendor may be ableto reshelf and resell this product as new.
The second reason vendors want product back is to preventthe item from entering another disposition channel andcannibalizing demand. To protect the brand, themanufacturer may want to be certain that defective productsare not sold again as new to unsuspecting customers. Also,to protect the brand’s image, the manufacturer may not wantthe product to be seen in certain retail outlets, such as dollarstores or flea markets.

Chapter 3: Secondary Markets 81
Another reason for wanting the product returned to thevendor is to prevent re-returns. Re-returns are product soldat a discounted price at an outlet store and then returned forfull price in the regular channel.
In some cases, however, the vendor will compensate theretailer for the defective product and not require a return ofthe product. Depending on the vendor, the retailer may berequired to destroy the product, or may be free to sell theproduct through an outlet store or elsewhere in thesecondary market. If the retailer decides to utilize thesecondary market, the vendor may require him to deface theproduct by removing all identifying marks and labels.
Sell As NewIf the returned product is unused and unopened, the retailermay be able to return it to the retail store and resell it asnew. The product may need to be repackaged. In someindustries, such as automobile parts, firms spend asignificant amount of money annually on repackaging, sothat consumers will not be able to detect that the product isbeing resold.In some industries, there are restrictions, legal or otherwise,in which products cannot be resold as new once a customerhas returned them. In the building materials market, forexample, in some places, it is illegal to sell a circuit breakerthat has previously been installed. For this reason, if acustomer returns a circuit breaker that appears to have beeninstalled, even temporarily or unsuccessfully, the retailercannot restock it as new.

82 Rogers and Tibben-Lembke
Even when a legal violation has not occurred, companieswill act quickly to put down any negative publicity thatmight result from an accusation of selling used products asnew. For example, in 1997, an individual accused a largeretailer of selling car batteries that had been previouslyreturned. The retailer quickly responded to fight theallegation to protect the reputation of one of its best-knownproducts.
In a highly publicized case in 1995, Packard Bell was alsoaccused by its competitors of cannibalizing parts from usedmachines and putting those parts in new computers.
Sell Via Outlet or DiscountIf the product has been returned, or if the retailer has toolarge an inventory, it can be sold via an outlet store. In theclothing industry, because customers will not accept areturned item as new, an outlet store is the retailer’s onlysales channel. Commonly, firms have significant quantitiesof end-of-season items which will no longer be offered in theretailer’s stores. However, in an outlet store, customers lookfor, and may even come to expect, off-season items.
Selling through outlet stores offers a number of advantagesover other disposition options. Using their outlet storesystem, firms maintain control over the products, and knowwhere the products will be sold. For many firms, the abilityto protect their reputations and market positioning is critical.However, outlet store sales also require more risk andexpense.

Chapter 3: Secondary Markets 83
The number of outlet stores and outlet store malls in the U.S.has tripled in number since 1988. Last year, an estimated 55million Americans traveled at least 200 miles round-trip toshop at factory outlet stores.1
Many manufacturers initially opened outlet stores to sell offoverstocked items, returns, or factory seconds. These storesproved to be a profitable place to sell products at a lowerprice point. Their success led firms to open outlet storesacross the country. Van Heusen has more outlet stores thanany other company with more than 700.2
This growth has had some unforeseen consequences. Outletstores require inventory to remain open. Often, theoverstocks from the primary retail channel and any availablesecond quality goods are not sufficient to keep these storeswell stocked throughout the year. As a result, many firmsare now producing specifically for the outlet market. Theseitems are targeted for the lower price point of outlet stores,and so offer fewer features, or are in some waydifferentiated from the “A” channel goods, while stilloffering the quality product for which the brand is known.
Outlet stores operated by manufacturers and other brandowners often provide better margins than if the productwere sold to a retailer. The outlet store has become animportant source of profit beyond the deposition of returns.
Sell to Secondary MarketWhen a firm has been unable to sell a product, cannot returnit to the vendor, and is unable to sell it at an outlet store, one

84 Rogers and Tibben-Lembke
of its final options is to sell it via the secondary market. Thesecondary market consists of firms that specialize in buyingclose-outs, surplus, and salvage items, at prices as low as tencents on the dollar. For retail goods, the average recoveryrate is approximately 17 percent of retail price.3 Thesecondary market firms then sell the product through theirown stores or to other markdown retailers, such as dollarstores.
Donate to CharityIf the product is still serviceable, but perhaps with someslight cosmetic damage, retailers or vendors may decide todonate the product to charitable organizations. In this case,the retailer usually does not receive any money for theproduct. It may, however, be able to gain a tax advantagefor the donation, and thus receive some value, while being agood corporate citizen. However, charities have begun topay for first quality product. One large retailer included inthe research charges Goodwill Industires for product.
Remanufacture / RefurbishBefore determining that the product is a complete loss, andsending it to be recycled, many firms will attempt torefurbish or remanufacture. The range of options availableto a firm in this area varies greatly, depending on the type ofproduct and the reason it entered the firm’s reverse logisticsflow. Many consumer products cannot be remanufactured.Once used, nothing can be done to refurbish or make themattractive or useful for another customer to purchase.

Chapter 3: Secondary Markets 85
Other items lend themselves to refurbishing, such aselectronics products. If a customer returns a fax machine tothe retailer because it does not work, the retailer will sendthe machine back to the manufacturer or a third party thatspecializes in refurbishing. The resale value of the machinein this condition is very low. Rather than attempting to sellthe machine in this condition, the manufacturer willdiagnose the problem and repair the machine. At this point,the manufacturer may do one of two things with themachine: it may be sent to a secondary market firm that willsell the machine as “reconditioned” or “remanufactured;” orthe machine may be sold via an outlet store.
Commonly, a defective machine is sent to themanufacturer’s service network. If a customer owns aproduct that needs service, the product may be sent to themanufacturer for repairs. The manufacturer may offer thecustomer two choices: the customer can wait while themanufacturer repairs the actual product, or themanufacturer will send a different machine immediately.Under the second option, the customer does not get back theoriginal machine.
Materials Reclamation / Recycling / LandfillWhen, for some reason, the firm is prevented from sellingthe product to the secondary market, and the product cannotbe given away, the final option is disposal. As always, thefirm’s objective is to receive the highest value for the item, ordispose of the item at the lowest cost. Some items, such ascatalytic converters and printed circuit boards, contain smallquantities of valuable materials such as gold or platinum,

86 Rogers and Tibben-Lembke
which can be reclaimed. Such reclamation helps offset thecost of disposing of the item. Other items may be composedof materials that are of some value to scrap dealers, like steeland iron. When the materials are not of value to othercompanies, the firm may develop ways of using the productto avoid sending it to a landfill. A good example of this isoutdoor running tracks made of ground-up athletic shoes.Another example involves sorting damaged retail clothinghangers, melting them, and making new hangers.
As described above, some vendors require retailers todispose of defective products. In this case, the retailer hasno choice but to follow vendor instructions and send theproduct to the landfill or incinerator. For example, somesports cards manufacturers accumulate inventories of cardsone or more years old. Among card collectors, older cardsare more valuable, and a case of cards only a year or two oldmay, in some instances, be worth thousands of dollars.However, the vendor may instruct the distributor to destroythe old cards, in which case the distributor, accompanied bya security guard, will place the cases of valuable cards in alandfill.
3.4 Material Flow
In any reverse logistics flow, one critical objective is toreceive the highest value possible for the products inaccordance with any legal restrictions or constraintsimposed by the vendor. In order to accomplish this, the

Chapter 3: Secondary Markets 87
following steps must be a part of each reverse logisticssystem:
1. Gatekeeping—deciding which products toallow into the reverse logistics system
2. Collection—assembling the products for thereverse logistics system
3. Sortation—deciding what to do with eachproduct
4. Disposition—sending the products to theirdesired destinations.
There are a variety of paradigms that can be used for areverse logistics system, but most can be described inrelation to the following two extremes: centralized anddecentralized. In a decentralized system, all decisionsregarding the disposition of products are made at retaillocations. Some transportation costs are avoided because theproducts are not all taken to a central processing centerbefore the disposition decisions are made. However, at thesame time, a decentralized system will likely increase thetotal transportation costs of disposition, because all productsdestined for a particular secondary market firm are scatteredacross the company’s network of stores, and either directlyor indirectly, the retailer must pay to collect the goods.
The larger disadvantage of a decentralized system is that thefirm will likely receive less income from the secondarymarket firms. There are two reasons for this. First, eachlocation will have a much smaller quantity of a given item,and smaller quantities do not bring the highest prices on the

88 Rogers and Tibben-Lembke
secondary markets. Secondly, the individuals in charge ofsortation at a particular store may not develop adequateexperience with a particular item to learn the most effectivemeans of disposing of the item, which means lower reverselogistics receipts for the retailer.
As described in Chapter 2, in a centralized system, allproducts for the reverse logistics pipeline are brought to acentral facility, sorted, and sent out to their ultimatedestination. This consolidation method creates the largestpossible volumes for each customer, which leads to higherrevenues. Employees develop expertise in certain areas andcan consistently find the best destination for each product.
One of the most important activities within a reverselogistics system is sortation. Obviously, determining thebest channel for disposing of the product is of criticalimportance in maximizing revenues from the products in thereverse logistics system. Gatekeeping is also important inreducing the system costs. Generally, a large cost istransportation. If the product is going to be thrown away, itis best to discover this as early as possible, to preventperforming additional steps and incurring additional costs.For example, if a vacuum cleaner has been damaged beyondrepair, transporting it 500 miles to throw it away is not costeffective. Efficient gatekeeping early in the channel preventssuch items from entering the reverse logistics system at all,and can be a source of significant cost savings.

Chapter 3: Secondary Markets 89
3.5 Secondary Markets
The secondary market is a term for the collection ofliquidators, wholesalers, exporters, brokers and retailerswho sell product which, for one reason or another, has notsold through the primary sales channels. Companies in thesecondary market sell both new and used product.
The secondary market often involves a transfer of productsdirectly from the manufacturer to the secondary marketfirm; therefore, understanding the secondary marketrequires an examination of several areas that not part of thetypical retail reverse logistics system. However, because thesecondary market has a large role to play in the operationsof many reverse logistics systems, a detailed discussion ofthese areas of the secondary market will provide a betterunderstanding of the operations of reverse logistics flow ingeneral.
Figure 3.1 shows a number of companies in the secondarymarket. To help clarify the difference between reverselogistics activities and secondary market activities, reverselogistics activities are shown in a heavy dashed line, andsecondary market activities are shown in a light solid line.
If a product is entering the secondary market directly fromthe manufacturer, the manufacturer probably did not wantthe item for one of the following reasons:
1. Changed Product Packaging2. Product Redesigned

90 Rogers and Tibben-Lembke
3. Order Cancellation4. Sales Expectations Not Met
Packaging ChangePackaging changes account for a large percentage of close-out items. A package change may occur due to outdateddesign, or a change in the size of the product. This isparticularly true with grocery items. Customers may beconditioned to a particular price for the product. Ratherthan increase the price of the package, manufacturers maykeep the price constant by reducing the amount of product
returnsManufacturer Retailer
returns
Customer sales products
• Seconds• Close-Outs• Surplus• Salvage
Secondary Market Firms
• Returns• Job-Outs• Close- Outs• Surplus• Salvage
Figure 3.1Flow of Returns and Secondary Market Goods

Chapter 3: Secondary Markets 91
in the package, while keeping the size of the packagingunchanged.
Product RedesignIntroduction of a new product version precipitates inventoryclean out of the old product. The old version of the productis sold until it is gone, perhaps at a discount. The productmay never enter the secondary market. If the productchange is significant, the manufacturer may give the retailerliberal incentives to sell the remaining old product. Asignificant modification may make the retailer more likely topull the old product from the shelves and send it to thesecondary market.
When a product has been discontinued because ofdisappointing sales, the firm is more likely to have a difficulttime finding a buyer for the product, even at a greatlyreduced price. If the product is sent to the secondarymarket, the retailer’s expected price may be greatly reduced.Disposing of the inventory through usual retail channelsmay be difficult.
Order CancellationCancellation of a very large order results in surplusinventory. For example, a trash can manufacturer makes alarge number ordered by a major retailer. The retailercancels the order. The manufacturer is left with thousandsof surplus trash cans. The manufacturer may be quitewilling to sell the unsold product to anyone willing to pay aprice sufficient to recover the cost of manufacturing thegoods.

92 Rogers and Tibben-Lembke
Sales ExpectationsFinally, a manufacturer may find itself with a large quantityof unsold merchandise because the sales projections for theproduct were overly optimistic. Rather than hold a largequantity of inventory that may take a long time to sell, themanufacturer may prefer to sell it all at once to a liquidator,for a lower price.
3.6 Secondary Market Firms
Firms in the secondary market supply products to a growinggroup of retailers who specialize in selling close-outs,surplus, seconds, and salvage items. Flea markets have longbeen known to sell this type of product. Now there is agrowing number of discount or “dollar” stores, includingnational chains like MacFrugals and Just-A-Buck.
The secondary market consists of a diverse collection ofcompanies playing different roles. These firms may bebroken into several categories:
1. Close-out liquidators• Deal in merchandise obtained from return centers,
other liquidators, directly from retail stores, ordirectly from manufacturers
• Types of products: close-outs, surplus, packagingchange, end-of-life
• Physically handle inventory, sorting,consolidating, palletizing
• Product usually remains in U.S.

Chapter 3: Secondary Markets 93
2. Job-out Liquidators• Primarily first quality, seasonal clothing items• Negotiate directly with corporate buying
departments of major retailers• Negotiate while merchandise still selling at retail
store• End of season or transition inventory purchased a
season in advance• Product usually remains in U.S.
3. Brokers• All types of products (close-out, seasonal, salvage)• Find liquidated merchandise for retail clients• No physical ownership of inventory, service
provider only• Product very likely to be shipped outside of U.S.
4. Insurance Claim Liquidators• Appraisal, salvage, and recovery services for
inventory losses from natural disasters• Primarily salvage goods
5. Barter Companies• Make arrangements for companies to trade a
surplus of one product for another company’ssurplus inventory of another product.
6. Gray Markets• New product sold by non-factory-authorized
resellers• Products do not carry factory warranty
94 Rogers and Tibben-Lembke
Because these terms may overlap considerably as they areused in the industry, these definitions may vary slightlyfrom their common usage.
Close-Out Liquidators Close-out liquidators deal in products that have come to theend of their shelf lives, and will no longer be sold. Aproduct may no longer be profitable at its original price, butat a different price point, it may again become profitable.Close-outs may be created for the following reasons: theproduct is a seasonal item, such as snow shovels orbarbecues; a new replacement product has been introduced,as with video games; the product failed to live up to salesexpectations, such as toys related to movie themes.
Many close-out liquidators work directly with themanufacturer, buying the manufacturer’s oversupply. Acommon scenario is that a major retailer cancels a largeorder and the manufacturer has product that it will beunable to sell to other customers. The close-out liquidatorgets the product for a price which allows the manufacturerto recover its cost.
Major manufacturers prefer to deal with large close-outliquidators for two reasons: the ability to pay, and the abilityto handle large volumes. A manufacturer needs to knowthat the liquidator will be able to pay as promised. Also, themanufacturer wants to be able to go to one liquidator for aparticular deal, not to several. The large liquidators havesufficient liquidity to be able to buy in large quantities. If,for some reason, the liquidator will be unable to sell the

Chapter 3: Secondary Markets 95
entire product directly, the liquidator may, in turn, sell someof the product to a different liquidator. In any such sale, theliquidator has to gain a sufficient return to be able to ensurethat the second liquidator cannot profitably sell the productat a lower price.
Large liquidators offer a proven track record of completinglarge deals that are structured to the manufacturer’s wishes.In this industry, being able to deliver services as promised isextremely important. If the manufacturer wants a liquidatorwho can handle the entire transaction, and promises not tosell any of the product to a second liquidator, the largerfirms have a distinct advantage. In the secondary market,trust is an extremely important factor in maintaining arelationship between manufacturer and liquidator.
Liquidators will often buy out the inventory of a retailer or amanufacturer at the end of the season, and store it until thefollowing year. This is particularly true of seasonal goods,such as electric blankets, and holiday items, like Valentine’sDay cards.
Close-out firms will liquidate goods in any market wherethey can reasonably expect to make a profit. Generally, hardgoods seem to be the easiest products to profitably sell.Most liquidators included in the research merchandise hardgoods. The three products that seem to be most difficult fora general liquidator to manage are clothing, toys, andelectronics.

96 Rogers and Tibben-Lembke
Clothing creates additional complications not found in otherproduct lines, due to maintaining inventories of differentsizes. Additionally, styles tend to change more rapidly forclothing than for hard goods. Compounded with theseasonal nature of clothing sales, this makes it difficult forliquidators to profitably buy products one year and holdthem for sale the following year. Job-Out Liquidators Job-out liquidators are similar to close-out liquidators. Theygenerally work with first quality items, but they dealprimarily with seasonal items, not with products that havereached the end of their sales lives, or manufacturers’overstocks. Job-out liquidators often specialize in clothingand shoes. They also tend to specialize more than close-outliquidators, and try to develop product expertise and long-term relationships with retail firms.
In addition, job-out liquidators acquire goods uniquely.Typically, they negotiate directly with major retailers’corporate buying departments, while the merchandise is stillselling at retail store. This technique is known as pre-selling.Finally, the job-out liquidators typically pick up the productand handle all the physical operations themselves. Brokers Brokers deal with all types of products (close-outs, seasonal,salvage) that have reached the end of their sales lives for anyreason. Brokers are the third parties willing to pay a smallprice for the goods that absolutely no one else wants. It isnot uncommon for brokers to enter into an agreement with a

Chapter 3: Secondary Markets 97
retailer to purchase anything the retailer wants to sell themfor a fixed price of so many cents per pound, regardless ofthe type of item or its condition.
Brokers usually do not handle the product themselves. Theyprovide the service of finding the products for outsideparties who may export the products to South America,Africa or Asia, for sale on secondary markets.
In the international market, as in the domestic market, firmsare generally willing to sell any product that they can turnprofitably. International firms do not, for example, restrictthemselves to high-value products. Generally, they areinterested in anything they can profitably ship and sell. Insurance Liquidators Insurance liquidators specialize in products that have beendeclared a loss for insurance purposes. For example, if atrain derails, all the product on the train may be declaredtotally lost, even though much of the shipment may havebeen completely unaffected by the derailment.
In this case, the shipper generally has two choices. Therailroad company may pay the shipper in full for the loss.The railroad sells the product to a secondary market firm,like an insurance liquidator, who buys the contents of thetrain, and finds the best price. If the shipper does not wantthe products to be sold on the secondary market, the shippercan opt to receive partial compensation for the goods andget the goods back.

98 Rogers and Tibben-Lembke
Barter CompaniesBarter companies help firms dispose of excess products andreceive in return, desired product. A barter company mayhave a large store of products that it has received as theresult of past trades. A company gives the barter firm theinventory it wants to get rid of, in exchange for a quantity ofone of the products in the barter company’s inventory.
Generally, a barter company is willing to trade for anyproduct it believes could be profitable. If the product isharder to sell, the barter company will not provide asgenerous a trade allowance. Some barter companies preferto use universally valuable products—such as mediaadvertising time or airplane tickets—as a type of currencyfor exchange.
A company may turn to a barter company with productswhose actual value is significantly below the products’ valueon the company’s books. Rather than writing down thevalue of the product, the company may prefer to trade for anequal value of media time, or some other product it needs.
Gray MarketsGray markets sell new product outside the regular channel,usually by resellers not authorized by the factory. Productcan find its way to the gray market when an authorizedreseller needs to raise capital, and quietly sells still-newproduct to an unauthorized firm for a small profit. Grayfirms typically have lower facilities costs than authorizedfirms, and are therefore still able to profitably sell the

Chapter 3: Secondary Markets 99
product at a significant discount from the manufacturer’ssuggested retail price.
Because gray firms are not factory authorized retailers,products sold by them do not carry the manufacturer’swarranty. Gray market customers buy new, genuineproduct with no warranty.
3.7 Strategic Elements of the Secondary Market
The participants in the secondary market seek to achieve thefollowing:
• Finding quality merchandise to buy and sell;• High inventory turn rates, and• Minimal inventory handling.
In the past, liquidating merchandise was an escape route forretailers to rid themselves of surplus and obsolete productthat did not sell as anticipated. Times have changed.Effective asset recovery has truly proven to be a strategictool for major retailers. In a competition-fierce economywhere constant demand for new products is high, stayingfresh means quickly selling off the old merchandise, andplacing new products on the shelves. Grocery stores mustoperate in this manner due to perishable inventory. Highlyseasonal apparel in the fashion industry makes it crucial forretailers to continually free space for the newer lines ofclothing. This is necessary in order to stay competitive withothers in the industry.

100 Rogers and Tibben-Lembke
In the distant past, companies found it easier to dumpobsolete merchandise in landfills. They saw no financialbenefits from outdated merchandise. As landfill costs beganto increase, companies saw the need to rethink theirpractices and reduce costs by sending products to secondarymarkets. Incorporating salvaging versus product disposalhas saved one larger retailer included in the research over $6million in landfill costs.
Efficiency in time and cost are the keys to success in thesecondary market. In most cases, it is crucial for inventoryto turn fast. Some firms have sufficient capital with which tobuy seasonal merchandise for a large discount. They thenstore it for a year, and earn enough profit on the item tomake up for the cost of holding the product.
Marketing the product and making it more attractive are notimportant once the merchandise reaches the secondarymarket. In most cases, consumers are aware of theseproducts in terms of their brand name and features.Retailers in the secondary market must be aware thatconsumers are seeking bargains from among the productson their shelves.

Chapter 4: Reverse Logistics and theEnvironment
Many companies first focused on reverse logistics issuesbecause of environmental concerns. Today, some areconcerned only with reverse logistics as it relates toreturning product to their suppliers. However, in the future,environmental considerations will have a greater impact onmany logistics decisions.
For example:
• Landfill costs have increased steadily over recentyears and are expected to continue to rise;
• Many products can no longer be landfilledbecause of environmental regulations;
• Economics and environmental considerations areforcing firms to use more reusable packaging,totes, and other materials;
• Environmentally motivated restrictions are forcingfirms to take back their packaging materials, and
• Many producers are required by law to take backtheir products at the end of their useful lifetime.
Each of the trends discussed in this chapter will havesignificant implications for reverse logistics decision-makers.
Disposing of unwanted products is becoming a more closelymonitored activity. In the United States, the traditionalmethod of simply placing items in a landfill is neither as

102 Rogers and Tibben-Lembke
simple nor as inexpensive as it once was. As the number ofmunicipal landfills in the United States continues to shrink,and as regulations affecting landfills become more stringent,the cost of placing items in landfills has risen steadily.Increased restrictions have focused on implementing orinstituting greater measures to protect human health and theenvironment. This has resulted in the closure of manyfacilities, and higher costs at others. Another area ofincreasing regulation is the determination of what items canbe placed into a landfill. Products such as cathode ray tubes(CRTs), for example, can no longer be placed in landfills.
Throughout Europe and the United States, legislation isbeing considered placing conditions on the legal dispositionof products that have reached the end of life. In Germany,new laws dictate that the producer of a good must bearresponsibility for the final disposal of the product. In somestates in the U.S., similar measures are being proposed. Forexample, many states require retailers of vehicle batteries totake back used batteries. In places where legislation doesnot force a manufacturer to take back the product, productsare not being allowed into landfills. In some cases, this willlikely force the establishment of a system to collect theseproducts.
Green Logistics and Reverse LogisticsAn important distinction must be drawn between reverselogistics and a very related subject that we will refer to asgreen logistics. Reverse logistics, as we defined in Chapter1, refers to all efforts to move goods from their typical placeof disposal in order to recapture value. Green logistics, or

Chapter 4: Environmental Considerations 103
ecological logistics, refers to understanding and minimizingthe ecological impact of logistics. Green logistics activitiesinclude measuring the environmental impact of particularmodes of transport, ISO 14000 certification, reducing energyusage of logistics activities, and reducing usage of materials.
Some green logistics activities can be classified as reverselogistics. For example, using reusable totes andremanufacturing are both reverse and green logistics issues.However, there are many green logistics activities that arenot reverse logistics related. For example, reducing energyconsumption, or designing a disposable package to requireless packaging are not reverse logistics activities. Designinga product to use less plastic would not be a reverse logisticsactivity, but designing a product to make use of reusablepackaging would involve reverse logistics.
In this chapter, several issues that lie at the intersection ofgreen logistics and reverse logistics will be discussed.
4.1 Landfill Costs and Availability
Landfill TechnologyWaste disposal has not changed dramatically since the fifthcentury B.C., in ancient Greece, where people wereresponsible for carrying their own garbage to the towndump. During the time of the Roman Empire, people incities shoveled their garbage into the streets, where it wascollected by horse-drawn wagons, and taken to a centrallylocated open pit. Dead animals and people were placed in a

104 Rogers and Tibben-Lembke
pit outside of the city due to pungent odors. These methodslasted only as long as the Roman Empire. They collapsedduring the Dark Ages, and were not yet reinstituted duringthe Renaissance. During these times, trash was generallydiscarded without much thought given to its effect onpeople and the environment. A survey done in 1880 showedthat only 43 percent of major American cities had someminimal type of garbage collection. By the 1930s, thisnumber had risen to 100 percent.1
Until the 1950s, waste disposal still consisted primarily ofburying waste in a large pit. Spontaneous combustionsometimes occurred. Sometimes the waste wouldintentionally be burned to reduce volume. By the mid-1950s,the need to analyze groundwater downgradient fromlandfills was recognized, and by 1959, the sanitary landfillwas the primary waste disposal system used in Americancommunities.2
In a sanitary landfill, also known as a controlled tip, refuse issealed in cells formed from earth or other materials. Themodern landfill is different from the dump of the past in theway the material is covered. By the 1950s, it was recognizedthat covering the material with a layer of soil would reduceits attractiveness to animals, and reduce odor problems.Often, this layer was not deep, and plants were encouragedto grow on it. As studies continued of landfills’ effects onwater quality, it was learned that rain and other water wereseeping through the landfill, contaminating the water table.This contaminated water is called leachate. To reduce watercontamination, caps of a nonporous material are now placed

Chapter 4: Environmental Considerations 105
on top of the landfill to reduce the amount of leachategenerated. Also, a liner of nonporous material is added tothe bottom of the landfill to reduce the amount of leachateescaping. In the landfill of the 1990s, systems are used tocollect leachate at the bottom of the landfill, before it slowlyseeps out through the nonporous material. To capturemethane and other gases produced by decomposition,collection systems must be put into place.3
Landfill AvailabilityFor a number of years, there has been a perception of animpending shortage of landfill space.4 In 1988, it wasbelieved that nearly half of the metropolitan cities on theEast Coast would have no further landfill capacity by 1990.5Although this claim has not been borne out, there has been asteady decline in the number of landfills.
In 1986, the Environmental Protection Agency's Office ofSolid Waste developed a list of municipal solid wastelandfills (MSWLFs). Municipal solid waste includeshousehold waste, and some industrial wastes, such as officepaper and pallets; but does not include construction waste,car bodies, and industrial process wastes that might bedisposed of in landfills.6 This was the first time such a listhad been compiled. In this original list, 7,683 MSWLFs werelisted. When the list was updated in 1992, the number oflandfills had declined to 5,345. When the list was revised in1995, the number of municipal solid waste landfills haddeclined to 3,581. However, it should be noted that duringthis period, the new requirements for proper cover for a

106 Rogers and Tibben-Lembke
closed landfill went into effect, and this regulatory changeled to the closure of many landfills.7
Although the number of landfills has been shrinking at asignificant rate, it is the actual amount of landfill spaceavailable, and how long it will last that is the primaryconcern. Many smaller landfills closed because they werenot able to afford the cost of being compliant with newregulations.8 According to the EPA's Municipal Solid WasteFactbook, 29 states have 10 years or more of landfill capacityremaining, 15 states have between five and 10 years oflandfill capacity remaining, and six states have less than fiveyears of landfill capacity remaining.9
Obtaining information on the rate at which new landfills arebeing created is difficult, but as to whether there is a landfillcrisis, the EPA has a short answer. Despite the fact that thenumber of landfills has been decreasing, the capacity hasremained “relatively constant…. New landfills are nowmuch larger than in the past.”10
Cost of Landfill UsageAlong with the perception of rapidly depleting landfillspace, there has also been a perception of rapidly risingprices for landfill usage. In the industry, the standard basisfor comparing the cost of landfill is the tipping fee. Atipping fee is the cost charged to dispose of a ton of waste.11
As we have seen above, the perception of rapidly depletinglandfill space has not been borne out by the facts. However,in the case of landfilling costs, the perceived trend is very
Chapter 4: Environmental Considerations 107
real. According to the EPA, the national average tipping feein the United States increased from $8 to $31.50 from 1985 to1996, an increase of 294 percent. This is an annual growthrate of 9.4 percent.
Since 1985, the Pennsylvania Department of EnvironmentalProtection has collected data on tipping fees inPennsylvania, which show an almost identical trend.According to their data, the average tipping fee inPennsylvania has grown by 300 percent between 1985 and1996, increasing from $11 to $44 per ton.
Although nationwide prices and some regional prices showa long, slow, upward trend, in some regions, prices havegyrated wildly. After declaring bankruptcy in 1994, OrangeCounty tried to raise revenues by increasing tipping feesfrom $23 to $35. Because there is excess dump capacity in theregion, many of its customers took their garbage to cheaperdumps elsewhere. To increase business, the rate wassubsequently dropped to $19 per ton.12
The fluctuating cost of landfilling has also caused plans forhuge new household waste dumps to be dropped aftertipping fees failed to stay above the projects' breakevenpoints.13
Garbage GenerationEven though there is no immediate threat that garbage willbegin to pile up in the streets, landfills and landfill usage aregoing to be important issues in the near future. Americans

108 Rogers and Tibben-Lembke
generate garbage at an astounding rate. Solutions must bedeveloped.
A few facts about Americans' ability to generate garbage:
• Every year Americans use 75 billion disposable papercups.14
• King Khufu's great pyramid in Egypt is built of morethan 3 million cubic yards of stone. The Great Wall ofChina is built of 120 times as much material.15 The FreshKills Landfill on Staten Island, New York, is run by theNew York City Department of Sanitation. According toestimates, in the very near future, the total volume of thelandfill will exceed that of the Great Wall of China.16
• The current rate of garbage production in the UnitedStates is hard to comprehend. The average Americangenerates 4.34 pounds of garbage per day.17 Accordingto a 1987 study, the then-current U.S. annual wastegeneration was 228 million tons, which is an amountsufficient to cover an area 654 miles square 10 feet deep.18
• The EPA projects that from 1995 to 2000, the annual rateof garbage generation per person in the U.S. will increasefrom 4.34 to 4.42 pounds per person per day; a modestincrease of two percent. Because of increased recyclingefforts, however, the amount heading for landfills isexpected to decrease over this period, from 2.47 poundsper person per day to 2.38 pounds, a reduction of 3.6percent.19

Chapter 4: Environmental Considerations 109
Given the rate at which Americans generate waste, landfillalternatives must be developed.
Extending Landfill CapacityWith increasing regulations on the location, construction,and operation of landfills, opening a new landfill hasbecome difficult. The “not in my backyard” (NIMBY)sentiment among people living in the location of a proposednew landfill adds to the dilemma. Additionally, theNIMTOO, “not in my term of office,” phenomenon makesthe problem worse.20
As creating new landfills becomes more difficult and moreexpensive, communities are trying to find new ways toprolong the lives of their existing landfills by reducing thevolume of material that goes into them.
It appears that the amount of garbage being sent to landfillsis shrinking at a rate faster than the rate of populationgrowth. According to the EPA, the number of tons ofgarbage sent to landfills (in millions of tons) in 1970 was87.9. The number grew to 132 million tons in 1990, but haddeclined to 118 million tons by 1995.21 There are also someregional indications that the amount of garbage being sent tolandfills is decreasing. In 1990, California's landfillsdisposed of 40 million tons of garbage. In 1996, that numberhad been reduced to 32.8 million tons.22
In 1970, 73 percent of all waste was sent to a landfill. By1995, that number was down to 57 percent.23 The reductionin material sent to the landfill has been achieved by

110 Rogers and Tibben-Lembke
increasing the amount of material that is dealt with in otherways, through recycling, composting and incineration.Although the amount of material that is incinerated hasgrown steadily over this period, as a percentage of the wastestream, it has declined from 20 percent to 16 percent.
The decline in landfill and incineration is a result of largeincreases in the percentage of the waste stream that is beingrecycled or composted. In 1970, less than seven percent ofthe waste stream was recycled or composted. In 1995, 27percent of the solid waste stream was recycled orcomposted.24 Of this, roughly five percent of all waste in theUnited States is composted, and roughly 22 percent isrecycled. Nearly all states have ambitious goals of thepercentage of waste that should be recycled. Rhode Islandhas the highest long-term recycling goal, at 70 percent.25
Recycling programs are available in the major cities in allstates.
Landfill RestrictionsRestrictions on what can be placed in a landfill are a keyfactor to the longevity of America’s landfills. Some items,like CRTs, are banned because placing them in a landfill willpresent a long-term health risk. Others are banned becausethey take up too much space and can be better dealt withusing other methods.
As of 1993, 44 states had bans on telephone books beingplaced in landfills, and 23 states had laws banning grassclippings and yard waste from landfills.26 These are but twoof the many items which have been forbidden from being

Chapter 4: Environmental Considerations 111
placed in landfills because they can be dealt with so muchmore effectively in other ways. Telephone books can berecycled. Yard waste can be composted. However, either ofthese options becomes impossible once the products haveentered the landfill. Agencies charged with collecting wastehave set up additional systems to collect materials that haveefficient alternate waste disposal possibilities.
Disposal Bans and Reverse LogisticsIn many places, the definition of a hazardous material isbeing expanded. In Minnesota, for example, it has beenruled that automotive shocks and struts cannot be placed inlandfills, and it is expected that other states will follow suitin the near future.27 For automotive shocks and struts, thisnew restriction has resulted in a perceived new opportunity.One major manufacturer of automotive shocks and strutshas begun a program to collect used shocks and struts andreclaim the materials contained in them. Motivated by thelandfill ban, the manufacturer began studying the feasibilityof collecting the used shocks and struts. Once the study wasbegun, the company quickly concluded that a substantialmarket existed for some of the specialized steel used in themanufacture of the shocks and struts. The company alsorealized that such a program would give it significant,beneficial exposure as an environmentally friendlycompany. On this basis, the company is proceeding with theimplementation of a nationwide program to reclaim theproducts.
Various computer components are banned from landfills,including circuit boards with high lead content. The

112 Rogers and Tibben-Lembke
computer components representing the largest problem arethe cathode ray tubes (CRTs) in computer monitors. CRTs,which have been banned from landfills by the EPA since1992,28 contain traces of lead, phosphorous, cadmium, andmercury. When CRTs are crushed at trash-compactingfacilities, the lead and other particles become airborne,posing a health risk to sanitation personnel and those livingnearby.
Experts believe that the magnitude of this problem will onlyincrease. The Gartner Group predicted that between 1992and 1996, 50 to 70 million personal computers would bediscarded. A Carnegie Mellon study predicts that 150million personal computers will be heading for landfills by2005, because they cannot easily be recycled.29 The disposalcost for these machines alone will exceed $1 billion,excluding the cost of creating a hole large enough to containthem. If a one-acre hole were dug to bury this manypersonal computers, it would be three and a half miles deep;enough room to stack about 15 Empire State Buildings endto end.30
The size of the future PC disposal problem can also beconsidered in the following way. Currently, there are 324million PCs in use around the world. If all of these wereplaced in a landfill one acre square, the hole would need tobe 6.7 miles deep, nearly as deep as the Mariana Trench.31
Pallets are another landfill-banned product. It has beenestimated that there are 1.6 billion pallets in the UnitedStates, enough for every American to have six pallets. This

Chapter 4: Environmental Considerations 113
year alone, nearly 400 million pallets will be produced,which requires a tremendous amount of wood. It also posesa serious disposal problem. A third of U.S. landfills will notaccept pallets, and others charge extra fees for disposing ofpallets. Burning the pallets is not necessarily the answer,either. In Wisconsin, a large building products companywas fined $1.7 million for illegally disposing of incineratedpallet waste.32
These are but a few of the products banned from landfills.Across the country, the following products have beenbanned from landfills in one or more states: motor oil,household batteries, household appliances, white goods,paper products, tires, thermostats, thermometers,fluorescent lights, and some medical and electricalequipment.33 The number of products prohibited in landfillsis only expected to increase in the future. As in the case ofautomotive struts, each one of these bans will present a newreverse logistics opportunity.
4.2 Transport Packaging
Although it does not receive much attention in the tradepress, the usage and impact of transportation packaging,pallets, drums, gaylords, boxes, etc., is a significant portionof the total packaging used globally each year. As describedin section 4.1, many governmental bodies are placingrestrictions on the ways that transport waste may bedisposed. As is described in Chapter 5, companies in

114 Rogers and Tibben-Lembke
Germany are responsible for taking back all of the transportpackaging of the products they sell.
In the United States, legislation does not exist nationally, andvery few statutes concerning transport packaging exist.However, transport packaging is a significant issue for manycompanies. Consider a few facts:
• Of the 1.6 billion pallets in the United States, eachyear, pallet recyclers will process more than 170million pallets for recycling, representing 2.6 billionboard feet, of which 2.3 billion board feet will bereused to make new pallets.34
• Although wood is the most common material forpallet construction, plastic pallets currently representabout 3 percent of the market, but are estimated to begrowing by as much as 30-40 percent per year.35
• Each year, $15 billion worth of corrugated fiberboardis sold in the U.S. alone, generating more than 24million tons of waste.36
The difficulties of pallet disposal were discussed above inthe section 4.1. In some U.S. cities, the cost to dispose ofcorrugated can be as high as the cost of purchasing it.37 Therising cost of purchasing and disposing of transportmaterials is leading many companies to consider reusabletransport packaging.

Chapter 4: Environmental Considerations 115
Reusable Transport PackagingAlthough environmental reasons have factored heavily inmany firms' switch to reusable transport packaging, forsome, it is simply a matter of economics. Reusablecontainers are generally much more expensive than single-use packaging. However, if a reusable container is reused anumber of times, the per-trip cost of the reusable containerquickly becomes less expensive than the disposablepackaging.
A number of case studies cite companies’ significant savingsfrom using environmentally friendly packaging. ForJohnson & Johnson, the payback period on reusablegaylords, both domestic and international, for inter-plantshipments was three to six months. John Deere & Co.experienced a two-year payback on its reusable crateprogram, which has subsequently been expanded to its retailoutlets in the U.S.38
Although many case studies have discussed companies thatsuccessfully implemented reusable container programs, fewcases have been completed about companies thatinvestigated the use of reusable containers and determinedthem to be ineconomical. One interesting example is theHarley-Davidson Company’s decision not to use returnablecrates for delivering motorcycles to dealers, after exploringthe possibility of their use.39

116 Rogers and Tibben-Lembke
Reusable Container TypesReusable shipping containers are available in many shapesand sizes; many different materials. Custom containers canbe designed to suit any particular need.
Over the years, corrugated boxes have set the standard forall other packaging. Corrugated is lightweight, strong, easyto handle, and inexpensive. Therefore, it is not surprisingthat the majority of reusable shipping containers is plastic,wood, or metal replacements for corrugated boxes.
PlasticIn many applications, plastic is the lightest and cheapestoption. Plastic reusable containers generally come in twostyles: rigid and collapsible. Rigid plastic containers come ina wide variety of sizes, but are most commonly found insizes slightly larger than a box of copy paper.
Rigid plastic containers come in two primary types: with orwithout integral lids. Those without integral lids can bestacked in a nested fashion, as shown in Figure 4.1. Thisreduces storage space and transportation costs. Integral lidsoften consist of two plastic flaps, one on either side of theopening, that interlock in the middle when the box is closed,as shown in Figure 4.2. This provides added protection forthe contents. When the box is open, the flaps hang down onthe outside of either side of the box. Unfortunately, theseflaps can be obstructive and cause the containers to turn inthe material handling system, if the system is not properlydesigned to handle the containers.
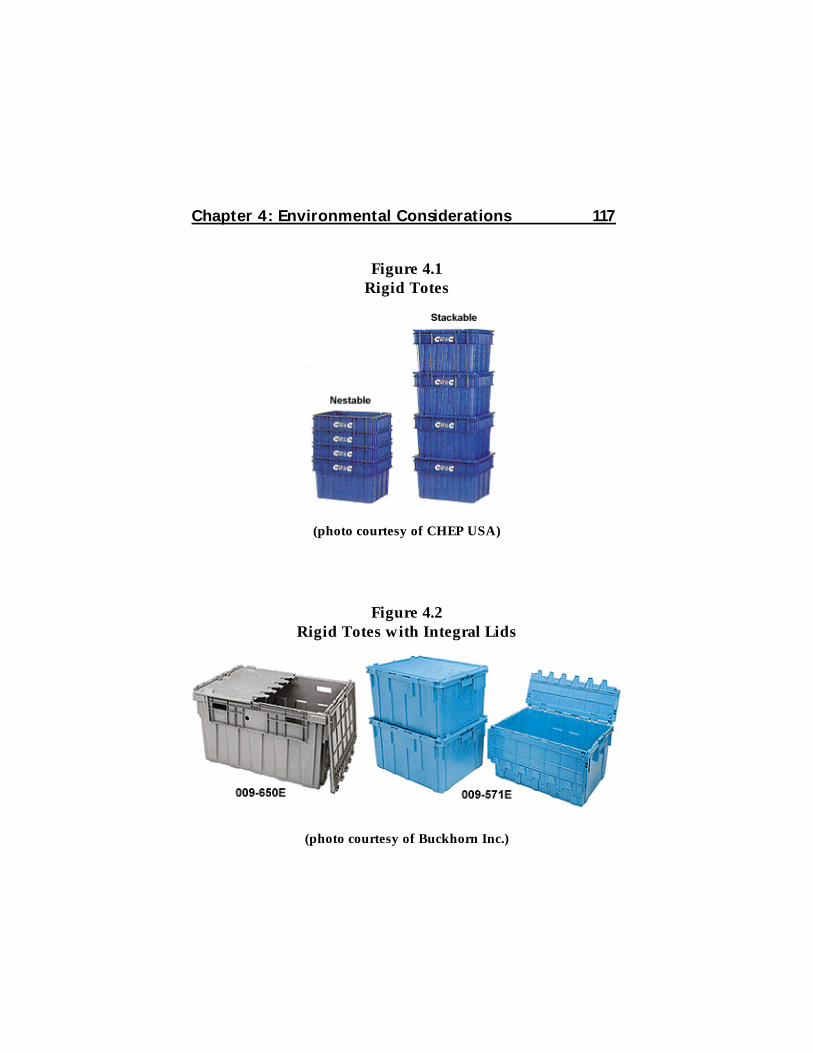
Chapter 4: Environmental Considerations 117
Figure 4.1Rigid Totes
(photo courtesy of CHEP USA)
Figure 4.2Rigid Totes with Integral Lids
(photo courtesy of Buckhorn Inc.)
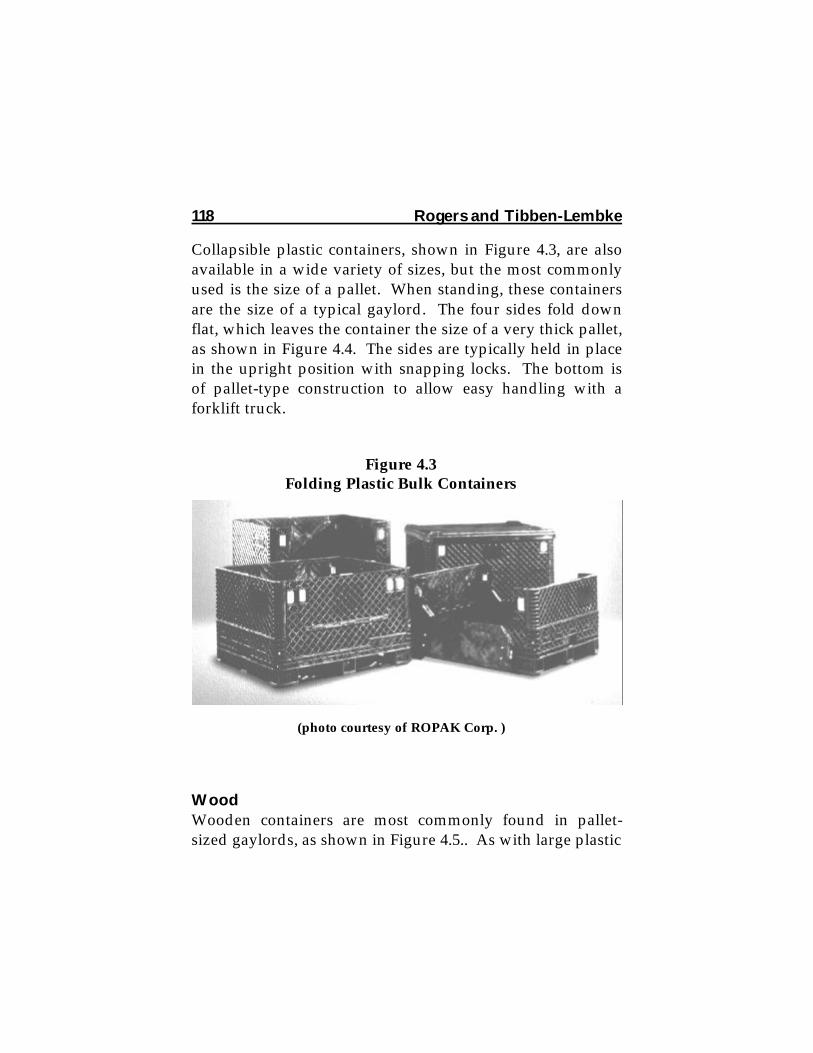
118 Rogers and Tibben-Lembke
Collapsible plastic containers, shown in Figure 4.3, are alsoavailable in a wide variety of sizes, but the most commonlyused is the size of a pallet. When standing, these containersare the size of a typical gaylord. The four sides fold downflat, which leaves the container the size of a very thick pallet,as shown in Figure 4.4. The sides are typically held in placein the upright position with snapping locks. The bottom isof pallet-type construction to allow easy handling with aforklift truck.
WoodWooden containers are most commonly found in pallet-sized gaylords, as shown in Figure 4.5.. As with large plastic
Figure 4.3Folding Plastic Bulk Containers
(photo courtesy of ROPAK Corp. )
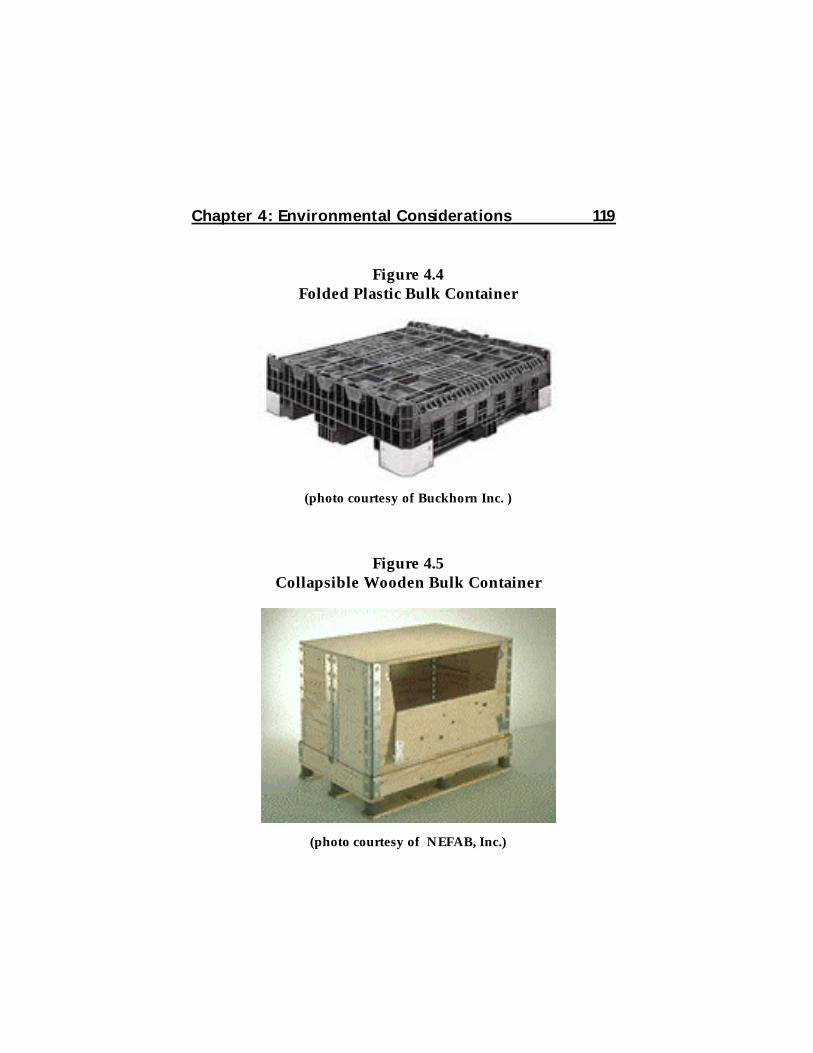
Chapter 4: Environmental Considerations 119
Figure 4.4Folded Plastic Bulk Container
(photo courtesy of Buckhorn Inc. )
Figure 4.5Collapsible Wooden Bulk Container
(photo courtesy of NEFAB, Inc.)

120 Rogers and Tibben-Lembke
containers, the bottom is of pallet construction. Instead offolding the sides down to collapse the container, the sidesare removed as a unit from the top and bottom. The sidesare hinged together at the corners, so they can fold flat, asshown in Figure 4.6.
Pallet collar containers are assembled by stacking layers ofcollars onto a pallet base, as shown in Figure 4.7. Usingdifferent numbers of sections, the container can be made asshort or as tall as needed. These containers also have anergonomic advantage, in allowing the container to bedisassembled as the product is removed.
Wooden containers are very durable and strong, and aresuitable for heavy loads and rough handling. Unfortunately,this sturdiness comes at the price of being heavy, whichadds to transportation costs and can make them moredifficult to maneuver. However, for products that require
Figure 4.6Disassembled Crates Fold Flat
(photo courtesy of NEFAB, Inc.)

Chapter 4: Environmental Considerations 121
sturdy transportation packaging, (like machinery, scientificequipment, etc.) this increased reverse transportation cost ismore than made up for in avoided damages and long-termpackaging cost savings.
MetalFinally, metal is often used for constructing wheeled cagesthat are used to carry boxes or totes for delivery. Thesecages are approximately six feet high and three to four feetlong, by two feet deep; large enough to carry many totes andother miscellaneous items. If all items for a given customerare placed in one or more cages, loading and delivery timescan be significantly reduced. However, because they do not
Figure 4.7Pallet Collar Containers
(photo courtesy of NEFAB, Inc.)

122 Rogers and Tibben-Lembke
collapse or nest for return transport, they are primarily usedfor local deliveries, not long-distance transportation.
Metal is also used for gaylord-sized bulk containers. In sizeand shape, these are similar to the plastic bulk containersshown in Figure 4.3. Unlike the plastic containers, theycannot be collapsed, and given their size and weight, theygenerally cannot be nested. Given their steel construction,however, they are more durable than plastic containers. Likewooden containers, these bins are strong, durable, andheavy.
Because of their weight and poor transportability, metal bulkcontainers are better suited for storage than fortransportation. They are typically used for storing heavy,loose parts.
Container PoolsGiven the high initial investment required for reusablecontainers, being able to get the containers back is critical. Ifa reusable container program is designed to operate onlywithin the area near a facility, getting the containers back isnot difficult. Transportation costs should not outweigh thematerial savings from the program.
However, if the partners are far-flung, the reversetransportation costs may be prohibitively high, and renderthe program uneconomical. Ensuring that the containers arereturned may prove more difficult as the distance increases.Although an in-house closed loop system is easy to maintain

Chapter 4: Environmental Considerations 123
when transporting locally, it is much more difficult to makesuch a system work on a national or international level.
To maintain the supply of containers, firms often charge adeposit on them when they are initially sent.40 For thisreason, there are arrangements that allow companies accessto a large pool of containers. The company does notpurchase the containers, but pays a fee for their use. The feetypically is based on some measure of the firm's use of thesystem. For example, a fee is charged every day for everycontainer the company uses.
The best known such program is run by CHEP. CHEP ownsmillions of pallets, each painted bright blue. Users of CHEPpallets pay a fee of 3.5 cents for every day that they have aCHEP pallet in their facility. This may prove exorbitant foruse in long-term storage, but for long-distancetransportation, it can represent significant savings. Once thepallets are delivered to another company, the sender is nolonger responsible for the cost of the pallets. The shippingcompany gets all the use it needs from the pallet for less thana dollar. This is much cheaper than paying as much as $10to purchase a pallet.
Pallets are not the only transportation materials to be used inlarge pools of this type. United States railroads have asimilar arrangement with boxcars. A stock of cars is pooled,and the different railroads use them as needed. The pool isjointly owned and managed.

124 Rogers and Tibben-Lembke
DunnageOnce a decision has been made about the construction of thecontainer, a decision still must be made about the dunnageto be used. Dunnage is the material used inside thecontainer to prevent damage during shipment. Dunnagemay be plastic, polystyrene, paper, corrugated, or othermaterials.
PolystyreneMany products (especially electronics) are packaged inpolystyrene foam (styrofoam) to prevent in-transit damage.Because of its inorganic nature, polystyrene has long been atarget of environmentalists. In the early 1990s, several statesand 40 local governments enacted bans or recyclingrequirements on the use of polystyrene. However, overtime, many of these restrictions have been eased.41
Although environmentalists may dislike polystyrene foam,they do not have science on their side. One study found thatpolystyrene “peanuts” consume less energy to manufacture,produce less air and water emissions, and produce less solidwaste than other packaging alternatives, including paper.42
Recycling rates for polystyrene foam nationwide haveremained around 10 percent, and have not reachedanticipated levels. The inability to find a workable methodfor recycling the polystyrene peanuts is expected to play alarge role in determining the future of polystyrene foam. Itis expected that polystyrene foam demand will experienceslowing growth as overall demand for disposable packagingdecreases.43

Chapter 4: Environmental Considerations 125
Despite the fact that restrictions may be easing in the UnitedStates, worldwide this may not be the case. In June 1997,Beijing, China mandated that manufacturers and sellers ofpolystyrene food boxes must recycle one-third of theirproduction by 1998 and two-thirds by 2000. As a result ofproducer responsibility mandates either in place or underconsideration in 28 countries, electronics firms have beenturning to paper cushioning, because of high collection feeson plastics.44
A number of companies have attempted to overcome thedrawbacks associated with polystyrene foam. Starch-basedpeanuts are one alternative, but they often turn into“mashed potatoes” in humidity.45 Popcorn, althoughbiodegradable, may leave an oily residue. A company inCalifornia has introduced a product made from limestone,recycled potato starch and water, which it claimsbiodegrades, but does not face the problems experienced bythe other products. The McDonalds restaurant chain hasapproved the product for use with its Big Mac sandwichesand has agreed to purchase 1.8 billion of the containersbeginning in late 1998.46
4.3 Returnable Packaging Considerations
Benefits of ReusablesOne of the major reasons why companies consider reusabletransport packaging is to save on the purchase and disposalcosts of disposable packaging. As described above, manylocal governments have instituted prohibitions on disposing

126 Rogers and Tibben-Lembke
of corrugated material in landfills. This means thatcompanies must store the corrugated material somewhere,and arrange for an outside company to collect and recyclethe material.
In addition to a lower per-trip cost, reusables may providebetter protection for the products being shipped. Reusablescan provide the user with much future flexibility. Astransportation requirements change, reusables can often bereconfigured by modifying the dunnage, which is muchcheaper than buying new containers. Finally, if thecompany no longer has any use for the containers, they canbe returned to the vendor for a credit. Because containersare often made of recyclable materials, they are recycledwhen they have reached the end of their useful lives.
Many companies enter into a program of using reusablepackaging because they believe it is environmentally correct.While this may be a noble motivation, it may not alwayslead to sound business decisions. As will be shown below,there are many costs and issues that must be consideredbefore switching to returnables.
Transportation Costs of ReusablesTransportation materials costs are by no means the onlyconsideration in a decision about reusable containers. Manyof the company's costs related to handling, transporting, andtracking shipments and materials will be heavily affected bya change to reusable containers.

Chapter 4: Environmental Considerations 127
Transportation costs are a major stumbling block to reusablecontainers. They tend to be heavier than the corrugatedmaterials they replace. Because shipping costs can beweight-related, this translates into higher outboundtransportation costs. If trucks “weigh out,” that is, they arefilled to their maximum weight limit, the extra weight ofreusable containers means that fewer units can be put oneach truck, which also means higher shipping costs.
However, in some cases, reusables reduce transportationcosts. When one major manufacturer switched to returnablecontainers for appliances, the containers were strong enoughto be double-stacked, unlike the expendable corrugatedcartons they replaced.
In addition to adding weight, “cube” utilization may not beas good with reusables. A company will typically onlyinvest in a relatively small number of different sizedcontainers. Disposable materials may offer a wider varietyof sizes. The result is that reusable containers may containmore wasted space. This translates into more truck space tomove the same amount of product and higher costs. Also,standardized sizes can mean that more dunnage materialwill be needed, again raising costs.
The other major transportation cost of reusables is gettingthe containers back to the company. If the containers aretaken to the customers on company trucks runningdedicated lines, bringing the containers back should have anegligible impact on transportation costs. When this is notthe case, the cost of bringing the containers back may be

128 Rogers and Tibben-Lembke
high, and in some cases, high enough to make the use ofreusables uneconomical.
ErgonomicsErgonomics must play a role in container selection. Somematerials are much heavier than others. A gaylord-sizedwooden container can weigh over 100 pounds, which is tooheavy for a single person to comfortably lift on a regularbasis, which means two people or a forklift are needed.Also, the contents of some larger sizes cannot comfortably bereached without repositioning the container.
Reusable containers often offer an ergonomic advantageover disposable containers. Most collapsible plastic gaylordsoffer a drop-down panel in one side of the container, asshown in Figure 4.3. Once the level of parts in the containerdrops below the bottom of this door, the container can beopened. This makes it easier for employees to reach parts inthe bottom of the gaylord, reducing physical strain.
Other Costs of Utilizing ReusablesAlthough many companies consider materials andtransportation costs, many fail to adequately consider all ofthe other costs involved in a returnable program. Inaddition to the costs of sending and getting back thecontainers, other handling costs include cleaning, repairing,storing and sorting the containers. Costs to consider aresummarized in Table 4.1.

Chapter 4: Environmental Considerations 129
Unfortunately, reusable containers do require somemaintenance. Once the containers return, they may need tobe cleaned before they can be used again. Some types mayneed to be inspected before they are reused, to prevent theuse of damaged containers. When damaged containers arediscovered, either at an inspection station or on the line,provisions for repairing or replacing the damaged containersare needed. As containers reach the end of the useful lives,replacements will have to be purchased.
For both the producer and the consumer of the containers,the cost of storing the containers must be considered. As thesource of the containers, the company implementing the use
• Forward Transportation Costs• Reverse Transportation Costs• Container Inventory Management• Inspection• Cleaning• Repair• Storage• Sorting• Adapting for Future Use
Table 4.1Costs of Utilizing Reusable Containers

130 Rogers and Tibben-Lembke
of reusables can expect to maintain the supply of emptycontainers. Somewhere, space must be found for thispurpose, which would lead to an increase in costs. Also,additional labor will be incurred in storing and moving thecontainers. The consumer must have space to store emptycontainers waiting to be sent back to the producer.
Managing ContainersOne unpredictable cost is tracking the containers. In theory,the task should be easy: containers go to the customers, andthey return. If there is only one customer that the containersare sent to, this task may be easy. However, if that customeris also receiving reusable containers from other supply chainpartners, there is a very real chance that the containers maybe kept or stolen. A dairy in Southern California retains aprivate investigator to find and capture milk crates.
Even when the customers are part of the same corporation,the customers may not have any incentive or motivation tohelp the supplier get the containers back. Many largeretailers ship products to their retail stores from distributioncenters using the most common reusable shipping material,the lowly pallet. The retail stores are supposed to save thepallets they receive and send them back to the distributioncenters. However, the distribution center managersinterviewed were unanimous in agreeing that it is rare that astore collects and returns the pallets. Instead, most arelandfilled, given away, or sold.
To keep track of containers, many companies use bar codingto track individual containers. Other companies are

Chapter 4: Environmental Considerations 131
developing specialized information systems strictly for thispurpose. For example, GENCO Logistics has developed astand-alone software package that traces individual reusablecontainers for Wal-Mart. Wal-Mart uses the system to trackcontainers that are used to transfer returned goods fromstores to a returns processing center. Using the system, Wal-Mart is able to track the progress of an individual containerfrom the store, through the carrier, until it reaches thereturns center.47
As this example illustrates, companies are beginning torealize that there can be benefits to enlisting a third partycompany in helping to manage reusable containers. Somecompanies, like Wal-Mart, require a software package tohelp them manage their stock of containers. Othercompanies are turning their container management over tothird party companies, entirely. The idea of allowing a thirdparty to manage a company's stock of reusable shippingmaterials is not new. For many years, CHEP has beenmaintaining a stock of pallets used by companies around theworld.
Although many reusable container projects prove to bebeneficial, this is not always the case. In 1995, a study at theAmsterdam Free University traced the use of reusableplastic totes in the dry grocery goods distribution industry.Currently, plastic totes are the standard means for productsshipped from manufacturers to distributors, and fromdistributors to retailers. The study looked at all systemcosts, and concluded that using one-way cardboardcontainers is the most efficient way to distribute products.

132 Rogers and Tibben-Lembke
The authors explain that the cost of maintaining thenecessary pool of containers, storing, cleaning, checking fordamage, etc., are large enough to offset any long-term lowercost of the units.48
Success FactorsAlthough no two reusable container programs are alike,there are a number of factors that have a significant impacton the likelihood of success of a given program.
1. Transportation Distances. The shorter the distance thatcontainers are hauled, the lower the cost of the program.Shorter distances will obviously reduce transportationcosts. Also, shorter distances mean fewer containers intransit at any given time, which translates to reducedneed.
2. Frequent Deliveries. The shorter the time betweendeliveries, the fewer containers will then accumulatebetween trips. The fewer containers piling up at eitherend of the relationship, the fewer containers that need tobe purchased, and the less space that will be needed forstorage. Also, the longer those containers spendgathering dust at the customer, the greater theopportunity for damage and losses.
3. Number of Parties Involved. The fewer parties involved,the easier it is to keep track of containers, and the lessopportunity for lost containers. To manage a systemwith many partners, some companies try to assign eachcontainer to a particular partner, and maintain a separate

Chapter 4: Environmental Considerations 133
closed-loop with each partner. This makes it easy toknow which partner has a particular container, butcreates a number of other administrative problems.
4. Number of Sizes Needed. As the number of differentsizes of container increases, better cube utilization can beobtained, which leads to lower transportation costs.Unfortunately, using many container sizes generallymeans that more containers must be purchased, toguarantee availability of the needed size. In addition,more containers must be handled and stored at eachlocation.
5. Partner Buy-In. The other half of the relationship mayincur a significant amount of additional work as a resultof a change to reusable materials. If the consumer is alsosending material to the supplier, the consumer maybenefit significantly from the change.
4.4 Product Take-Back
A number of societal changes regarding the environment arehaving a profound impact on reverse logistics, as shownabove. In general, there appears to be a trend toward greaterrestrictions and limitations on what may be placed in alandfill, as well as how and where a product may bedisposed.
As a result of these changes, companies have begun toexamine new ways to regain value from products once they

134 Rogers and Tibben-Lembke
have reached the end of their useful lives. In some cases, theimpetus is strictly economic, as with companies that reclaimthe copper and other valuable materials from electroniccomponents.
In other cases, a change in environmental laws can alter theeconomics of recovery. In the landfill section, a strutmanufacturer was discussed. Legislation was passed in onestate preventing their product from being landfilled. Thisled the manufacturer to profitably recover the materials inits product.
Finally, in some places, laws force the manufacturer to takeresponsibility for proper disposal. In some cases, legislationmandates that manufacturers must be willing to take backproducts from consumers after the products have reachedthe end of their lives.
Take-Back Laws in the United StatesSome companies have begun to realize the potentialmarketing benefits of a take-back program. In the U.S., thePresident’s Council on Sustainable Development has begunto study the idea of Extended Product Responsibility (EPR).Extended Product Responsibility focuses on the total life ofthe product, looking for ways to prevent pollution andreduce resource and energy usage through the product’s lifecycle.49
The President’s Council on Sustainable Developmentendorsed the general principle of EPR and said that current

Chapter 4: Environmental Considerations 135
voluntary programs seem to be working well. Itrecommended the adoption of a voluntary system of EPR.
Many companies, such as Compaq, Hewlett-Packard, Nortel,Frigidaire, and Xerox have adopted EPR. Also, industry-wide programs have been created to recycle nickel-cadmiumbatteries and auto bumpers.50
Take-back programs in the United States are not prevalent.However, some are developing. At least 15 states have lawsrequiring retailers to take back vehicle batteries. Marylandpassed a law requiring manufacturers and retailers to set upa system for collecting mercury oxide batteries.51
Advanced disposal fees (ADFs) are paid by the consumer atthe time of purchase to cover the cost of disposing of theproduct at the end of its life. At least 22 states have ADFs ontires, many states have them on motor oil and some havethem on white goods, such as appliances.
ComputersWhile there is currently no mandatory take-back ofcomputers in the U.S., the U.S. is the world’s leadingproducer and user of personal computers. The U.S.electronics industry has begun to study how to recycleelectronic products52 , and has begun designing an idealelectronics recycling center.53 The U.S. EPA has begunstudying the collection of end-of-life electronics components.So far, it has funded two collection pilots for residentialelectronic and electrical equipment.54

136 Rogers and Tibben-Lembke
In Japan, by the year 2000, makers of electrical devices willbe required to recycle their own products. In response to thiscoming deadline, IBM Japan began a program to encouragecustomers to trade their old computers in on a new system.Depending on the age and value of the system beingbrought in, the customer receives a certain amount of credit.The returned computers will have their processors and harddisks upgraded, and will be returned to stores to be sold.55
It is estimated that in California alone, more than twomillion obsolete PCs are abandoned every year. Manycharitable organizations have created standards foracceptable and unacceptable computers. In the words of aspokeswoman for Goodwill Industries, a large U.S.charitable organization, “We don’t want your junk."56

Chapter 5: European Reverse Logistics
As in the U.S., effective management of reverse logistics isstill emerging in Europe. In environmental and green issues,Europe appears to be ahead of the United States. Forconsumer returns, European reverse logistics practiceappears to lag behind leading edge American systems.
The focus of this chapter is on European environmental andgreen solutions to discarded products and materials.
Throughout Europe, legislation is being passed, placingconditions on what can and cannot be done with a productthat has reached the end of its life. For example, a number ofEuropean countries have passed legislation requiringproducers to collect their products at the end of life. Manybelieve that it is only a matter of time before similarmeasures appear in the U.S.
5.1 German Packaging Laws
The German Packaging Ordinance of 1991No single piece of packaging legislation has been as widelydiscussed, nor has had as wide an impact as the packaginglaws recently implemented in Germany. The Germansystem is worth examining at in detail because it has been sowidely discussed in the popular business press, and hasformed the basis for programs in other countries. It is themotivation for pending legislation in the U.S.

138 Rogers and Tibben-Lembke
In 1991, the German Bundesrat (the German equivalent of theU.S. Senate) passed the Packaging Ordinance. Thislegislation mandates that industries organize thereclamation of reusable packaging waste, while localauthorities continue to handle the collection and disposal ofthe remaining waste. Under the legislation, companies musteither collect the packaging themselves, or contract withsomeone else to perform the collection.1
According to Ackerman (1997), the 1991 PackagingOrdinance has four principal components designed toincrease producer responsibility for packaging waste:
1. Manufacturers and distributors must accept transportpackaging, such as pallets, cartons, etc., and reuse orrecycle them.
2. Retailers must accept back secondary packaging, forexample, outer packaging, like the box that a tube oftoothpaste comes in. Distributors must accept backsecondary packaging and reuse or recycle it.
3. For primary packaging, such as a toothpaste tube, thesame rules apply as for secondary packaging, unless theindustry establishes a collection and recycling systemthat meets strict governmental quotas for the recovery ofeach type of packaging (72 percent for glass and metalpackaging, 64 percent for paper, plastic, cardboard, andcomposite packaging).
Chapter 5: European Reverse Logistics 139
4. A deposit/refund system is required for beverage,detergent, and paint containers.2
The legislation quickly had its desired effect. For transportpackaging (which is 30 percent of the packaging), interest inreusable packaging quickly increased, and the use ofsecondary packaging quickly fell, although it was ordinarilyless than 1 percent of all packaging. The main controversyhas been around primary packaging, which represents thebulk of packaging materials.
The Duales System Deutschland (DSD)To comply with the legislation, 400 companies set up theDuales System Deutschland (DSD) to try to meet thegovernment's quotas for recycling the different packagingtypes. The DSD signs contracts with three groups. First, itlicenses the use of its “Green Dot” symbol, as shown inFigure 5.1 below, to packaging producers, who put the logo
Figure 5.1German “Green Dot” Symbol

140 Rogers and Tibben-Lembke
on their packaging. Secondly, it contracts with private wastehaulers and municipal waste collectors to collect packagingbearing the Green Dot. Thirdly, it contracts with industryorganizations that guarantee the waste will be recycled.3
Material is collected from consumers and retailers and sentto secondary materials firms for processing. As much aspossible, the material is reused to make new packaging,which will follow the cycle again. However, not all materialcan be reused. Some is used for producing products. Anexample of this is making park benches out of soda bottles.Other products will be used as sources of energy. Still otherproducts may be exported. This product flow is shown inFigure 5.2.
Green Dot ProgramThe Green Dot program is the major focus of the DSD. Theirlogo is called a “Green Dot,” even though on mostpackaging, it is printed in black ink.
In order for a container to be accepted by a participatingwaste hauler, the packaging must carry the Green Dot of theDSD. In order for a company's packaging to bear the GreenDot, the company must pay a licensing fee to the DSD. Thecost for the Green Dot depends on a number of factors. Thefees are based on the “producer pays” principle, and takeinto account sorting and recycling costs for the variouspackaging materials. For example, the costs for plastic aremuch higher than those for glass, because of the increasedsorting and recycling costs of plastic. In addition, thevolume of the product is taken into account.4

Chapter 5: European Reverse Logistics 141
Flow of materialsFlow of payments
Waste Exportse.g. plastics to South East Asia
'Linear Recycling'e.g. production ofinferior products
WasteDisposal- landfill- incineration
'Real' Recyclinge.g. new glasscontainers fromglass cullet
Secondarymaterials firms
PackagingProducers
Collection byContractedorganizations
Consumers
Retailers
DSD
Figure 5.2Flow of Materials in the DSD

142 Rogers and Tibben-Lembke
The “producer pays” principle dictates that the companyresponsible for an environmental situation should pay forthe cost of the cleanup. In the case of packaging, theproducer of the packaging should be responsible for the costof recycling or disposing of the packaging. Obviously, theconsumer will indirectly pay for this cost, but ultimately, theproducer is responsible for the cost.
Exactly which partner in the supply chain must apply for theGreen Dot depends upon the type of the packaging. Forpackaging that is filled with a consumer product such as, forexample, a cottage cheese container, the productmanufacturer must apply for the Green Dot, not thecontainer manufacturer. For service packaging, likeshopping bags, wrapping film, and disposable dishes, thepackaging manufacturer must apply. For products that areimported, the German importer or the exporter, if located inthe European economic area, must apply. Countries locatedoutside the European economic area cannot apply for theGreen Dot. Applications may be made either in paper form,or using software designed for the purpose, both of whichare available by contacting the DSD at the address listed inthe Appendix C.5
Evaluation of the Duales System DeutschlandThe DSD's initiatives have been successful, in that theamount of material recycled has increased dramatically. By1997, Germans were recycling 86 percent of all salespackaging from households and small businesses.6 Bycomparison, many American cities are currently strugglingto reach established targets of 25 percent .7

Chapter 5: European Reverse Logistics 143
A criticism of the Green Dot system is that it is tooexpensive. Proponents of the original legislation claimedthat recycling would be less expensive than sendingproducts to the landfill. Thus far, recycling has not provento be cheaper than landfilling. The system ends up costingless than $20 per person.8 While this amount may seem highto some critics, it is much less expensive than many recyclingprograms in the U.S., which have achieved far lower rates ofrecycling.9 The startup of the DSD was plagued by anumber of problems which may strike any companyattempting to set up a new reverse logistics system; althoughthe scope and scale of this system are much greater thanmost reverse logistics systems will be.
All three of the partner groups that contract with the DSDexperienced problems. The license fees collected by thepackaging producers were initially too low to cover the costof collecting and recycling the packaging. Also, many firmswere slow to pay their agreed-upon licensing fees. As aresult, the DSD narrowly avoided bankruptcy in 1993.Afterward, it revised the licensing fees to reflect the cost ofrecycling each type of waste, and increased pressure oncompanies to license the Green Dot and make promptpayments.10
The contracts with the waste haulers were more expensivethan anticipated. In two years, the DSD had to sign anagreement with a company in each city in Germany tohandle the collection. The waste haulers believed thatfinalizing agreements in all cities was more important thantrying to keep costs down. Another factor which led to

144 Rogers and Tibben-Lembke
higher collection costs was Germany’s inexperience withcurbside recycling collection. Prior to the packagingordinance, recycling was done primarily through drop-offlocations. The final factor was that the DSD paid forcollection on a per-ton basis. This gave the waste haulers noincentive to keep out products that did not belong in thesystem, which may have accounted for 20 to 40 percent ofearly collections. As a part of its reorganizing after nearbankruptcy in 1993, the DSD gave the waste haulers a percapita ceiling on their revenues for collection. This gavewaste haulers an incentive to reduce the amount ofextraneous material entering the system.11
The DSD's hardest problems with may have been thecompanies it contracted to recycle the collected material.
In 1993, projections were for 300 million tons of recycledplastic. Actual results were 400 million tons. Processorswere not prepared for such large quantities, and the marketfor recycled plastics was not yet ready to buy such largequantities. When the recyclers accept plastic, they areobligated to ensure that the plastic is eventually recycled;that is, made into new products. Ideally, the material shouldall stay within Germany. With supply exceeding demand,prices of recycled plastic dropped dramatically, and largequantities were sent to other European countries, becausecompanies desiring the materials could buy it much morecheaply from German sources than local sources. Thiscaused great problems for the recycling programs of otherEuropean countries, and has led to discussions about howmuch one country's policies should be allowed to impact the

Chapter 5: European Reverse Logistics 145
recycling efforts of other countries. The other result of theexcess supply is that large quantities of plastic supposedlydestined for reuse ended up in landfills in southeast Asia, ascompanies found it cheaper to export the problem than tofind a use for it in Germany.12
The most interesting response to the flood of materialcreated by the DSD has been the European Union'sPackaging Directive, adopted in 1994. Perhaps for the firsttime anywhere, regulations attempt to restrict the amount ofrecycling. Under the directive, countries are to recover atleast 50 percent of their packaging material, but no morethan 75 percent. If countries want to recover a higher levelof packaging, they must demonstrate that they havesufficient recycling capacity to handle their own materials.13
The other major complaint about the Green Dot program isthat it is, in fact, a license for a company to create as muchwaste as desired. There is no incentive for a reduction inwaste production. Also, there is incentive for companies toexplore reusable packaging. For this reason, some localgoverning bodies resisted the implementation of theprogram.14 Despite this criticism, the program hassucceeded in reducing the amount of packaging wasteGermans create. From 1991 to 1995, the amount of recycledpackaging used by German consumers decreased by nearly11 percent, while disposable packaging used in the U.S.increased 13 percent over the same period.15
In May of 1998, another German company, Landbell, beganoffering the same collection services as the DSD, but at a less
146 Rogers and Tibben-Lembke
expensive price. Unlike the DSD, the consumer does notseparate each of the products to be recycled. The consumermust only separate paper and paper-based materials. Allother household waste is collected and sorted centrally toremove metals, batteries, minerals, and glass. The remainingwaste, including plastic, is dried, compressed into bales, andincinerated with energy recovery. The DSD is challengingthe court ruling which allowed Landbell to begin service, onthe grounds that it does not comply with Germany’s 64percent recycling target for plastics.16
5.2 Transport Packaging
Despite the fact that transport packaging is a significantportion of the total packaging used globally every year, itdoes not receive much attention in the U.S. The amount oftransport packaging used every year its disposal wasdiscussed in the section on transport packaging, in Chapter4.
In Germany, one of the goals of the Packaging Ordinancedealt specifically with transport packaging. Under the law,companies must take back all transport packaging thatcomes with its products, either for reuse or recycling.Therefore, all transport packaging must be coded forrecycling. Figure 5.3 shows paving stones sitting on a pallet,wrapped in plastic which is coded for recycling.
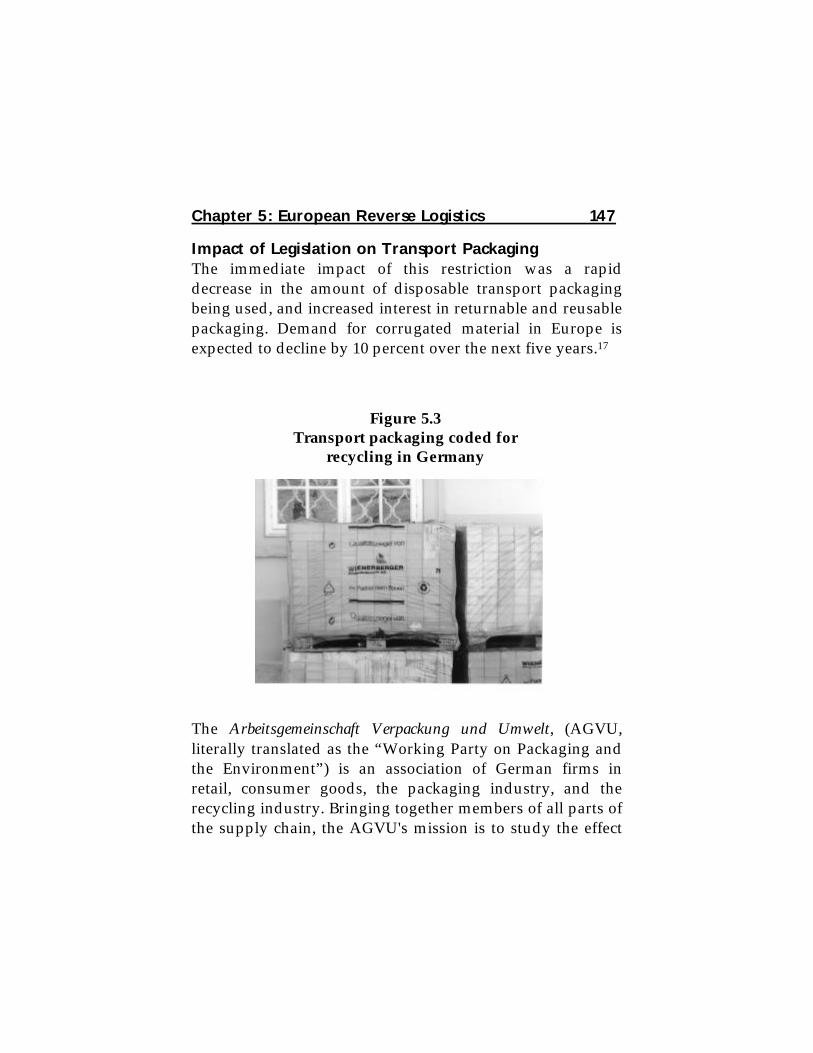
Chapter 5: European Reverse Logistics 147
Impact of Legislation on Transport PackagingThe immediate impact of this restriction was a rapiddecrease in the amount of disposable transport packagingbeing used, and increased interest in returnable and reusablepackaging. Demand for corrugated material in Europe isexpected to decline by 10 percent over the next five years.17
The Arbeitsgemeinschaft Verpackung und Umwelt, (AGVU,literally translated as the “Working Party on Packaging andthe Environment”) is an association of German firms inretail, consumer goods, the packaging industry, and therecycling industry. Bringing together members of all parts ofthe supply chain, the AGVU's mission is to study the effect
Figure 5.3Transport packaging coded for
recycling in Germany

148 Rogers and Tibben-Lembke
of Germany's closed-loop economy in the field of packaging,with a strong focus on the environment.
The AGVU commissioned the Gesellschaft fürVerpackungsmarktforschung (GVM), a market survey agencyfor the packaging industry, to collect information from thegovernment and other sources about Germany's use ofpackaging, in a wide variety of areas.
Although the members of the AGVU may not beenthusiastic about the Packaging Ordinance, the survey theycommissioned demonstrates that the law has had asignificant effect, as the following statistics demonstrate.
From 1991 to 1996, the annual usage of styrofoam transportpackaging fell 36 percent, from 31 thousand metric tons to 23metric tons. Over the same period, the use of pallets astransport packaging was reduced by 14.5 percent, from 385thousand metric tons to 329 thousand metric tons. Whenother wooden packaging types are included (crates, wirespools, etc.), total use of wooden transport packagingdecreased by 25.6 percent over the same period. Steeltransport packaging decreased by 11.3 percent, corrugatedtransport packaging usage decreased by 8.8 percent, totalpaper transport packaging decreased by 7.6 percent, andplastic transport packaging decreased by 7.4 percent.

Chapter 5: European Reverse Logistics 149
5.3 Product Take-Back
Throughout Europe, laws are increasingly forcingmanufacturers to take responsibility for proper disposal. Insome cases, the legislation mandates that manufacturersmust be willing to take back products from consumers afterthe products have reached the end of their lives.
German Take-Back LawsThe most restrictive take-back laws in place are found inEurope, and the first and broadest of the European take-backlaws are from Germany.
The new Basic Law of Waste Management was passed in1993. Its goal was to move Germany closer to achieving aclosed-loop economy, in which all production will be reusedor recycled, with a minimal amount of productioneventually being in the landfill. One of the key changes inthis law is its definition of waste. The original WasteManagement Act, passed in 1986, was only concerned withthe regulation of waste for disposal. In the new act, thegovernment is also concerned with waste for recovery. Thischange was needed in order to bring German law intoagreement with European laws.
The major change brought about by the new legislation isthat branches of industry, such as the electronic industry orthe auto industry, are obligated to accept responsibility fortheir own products. This is a major step in moving from athrow away mentality toward preventing, reducing,recovering, and recycling waste. The ambitious goal of the

150 Rogers and Tibben-Lembke
law is to collect all production waste and used products, andforward them for recovery or recycling.
The ordinance for the auto industry came into force on April1, 1998. Now, all automakers are required to take back oldcars free of charge for up to twelve years after their initialregistration. The ordinance for the electronics industry isnot as far along, and it currently exists only in draft form.
In the future, ordinances will also be enacted regarding theproper disposal of printed paper, electrical appliances,batteries, and construction rubble.18 Currently, standardizedtake-back laws are in development across the EuropeanUnion. Although these policies are not yet implemented,work is under way to draft common policies for all membercountries.
In different countries, the policies are different, but the majorareas of concern can be broken into:
• White goods: refrigerators, freezers, heatingequipment, water boilers, washing machines,dishwashers, and kitchen equipment
• Brown goods: sound equipment, televisions,photocopiers, and fax machines
• Computers• Automobiles• Batteries

Chapter 5: European Reverse Logistics 151
Electronics WasteAlthough studies have shown little environmental dangerfrom disposal of electronics products, the issue of howelectronic products should be disposed of, and how muchrecycling should be done of them is a widely discussedissue, especially in Europe. This is despite the fact thatanother study done by a British consulting firm reports thatelectronics products account for less than one percent of allsolid waste in Britain.19
The European Commission presented a set of proposed lawson collection and recycling of electrical and electronic wastesin April 1998.20 The final law will set targets for WasteElectrical and Electronics Equipment (WEEE), to increaserecycling, to reduce hazardous substances, and to make surewaste left over after recycling is properly disposed.21 Thestandards will cover a wide variety of electronic products,including cellular phones, games, toys, householdappliances, and office machinery.22
The European Union (EU) proposal would apply theproducer responsibility principle for the take-backproposals, meaning that manufacturers would beresponsible for financing the cost of the system. Thisproposal upset member countries, which wanted to haveflexibility in determining how these systems should befunded.23 Manufacturers, while unhappy about having topay for the recycling, would prefer uniform coststhroughout Europe. Varying pricing throughout Europecould lead to distortions in competition.24 Retailers areupset that the law requires them to accept goods from
152 Rogers and Tibben-Lembke
consumers making new purchases. Although manufacturerswould have the ultimate responsibility for recycling,retailers would have to collect, store, and forward theproducts.25
While the EU begins consideration of a European-widedirective on electronics waste, many European countries areconsidering their own policies on electronics waste. Forexample, Norway has announced plans to require producersand importers of electronic equipment (EE) to take backdiscarded EE products and waste materials. Half a dozentrade organizations agreed to collect 80 percent of Norway’sEE waste within five years. The agreement, which isscheduled to go into effect on July 1, 1999, covers discardedwhite goods, personal computers, telephones, cables,electronic and industrial electric goods. Following thepolluter pays principle, the system will be financed by arecycling charge levied on new electronic products. TheNetherlands and Switzerland are currently formulatingsimilar policies, and the EU is formulating a directive on EEwaste.26
In the Dutch electronics take-back system, the cost ofcollecting and recycling the products is to be paid from alevy placed on all new equipment sold. Although the feeswill help recycle the new equipment currently being sold, itwill not be adequate to cover the cost of all existingequipment—which will also need to be recycled. One issueto be resolved is to find out whether or not the governmentwill financially support the organization’s recycling of oldequipment. Another issue to be resolved is related to the

Chapter 5: European Reverse Logistics 153
fact that 80 percent of the electronics sold in the Netherlandscomes from one company. Other manufacturers resist theidea of paying for a system when the majority of the benefitswill go to one firm.27
A study by a U.K. electronics recycling program found thattelevision sets are currently too expensive to be recycled.The study concluded that “television sets are better stored inpeople’s attics and garages until the process and the marketfor recovered materials is fully developed.” Older setscontain more wood that is less valuable than the plastic usedin newer sets. Also, cathode ray technology is not advancedenough to make television sets very good recyclingcandidates.28
Appliance Take-BackIn the Netherlands, companies that import electricalappliances have been ordered to set up take-back systems tocollect and recycle used brown and white goods. Afterseven years of discussions on voluntary approaches failed toproduce a workable result, the environment ministerdecided to force the companies to set up and run such asystem. Under the system, companies will have to set up asystem to collect and recycle the products. The system willbe paid for by levies placed on products at the point-of-sale,which is not expected to significantly increase prices toconsumers.29
Auto RecyclingAccording to an EU study, every year 9 million vehicles arejunked in the EU, creating 9 million tons of waste. Draft

154 Rogers and Tibben-Lembke
legislation is under consideration; such legislation wouldmandate that by 2015, 90 percent of all vehicles must berecovered. Under the draft legislation, the last owner of avehicle would receive a certificate of destruction from anauthorized dismantler. If the vehicle has negative value, themanufacturer must reimburse the owner for this cost.30 Thislast condition is a particular source of unhappiness forautomakers.31
Automakers are also unhappy about targets the EU has setfor non-recyclable auto content. The EU law has set targetsfor reducing the proportion of car waste that is landfilled—to five percent by the year 2015. Automakers say this willactually hurt the environment, because it will force them touse more metal, which is more easily recyclable, but heavierthan other available materials.32
Unlike the automakers, the auto dismantlers of Europewelcome the law. They believe it will be an improvementover the system of voluntary agreements in place acrossEurope, which differ between countries.33
In the UK, a voluntary recycling system has been set up byrepresentatives from vehicle manufacturers and dismantlers,and the metals, plastics, and rubber industries. Aconsortium representing all theses industries will managethe process. Unlike the schemes in the Netherlands and inGermany, the reclamation is to be governed by marketforces. There will be no levy on new vehicles sold, and therewill not be cost-free take-backs of old vehicles, as inGermany. To increase recyclability, manufacturers have

Chapter 5: European Reverse Logistics 155
committed to make new vehicles 90 percent recyclable by2002. Unlike the EU scheme, the UK goals allow theinclusion of “energy recovery facilities,” in which materialslike plastic, rubber and fiber—which are difficult to recycle,and/or are combustible—can be burned.34
In the Netherlands, a national system of government-certified recycling centers has been established. At the timeof purchase, the buyer pays a fee of 250 guilders(approximately $60.00). Once the car has been dismantled,the dismantler sends an official notification to AutoRecycling Nederland, the organizing body, who thendisburses the fee. The ongoing operation of the system isalso financed by a national auto ownership tax. Once a car isregistered, the owner pays an annual fee until an officialdocument can be produced proving the vehicle has beensold or dismantled.35
Although a number of EU countries have created voluntarytake-back programs for automakers, Sweden was the first toannounce a mandatory take-back requirement. Theautomakers must establish a network of dismantlers,retailers, and wholesalers to ensure that cars returned forrecycling are properly dismantled. The manufacturers mustaccept the vehicles for recycling without charge, except inthe case of older vehicles, when a fee may be charged if thecost of recycling will exceed the value of the materialsreclaimed.36
156 Rogers and Tibben-Lembke
Battery CollectionThe EU is also considering a directive that would require 75percent recovery of all kinds of batteries, and phase out allmercury and cadmium batteries by 2008. Such a directive ishighly controversial, and could lead to significantly higherprices for toy, electronics, photographic, and tool and smallappliance makers, as there is no current non-cadmiumtechnology that will run small hand tools and some otherelectronics.37
In April 1997, the German Government adopted regulationsregarding the recovery and disposal of used batteries.Manufacturers will be required to take back, recycle, anddispose of returned pollutant-containing batteries free ofcharge. This includes car batteries. Six months after it goesinto effect, all other batteries will also be included. It isexpected that this legislation will create the impetus for aunified battery return system.38
In Germany, legislation has also been drafted which wouldoutlaw the sale of any appliances from which hazardousbatteries cannot be easily removed. 39
In Sweden, a 90 percent collection rate for used nickel-cadmium batteries is in place. Because the industry did notmeet this target in 1995, in 1997, the Swedish governmentput local officials in charge of collecting the batteries, whilethe industry must still pay for the collection.40

Chapter 5: European Reverse Logistics 157
5.4 European ConclusionsThroughout Europe, there is a strong trend toward producerproduct take-back. In some countries, some industries areunder voluntary take-back programs, in which thegovernment and industry have agreed to targets that theindustry will attempt to meet. If these targets are not met,these industries may find themselves under mandatorytargets.
For a reverse logistician, different challenges are present indifferent countries, in different industries. In someindustries, the government does the collecting, such as, inthe Swedish battery industry. In some cases, a network offacilities is organized and run by the industry, like theSwedish auto industry, for example. In other cases,companies are left to create their own centers.
The money to pay for these systems comes in as manyvarieties as the systems themselves. In some cases, theindustry must bear the cost, in some cases the user pays fordisposal at the time of the product’s purchase, and yet inother cases there are combinations of paymentarrangements.
Chapter 6: Industry Snapshots
In this chapter, reverse logistics practices in selectedindustries will be examined. The industries included in thischapter were selected because each contains elements thatcan be translated to firms in other business sectors.
6.1 Publishing Industry
The publishing industry is currently struggling with record-breaking returns of unsold copies, a steady decline in adulttrade sales, and a compressed shelf life for new titles.Reverse logistics is now more important in the publishingindustry than ever. At many firms, good reverse logisticspolicies and practices represent the difference betweenprofitability and seas of red ink.
Historical RootsThe book supply chain suffers from some problems that dateback to business practices developed 70 years ago. Duringthe Great Depression, booksellers could not afford to buy asmany books (to sell) as the publishers wanted. To enableretailers to stock more books, publishers began the practiceof permitting retailers to send back any books they wereunable to sell. Retailers were then able to carry many moretitles, thus greatly increasing the selection available to thebuying public. Since then, publisher-retailer relationshipshave followed this model.1

160 Rogers and Tibben-Lembke
This relationship requires the publisher to bear the risk forthe books that fail to sell. Publishers encourage retailers tobuy large quantities. Retailers know that any books theycannot sell can be returned for full credit, so there is zero orlittle cost to the retailer for ordering more copies than can besold. This arrangement is very costly for publishers. Eachreturn costs the publisher 25 cents in transportation, andmany books are destroyed that typically cost between $2 to$2.50 to print.
Over time, publishers have come to accept these costs as acost of doing business. Over the last few years, however,changes in the publishing industry have led to record returnrates and losses for publishers.
In addition to buying directly from publishers, retailers alsobuy books through wholesalers. Retailers generally prefer tobuy from the publisher, because these distributors generallycharge higher prices. Lately, retailers in most channels havestarted gaining more power. In the book supply chain, bookdistributors have policies in place that limit their return risk,while publishers take the brunt of the return risk. Somepublishers will now only sell directly to retailers making aminimum level of annual purchases. Smaller retailers mustbuy from a wholesaler. Because wholesalers often do notcarry a publisher’s entire catalog, this is a serious concern forsmaller retailers.2
Return Problem SymptomsSales of hardcover and paperback adult trade books fell by5.3 percent between 1995 and 1996, to 459 million copies.
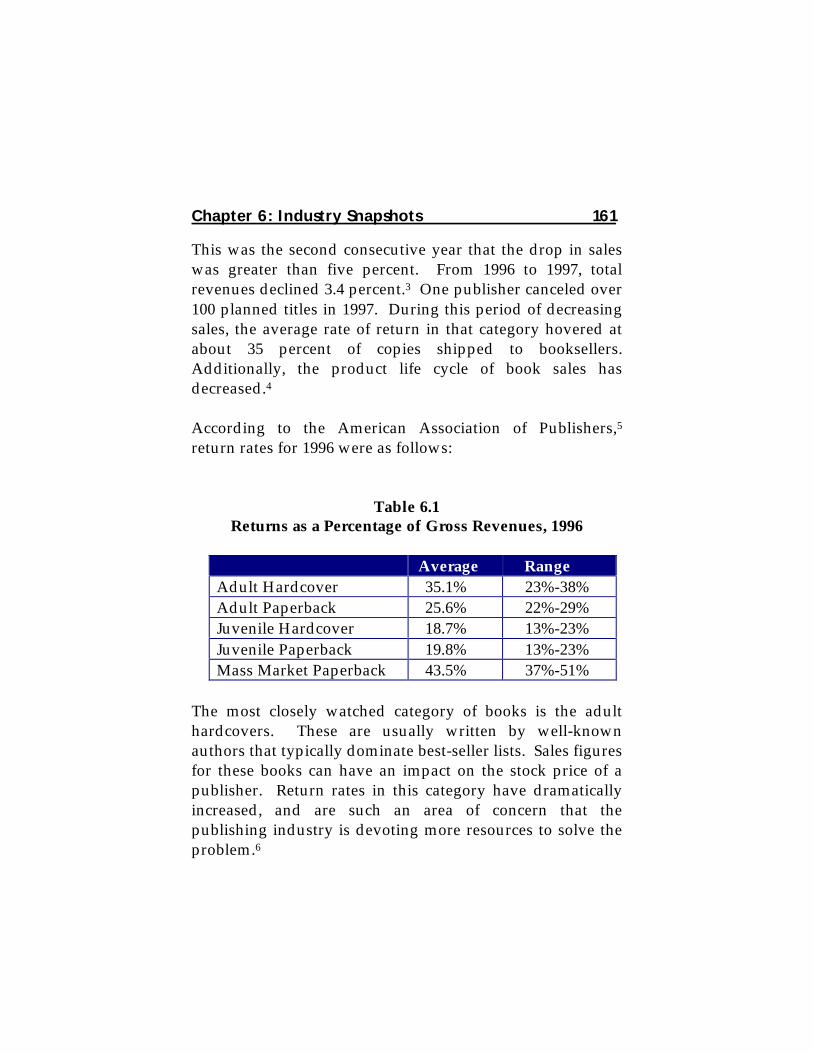
Chapter 6: Industry Snapshots 161
This was the second consecutive year that the drop in saleswas greater than five percent. From 1996 to 1997, totalrevenues declined 3.4 percent.3 One publisher canceled over100 planned titles in 1997. During this period of decreasingsales, the average rate of return in that category hovered atabout 35 percent of copies shipped to booksellers.Additionally, the product life cycle of book sales hasdecreased.4
According to the American Association of Publishers,5return rates for 1996 were as follows:
Table 6.1Returns as a Percentage of Gross Revenues, 1996
Average RangeAdult Hardcover 35.1% 23%-38%Adult Paperback 25.6% 22%-29%Juvenile Hardcover 18.7% 13%-23%Juvenile Paperback 19.8% 13%-23%Mass Market Paperback 43.5% 37%-51%
The most closely watched category of books is the adulthardcovers. These are usually written by well-knownauthors that typically dominate best-seller lists. Sales figuresfor these books can have an impact on the stock price of apublisher. Return rates in this category have dramaticallyincreased, and are such an area of concern that thepublishing industry is devoting more resources to solve theproblem.6

162 Rogers and Tibben-Lembke
Root CausesSeveral causes exist for the return problems in thepublishing industry:
• Rapidly growing retail square footage requiresmore books
• Chains’ size has led to larger print runs• Chains generally have higher return rates• Competition for likely best-sellers has increased
advances given to authors, requiring bigger runsto recoup initial investments
• Profusion of books in print means morecompetition
• Shorter shelf lives• Flat total sales growth for books overall• Computer models exert downward pressure on
shelf life• “Jam the channel”• Inventory policy changes—JIT• Unclear channel position—integration
The largest single factor has been the growth of the largechain stores. More than 80 superstores opened during theperiod 1990-1996, with the top four chains (Crown BookCorp., Books-A-Million Inc., Barnes & Noble and Border’sGroup, Inc.) opening more than 190 stores in 1996. In 1996alone, there was a 20 percent increase in the amount of retailbookselling space.7 The amount of space is expected to growby another 14 million square feet over the next few years.8

Chapter 6: Industry Snapshots 163
Retail floor space grew exponentially as chains such asBarnes & Noble and Borders placed large footprint booksuperstores all over the United States. Warehouse clubs,such as Sam’s and Price Costco, also devoted large spaces toheavily discounted books. At the same time that retail spacewas expanding, consumer spending on books was slowlygrowing. While there is now much more retail spacedevoted to selling books, there is not that much moredemand by consumers for books.
At the same time that retail floor space was growing in thebook industry, the customer base for books and many othermanufactured items was consolidating. Giant retailers, suchas Wal-Mart and Kmart, have become a larger percentage ofa publisher’s business. As superstores add more space, theyare grabbing a larger and larger piece of the book market,and these gains are coming at the expense of independentbookstores. Figure 6.1 shows the independent bookstores’portion of the market. As late as 1991, independentbookstores held the largest share of the market, with morethan 32 percent, only to decline to less than 20 percent by1996.9 The number of books sold by discount stores rose bymore than 21 percent in 1996.10
The growth of superstores has given bookstores a morepowerful position in negotiations with publishers. In orderto secure a prominent display in the superstores, publishersmust be able to supply large quantities of books. However,after two weeks in a prominent display, a book may berelegated to a shelf in the back of the store. The largedisplay may include a stack of 100 or more books. When the

164 Rogers and Tibben-Lembke
large display is no longer needed, most of those excesscopies are sent back to the publisher for credit.11
The result is that the increase in sales at superstores is amixed blessing for publishers. Independent bookstores sellmore than 80 percent of the books they order, whilesuperstores sell less than 70 percent, and discount stores sellabout 60 percent. Because independents tend to order asmaller variety, less of each title, and push the books theyhave in inventory, their return rates are generally lower thanthose of the superstores. Additionally, independentbooksellers have less power in the channel. The growthaway from independents to the powerful superstores hasexacerbated the return problem in the book industry.
If a store has a large inventory of slow-selling books, it willoften want to mark them down to be able to sell them, rather
Figure 6.1Change in Independent Booksellers’ Market Share
0%
5%
10%15%
20%
25%30%
35%
Independent
Bookstores'
Market
Share
1991 1992 1993 1994 1995 1996

Chapter 6: Industry Snapshots 165
than return them. However, publishers generally believethat marking books down diminishes the value of theproduct in the customers’ eyes. In the publishing industry,it is believed that if the customers expect that all books willeventually be marked down, they will postpone purchasesof new profitable books.
Another problem that publishers have is the explosion oftitles in the publishing industry. In 1947, when Books in Printbegan collecting data, 357 publishers printed 85,000 titles.By 1997, there were more than 1.3 million books in print,published by more than 49,000 publishing houses in theU.S.12 Yet, the number of customers that read books has notgrown at the same rate. In 1997, sales slid 3.4 percent.13 Theresult is that book superstores often dictate reverse logisticspolicies to the publishers.
Making the problem more financially potent, publishers aregambling on high profile authors with huge advancepayments. To compete for these high-profile authors,advances paid are running into the millions of dollars. Tojustify such high advances, publishers plan initial print runsat least large enough to cover the author’s advance. Thisleads to more copies of the book to distribute, which adds tothe problems described above. Unfortunately, many of theauthors do not return what the publisher expected.
The Internet and On-Demand PublishingAt one point, some people believed that bookstores wouldeventually become obsolete. The vision existed thatpublishers would sell books directly to people who would

166 Rogers and Tibben-Lembke
download books from the Internet. Interestingly, one of theareas where the Internet has had the largest impact oncommerce is in the publishing industry. Amazon.com hasshown through its success that there are many people whowill use the newest communication form, the Internet, toorder books, one of the oldest forms of communication.
In the future, the Internet's greatest impact may be on salesof out-of-print books. Because of traditional printingtechnology, publishers must print a large number of copiesof a book at one time to keep costs down. If it is unlikelythat future sales will guarantee at least this many sales, thepublisher will not print another run of the title, and the bookwill become obsolete.
Technology is making it possible to print very small runs assmall as one copy for a reasonably low cost. The cost is stillmuch higher than the per-copy cost of printing severalthousand, but low enough to still be affordable.
Using this technology, a customer can go to a website andrequest a copy of an out-of-print book. The book will beprinted and shipped to the customer the next day. IngramBooks, the nation's largest book wholesaler, has a LightningPrint division devoted to this very business. Their website,www.ingram.com/Company_Info/lpihtml, offered 125 titles inJuly of 1998. They have plans to offer 10,000 titles by the endof 1998. The cost (to the publishers) of making a titleavailable is relatively low, as the company is lettingpublishers set up titles risk-free at no up-front cost. The

Chapter 6: Industry Snapshots 167
publisher will collect royalties on books that would havenever been sold otherwise.
6.2 Computer / Electronic Industry
One executive said to the research team, “We're in anindustry with 60-day product life cycles and 90-daywarranties. Of course customers are going to bring productsback.” The product life cycle of a computer is extremelyshort when compared to other consumer durable goods,such as automobiles or large appliances. In a businesswhere returns can lower profits by as much as 25 percent,reverse logistics is a serious business.
According to the Gartner Group, the used PC business wasbetween $2-3 billion in 1996. Approximately 25 millionobsolete PCs became ready for remanufacture or disposalthis past year. Given a population of approximately 260million in the United States, that is just under one obsoletecomputer per person. A study completed by CarnegieMellon University, estimates that approximately 325 millionpersonal computers will have become obsolete in the UnitedStates in the 20-year period between 1985 and 2005. Out ofthat number, it is estimated that 55 million will be placed inlandfills and 143 million will be recycled.14 This largenumber of obsolete computers means that the short life cyclein the electronics industry is a serious problem, and thatthere are many opportunities to reuse and create some valueout of a nearly omnipresent asset.

168 Rogers and Tibben-Lembke
For many retailers that sell computers and electronics, thepercentage of returns is high. Manufacturers have begun toput caps on the amount of product they are willing to takeback. These caps are part of a continuous struggle in thechannel. Because computers are a complex product, returnpercentages are high. Consumers do not understand how tooperate them and are quick to return the product when itmay not be defective. Some categories, like CD-ROM drives,have had return rates of 25 to 40 percent in the past becausethey were complicated to install and difficult to operate.
Figure 6.2Problems with Computer Lifecycles
From the Wall Street Journal -Permission, Cartoon Features Syndicate

Chapter 6: Industry Snapshots 169
Printer returns, on the other hand, have moved down tobetween four and eight percent because they have becomean appliance. The consumer can simply unpack the printer,plug it in and start using it.
For one computer manufacturer, failure to manage thereturn rates well severely damaged its profitability, andeventually, its ability to go public. This retail channel firmallowed its return rates to get out of line compared with therest of the industry. Return rates for PC firms included inthis research are generally below 10 percent. However, thisparticular company allowed its return rates to exceed 17percent.
Many computer manufacturers have put caps on theirreturns, and allow only a certain percentage of sales to bereturned. These policies have been known to fail when apowerful retailer tests them and exceeds the cap. It isdifficult to manage powerful retailers such as Wal-Mart orTarget, when manufacturers are dependent on thoseretailers for a growing percentage of their sales. Some firmsstarted out with an aggressive cap percentage have sinceeased the percentage to accommodate their retail customers.
One way to minimize the return chain is by building toorder. This allows manufacturers to postpone finaltransformation of the product until the end of the channel,and configure the exact computer that the customer wants.With postponement, the channel holds very little inventory.This is in sharp contrast to the rest of the industry, which

170 Rogers and Tibben-Lembke
typically will have 30-60 days of inventory pre-sold into thechannel.
The manufacturers/retailers that sell directly to thecustomer and build to order have significantly lower returnrates than the rest of the industry. These firms have returnrates around five percent, about half of what the rest of theindustry experiences. One executive interviewed said, “wesend out a million computers. Pretty soon, most of themcome back.” The build-to-order model, combined withdirect sales, eliminates this problem.
The direct manufacturers/retailers interviewed for thisresearch find that the bulk of their returns is due to qualityproblems. Most of the returns for manufacturers that sellcomputers through the traditional reseller’s channel aremarketing returns, where the computers did not sell andcame through the channel to the manufacturer. Directmanufacturers/retailers have a clear advantage overtraditional competitors because of the minimization ofreturns. Additionally, direct sellers believe that most of theirusers are higher up the technology curve and therefore areless likely to ship back the non-defective defective machinesthat stream back to all computer manufacturers. Onetraditional firm interviewed indicated that nearly half of itsbad quality returns were actually working models.However, each firm’s business model dictates how reverselogistics works.
One computer manufacturer that at the time of this writingwas just beginning to move to a build-to-order

Chapter 6: Industry Snapshots 171
manufacturing model, flooded the market with inexpensivecomputers. Soon after it jammed the channel with thesemachines, it changed the rules on returns and priceprotection. The company decided to not allow any open orclosed box returns, and to limit defective returns to onepercent of resellers purchases from the previous quarter.Non-defective defectives were to be returned to thecustomer for full price. An executive with one of thismanufacturer's competitors talked about this developmentwith the research team. “What an interesting concept. Firstyou flood the channel with excess inventory, then youannounce that returns are prohibited.” This policy is clearlya tentative step in the direction of making return policiesmore conservative, and places more responsibilitydownstream in the supply chain. It remains to be seen if thisand other similar initiatives will be successful.
Computer manufacturers have developed rebate programsto incent retailers to reduce returns. For example, onemanufacturer gives retailers a one percent rebate for returnrates between four and seven percent, and up to two and ahalf percent if returns are less than one percent for thatparticular retailer.
Some manufacturers have contracted with remanufacturingspecialists to develop solutions to this problem. Thesecompanies will work with manufacturers, evaluate the rootcauses of returns, excess, and obsolete machines, anddevelop methods to control costs and return rates. Thesespecialist firms test, recondition, repair, repack, and thenresell the machines. One firm, for example, includes a

172 Rogers and Tibben-Lembke
special manufacturer’s warranty. At the same time, the thirdparty can act as the service center for the manufacturer.Some manufacturers have also hired third parties to performwarranty repair and other service work for retailers that donot have their own service capabilities. These programshave led to lower returns.
Businesses have begun to learn that the largest portion oftheir profits is derived from the early stages of the productlife cycle. This knowledge makes proper productdisposition even more important. One electronics companyinterviewed for this research said that it made 140 percent ofits profits during the first four months of the product's life.This statement means that in the latter portion of the productlife cycle, where sales begin to dwindle, profits are actuallynegative for this particular electronics firm. This situation isnot unusual. In the electronics industry, as in many otherindustries, product life cycle continues to contract. Retailersrealize that they have to get a product through the supplychain quickly, get that product on their shelves, and thenmove it off the floor before it becomes unprofitable. Thebackward portion of the supply chain then becomes apriority rather than an afterthought.
Toner CartridgesToner cartridges for laser printers have become a major areaof remanufacturing. Initially, toner cartridges were difficultto recycle, but manufacturers have since learned how tomake them easier to disassemble and refurbish.

Chapter 6: Industry Snapshots 173
One of the first well-known programs to be billed as reverselogistics was Cannon's Clean Earth Campaign. With eachnew cartridge sold, customers received a mailing label withwhich to send their old cartridge to Cannon, at no cost. Theprogram was very successful, and Cannon received manycartridges back for remanufacturing.
A new toner cartridge can easily sell for approximately $100.A remanufactured cartridge will sell for 25 percent less. Thecost to remanufacture a cartridge is very low, makingremanufacturing of toner cartridges a very profitablebusiness.
Unfortunately for manufacturers, cartridges are so easy toremanufacture that virtually anyone can start a business intheir garage remanufacturing cartridges. Companies on theInternet are advertising kits that contain the necessary toolsand materials needed to start a home-based cartridgemanufacturing business.
The toner cartridge remanufacturing business has grown toinclude 12,000 remanufacturers, employing 42,000 workers,selling nearly $1 billion annually.15
Given the profits involved, it is not surprising that manycompanies now advertise that they will pay $10 or more forused toner cartridges. The original cartridge manufacturersfind themselves competing against these remanufacturers toget their own cartridges back. One toner cartridgemanufacturer perceived this to be such a large problem thatit introduced a plan to prevent its customers from selling

174 Rogers and Tibben-Lembke
their used cartridges to other companies. Instead ofreceiving a rebate for sending the cartridge back to thecompany, customers receive a “prebate” at the time ofpurchase. In return, the customer promises that thecartridge would not be reused, refilled, or remanufactured.Environmentalists and the remanufacturing industry quicklyrose up in arms against the proposal.16
Software IndustryIn the software industry, distributors are attempting to cutdown retailers’ returns by implementing just-in-timedelivery. However, retailers generally overestimate demandbecause there is not much incentive for them to forecastcarefully. Software manufacturers want the product on theretailer shelves, and often agree to stuff the channel. Thecost of a box of software is low compared to the price. Inone extreme example, a software manufacturer contractedwith a third party to destroy 50 million copies of onesoftware product. While this particular manufacturer wouldhave preferred to not produce an excess of 50 million, thecompany believes that it is better to guess higher than lower.Because of these kinds of practices, return rates in thesoftware industry recently hovered around 20 percent.Additionally, releasing more software titles forces returns,because the product life cycles of those titles are contracting.
Because their risk is low, some retailers will accept softwarepurchased elsewhere. Other retailers, such as Sears, aretrying to reduce returns and improve inventory turnover byreexamining channel relationships. Some of these retailershave begun setting up 30-day return policies.
Chapter 6: Industry Snapshots 175
6.3 Automotive Industry
The auto industry is one of the largest industries in theworld, dealing with the most expensive consumer goods.Therefore, it is not surprising that reverse logistics issueshave long been a source of consideration. In the autoindustry, there are three primary areas in which reverselogistics plays a significant role:
• Salvage of parts and materials from end-of-lifevehicles
• Remanufacturing of used parts• Stock-balancing returns of new parts from dealers
This section concentrates only on the North American autoindustry. The European auto industry has been dealt within some depth in Chapter 5. The auto industry also makesextensive use of returnable containers. Returnablecontainers in general have been discussed in Chapter 4.
Auto DisassemblyWhen a vehicle reaches the end of its life, it eventually endsup at an auto salvage yard or auto dismantler. There, anassessment is made of the components of the vehicle. Anyparts or components that are in working order that can besold as is, are removed and sold. Other components, such asengines, alternators, starters, and transmissions may be infairly good condition overall, but need some refurbishing orremanufacturing before they can be sold to a customer.Once all reusable parts have been removed from the vehicle,its materials are reclaimed through crushing or shredding.

176 Rogers and Tibben-Lembke
Shredded metals will generally be reclaimed, but theremaining material, known as fluff, cannot be recycled.
Every year, automotive recyclers handle more than 10million vehicles. Their efforts supply more than 37 percentof the nation’s ferrous scrap for the scrap-processingindustry.17 However, roughly 25 percent (by weight) of thematerial in a car is not recycled in the United States.
Approximately 35 percent of the nonmetal material left aftershredding a car is plastic. To reduce the amount oflandfilled plastic, firms are trying a number of alternatives.One part of the problem is that cars are made of so manydifferent types of plastics. Identifying each type of plastic isdifficult. Automakers are trying to reduce the number oftypes used, and to label the parts for easier separation afterdisassembly. Ford, for example, reduced the number ofgrades of plastic that it specifies from 150 to 20.18
To increase the recyclability of cars, the big three automakersin the U.S. have joined together to form the VehicleRecycling Development Center (VRCD). At the VRDC, theyare trying to learn how to build vehicles to be disassembledmore easily. They are investigating one of the newest trendsin engineering, Design For Disassembly (DFD).
Unlike other environmental initiatives for manufacturing,DFD offers the possibility of many unintended positiveeffects. Disassembly of a product is made easier by reducingthe number of parts, rationalizing the materials, and snap-fitting components instead of chemical bonds or screws.

Chapter 6: Industry Snapshots 177
These objectives fit in well with other current manufacturingstrategies: global sourcing, design for manufacture,concurrent engineering, and total quality.19
In one example of DFD from the computer industry,Siemens Nixdorf's PC41 introduced in 1993 contains 29parts, versus 87 in its 1987 predecessor. The new machinecan be assembled in 7 minutes and disassembled in 4. Theold machine took 33 minutes to assemble and 18 todisassemble.20
Although there are many automobile salvage operators inthe U.S., automotive material suppliers are in generalagreement that the largest obstacle to increased automotiverecycling is the lack of a nationwide network ofsophisticated automotive dismantlers.21
Use of Recycled MaterialsTo close the recycling loop, automakers would like to be ableto use recycled products in their vehicles. However, partsmade out of recycled materials are not yet widely available.When they are available, they may cost more than partsmade of virgin materials. However, Ford discovered in onecase, that once all the costs of using a particular part areconsidered, a 100 percent recycled part was actually cheaperto use. Unfortunately, this is not the case in every instance.Because automakers believe that consumers will not payextra for a vehicle made with recycled parts, additionalusage of recycled materials will depend on the rate at whichtheir costs can be brought down.22

178 Rogers and Tibben-Lembke
Automakers are making progress in this area, however.Chrysler, for example, recently announced theirconsideration of a program to take material from pop bottlesand use it to make large panels for the body of a car. The carwill be very lightweight, and at this point, able to meet allU.S. safety requirements, except side impact collisionstandards. However, it would initially be targeted for areasof growth in low-priced vehicles, like China and India.23
RemanufacturingThe auto industry may be the industry with the longesthistory of making use of old products. The remanufacturingof auto parts was boosted by the shortage of new partsduring World War II, but the recycling of auto parts hasbeen taking place in the industry for over 70 years.
According to the Auto Parts Remanufacturers Association(APRA), the remanufactured auto parts market is estimatedat $34 billion, annually. The APRA also estimates that thereare 12,000 remanufacturing firms involved in the auto partsindustry. Although there are many firms involved, there arealso many large firms in the industry. One companyremanufactures more than 4 million alternators, starters, andwater pumps every year.24 In total, 90 to 95 percent of allstarters and alternators sold for replacement areremanufactured.
Automakers want to maintain a closed-loop system withtheir parts. When a vehicle needs a new transmission, it istheir hope that the consumer will bring the car to a dealer,who will replace the old transmission with a
Chapter 6: Industry Snapshots 179
remanufactured one. The dealer will send the oldtransmission (now called a transmission “core”) to theautomaker for remanufacturing. In this way, the automakerwill maintain a stable supply of transmission cores.
Unfortunately for the automakers, there is a lot of leakagefrom this closed system. To prevent this, the dealers mustpay a deposit in the form of a core charge when they receivea remanufactured part. When the automaker receives thetransmission core from the dealer, the dealer's core charge isrefunded.
Despite these efforts, many parts leave the system. Partly,this leakage occurs because many car owners take theirvehicles to auto repair shops outside the automaker'ssystem. The core will then go to the repair shop's supplier.
Another source of leakage can be the dealers themselves.Despite the fact that the dealer may have paid a core chargefor a part, they may still be willing to sell it to anotherremanufacturer. Many of the third party remanufacturercompanies make regular milk runs, during which they stopat dealers and other repair shops and offer to pay cash forany cores. Many dealers will look at a pile of greasy coressitting in the corner, and decide they would rather take thecash than deal with the hassle of sending the cores back tothe automaker.
All automakers interviewed recognize that this leakage isproblematic, and are working on ways to improve theirreverse logistics processes to eliminate this problem. For

180 Rogers and Tibben-Lembke
example, Ford has begun using a single carrier to handle allof its dealer core returns. Ford dealers can call one 800number for all questions and issues related to core returns.25
The auto parts remanufacturing business can be difficult.All of the typical problems of reverse logistics are present:varying flows of different products, and many productswithout packaging. This is not to mention the fact that theproducts themselves are often coated with grease. However,some remanufacturers have begun using bar coding systemsto track incoming products and the progress of theseproducts as they move through their reverse logistics flow.26
Dealers’ Parts ReturnsIn addition to collecting cores from dealers, automakers alsomust collect new, unused products and defective productsfrom dealers.
Although the automakers wish that they could determinethe amount and type of parts the dealers will maintain intheir inventories, and how many, they cannot. Dealers, asindependent businesses, make their own determinations asto which parts they stock. Each year, new car models areintroduced requiring new parts. At the same time, fewerolder cars are on the road, meaning parts for these vehiclesno longer need to be kept in the dealers’ inventories.Because dealers have a finite amount of space in which tostore parts, they need to remove the older parts from theirinventories to make room for the newer parts.

Chapter 6: Industry Snapshots 181
Many auto dealers are family-based businesses with limitedsupplies of capital to invest in inventories. They often haveless than state-of-the-art inventory management capabilities.It is in the best interest of the parts supplier to clean out theirinventories, reduce credit-line constraints, and improvecustomer satisfaction.
The research team interviewed automakers about partsreturns. To help the dealers maintain an inventory ofcurrent parts, automakers allow dealers to return a limitedamount of parts for full credit every year. The exact amountis different for each manufacturer, but the calculation is thesame: the value of the returned parts must be no more thansome percent (typically four to six percent) of the value ofthe new parts the dealer has purchased during the year. Todeter dealers from abusing the system, some automakersallow dealers to receive a check for some percentage of theirunused return allowance.
The truck that delivers new parts to the dealership typicallypicks up the returned part, and the part will go back to theparts distribution center. What happens when the partsarrive at the parts distribution center depends on theautomaker. At some facilities, the parts are inspected tomake sure that the right part is in the box, and the part is putback on the shelf. At other facilities, the parts are put intonew packaging so that the dealer who next receives the partwill be unable to tell that the part has been returned. At onedistribution center, a separate 100,000 square foot facility isused for this purpose. At other distribution centers, separaterepackaging contractors are used.

182 Rogers and Tibben-Lembke
At one automobile manufacturer, dealer resistance toreceiving returned parts is extremely high. If a dealerreceives a part and suspects that it has previously beenreturned, the dealer will immediately send the part back.Therefore, rather than even try to repackage the parts, allreturned parts under a rather high dollar amount aredestroyed and sent to the landfill.
6.4 Retail Industry
The retail industry, under great competitive pressure, hasused return policies as a competitive weapon. The greaterthe pressure, the more innovative the solutions. Within theretail industry, it appears that necessity, indeed, is themother of invention.
Grocery retailers were the first to begin to focus seriousattention on the problem of returns and to develop reverselogistics innovations. Their profit margins are so slim thatgood return management is critical. Grocery retailers firstdeveloped innovations such as reclamation centers.Reclamation centers, in turn, led to the establishment ofcentralized return centers. As covered in detail in Chapter 2,centralizing returns has led to significant benefits for mostfirms that have implemented them.
Over the last several years, retailers have consolidated. Nowmore than ever, large retail chains are the rule. These largeretailers have more power in the supply chain than retailersdid a few years ago. In general, the large retailers are much

Chapter 6: Industry Snapshots 183
more powerful than the manufacturers. Few manufacturerscan dictate policy to large retailers such as Wal-Mart orKmart. If a manufacturer will not accept returns, it isunlikely that the large retailer will accept those terms easily.In some exceptional cases, retailers will make allowances fora manufacturer's products that they believe are notreplaceable with similar products.
Returns reduce the profitability of retailers marginally morethan manufacturers. Returns reduce the profitability ofretailers by 4.3 percent. The average amount that returnsreduce the profitability among manufacturers is slightly less,at 3.80 percent.
Survey respondents were asked how they dispositionreturns. On average, retailers use a centralized returnfacility to handle returns much more frequently thanmanufacturers. Retailers are also found to be more likely tosell returns to a broker or similar entity. They were lesslikely to remanufacture or refurbish than manufacturers—which would seem logical given that manufacturers arebetter at manufacturing than retailers. Manufacturers aresignificantly more likely to recycle or landfill returnedmaterial than retailers. It appears that retailers are furtheradvanced than manufacturers when it comes to assetrecovery programs. For other disposition options, such asresold as is, repackaging, or donation; retailers’ responseswere quite similar to manufacturers.
In Table 6.1, a comparison of disposition options betweenretailers and manufacturers is presented.

184 Rogers and Tibben-Lembke
Table 6.2Comparison of Disposition Options between Retailers and
Manufacturers
Disposition Retailers Mfgs.Sent to central processing facility 29.2% 17.7%Resold as is 21.4% 23.5%Repackaged and sold as new 20.5% 20.0%Remanufactured/Refurbished 19.9% 26.7%Sold to broker 16.8% 10.1%Sold at outlet store 14.5% 12.8%Recycled 14.1% 22.3%Land Fill 13.6% 23.8%Donated 10.6% 11.8%
TechnologyIt is clear both from the interviews and the surveyinstrument that retailers have made larger investments intechnology to improve their reverse logistics systems. Infact, manufacturers lag behind retailers in almost everytechnology category. This difference between manufacturersand retailers does not appear to exist in all facets of anoperation.
Nearly twice as many retailers as manufacturers included inthe research implemented automated material handlingequipment. Retailers are also more likely to use bar codes,computerized return tracking, computerized returns entry,electronic data interchange (EDI), and radio frequency (RF)

Chapter 6: Industry Snapshots 185
technology to enhance their reverse logistics management.A comparison of reverse logistics technology adoption ispresented below in Table 6.2.
Table 6.3Comparison of Technologies Utilized to Assist Reverse
Logistics Processing By Retail and ManufacturingSegments
Technology Retailers Mfgs.Automated material handlingequipment
31.1% 16.1%
Bar codes 63.3% 48.7%Computerized return tracking 60.0% 40.2%Computerized returns entry at mostdownstream point in supply chain
32.2% 19.1%
Electronic data interchange (EDI) 31.1% 29.2%Radio frequency (RF) 36.7% 24.6%
6.5 ConclusionsReverse logistics practices vary based on industry andchannel position. Industries where returns are a largerportion of operational cost tend to have better reverselogistics systems and processes in place. In the bookindustry, where great change in the industry structure hasoccurred in the last few years, returns are a majordeterminant of profitability. In the computer industrywhere life cycles are nearly as short as grocery life cycles, the

186 Rogers and Tibben-Lembke
speedy handling and disposition of returns is nowrecognized as a critical strategic variable. Successfulretailers understand that managing reverse logisticseffectively will have a positive impact on their bottom line.Industries that have not had to spend much time and energyaddressing return issues are now trying to make majorimprovements. Now, more than ever, reverse logistics isseen as being important.

Chapter 7: Future Trends and Conclusions
Recognition of Reverse LogisticsIt is clear that in the future, more firms will lavishconsiderable attention on reverse logistics. Many firms haveonly become aware of the importance of reverse logisticsrelatively recently, and have yet to realize the strategicimportance that reverse logistics can play.
To reduce the cost of reverse logistics, in the future, firmswill need to focus on improving several aspects of theirreverse logistics flows:
• Improved gatekeeping technology• Partial returns credit• Earlier disposition decisions• Faster processing / shorter cycle times• Better data management
One of the easiest ways to reduce the cost of a reverselogistics flow is to reduce the volume of products it is askedto carry. There are two aspects to this. First, products thatdo not belong in the flow should be prevented fromentering. Secondly, once products have entered the flow,they should be dispositioned as quickly as possible.
7.1 Reducing the Reverse Logistics Flow
To reduce the flow of products into the reverse logisticssystem, there are a number of promising new technologies

188 Rogers and Tibben-Lembke
that can be used to make sure that every product that entersthe reverse logistics flow is one that should be in the system.
Product Life Cycle ManagementGood reverse logistics management can be considered partof a larger concept called product life cycle management. Inthe future, it is likely that leading edge companies will beginto emphasize total product life cycle management. Theproduct life cycle management concept means that the firmprovides the appropriate logistics and marketing supportbased, at least in part, on where the product is in its lifecycle.
The core of the product life cycle concept is that all productshave a finite life and move through various stages.Typically, a product life cycle curve is divided into fourdistinct phases during its life as a live product. Those fourphases are introduction, growth, maturity, and decline.Product volume increases through the introductory andgrowth phases. As a product moves through the life cycle tomaturity, sales level off and begin to decrease. In thedeclining stage, sales drop and profits derived from theproduct diminish.
Products in various stages of the life cycle require differenttypes of management and support. Logistics managementneeded in the introduction phase is much different than thesupport requirements when the product is at maturity.Additionally, the supply chain management necessary at theend of a product’s life varies from other stages.

Chapter 7: Future Trends 189
The product life cycle is not uniform across products andindustries. It is a theoretical device that can be useful.However, it is difficult to identify where a real product is inthe life cycle once it moves past the introductory and growthstages. The firm has to look for demand turning points.These can only be seen if the firm clearly understands pasthistory and the marketplace.
Unfortunately, the focus for the marketing and logisticsorganizations at many firms is only on the early and middleportions of the product life cycle. The mission of thelogistics and marketing organizations is much clearer earlyin the life cycle. Product roll-out, volume build, and thesupport associated with these portions of the life cycle, aretheir primary concerns. Sometimes, it is difficult for acompany to admit that a product is at the end of its life.Decisions are postponed because the organization believesthat a little more life can be breathed into a product. Thesales and marketing organizations may attempt to conceal asales decline. They may believe that a decline in the sales ofa product means that they are not performing their jobproperly.
As the product approaches the end of its life, the cost ofholding inventory increases. Inventory carrying costsconsist of expenses such as the cost of money, insurance,taxes, shrinkage, warehousing, and obsolescence. As theproduct moves through the life cycle and reaches the end ofits selling life, obsolescence costs increase from very low to100 percent. Warehousing costs associated with the productwill also continue to accumulate. This means that a firm

190 Rogers and Tibben-Lembke
cannot correctly use only one inventory carrying cost acrossthe total life of the product. In Figure 7.1, an inventorycarrying cost scenario is presented.
It is as important to manage products well at the end of theirlife as it is in the beginning. As can be seen from the figure,it may be more important to manage inventory well at theend of a product’s life than at the beginning.
At the end of a product’s life, it is likely that it will enter thereverse logistics flow. Good reverse logistics is a criticalpiece of product life cycle management. As the life cyclemoves past volume sales, the firm needs to begin to clear thechannel through the utilization of good reverse logisticspractices. Plans must be made for the end of product life, aswell as thinking about the other stages of the life cycle. If a
Time
100%
50%
0%
ProductIntroductionAnd Volume
Sales
ProductObsolescence
BargainBasementDiscounts
ProductSalvaged
Figure 7.1Inventory-Driven Carrying Costs

Chapter 7: Future Trends 191
firm can plan many of the management elements around theend of a product’s life, instead of merely reacting late toobsolete inventories, the total profit derived from a productwill be greater.
Information SystemsIn order to handle reverse logistics better, firms will need toimprove their reverse logistics information systems. Asexplained in Chapter 2, the reverse logistics environment isdifferent enough from the forward channel that informationsystems developed for the forward channel do not generallywork well for reverse logistics.
Most return processes are paper-intensive. Automation ofthose processes is difficult because reverse logisticsprocesses have so many exceptions. Reverse logistics istypically a boundary-spanning process between firms orbusiness units of the same company. Developing systemsthat have to work across boundaries add additionalcomplexity to the problem. To work well, a reverse logisticsinformation system has to be flexible.
Information systems should include detailed informationprograms about important reverse logistics measurements,such as store compliance, return rates, recovery rates, andreturns inventory turnover. Some of the systems forcontrolling returns will obviously require significantlyexpanded and improved information systems.
Even if such systems do not materialize, firms will developbetter reverse logistics information systems in the future.
192 Rogers and Tibben-Lembke
For many companies, current information systems do notallow them to monitor the status of their returns.
Additionally, useful tools such as radio frequency (RF) arehelpful. New innovations such as two-dimensional barcodes and radio frequency identification license plates(RFID) may soon be commonplace.
Gatekeeping TechnologyIn order to improve gatekeeping, front-line employees needgood information about which products to allow into thereverse logistics flow. Accomplishing this task is not easy. Itis made more difficult because many front-line employeeswho are making gatekeeping decisions are ofteninexperienced exmployees working at or near minimumwage. Retailers are loath to incur significant costs trainingthese employees, because employee turnover tends to behigh. More training would certainly improve gatekeeping,but using a significant amount of training on an ongoingbasis would not be cost-effective.
If it is not feasible to provide the gatekeepers with a highlevel of training, many manufacturers have sought to“bulletproof” the returns process by providing materials forthe employees to follow when taking a return. Suchmaterials would let the employee know what products canbe returned, for how long after purchase, and what partsshould be included with the product. For example, in thecase of a VCR, the employee should make sure that the VCR,the remote control, and the cables are all present, and thatthe remote matches the VCR. In an effort to improve

Chapter 7: Future Trends 193
retailers’ returns processing, a well-meaning manufacturermay put together a binder outlining each of the parts thatshould be present for each one of its products.
Unfortunately, these carefully thought-out materials areoften obsolete within months or weeks of printing due toproduct changes. The most significant problem thesematerials face is the fact that they are very paper-intensive.Imagine the scene at a typical returns desk: a half a dozen ormore manufacturers have sent their own three-ring bindersto a store’s returns desk, followed by periodical updates.Soon, the returns desk is swamped in materials, and noemployee knows where it all is, nor which materials areobsolete or which are current. Rather than trying to sort theirway through the morass of procedures and policies,employees just ignore them.
Web-Based GatekeepingAs described in Chapter 2, some retailers are investing ingatekeeping systems. One solution that seems promising isan internet or intranet web page that guides the employeethrough the returns process for each product. When acustomer returns a product, the employee scans the UPC barcode on the product. The computer system asks themanufacturer’s system for the returns procedure for theparticular product. A web page appears, which steps theemployee through the returns process for that product.
Using the VCR as an example again, after the employeescans in the VCR’s UPC code, a web page appears with apicture and short description of the product. The employee

194 Rogers and Tibben-Lembke
is asked if the VCR matches the product shown on thescreen. If not, the employee could choose the properproduct from a pull-down menu. The page would includepictures of any accessories that should be present. Inaddition to the VCR itself, there would be a picture of theremote control and a picture of the cables.
One problem retailers and manufacturers have repeatedlymentioned in the current study is that employees do notappreciate the importance of having the accessories present.Some manufacturers will not allow a product to be returnedif certain key accessories are missing, or will only providepartial credit. A retailer may have given a customer a fullrefund for a returned VCR, but only receive a credit for 50percent of the cost from the vendor because the remotecontrol was not present.
For this reason, manufacturers and retailers alike have saidthat they wish it were possible to make the employee awareof how much it will cost the store if certain components aremissing.
For example, next to the pictures of the VCR's remote controland cords, the web page could list the cost to the retailer ofnot having each of these items. This would make theemployee aware of the importance of having each of thesecomponents. Some components may have a greater costthan others. A lost remote control may cost the retailer $5,whereas a lost cable may have zero cost.

Chapter 7: Future Trends 195
Electronic Data InterchangeAnother important technology is Electronic DataInterchange (EDI). While this technology is not new, most ofthe firms included in the research had not yet fully adoptedEDI. While many processes within an organization may beautomated, it hard to marshal the resources to implement allof the EDI transaction sets that a firm might wish to have.Obviously, for most companies the reverse flow would notbe among the first to adopt and implement.
A description of EDI is listed in Appendix D. This appendixcontains a detailed discussion of the 180 returns transactionset.
POS RegistrationIn some cases, manufacturers are willing to accept customerreturns for a limited period of time after the initial purchase.If a retailer attempts to return a product to the manufacturerafter this period has expired, the manufacturer will not givethe retailer credit. In this type of situation, the retailer needsto know exactly when the product was purchased.
A technology that can provide this information is point ofsale (POS) registration. In a POS registration system, theretailer scans the product’s serial number at the time of sale.The retailer electronically sends the serial number and thesale date to the manufacturer. The manufacturer keeps onfile the serial number, the sale date, and the name of thestore that sold the product. When a customer tries to returna product at a later date, the retailer phones the

196 Rogers and Tibben-Lembke
manufacturer to learn if the product is within the warrantyperiod.
If a web-based returns system like the one above isimplemented, this function could be included in the webpage. After the employee scans the product UPC, a webpage appears that instructs the employee to scan in theproduct’s serial number. The web page accesses thedatabase, and tells the employee whether the product waspurchased at the retailer’s store, and if it is possible to returnthe product.
Such a system nearly eliminates products being improperlyreturned. In the case described, the manufacturer pays theretailer fifty cents for every product registered. Clearly, thissystem comes at some cost to the manufacturer. In additionto the cost of registering the products, the manufacturermust also bear the considerable cost of developing andimplementing such a system.
Despite the cost of such a system, for some products, thebenefits can be great. The benefits will be greatest for highvalue products with short life cycles. When a product has ashort life cycle, the customer may have a greater incentive totry to return a product beyond the authorized warrantyreturns period. When a new version of a product is released,many customers want to return the old version for a newversion. If too much time has passed since the purchase forthe manufacturer to authorize the return, some customerswill try to abuse the returns system. The more frequently anew version of the product comes out, the greater

Chapter 7: Future Trends 197
customers’ incentive to abuse the system. Also, the higherthe value of the product, the greater customers’ incentive toabuse the system.
Fighting Returns AbusePOS registration is but one example of technology that couldbecome more widely used in the future, as retailers andmanufacturers join forces to fight returns abuse. Clearly,both manufacturers and retailers suffer when consumersfraudulently return products. Although manufacturers andretailers often are on opposite sides in many issues, fightingreturns abuse is an issue on which both sides can agree towork.
RFIDKeeping track of where reverse logistics products are andwhere they are going can be time consuming. Manyproducts do not have their original packaging, or thepackaging may be damaged. In this case, it is very difficultto use RF scanners to track the movement of productsthrough the reverse logistics flow.
Radio Frequency Identification (RFID) is a relatively newtechnology that may prove beneficial in these situations.Typical methods for identifying products are passive. Inorder to know if a particular product is present, the onlyway to find out is to go out into the warehouse and look tosee if it is there. RFID, in contrast, is a more active form ofidentification. A very small, very low powered radiotransmitter is installed in each product, broadcasting a veryfaint signal. Despite its small size, an RFID “tag” contains a

198 Rogers and Tibben-Lembke
battery that can send out a signal for years. The signal isstrong enough, that it can be picked up by receivers in awarehouse. Each product can send a different signal. Youcould build 10 million computers, and install an RFID “tag”in each one, and each one could have a different signal.
There are two ways to use RFID: passively and actively. Inpassive RFID, a “sentry” at the entrance to the warehouserecords the identification of each product as it enters thewarehouse. Then, its ID is also registered when it leaves thebuilding. Any items that have entered, but not left thebuilding must still be in the warehouse. In active RFID,receivers are placed throughout the warehouse. To find outif a particular item is in the warehouse, the receivers listen tosee if the product’s signal is being received. If it is beingreceived by more than one receiver, using triangulation, it ispossible to determine where in the warehouse the productis.
Using RFID to assist in the management of returnedcomputers might be a good option. Placing an RFID tag onthe machine at the time of manufacturing would take awaythe errors in the paper chain and assist in the life cyclemanagement of the computers.
One firm interviewed in the research has developed a RFIDsystem that simultaneously reads multiple passive tagscontained in various cartons on a pallet. Its system scansmultiple items without those items being to be unpacked.For certain products, an RFID tag could be placed on the
Chapter 7: Future Trends 199
circuit board or embedded in the plastic case of thecomputer.
RFID has the potential to aid reverse logistics operations in anumber of ways. As mentioned, it may be helpful inkeeping track of products in the warehouse. The other way itmay be beneficial is in gatekeeping. RF tags may be used inrecording the ID of products when they are sold, and thisinformation can be useful in determining which products toaccept for return.
Two-Dimensional Bar CodingTwo-dimensional bar coding is another technology thatholds promise for reverse logistics operations. Two-dimensional bar coding schemes, such as PDF417 or Maxi-Trac, allow the user to embed much more information in abar code than one-dimensional systems such as UPC. One-dimensional systems contain a number or code that must betranslated by the computer and matched with informationalready had inside the machine. With two-dimensional barcode systems, the bar code can contain not only a code, butalso a description and other text, even as long as AbrahamLincoln’s Gettysburg Address.
Because reverse logistics transactions and processes are oftenexception-driven, information required to update thecomputer may not be able to fit within the limitations of one-dimensional bar codes. This limitation of one-dimensionalbar code schemes could mean that for reverse logisticsapplications, new technologies—such as RFID or two-

200 Rogers and Tibben-Lembke
dimensional bar codes—will become the rule rather than theexception.
Data CollectionUsing improved product tracking technologies like thosejust described, and with improved information systems formonitoring the flow of these products, firms will have muchmore information available about their reverse logisticsprocesses. With this much more information available, thechallenge will be for firms to effectively use it to theiradvantage.
In the preceding chapters, a number of examples have beengiven of firms that have used reverse logistics systems towatch for quality problems with their products. By trackingthe number of returns of a product, a firm can be aware of anunusually large number of returns, and take appropriateaction.
Design for Reverse LogisticsSome firms have developed programs to design products tobe more easily manufacturable, Design For Manufacture(DFM). Others have designed items to flow through thesupply chain more efficiently, Design For Supply ChainManagement (DFSCM). In the near future, perhaps morecompanies will begin to think about designing products forreverse logistics management. A suggested term for thisidea is this Design For Reverse Logistics (DFRL).
In some cases, firms have designed reverse logisticscapabilities into the product (for example, Nintendo's

Chapter 7: Future Trends 201
scannable, see-through window mentioned in Chapter 2).Most direct retailers include address labels so that customerscan easily ship the product back. Some firms, such as Canonand Xerox, want to reclaim more value from used copier andprinter cartridges, and incent consumers to return emptycartridges when they purchase new ones. DFRL is to designreverse logistics requirements into product and packaging.It is the integration of reverse logistics needs andenvironmental concern into the product and the reverselogistics chain.
Partial RefundsOnce a returns information system is in place, a firm can bemore precise in determining the amount of credit a customershould receive. Instead of giving the customer a full refund,and absorbing the cost of the missing remote, the retailermay elect to only give the customer a partial refund, holdingthe customer responsible for the cost of the missing remote.The retailer may, in fact, go beyond this cost, and add anadditional, punitive charge for the incomplete return.
Partial refunds offer a helpful middle ground, as opposed toforcing the employee to make a choice between accepting orrefusing the product for a full refund. If the employeerefuses to accept the product at all, and the customer has, infact, lost the missing component, the customer may becomeirate. Allowing the employee the additional option of givingthe customer a reduced refund may be a preferable option.

202 Rogers and Tibben-Lembke
Partial refunds will give the customer a strong incentive tomake sure that any returned products are, in fact, complete,which should also reduce the retailer’s cost of returns.
Regardless of whether a retailer implements such anadvanced system, improving the technology available toemployees responsible for gatekeeping, will be an importantarea for reducing reverse logistics costs.
7.2 Managing Reverse Logistics Flow
Once products have been allowed into the reverse logisticssystem, companies must manage the flow of these productsto minimize their net impact to the bottom line.
Standardization of ProcessesOne of the most common difficulties the research teamobserved with current reverse logistics systems is the lack ofstandardization of processes throughout an organization. Ifprocesses are not standardized, it is very difficult for peoplein an organization to communicate to each other how tohandle reverse logistics problems.
Good reverse logistics processes begin at the retail store bysimplifying returns policies and procedures. Thesesimplified policies and procedures should translate intofewer labor hours dedicated to returns processing. Higherquality decisions should also result because ofsimplification.
Chapter 7: Future Trends 203
As described earlier in this book, for a variety of reasons,reverse logistics often is a low priority area at manycompanies. In the future, companies will increasinglyrecognize the strategic importance of reverse logistics, whichshould result in more corporate resources being available forimprovements to reverse logistics flows.
Many companies have discovered that the major benefits ofISO 9000 certification of their forward channel are derivedfrom standardizing all of their processes. Although manyfirms may not elect to get their reverse logistics processesISO certified, as more resources become available, manyfirms will appreciate the benefit of standardization.
Centralized Return CentersAs discussed in Chapter 2, research respondents who hadimplemented a Centralized Return Center (CRC), were inagreement that using a separate CRC offered many benefits.At a CRC, employees have a much larger volume ofproducts to deal with than they would ever experience at aretail store. This allows employees to develop areas ofexpertise, which can greatly benefit the firm.
Many of the benefits cited appear to be due to the fact thatthis allowed the returns processing staff to focus solely onreturns. Asking staff to “serve two masters” by havingpeople responsible for both forward and reversedistribution, seems to work poorly. The benefits may notarise because of the CRC being physically separate from theforward distribution centers (DCs), but because of theseparation of control.

204 Rogers and Tibben-Lembke
In the future, firms will continue to benefit from separatingthe control of the forward and reverse channels. However, itwould seem likely that firms will learn how to handlereturns in a CRC that may be at the same physical locationas a forward DC. This will allow firms to place their CRCsat the best geographical location, regardless of the presenceor absence of a DC.
Third PartiesA major logistical trend of the 1980s and 1990s has been therecognition of logistics as a field in its own right. As firmshave analyzed their core competencies, many have realizedthat they lack the expertise, skills, and experience to performcertain functions in-house. In the future, many firms maydetermine that reverse logistics falls into the category ofactivities which are best outsourced.
Firms will realize that efficiently handling the reverse flowand maximizing revenues from secondary markets arespecialized skills. Many firms that thirty years ago wouldhave never considered outsourcing their distribution, nowfind they can significantly reduce costs by using third partylogistics providers. In the future, many of these same firmsmay come to similar conclusions about reverse logisticsactivities.
Secondary MarketsIn the future, firms are likely to find themselves workingmuch more closely with their partners in the secondarymarket. The current logistics paradigm of moving materialfrom the plant to the finished goods distribution center, and

Chapter 7: Future Trends 205
then to the store, will expand to include the passing of thisinventory along to the secondary market.
In the last 10 years, outlet stores have risen from a smallportion of total sales to a much larger percentage. Asdescribed in Chapter 3, outlet stores were originallyconceived to dispose of unsold or returned merchandise. Asthe outlet store segment grew, a larger quantity of materialwas needed to keep this new channel well stocked. Inresponse, many firms began to produce products especiallyfor the outlet store market.
It is difficult to predict what the future will hold for thesecondary market. From all indications, it will continue togrow. As the secondary market grows, some manufacturerswill take measures to increase their control over whathappens to their products once they leave the “A” channel.
Web-Based Secondary MarketsA trend in the disposition of goods is the utilization of theworldwide web. While at the time of this writing utilizationof the web is limited, it appears that in the future it will bean important mechanism for dispositioning from the reverselogistics flow.
The web provides a direct link to consumers. By eliminatingseveral intermediate steps, a web-based supply chain can bemore efficient than a typical channel. This efficiency can bevery useful when selling product that has entered thereverse logistics flow.

206 Rogers and Tibben-Lembke
Some product is sold to the secondary market electronicallythrough a web auction. A web auction allows consumers tobid on products until a preset closing time. The web sitessuch as www.onsale.com or www.surplusdirect.com enable theliquidation of merchandise while maximizing revenues.Generally, these web sites offer a few pieces of an item andallow consumers to bid on them. Instead of selling theseitems at a fixed price, offering them via an auctionmechanism means that customers will bid the price up to anequilibrium point where demand meets supply. Holdingback some of the product encourages consumers to bid upthe price of the limited number of items that are available forauction that day.
The web provides a quick feedback mechanism to inform thefirm whether there is a profitable market for the product. Ifthe product does not perform well at the web auction, thenperhaps another disposition option should be selected.
A limiting aspect of web auctions is that only consumerswith web access can use them. As usage of the Internetgrows, usage of the web will grow and this problem willdecrease. Currently, the largest portion of secondarymarkets items available via the web is computer-related.
Zero ReturnsAs described in Chapter 2, a number of firms areexperimenting with zero returns programs. In a zero returnsprogram, the manufacturer never again takes possession of aproduct once it has been sold. The retailer takesresponsibility for dispositioning product in accordance with

Chapter 7: Future Trends 207
the manufacturer’s stipulations. In return, the retailerreceives a payment that is intended to reimburse him for thecost of the returned items and for dispositioning theproduct. By removing the need to handle the returns, themanufacturer expects to save enough costs to more thanoffset the increased payments to the retailer.
Under some zero returns programs, the store alwaysreceives a credit for a certain percentage of sales, no matterhow high the return rate. If the credit is six percent, andactual returns are only two percent, the retailer is happy,because it still receives a six percent credit. When theopposite happens, the credit is set at two percent, andreturns are six percent, the retailer loses. The idea behindthe program is that the credit will be set high enough that itwill exceed the average returns experienced by the retailer.However, given the power held by the large retailer chains,it can be difficult for the manufacturer to prevail against theretailer in this situation.
Unfortunately, given the lax controls that many firms keepover their returns, controls over zero returns programs arelacking. Some manufacturers accuse retailers of doubledipping, taking payment from the manufacturer fordestroying the product, and then quietly selling the productout the back door to a secondary market firm.
Reverse Logistics StrategiesDepending on the life cycle of a manufacturer’s products,and the value of the products, firms will discover that

208 Rogers and Tibben-Lembke
different combinations of the above strategies will be neededto effectively and efficiently handle their returns.
For high-value products with short life cycles, likecomputers, video games, and camcorders, a POS systemmay be a very efficient way for retailers and manufacturersto reduce the costs of fraudulent returns. However, the costof POS registration may make it difficult for many items tobe managed in this manner. For example, the cost to trackan individual low cost item, such as a pair of jeans, wouldprobably prohibit using POS registration.
Process ImprovementIn attempting to improve reverse logistics processes, a firmcan move along several fronts. Suggested improvementsdescribed earlier in this book are listed in Table 7.1
Table 7.1Key Reverse Logistics Management Elements
• Gatekeeping• Compacting Disposition Cycle Time• Reverse Logistics Information Systems• Central Return Centers• Zero Returns• Remanufacture and Refurbishment• Asset Recovery• Negotiation• Financial Management• Outsourcing

Chapter 7: Future Trends 209
7.3 Conclusions
While much of the world does not yet care much about thereverse flow of product, many firms have begun to realizethat reverse logistics is an important and often strategic partof their business mission. Throughout the course of thisresearch project, many examples of large bottom-line impactwere identified. There is a lot of money being made andsaved by bright managers who are focused on improving thereverse logistics processes of their company. It is clear that,while sometimes derisively referred to as junk, much valuecan be reclaimed cost-effectively. While the efficienthandling and disposition of returned product is unlikely tobe the primary reason upon which a firm competes, it canmake a competitive difference.

Appendix A: Letter/Copy of Survey
March 11, 1997
Good Morning:
The Center for Logistics Management at the University ofNevada is working on a research project to study reverselogistics trends and practices. We know that you probablyreceive many questionnaires, but we are asking you tocomplete one more.
Enclosed is a dollar as a token of our appreciation. Pleasecomplete the questionnaire and return it at your earliestconvenience. If you are unable to complete thequestionnaire, please just put it in the mail anyway. Yourassistance is critical to a better understanding of reverselogistics trends and practices.
All responses will be kept strictly confidential. No one elsebut the research team will ever view any of the raw data. Nocompany data will be identified. Should you have anyquestions, please call me at (702) 784-6814.
Thank you again for your kind assistance.
Sincerely,
Dale S. Rogers, Ph.D.Director

212 Rogers and Tibben-Lembke
________________________________________________
THANK YOU
We sincerely appreciate your help in filling out thisquestionnaire. Your rapid response is critical to
completing this research and will help develop a betterunderstanding of Reverse Logistics in North America
________________________________________________
Reverse Logistics Research________________________________________________
Conducted by:
University of NevadaCenter for Logistics Management
________________________________________________

Appendix A: Letter / Copy of Survey 213
MAILING INSTRUCTIONS
This survey booklet is designed to be mailed as is. The “to”and “from” addresses are already on the back cover. Shouldyou wish to seal it for confidentiality, use tape. No postage
is necessary.
Dr. Dale S. RogersCenter for Logistics Management (024)
College of Business AdministrationUniversity of Nevada, Reno
Reno, NV 89557-0016(702) 784-4912
fax (702) 784-1773e-mail: [email protected]
web page: http://unr.edu/homepage/logis

214 Rogers and Tibben-Lembke
For this questionnaire, we are defining Reverse Logistics as the process of moving goodsfrom their typical destination to another point for the purpose of capturing value otherwiseunavailable, or for the proper disposal of the product.
1. How long is the life cycle of a typical product?oo Less than 3 months oo More than 18 months to 2 yearsoo More than 3 months to 6 months oo More than 2 years to 3 yearsoo More than 6 months to 12 months oo More than 3 years to 5 yearsoo More than 12 months to 18 months oo More than 5 years
2. On a scale of 1 to 7, with 1 representing very conservative return policies, and 7representing very liberal return policies, how would you rate your policiesregarding customer returns?
Very VeryConservative Liberal
1 2 3 4 5 6 7
3. How, if at all, have your return policies changed in the past year?More MoreConservative Liberal
1 2 3 4 5 6 7
4. What role do returns play in your company’s strategy? Check all that apply.oo Clean channeloo Protect marginoo Competitive reasonsoo Recapture valueoo Recover assetsoo Legal disposal issuesoo Other, please specify_____________________________________________
5. By what percentage do returns reduce your profitability?
__________ %
6. What, would you estimate, is the impact your returns have on your profits? (as apercentage of profits)
__________ %
7. What percentage of your total Logistics costs do your Reverse Logistics costsrepresent?
__________ %
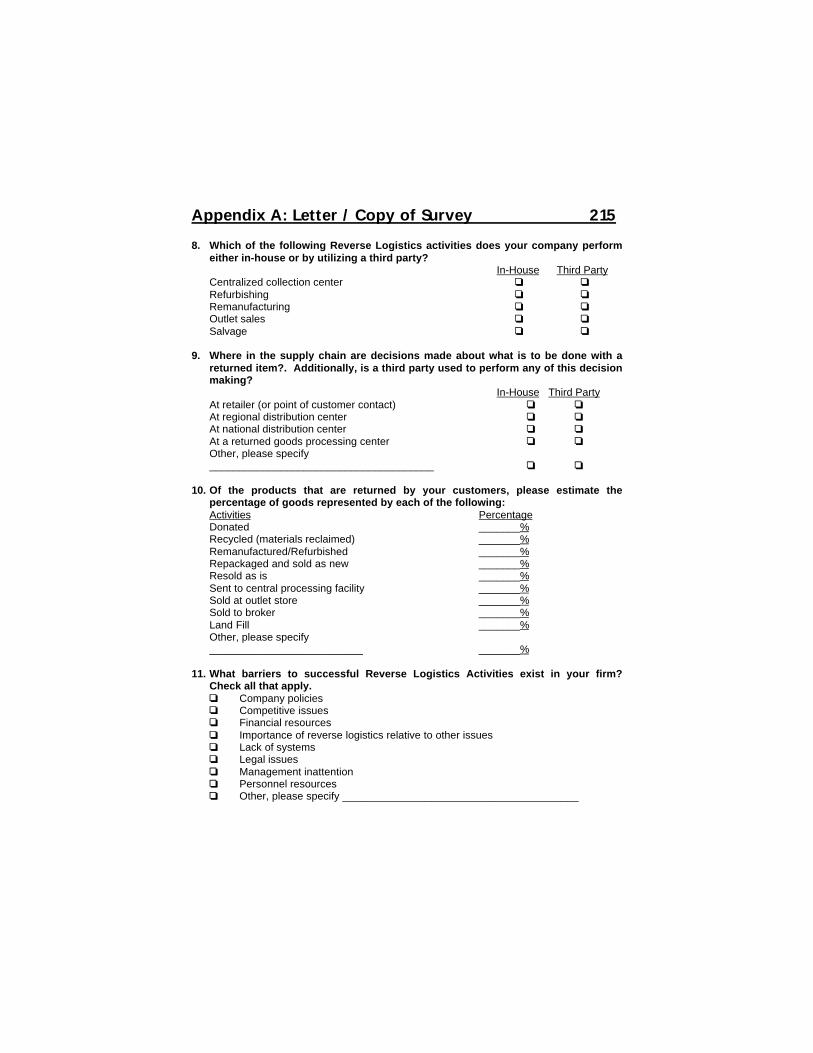
Appendix A: Letter / Copy of Survey 215
8. Which of the following Reverse Logistics activities does your company performeither in-house or by utilizing a third party?
In-House Third PartyCentralized collection center oo ooRefurbishing oo ooRemanufacturing oo ooOutlet sales oo ooSalvage oo oo
9. Where in the supply chain are decisions made about what is to be done with areturned item?. Additionally, is a third party used to perform any of this decisionmaking?
In-House Third PartyAt retailer (or point of customer contact) oo ooAt regional distribution center oo ooAt national distribution center oo ooAt a returned goods processing center oo ooOther, please specify______________________________________ oo oo
10. Of the products that are returned by your customers, please estimate thepercentage of goods represented by each of the following:Activities PercentageDonated _______%Recycled (materials reclaimed) _______%Remanufactured/Refurbished _______%Repackaged and sold as new _______%Resold as is _______%Sent to central processing facility _______%Sold at outlet store _______%Sold to broker _______%Land Fill _______%Other, please specify__________________________ _______%
11. What barriers to successful Reverse Logistics Activities exist in your firm?Check all that apply.oo Company policiesoo Competitive issuesoo Financial resourcesoo Importance of reverse logistics relative to other issuesoo Lack of systemsoo Legal issuesoo Management inattentionoo Personnel resourcesoo Other, please specify ________________________________________

216 Rogers and Tibben-Lembke
12. What hardware and software technologies do you have installed, or plan toinstall, to assist your returns handling?oo Automated material handling equipmentoo Bar codesoo Computerized return trackingoo Computerized returns entry at most downstream point in supply chainoo Electronic data interchange (EDI)oo Radio frequency (RF)oo Other, please specify ________________________________________
13. How long is the returns processing cycle time for most of the products youhandle?oo Less than 1 day oo More than 2 weeks to 1 monthoo More than 1 day to 2 days oo More than 1 month to 2 monthsoo More than 2 days to 1 week oo More than 2 monthsoo More than 1 week to 2 weeks
General Company Information:14. What is your primary business?
oo Building, Materials, Hardware, and Garden Supplyoo General Merchandiseoo Electronics and Computersoo Foodoo Automotiveoo Chemicaloo Paper and Forest productsoo Apparel and Accessoryoo Furniture, Home Furnishings, and Equipmentoo Drugs, Health & Beauty Aidsoo Warehousingoo Truckingoo International logistics third partyoo Other, please specify __________________________________
15. On a scale of 1 to 7, with1 being very unimportant, and with 7 being veryimportant, rate the importance to your customers of each the following in theirdecision to use you as their supplier:
Least MostFactor Important ImportantCost reduction 1 2 3 4 5 6 7 N.A.Price 1 2 3 4 5 6 7 N.A.Quality of service 1 2 3 4 5 6 7 N.AReturn policies 1 2 3 4 5 6 7 N.ASpeed of delivery 1 2 3 4 5 6 7 N.A.Variety of products 1 2 3 4 5 6 7 N.A.

Appendix A: Letter / Copy of Survey 217
16. What were the annual gross dollar sales of your business during the most recentfiscal year?oo $5 Million or Less oo Over $150 to $200 Millionoo Over $5 to $10 Million oo Over $200 to $250 Millionoo Over $10 to $50 Million oo Over $250 to $500 Millionoo Over $50 to $100 Million oo Over $500 to $1 Billionoo Over $100 to $150 Million oo Over $1 Billion
17. How many people do you currently employ at this facility?oo 100 or fewer oo 251 to 500oo 101 to 150 oo 501 to 1,000oo 151 to 250 oo Over 1,000
18. In which of the following channel positions do you operate? Check all that apply.oo Manufactureroo Wholesaleroo Retaileroo Service Provider (Please explain:___________________________________ )
Name: ___________________________________________________________________
Title: _____________________________________________________________________ParentCompany: ________________________________________________________________Division or BusinessUnit: _____________________________________________________________________
Street Address: ____________________________________________________________
City: _______________________________State: ________Zip:_____________________
Telephone: ________________________________________________________________
Fax: ______________________________________________________________________
E-mail Address: ____________________________________________________________
Do you wish to receive a copy of the survey results?oo Yes oo No
Would you be willing to participate in a short telephone follow-up interview tothis questionnaire?
oo Yes oo No
THANK YOU FOR YOUR PARTICIPATION.THIS INFORMATION WILL BE HANDLED IN A CONFIDENTIAL MANNER.

Appendix B: Data Tabulation 219
Appendix B: Data Tabulation
The following are tabular and graphical representations ofthe data gathered from the surveys.
Question 1: How long is the life cycle of a typicalproduct?
<3 months 10.13%3-6 months 9.47%
6-12 months 13.51%12-18 months 12.50%18-24 months 11.82%
2-3 years 8.45%3-5 years 8.45%>5 years 25.67%
0%
5%
10%
15%
20%
25%
30%
Res
po
nd
ents
< 3Mos.
3-6Mos.
6-12Mos.
12-18Mos.
18-24Mos.
2-3 Yrs. 3-5 Yrs. >5 Yrs.
Product Lifecycle

220 Rogers and Tibben-Lembke
Question 2: On a scale of 1 to 7, with 1 representing veryconservative return policies, and 7 representing veryliberal return policies, how would you rate your policies,regarding customer returns? (1=very conservative,7=more liberal).
Most of the participants showed a liberal return policy for theirproducts.
2.6%5.5%
7.4%10.6%
25.2% 27.4%
21.3%
0%
5%
10%
15%
20%
25%
30%
Return Policy Distribution
Res
po
nd
ents
very conservative very liberal

Appendix B: Data Tabulation 221
Question 3: How, if at all, have your return policieschanged in the past year? (1=more conservative,7=more liberal).
2.1%
7.2%
14.8%
40.2%
18.2%
11.3%
6.2%
0%
5%
10%
15%
20%
25%
30%
35%
40%
45%
Res
po
nd
ents
Return Policy Changes
1= more conservative 7= more liberal

222 Rogers and Tibben-Lembke
Question 4: What role do returns play in your company’sstrategy? (Check all that apply.)
Returns’ role incompany’s strategy Respondents
Competitive reasons 64.9%Clean channel 33.1%Legal disposal issues 29.3%Recapture value 28.6%Recover assets 27.6%Protect margin 18.3%
Also, 17 percent of the respondents specified other roles played byreturns in their company’s strategy, including: customersatisfaction, customer service, and quality.
64.9%
33.1% 29.3% 28.6% 27.6%18.3%
0%10%20%30%40%50%60%70%
Res
po
nd
ents
Com
petit
ive
Rea
sons
Cle
anC
hann
el
Lega
lIs
sues
Rec
aptu
reV
alue
Rec
over
Ass
ets
Pro
tect
Mar
gin
Returns' Role in Strategy

Appendix B: Data Tabulation 223
Question 5: By what percentage do returns reduce yourprofitability?
The average percentage by which profitability is reduced is 4.2percent, with a standard deviation of 9.8.
Question 6: What, would you estimate, is the impactyour returns have on your profits? (as a percentage ofprofits)
The average impact returns have on profits is 3.7 percent, with astandard deviation of 5.9.
Question 7: What percentage of your total Logisticscosts do your Reverse Logistics costs represent?
The average impact returns have on profits is 3. 9 percent, with astandard deviation of 6.3.
Question 8: Which of the following Reverse Logisticsactivities does your company perform either in-house orby utilizing a third party?
BothThird In-House
In-House Party and 3PL
Centralized Collection Center 49.2% 15.1% 3.5%Refurbishing 38.7% 9.3% 3.9%Remanufacturing 29.9% 9.9% 0.6%Outlet sales 28.6% 8.0% 2.9%Salvage 45.9% 17.0% 5.2%

224 Rogers and Tibben-Lembke
Question 9: Where in the supply chain are decisionsmade about what is to be done with a returned item?Additionally, is a third party used to perform any of thisdecision making?
BothThird In-House
In-House Party and 3PL
At retailer (or point of 44.4% 3.9% 1.3%Customer contact)
At regional distribution center 37.9% 4.2% 1.3%
At national distribution center 38.3% 1.3% 0.3%At a returned goods 27.6% 8.4% 1.3%
processing center

Appendix B: Data Tabulation 225
Question 10: Of the products that are returned by yourcustomers, please estimate the percentage of goodsrepresented by each of the following:
Activities Average PercentageResold as is 17.6%Remanufactured / Refurbished 15.5%Recycled (Material Reclaimed) 14.7%LandFill 13.9%Repackaged and Sold as New 11.0%Sent to Central Processing Facility 9.0%Donated 6.8%Sold to Broker 5.6%Sold at Outlet Store 5.1%
17.6%15.5%
14.7%13.9%
11.0%9.0%
6.8%5.6%
0%2%4%6%8%
10%12%14%16%18%
Ave
rag
e P
erce
nta
ge
Res
old
As
Is
Rem
anuf
actu
red
Rec
ycle
d
Land
fill
Rep
acka
ged
Cen
tral
Pro
cess
ing
Don
ated
Sol
d to
Bro
ker
Disposition Activities

226 Rogers and Tibben-Lembke
Question 11: What barriers to successful ReverseLogistics Activities exist in your firm? Check all thatapply.
Barriers RespondentsImportance of reverse logistics 39.9% relative to other issuesCompany Policies 35.4%Lack of systems 35.1%Competitive issues 32.1%Management inattention 27.3%Personnel resources 19.3%Financial resources 18.9%Legal issues 14.1%
39.9%
35.4% 35.1%32.1%
27.3%
19.3% 18.9%
14.1%
0%
5%
10%
15%
20%
25%
30%
35%
40%
Res
po
nd
ents
Impo
rtan
ceof
RL
Com
pany
Pol
icie
s
Lack
of
syst
ems
Com
petit
ive
Issu
es
Man
agem
ent
Inat
tent
ion
Per
sonn
elR
esou
rces
Fin
anci
alR
esou
rces
Lega
l Iss
ues
Barriers to Reverse Logistics

Appendix B: Data Tabulation 227
OtherSeven percent of the participants gave other reasons, such astoo costly of a process, product characteristics (likeperishability), freight costs or lack of payback.
Question 12: What hardware and software technologiesdo you have installed, or plan to install, to assist yourreturns handling?
Technologies RespondentsBar codes 51.1%Computerized return tracking 45.0%Radio frequency (RF) 28.3%Electronic data interchange (EDI) 27.0%Computerized returns entry at most 23.8% downstream point in supply chainAutomated material handling 19.3%
equipment
51.1%45.0%
28.3% 27.0%23.8%
19.3%
0%
10%
20%
30%
40%
50%
60%
Res
po
nd
ents
Bar
Cod
es
Com
pute
rized
trac
king
Rad
io F
req.
ED
I
Com
pute
rized
retu
rns
Aut
omat
edeq
uipm
ent
Installed technologies

228 Rogers and Tibben-Lembke
Other5.14 percent of the participants mentioned other hardware andsoftware technologies, such as automated Return MaterialsHandling processing, automated freight systems, virtual returns,and outsourcing.
Question 13: How long is the returns processing cycletime for most of the products you handle?
Less than 1 day 4.8%More than 1 day to 2 days 11.6%More than 2 days to 1 week 25.6%More than 1 week to 2 weeks 20.1%More than 2 weeks to 1 month 23.2%More than 1 month to 2 months 7.8%More than 2 months 6.8%
4.8%
11.6%
25.6%
20.1%23.2%
7.8% 6.8%
0%
5%
10%
15%
20%
25%
30%
Res
po
nd
ents
x<1d
ay
1<x<
2da
ys
2<x<
1w
k
1<x
<2
wk
2<x<
1m
o
1<x<
2m
o
x>2m
o
Returns processing cycle time

Appendix B: Data Tabulation 229
Question 14: What is your primary business?
Food 21.4%Electronics and Computers 15.1%General Merchandise 12.7%Drugs, Health and Beauty Aids 11.5%Automotive 9.9%Apparel and Accessory 9.5%Building, Materials, Hardware and Garden Supply 5.6%Chemical 5.5%Paper and Forest products 3.6%Furniture, Home Furnishings, and Equipment 3.6%Warehousing 1.6%
Other types of businesses mentioned are media andpublishing, telecommunications, farm, and industrial andpower equipment.
Companies' business
Food
Electronics & Computers
General Merchandise
Drugs, Health, Beauty
Automotive
Apparel
Building MatlsChemical Other

230 Rogers and Tibben-Lembke
Question 15: On a scale of 1 to 7, with 1 being veryunimportant, and with 7 being very important, rate theimportance to your customers of each of the followingin their decision to use you as a supplier:
Average Standard deviationCost Reduction 4.2% 4.4Price 5.2% 1.7Quality of Service 5.9% 1.5Return Policies 3.7% 1.8Speed of delivery 5.3% 1.8Variety of products 5.1% 2.0
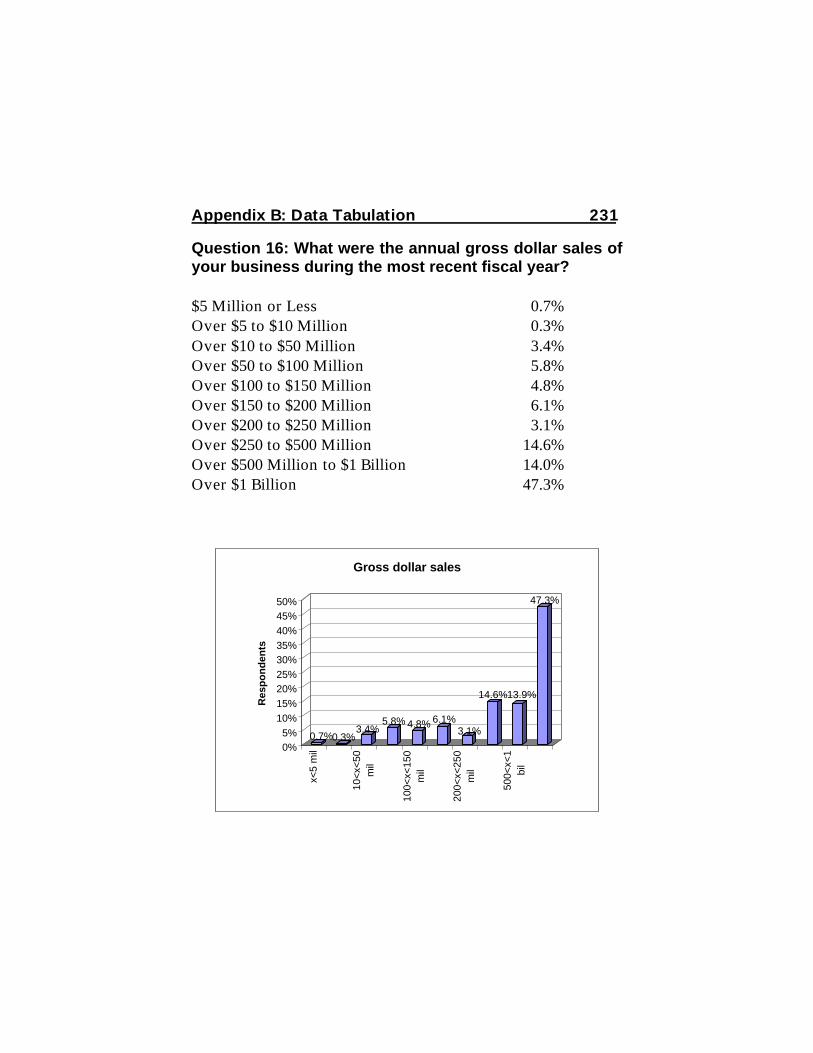
Appendix B: Data Tabulation 231
Question 16: What were the annual gross dollar sales ofyour business during the most recent fiscal year?
$5 Million or Less 0.7%Over $5 to $10 Million 0.3%Over $10 to $50 Million 3.4%Over $50 to $100 Million 5.8%Over $100 to $150 Million 4.8%Over $150 to $200 Million 6.1%Over $200 to $250 Million 3.1%Over $250 to $500 Million 14.6%Over $500 Million to $1 Billion 14.0%Over $1 Billion 47.3%
0.7%0.3%3.4%
5.8% 4.8% 6.1%3.1%
14.6%13.9%
47.3%
0%5%
10%15%20%25%30%35%40%45%50%
Res
po
nd
ents
x<5
mil
10<
x<50
mil
100<
x<15
0m
il
200<
x<25
0m
il
500<
x<1
bil
Gross dollar sales

232 Rogers and Tibben-Lembke
Question 17: How many people do you currently employat this facility?
100 or fewer 16.8%101 to 150 8.7%151 to 250 9.1%251 to 500 18.1%501 to 1000 11.7%Over 1,000 35.6%
16.8%
8.7% 9.1%
18.1%
11.7%
35.6%
0%5%
10%15%20%25%30%35%40%
x<10
0
101<
x<15
0
151<
x<25
0
251<
x<50
0
501<
x<10
00
x>10
00
Currently employed people

Appendix B: Data Tabulation 233
Question 18: In which of the following channel positionsdo you operate?
Manufacturer 64.0%Wholesaler 29.9%Retailer 28.9%Service Provider 9.0%
64.0%
29.9% 28.9%
9.0%
0%10%20%30%40%50%60%70%
Res
po
nd
ents
Manufacturer Wholesaler Retailer ServiceProvider
Channel Position

234 Rogers and Tibben-Lembke

Appendix C: For More Information
Reverse Logistics AssociationsReverse Logistics Executive Council (RLEC)Mail Stop 024Reno, NV 89557Phone: (775) 784-4912Fax: (775) 784-1773Web Site: www.rlec.org
Automotive Parts Rebuilders Association (APRA)4401 Fair Lakes Court, Suite 210Fairfax, VA 22033Phone: (703) 968-2772Fax: (703) 968-2878Email: [email protected] Site: www.apra.org
International Reciprocal Trade Association175 West Jackson Blvd., Suite 625Chicago, IL 60604Phone: (312) 461-0236Fax: (312) 461-0474Email: [email protected] Site: www.irta.net
Investment Recovery Association5818 Reeds RoadMission, KS 66202-2740Phone: (913) 262-4597

236 Rogers and Tibben-Lembke
Fax: (913) 161-0174Email: [email protected] Page: www.invrecovery.org
Remanufacturing Industries Council International (RICI)4401 Fair Lakes Court, Suite 210Fairfax, VA 22033-3848Phone: (703) 968-2995Fax: (703) 968-2898Email: [email protected] Page: www.rici.org
Logistics AssociationsCouncil of Logistics Management2805 Butterfield Road, Suite 200,Oak Brook, IL 60523Phone: (630) 574-0985Fax: (630) 574-0537Email: [email protected] Site: www.clm1.org
International Warehouse and Logistics Association1300 W. Higgins Road, Suite 111Park Ridge, IL 60068-5764Phone: (847) 292-1891Fax: (847) 292-1896Email: [email protected] Site: www.iwla.com

Appendix C: For More Information 237
Environmental Legislation InformationEnvironmental Protection Agency401 M Street, SWWashington, DC 20460Phone: (202) 260-2090Email: [email protected] Site: www.epa.gov
Duales System Deutschland AGFrankfurter Straße 720-72651145 Köln-Porz-Eil, GERMANYPhone: 02203-937-0Fax: 02203-937-190Web Site: www.gruener-punkt-e/e/content/wie/wie00.htm
European Union policies and publicationsUnit OP/3 ‘Publications’2, rue MercierL-2985 LuxembourgFax: (352) 2929 44637Email: [email protected] Site: europa.eu.int/pol/en/env.htmWeb site summarizes EU policies, laws.Packaging Recovery Organisation (PRO) EuropeAvenue de Tervuren 35, Etterbeek,B – 1040 Bruxelles, BELGIUM(An umbrella organization for national “Green Dot”programs in Europe.)

238 Rogers and Tibben-Lembke
Take-Back & Environmental InformationEnvironmental Data Service (ENDS)Finsbury Business Centre40 Bowling Green LaneLondon EC1R 0NEENGLANDEmail: [email protected] Site: www.ends.co.ukPhone: +44 (0) 171 814 5300Fax: +44 (0) 171 415 0106
Electronic Product Recovery and Recycling Project (EPR2)of the Environmental Health Center, a Division ofThe National Safety Council1025 Connecticut Ave. NW, Suite 1200Washington, DC 20036Phone: (202) 293-2270Fax: (202) 293-0032Web Site: www.nsc.org/ehc/epr2
Raymond Communication, Inc.6429 Auburn Ave.Riverdale, MD 20737-1614(301) 345-4237Fax: (301) 345-4768Web Site: www.raymond.comEmail: [email protected]

Appendix C: For More Information 239
Reverse Logistics ProvidersGENCO Distribution System100 Papercraft ParkPittsburgh, PA 15238Phone: (800) 224-3141Email: [email protected] Site: www.genco.com
Damagetrack4045 University ParkwayWinston-Salem, NC 27106Phone: (336) 896-7900Fax: (336) 896-8190Email: [email protected] Site: www.damagetrack.com
EDI Transaction Setswww.harbinger.com/resource/X12

Appendix D: EDI 180 Transaction Set
D.1 EDI Basics
Electronic Data Interchange (EDI) allows companies toexchange information electronically in a very compact,concise, and precise way. Because the transactions arecompact and must follow strict standards, attempting tounderstand the language of these transactions is a study inminutia.
An EDI “exchange” is essentially the computer at onecompany making a phone call to the computer at anothercompany. To allow everyone to speak the same language,these messages are sent in a standardized form, called“transaction sets.” Messages about a request for quotationfollow the 840 transaction set; messages about purchaseorders follow the 850 transaction set. All in all, there arehundreds of transaction sets for different types of businesssituations.
Suppose one company (e.g., a retailer) wants to send amessage to another company (e.g., a supplier) about areturned good authorization, the message must conform tothe structure laid out in the “180 transaction set.”
Within one interchange, several messages (called“transaction sets” in EDI terminology) about returns mayneed to be sent, in addition to other messages. All messagesusing the same transaction set are grouped together (into

242 Rogers and Tibben-Lembke
something called a “functional group.”) For example, FigureD.1 shows how the contents of the phone call would beorganized if the retailer wanted to ask about returning twoproducts and submit four purchase orders.
Each transaction set is made up of a number of pieces ofinformation called “data segments.” These are lines of thelittle codes that will be discussed in the next section.Fortunately, the end user generally does not have to beconcerned about these codes. Using translation software,the purchase order information sitting in the retailer'sinformation system is translated into an EDI transaction.
Individual Messages (“transaction sets”)using 180 Transaction Set-- Request for Return-- Request for Return
Individual Messages (“transaction sets”)using 850 Transaction Set-- Purchase Order-- Purchase Order-- Purchase Order-- Purchase Order
FunctionalGroup #1
FunctionalGroup #2
Figure D.1EDI Transaction structure

Appendix D: EDI 180 Transaction Set 243
The data segments in a transaction set must conform to astandard order, which is shown in something called atransaction set “table.” For example, the information about areturn must follow the format in the 180 transaction settable, as shown in Appendix D.4. Not all of these datasegments need to be present, but those elements that arepresent need to be in this sequence.
To give an example of how data elements are used, considerone segment (one “message”) of the EDI transaction for asimple purchase order, as shown Table D.1.
At the start and end of the transaction set, there are datasegments that signal that the segment is a purchase order. Inbetween these markers is all of the relevant information forthe purchase order.
Table D.1Sample Purchase Transaction
ST*850*1 Transaction set identifierBEG*00*NE*00498765**010698 Beginning of the segmentPID*X*08*MC**Large Widget Description of the productPO1**5*DZ*4.55*TD Baseline Item DataCTT*1 Transaction TotalsSE*1*1 End of the segment

244 Rogers and Tibben-Lembke
The first line (the first “data segment”) identifies that thissegment will be a purchase order. The second segmentindicates the beginning of the segment. The third segmentgives information about exactly which product is to beordered. Segment 4 contains information about the quantityand the price. Segment 5 tells how many line items havebeen ordered, and segment 6 signals the end of the segment.
The individual terms that make up each segment are called“data elements.” Each segment starts with a data elementthat lets the supplier's computer know what the elementscoming next represent. The “P01” on line 4 is how thesupplier knows that the next few data elements will containinformation about something called “Purchase OrderBaseline Item Data.” Asterisks are used to separate thevarious pieces of information that must go with each code.Because there are two asterisks in a row after the initial label,this means that there is a space for an optional data element,which has not been included because this information is notneeded for the retailer’s current transaction.
The second data element included, “5,” indicates that thecustomer wants to order 5 units. The following “DZ” meansthat the units are in terms of dozens, so the customer wants 5dozen products. The only way to know the meaning of“DZ” is to look it up in a table or with software. The fourthdata element, “4.55” means that the price is $4.55. The lastdata element, “TD” means that the price given is the contractprice per dozen. Again, the only way to know what eachdata element represents is to look it up in the layout of thetransaction set.

Appendix D: EDI 180 Transaction Set 245
Because some data elements are used by many transactionsets, each type of element has a number associated with it, (a“Data Dictionary Reference Number”) for convenience. Forexample, the data element that tells what type of units theproducts are in is data element 355, the “Unit or Basis forMeasurement Code.” More information about the elementcan be found in a “Data Dictionary.”
In some transaction sets, if optional data elements come atthe end of the line, the line will terminate after the last valuesupplied.
D.2 EDI 180 Transaction Set
The EDI 180 transaction set “Return MerchandiseAuthorization and Notification” was designed to allowcompanies to exchange information about returns via EDI.It includes many data elements common to other transactionsets: Carrier Details, Address Information, etc. The 180transaction set table is shown below in Section D.4.
The main data elements unique to the 180 transaction setinvolve the RDR (Return Disposition Reason) data segment.RDR is used to indicate the disposition of the item, thereason for the return, a description of the problem, andwhether or not the item has been used, as shown in TableD.2. Several examples of the use of this data element aregiven at the end of this section.

246 Rogers and Tibben-Lembke
Table D.2RDR Segment Diagram Key
Sequence Element Name Atr01 1292 Returns Disposition Code 002 1293 Return Request Disposition Code C03 1294 Return Response Reason Code C04 352 Description 005 1073 Yes/No Condition or Response Code 0
The “Atr” column in Table D.2 indicates whether theelement is mandatory, optional, or conditional, dependingon whether the value is M, O, or C. A conditional elementmay be required, depending on what other elements havebeen used, and what values have been given for thoseelement.
Data element 1292, “Returns Disposition Code” indicateshow a contested item is to be disposed of. The possiblevalues for 1292 are given in Table D.3.
Table D.31292 Returns Disposition Data Element
CODE MEANING CR Consumer Return to VendorDI DisposeKA Keep with an AllowanceKR Keep and RepairMW Manufacturer Warranty Service

Appendix D: EDI 180 Transaction Set 247
RA Return with Authorization NumberRD Request DeniedRF Return for Factory RepairRN Return without Authorization NumberRP Return Authorization PendingRT Ship to Third PartySC Ship to Third Party for Charitable
ContributionSD Ship to Third Party for Disposal
Data element 1293, “Return Request Reason Code,” is usedto indicate why the returning party would like to return theitem. Possible values for it are shown in Table D.4.
Table D.4:1293 Return Request Reason Data Element
CODE MEANING CO Customer Ordering ErrorCV Color VarianceDM Defective Merchandise or Store
InspectionDP Defective PackagingDR Defective Merchandise or Returned by
ConsumerEI Excess InventoryEO End of SeasonEW Excessive WearLP Label ProblemNA Not as ExpectedOP Outdated Packaging

248 Rogers and Tibben-Lembke
PE Price ErrorPF Poor FitPW Poor WorkmanshipSD Short-Dated ProductSP Shipped past Cancel DateSR Stock Reduction AgreementST Style ProblemWG Wrong Goods or Not Ordered
Data element 1294 is the “Return Response Reason Code.”This is where the manufacturer is able to respond to theretailer, telling why the return was not authorized if it wasnot authorized. If the return was authorized, this code willbe absent.
Table D.51294 Return Response Reason Data Element
CODE MEANING EW Excessive Wear and TearFR Freight or Retailer DamageIN Item not DefectiveIO Item as OrderedMI More Information RequestedNR No Record of Original SaleOS Out of Season or Discontinued Line
ItemPC Pricing or Cost DifferencePR Picture RequestedQD Quantity DifferenceRR Repair or RefurbishRT Return Time Limit Exceeded or Beyond
Appendix D: EDI 180 Transaction Set 249
Warranty PeriodSR Sample RequestedUI Unidentifiable Item
The complete180 transaction set is available on-line athttp://www.harbinger.com/resource/X12/.
Examples
RDR**DR**Y Retailer asking to return product returnedby a customer.
RDR*CR Message sent from manufacturerinstructing retailer to return the product tothe vendor.
RDR**DM*EW Retailer asked to return product because ofdefect, but manufacturer refused the return,saying that the problem is due to excessivewear and tear.
D.3 Criticisms of the 180 Set
Despite the fact that virtually every retailer or manufacturerin the U.S. could potentially use this transaction set, the set isbarely used. Of the companies interviewed in the researchproject, which include most of the major retail chains in theU.S., none indicated that they were using the 180 set.

250 Rogers and Tibben-Lembke
One common reason for not using the set is that thedisposition and return reason codes are not sufficientlybroad to cover all possible situations.
Additional Disposition CodesFrom the research respondents, the following dispositioncodes would be helpful to have, in addition to the existingcodes:
Destroy on siteSecure destruction (accompanied by security
personnel)Videotaped secure destructionDonate to charity locallySell to broker (secondary markets)ExchangeResaleMiscellaneous
For facilities that perform remanufacturing operations, thefollowing terms would also be helpful:
ReworkRemanufactureModify (Configuration or upgradable products)Repair

Appendix D: EDI 180 Transaction Set 251
Return Reason CodesFor products being sent back, additional information aboutwhy the product is being sent back can increase the level ofcommunication between retailer and supplier.
Repair / Service CodesFactory Repair – Return to vendor for repairService / Maintenance
Order / Processing CodesAgent Order Error – Sales agent ordering errorInternal Order Error – Incorrect internal orderingEntry Error – System processing orderShipping Error – Shipped wrong materialIncomplete Shipment – Ordered items missingWrong QuantityDuplicate ShipmentDuplicate Customer OrderMissing Part
Damaged / DefectiveDamaged – CosmeticDead on Arrival – Did not workDefective – Not working properlyDefective – Distribution Center Inspection
Contractual AgreementsStock Adjustment – Rotation of StockObsolete – OutdatedSeasonal

252 Rogers and Tibben-Lembke
OtherFreight Claim – Damaged during shipmentMiscellaneous
D.4 Complete 180 Transaction Set Table
Any returns information sent via EDI must conform to thestructure laid out in the transaction set table for the 180transaction set, which is shown in Table D.6, below.
In each row, the second column “Seg” gives the datasegment identifier for the data segment, followed by thename of the segment. The fourth column shows whether thesegment is mandatory or optional. The fifth column (Max)shows the maximum number of these data segments thatmay be present. The final column (Loop) shows whichsegments may be repeated.
For example, lines 120 through 160 all give informationabout an address, and all have a “1” in the Loop column.This means that if the sender wants to include more than oneaddress, each of these lines may be included. The “LoopRepeat-200” above line 120 indicates that as many as 200addresse lines may be included in one transaction set in thisway.

Appendix D: EDI 180 Transaction Set 253
Table D.6180 Transaction Set Table
180 - Return Merchandise Authorization and NotificationSegments
Pos Seg Name Req Max Loop TABLE 1010 ST Transaction Set Header M 1020 BGN Beginning Segment M 1030 RDR Return Disposition Reason O 1040 PRF Purchase Order Reference O 1050 DTM Date/Time Reference O 10060 N9 Reference Number O 10070 PER Administrative Communications Contact O 2080 ITA Allowance, Charge or Service O 10090 PKG Marking, Packaging, Loading O 5100 TD1 Carrier Details (Quantity and Weight) O 10110 TD5 Carrier Details (Routing Sequence/Transit Time) 0 10 LOOP ID-N1 Loop Repeat-200 1120 N1 Name O 1 1130 N2 Additional Name Information O 2 1140 N3 Address Information O 2 1150 N4 Geographic Location O 1 1160 PER Administrative Communications Contact O 5 1 LOOP ID-LM Loop Repeat-10 1170 LM Code Source Information O 1 1180 LQ Industry Code M 100 1 TABLE 2 LOOP ID-BLI Loop Repeat-500 1010 BLI Baseline Item Data O 1 1011 N9 Reference Number O 20 1020 PID Product/Item Description O 5 1030 RDR Return Disposition Reason O 1 1040 ITA Allowance, Charge or Service O 10 1050 PRF Purchase Order Reference O 1 1051 AT Financial Accounting O 1 1052 DTM Date/Time Reference O 15 1053 DD Demand Detail O 100 1054 GF Furnished Goods and Services O 1 1055 TD5 Carrier Details (Routing Sequence/Transit Time) O 5 1 LOOP ID-LM Loop Repeat-10 21056 LM Code Source Information O 1 21057 LQ Industry Code M 100 21 LOOP ID-N1 Loop Repeat-200 21060 N1 Name 0 1 21070 N2 Additional Name Information O 2 21

254 Rogers and Tibben-Lembke
080 N3 Address Information O 2 21090 N4 Geographic Location O 1 21100 PER Administrative Communications Contact O 5 21 LOOP ID-QTY Loop Repeat-1 21110 QTY Quantity O 1 21120 AMT Monetary Amount O 5 21130 DTM Date/Time Reference O 10 21140 N1 Name O 1 21 LOOP ID-LM Loop Repeat-10 321150 LM Code Source Information O 1 321160 LQ Industry Code M 100 321 LOOP ID-LX Loop Repeat-1 321170 LX Assigned Number O 1 321180 N9 Reference Number O 1 321190 DTM Date/Time Reference O 10 321200 N1 Name O 1 321 LOOP ID-LM Loop Repeat-10 4321210 LM Code Source Information O 1 4321220 LQ Industry Code M 100 4321230 SE Transaction Set Trailer M 1

Glossary 255
Glossary
“A” channel – the primary sales channel, carrying firstquality goods that have not been available elsewhere.
Advance Ship Notice (ASN) – EDI transaction that informsusers what, where, how, and when product isarriving.
Asset recovery – the classification and disposition ofsurplus, obsolete, scrap, waste and excess materialproducts, and other assets, in a way that maximizesreturns to the owner, while minimizing costs andliabilities associated with the dispositions.
“B” channel – secondary sales channel, for goods that havebeen through a reverse flow. Can carry first qualitygoods.
Barter companies – allow firms to get rid of unwantedinventories of first-quality and other goods, bytrading for other products or for commodities such asairline tickets or advertising time.
Brokers – In reverse logistics, brokers are firms specializingin products that are at the end of their sales life.Often, willing to purchase any product, in anycondition, given a low enough price. Often thecustomer of last resort for many returns.
Brown goods – electronics goods (such as computers,televisions, fax machines, and audio equipment).
Buy-out – when one manufacturer buys out a retailer'sinventory of another manufacturer's product. This

256 Rogers and Tibben-Lembke
allows the buying manufacturer to replace itscompetitor’s product with their own.
Cannibalization of demand – In reverse logistics,cannibalization of demand is when secondary marketsales reduce sales in the “A” channel.
Cannibalization of parts – when parts or components aretaken off of one item and used to repair or rebuildanother unit of the same product.
Centralized Return Center (CRC) – a facility where acompany's returns are processed.
Chargeback – a deduction from a vendor invoice forproduct return amount; sometimes occur withoutvendor permission.
Close-out liquidators – firms specializing in buying all of aretailer's product in some particular area; it usuallyhappens when a retailer decides to get out of aparticular area of business.
Controlled Tip – a sanitary landfill where refuse is sealed incells formed from earth or clay.
Core – a valuable and reusable part or subassembly that canbe remanufactured and sold as a replacement part;often found in the automotive industry.
Core charge – the amount charged by a supplier on aremanufacturable product to encourage the consumerto return the defective item being replaced.
Design For Disassembly (DFD) – designing a product so itcan be more easily disassembled at end-of-life.

Glossary 257
Design For Logistics (DFL) – designing a product tofunction better logistically. Taking into considerationhow the product will be handled, shipped, stored, etc.
Design For Manufacturing (DFM) – taking manufacturingconcerns into account when designing a product, toenable easy manufacturing, cost effectiveness, or ahigher standard of quality.
Design For Reverse Logistics (DFRL) – designing productsso that their return flow functions better; designingreverse logistics requirements into product andpackaging.
Disposition – how a product is disposed of, e.g. sold at anoutlet, sold to a broker, sent to a landfill, etc.
Disposition cycle time – the duration of time from an item’sinitial return, to the item reaching its final disposition.
Duales System Deutschland (DSD) – the Germanorganization responsible for collecting and recyclingconsumer packaging.
Electronic Data Interchange (EDI) – a system for business-to-business electronic communication.
Extended Producer Responsibility (EPR) – a requirementthat the original producer of an item is responsible forensuring its proper disposal.
Factory-renewed – a product that has been refurbished bythe manufacturer; typically carries a full new-productwarranty.

258 Rogers and Tibben-Lembke
Footprint – building size, in square feet. A large footprintstore requires a large number of square feet.
Gatekeeping – the screening of products entering thereverse logistics pipeline.
Gray market – products sold through unauthorized dealersor channels; generally do not carry a factorywarranty.
Green Dot – a symbol on packaging sold in Germany thatindicates that the product is eligible to be recycledthrough the Duales System Deutschland.
Green logistics – attempts to measure and minimize theecological impact of logistics activities.
High learning products – items that require education orinstruction before being able to operate; a computer,for example.
Insurance liquidators – secondary market companiesspecializing in buying products damaged in shipmentand declared as losses by insurance companies.
Investment recovery – see asset recovery.
Irregular – products that do not meet the standards for first-quality product, perhaps for cosmetic reasons, butwhich generally still satisfy most of the basicperformance requirements.
Job-out liquidators – secondary market companiesspecializing in buying end-of-season products fromretailers.

Glossary 259
Landfill – a controlled environment for burying municipalsolid waste.
Leachate – water that seeps through a landfill, picking uppollutants as it travels.
Liquidator – a secondary market company that buysproduct that has reached the end of its sales life in the“A” channel.
Lift – see buy-out.
Logistics – the process of planning, implementing, andcontrolling the efficient, cost-effective flow of rawmaterials, in-process inventory, finished goods, andrelated information from the point of origin to thepoint of consumption for the purpose of conformingto customer requirements.
Made-for-outlet – products made especially to be sold atoutlet stores; generally of slightly lower quality that“A” channel products.
Marketing returns – unsold product a supplier has agreedto take back from the retail customer; usuallyoverstocks; can be the result of product shipped to theretailer with the understanding that sales areguaranteed.
Municipal Solid Waste (MSW) – garbage generated byresidences and small businesses.
Non-defective defectives – when customers return aproduct claiming it to be defective, when in fact, theproblem is not with the product, but often with thecustomer's ability to properly operate the product.

260 Rogers and Tibben-Lembke
Non-defective returns – a non-defective defective returnedby a customer.
Outlet sales – products sold at an “outlet” store; typicallyirregular or off-season products.
Overstock – excess inventory; may be from ordering toomuch, order cancellations, or product's failure to sell.
Point Of Sale (POS) –the point where ownership of theproduct transfers to the customer.
Point-Of-Sale (POS) registration – collecting customerregistration information for warranty purposes at thetime the product is sold.
Partial returns credit – giving a customer a partial refundfor a product because not all components of theproduct are present.
Prebate – providing a discounted purchase price on aproduct linked to the promise not sell the product to aremanufacturer at the end of its life; paying thecustomer at the time of purchase for returning theproduct at end-of-life.
Preselling – contracting ahead of time (during the sellingseason) with a job-out company to purchase allremaining product at the end of the season.
Primary packaging – the first level of product packaging; forexample, the tube that toothpaste is packed in, or abottle that contains beer.

Glossary 261
Producer pays – the principle that the manufacturer shouldpay for ensuring the recycling and proper disposal ofproduct at end-of-life.
Reclaim materials –see recycling.
Reclamation centers – centralized processing facilities forreturns; term used widely in the grocery industry.
Reconditioning – when a product is cleaned and repaired toreturn it to a “like new” state.
Recycle – when a product is reduced to its basic elements,which are reused.
Refurbishing – similar to reconditioning, except withperhaps more work involved in repairing theproduct.
Remanufacturing – similar to refurbishing, but requiringmore extensive work; often requires completelydisassembling the product.
Re-returns –when a customer tries to return for full price aproduct that was sold as a returned product.
Resell – when a returned product may be sold again as new.
Restocking fee – a charge to the consumer for acceptingtheir returned product.
Return abuse – when a customer tries to return a product ata chain other than where they bought it, or for a pricehigher than what they paid for it, or after thewarranty period has expired.

262 Rogers and Tibben-Lembke
Returnable tote – transport packaging that can be usedmultiple times to move materials between or withinfacilities.
Return Authorization (RA) – authorization to return aproduct to a supplier.
Return Material Allowance (RMA) – authorization to returna product to a supplier.
Returns – products for which a customer wants a refundbecause the products either fail to meet his needs orfail to perform.
Returns allowance – the quantity of product that a customeris allowed to return; usually calculated as apercentage of total purchases.
Returns center – same as centralized return center.
Return to supplier – returning damaged products orcustomer returns to the vendor from whom they werepurchased.
Return To Vendor (RTV) – same as return to supplier.
Reusable tote – same as returnable tote.
Reuse – using a product again for a purpose similar to theone for which it was designed.
Reverse distribution – the process of bringing products orpackaging from the retail level through thedistributor back to the supplier or manufacturer.
Reverse logistics – the process of planning, implementing,and controlling the efficient, cost-effective flow of raw

Glossary 263
materials, in-process inventory, finished goods, andrelated information from the point of consumption tothe point of origin for the purpose of recapturingvalue or proper disposal.
Radio Frequency Identification (RFID) – a technology inwhich a tag is attached to each item which broadcastsa unique, low-frequency radio signal.
Return Material Authorization (RMA) – permission toreturn a product to a supplier.
Rotable parts – using a closed loop of repairable products;when a customer sends in a broken product, arepaired product is sent, and the customer's productis repaired and stored to be sent to another customer.
Salvage – when a product is sold to a broker or some otherlow-revenue customer.
Sanitary landfill – a landfill scientifically designed toprevent groundwater contamination from leachate.
Secondary market – a collection of companies that specializein selling products that have reached the end of theirselling season in the “A” channel.
Secondary packaging – the second level of productpackaging; for example, the box that contains a tubeof toothpaste, or the carton that holds six bottles ofbeer.
Secure disposal – requiring a company to destroy theproduct under the supervision of a security guard toensure the product is destroyed.

264 Rogers and Tibben-Lembke
Secure returns – a reverse logistics process designed tominimize leakage of product; secure returns processesare designed to eliminate shrinkage and unwantedproduct disposition.
Source reduction – reducing usage of resources at the pointof generation or production.
Supply chain position – the position in the channel that thefirm occupies; this position could be manufacturer,wholesaler, distributor, retailer, or combinations ofthese.
Take-back – requiring manufacturers to collect product atend-of-life to reclaim materials and dispose ofproperly.
Tipping fees – the cost of disposing of one ton of garbage ina landfill.
Transport packaging – packaging used for transportingproducts from manufacturers to distributors orretailers.
Two-dimensional bar coding – a bar coding technology thatallows much more information to be stored in a givenspace; instead of a single row of line, the bar codelabel consists of a two-dimensional grid of dots.
White goods – household appliances such as washers,dryers, refrigerators.
Zero returns – manufacturer never takes possession ofreturns. Destroyed in the field by retailer or thirdparty.

Glossary 265

Endnotes
Chapter 11 Bob Delaney, Ninth Annual State of Logistics Report, (St. Louis, MO:
Cass Logistics, 1998).2 Automotive Parts Rebuilders Association, Rebuilding/Remanufacturing:
Saving the World’s Environment, (Fairfax, VA: Automotive PartsRebuilders Association, 1998).
3 Lee, Louise, “Without a Receipt, You May Get Stuck With That UglyScarf,” Wall Street Journal, November 18, 1996, sec. 1, p. 1.
4 Annette Spence, “Hannadowns,” Sky Magazine, May 1998, pp. 107-111.
5 Richard L. Dawe, “Reengineer Your Returns,” Transportation andDistribution, August 1995, pp. 78-80.
Chapter 21 Martijn Thierry et al., “Strategic Issues in Product Recovery
Management,” California Management Review 37, no. 2, Winter 1995,pp. 114-135.
2 Ibid.
Chapter 31 “Outlet Malls: Do They Deliver the Goods?,” Consumer Reports,
August, 1998, pp. 20-25.2 Ibid.3 Interview with Herb Shear, GENCO Logistics System, Pittsburgh,
PA, March 20, 1997.
Chapter 41 Edward A McBean, Frank A. Rovers, and Grahame J. Farquhar, Solid
Waste Landfill Engineering and Design (Englewood Cliffs, New Jersey:Prentice Hall, 1995).
2 Ibid.

268 Rogers and Tibben-Lembke
3 Ibid.4 Walter H. Corson, The Global Ecology Handbook. (Boston: Beacon Press,
1990).5 O.P Kharbanda and E. A. Stallworthy, Waste Management: Towards a
Sustainable Society (New York: Auburn House, 1990).6 Environmental Protection Agency, Characterization of Municipal Solid
Waste in the United States: 1994 Update Executive Summary,(Washington, D.C.: U.S. Environmental Protection Agency, Nov.1994).
7 Environmental Protection Agency, List of Municipal Solid WasteLandfills, (Washington, D.C.: U.S. Environmental Protection Agency,1995).
8 Ibid.9 Environmental Protection Agency, Municipal Solid Waste Fact Book—
Internet Version, (Washington, D.C.: U.S. Environmental ProtectionAgency, 1997).
10 Environmental Protection Agency, Characterization of Municipal SolidWaste in the United States: 1996 Update,. (Washington, D.C.: U.S.Environmental Protection Agency, 1996).
11 Pennsylvania Department of Environmental Protection, AverageLandfill Tipping Fees for Municipal Solid Waste in Pennsylvania,(Harrisburg, PA: Pennsylvania Department of EnvironmentalProtection, 1996).
12 Jeff Bailey, “Arizona has Plenty of What Oceanside Needs and ViceVersa: So a Swap is Arranged—Sand to Spread on the Beach ForLoads of Garbage,” Wall Street Journal, March 4, 1997, sec. 1, p. A1.
13 Ibid.; and Mark Lifsher, “Ward Valley Waste Dump Isn't Economicalor Needed, Study Says,” Wall Street Journal, December 3, 1997.
14 Stacy Kravetz, “These People Search for Cup That Suits the Coffee itHolds,” Wall Street Journal, March 24, 1998, sec. 1, p. A1.
15 David Wallechinsky and Irving Wallace, The People's Almanac (NewYork : Doubleday & Company, Inc, 1975), p. 917.
16 William Rathje and Cullen Murphy. Rubbish: The Archaelology ofGarbage (New York: Harper Collins, 1992).
17 EPA Fact Book, 1997.

Endnotes 269
18 Institute of Scrap Recycling Industries, Recycling: The Economically andEnvironmentally Intelligent Alternative to Landfilling and Incineration,(Washington, D.C.: Institute of Scrap Recycling Industries, 1998).
19 EPA Fact Book, 1997.20 Edward A. McBean, et al.21 EPA Fact Book, 1997.22 California Integrated Waste Management Board, Solid Waste
Landfilling Data, (Sacramento, CA: California Integrated WasteManagement Board 1997).
23 EPA Fact Book, 1997.24 Ibid.25 Robert Steuteville, Nora Goldstein, and Kurt Grotz, “The State of
Garbage in America,” BioCycle, 34, June 1993, pp. 32- 37.26 Ibid.27 Brian Cunningham and James R. Distler, “Reverse Logistics Shock,”
in Council of Logistics Management, Annual Conference Proceedings,(Chicago, IL: Council of Logistics Management, 1997), pp. 423-426.
28 Advanced Recovery, CRT Recycling, (Belleville, NJ: AdvancedRecovery, 1998).
29 Cheryl L. McAdams, “Resurrecting the Computer Graveyard,” WasteAge, Feb. 1995.
30 Steve Lohr, “Recycling Answer Sought for Computer Junk,” New YorkTimes, April 14, 1994.
31 Steve Anzovin, “The Green PC Revisited,” Dallas/Fort Worth ComputerCurrents, December, 1997, pp. 38-45.
32 Daniel Machalaba, “Hitting the Skids: As Old Pallets Pile Up, CriticsHammer them as New Eco-Menace,” Wall Street Journal, April 1, 1998,sec. 1, p. A1.
33 Steueteville, et al., p. 34.34 National Wooden Pallet & Container Association, Recycling Solutions
for Pallet Disposal, (Arlington, VA: National Wooden Pallet &Container Association, 1996).
35 Raymond Communications, Transportation Packaging and theEnvironment, (College Park, MD: Raymond Communications, 1997).

270 Rogers and Tibben-Lembke
36 Minnesota Mining and Manufacturing Corp., 3M Gives Business anEco-Advantage, (St. Paul, MN: Minnesota Mining and ManufacturingCorp., 1997).
37 Tom Andel, “It's a Two-Way Stream: Logistics Packaging is FlowingBack to Suppliers for Re-use, and Recycling,” Transportation andDistribution, December, 1997, pp. 81-91.
38 Raymond Communications, 1997.39 Lori Kampschroer, James Rust, James G. Thompson, Diana Twede,
and Steve Vagsnes, “Do Returnable Containers for Large FinishedGoods Make Sense?,” Council of Logistics Management AnnualConference, October 21, 1996.
40 Diana Twede, “Do Returnable Containers for Large Finished GoodsMake Sense? Returnable Packaging Considerations” in Council ofLogistics Management, Annual Conference Proceedings, (Orlando, FL:Council of Logistics Management, 1996), pp. 585-587.
41 “Consumer Polystyrene Recycling Faces Challenges,” State RecyclingLaws Update, Oct.-Nov. 1997, p. 6.
42 Ibid.43 Ibid.44 Ibid.45 Ebora Vrana, “EarthShell IPO: Will Investors Contain their
Enthusiasm?,” Los Angeles Times, March 13, 1998, sec. 2, p. B1.46 Ibid.47 Amy Zuckerman, “Recyclable Containers: Recycling Packaging
Materials Became a Trend 'Because it Costs so Much More to TakeOut the Garbage' ,” Traffic World, February 17, 1997.
48 A.R. van Goor and D.C. Loa, Research on the RVT Supply Chain Modelfor Dry Grocery Goods, (Amsterdam: Amsterdam Free University,Faculty of Economic Science and Business Administration,Department of Logistics, 1995).
49 Gary A. Davis, Catherine A. Wilt, Patricia S. Dillon, and Bette K.Fishbein, “Extended Product Responsibility: A New Principle forProduct-Oriented Pollution Prevention.” (Washington, D.C.: U.S.Environmental Protection Agency, Office of Solid Waste, June, 1997).
50 Ibid.51 Steueteville, et al., p. 35.

Endnotes 271
52 Colleen Mizuki, et al., Electronics Industry Environmental Roadmap:Electronics Products Recycling Study, (Austin, TX: Microelectronics andComputer Technology Corporation, 1996).
53 Microelectronics and Computer Technology Corporation, TheUniversity of Texas and MCC Collaborate to Develop Comprehensive Planfor Electronics Products Recycling, (Austin, TX: Microelectronics andComputer Technology Corporation, 1997).
54 “Results from Residential End-of-Life Electronics Collection Pilots areForthcoming,” EPR2 Update, [Washington, D.C.: The ElectronicProduct Recovery and Recycling Project of the Environmental HealthCenter, a division of The National Safety Council], Winter, 1998.
55 Wall Street Journal, “Business Beat: Big Blue Goes Green,” July 10,1997, sec. 1, p. A1.
56 G. Pascal Zachary, “Why We Can’t Part with those Vintage PCs,”Wall Street Journal, July 2, 1997, sec. 2, p. B1.
Chapter 51 Duales System Deutschland, Why do companies become licensees of the
Dual System? (Cologne, Germany: Duales System Deutschland AG,1997).
2 Frank Ackerman, Why do We Recycle?: Markets, Values, and PublicPolicy, (Washington, D.C.: Island Press, 1997).
3 Ibid., 1998.4 Duales System Deutschland, Packaging Recycling: Techniques and
Trends, (Cologne, Germany: Duales System Deutschland AG, 1998).5 Ibid.6 “German Packaging Recovery Rate up in 1997,” Environment Daily,
[London], May 25, 1997.7 Robert Steuteville, Nora Goldstein, and Kurt Grotz, “The State of
Garbage in America,” BioCycle, 34, June 1993, p. 33.8 Ackerman.9 Steueteville, et al., p. 35.10 Ackerman.11 Ibid.12 Matthew Gandy, Recycling and the Politics of Urban Waste (New York:
St.Martin's Press, 1994).

272 Rogers and Tibben-Lembke
13 Ackerman.14 Gandy.15 Raymond Communications, “Getting Green Dotted: The German
Recycling Law Explained in Plain English,” (Riverdale, MD:Raymond Communications, 1998).
16 “German Packaging Recovery System Challenged,” EnvironmentDaily, [London] May 5, 1998.
17 Raymond Communications, Transportation Packaging and theEnvironment, (College Park, MD: Raymond Communications, 1997).
18 Andreas von Schoenberg and Sascha Kranendonk, DSD: Industry-runpackaging waste reduction system (Wuppertal, Germany: WuppertalInstitute, 1995).
19 “TV’s Too Expensive to Collect, Study Finds,” Recycling LawsInternational, Sept. 1997, pp. 5-6.
20 “Progress Made on EU Electronics Waste Plan,” Environment Daily,[London] April 28, 1998.
21 “EC Moves on Electronics Waste Directive,” Recycling LawsInternational, Sept. 1997, p. 5.
22 Environment Daily, “Progress Made on EU Electronics Waste Plan.”23 “Electronics Recycling Discussed by EU States,” Environment Daily,
[London] May 27, 1998.24 “Firms Criticize Draft EU Electrical Waste Law,” Environment Daily,
[London] June 23, 1998.25 “EU Retailers Oppose Electronics Take-Back Plan,” Environment
Daily, [London] June 29, 1998.26 “Norway to Require Electronics Waste Take-Back,” Environment
Daily, [London] March 16, 1998.27 “Industries Query Viability of Take-Back Law,” Environment Daily,
[London] May 7, 1998.28 Recycling Laws International, “TV’s Too Expensive to Collect, Study
Finds.”29 “Netherlands forces Appliance Take-Back,” Environment Daily,
[London] March 19, 1998; and Environment Daily, “Industries QueryViability of Take-Back Law.”
30 “EU end-of-life Vehicles Proposal Released,” Environment Daily,[London] July 7, 1997.

Endnotes 273
31 “EU Car Firms Oppose End-Of-Life Vehicle Plan,” Environment Daily,[London] July 21, 1997.
32 Ibid.33 “Car Dismantlers Support EU Recycling Plan,” Environment Daily,
[London] April 21, 1997.34 “UK Voluntary Car Recycling Deal Struck,” Environment Daily,
[London] July 15, 1997.35 Auto Recycling Nederland, Environmental Report: Facts and Figures,
(Amsterdam: Auto Recycling Nederland BV, 1996).36 “Sweden Requires Free Take-Back for New Cars,” Environment Daily,
[London] October 27, 1997.37 “Battery Directive Would Ban Ni-cd’s,” Recycling Laws International,
September 1997, p. 5.38 Varta AG, Varta Sets Out its Position in Response to the Upcoming
German Battery Order, (Hannover, Germany: Varta AG, April 30,1997).
39 “Battery Take-Back Moving,” Recycling Laws International, September1997, p. 5.
40 “Sweden: Industry Wrist-Slap,” Recycling Laws International,September 1997, p. 5.
Chapter 6
1 Richard J. Kish, ”The Returns Task Force,” 1997 Book Industry Trends,in Chapter 1: ”Issue of the Year: Returns” (New York: Book IndustryStudy Group, 1997).
2 G. Bruce Knecht, “Macmillan’s Order to Use Wholesalers AngersBooksellers,” Wall Street Journal, September 5, 1997, sec. 2, p. B4.
3 I. Jeanne Dugan, “Boldly Going Where Others are Bailing Out,”Business Week, April 6, 1998, p. 46.
4 Elizabeth Lesly Stevens and Ronald Grover, “The EntertainmentGlut,” Business Week, February 16, 1998, p. 93.
5 Kish.6 Ibid.; and Doreen Carvajal, “Returns are Swamping the Publishing
Industry,” New York Times, August 1, 1996.

274 Rogers and Tibben-Lembke
7 Hardy Green , ”Superstores, Megabooks—and HumongousHeadaches: With sales flat and returns piling up, many publishers aresmarting,” Business Week, April 14, 1997, pp. 92-94.
8 Kish.9 Doreen Carvajal, “Publishers Seek Advice from Bookstore Chains,”
New York Times, August 12, 1997; and Barbara Carton, “BookstoreSurvival Stunts Have Scant Literary Merit,” Wall Street Journal June 3,1997, sec. 2, p. B1.
10 Cindy Hall and Dave Merrill, “USA Snapshots: The Word onDiscount Books,” USA Today, October 9, 1997.
11 Bruce G. Knecht, “Chain Reaction: Book Superstores BringHollywood-Like Risks to Publishing Business,” Wall Street Journal,March 24, 1997, sec. 1, p. A1.
12 Cynthia Crossen, “Put a Pen to Paper These Days, You'll be aPublished Author,” Wall Street Journal, January 10, 1996, sec. 2, p. B1.
13 Dugan.14 “Carnegie Mellon University Updates Computer Disposition Data,”
EPR2 Update, [Washington, D.C.: The Electronic Product Recoveryand Recycling Project of the Environmental Health Center, a divisionof The National Safety Council], Summer, 1997.
15 Raju Narisetti, “Printer Wars: Toner Discount Incites Rivals,” WallStreet Journal, April 10, 1998, sec. 2, p. B1.
16 Institute of Scrap Recycling Industries, Recycling: The Economically andEnvironmentally Intelligent Alternative to Landfilling and Incineration,(Washington, D.C.: Institute of Scrap Recycling Industries, 1998).
17 Willam P. Steinkuller, “Recycling or Reuse: The Long and Short of it.”Ward’s Auto World 30, April 1994, p. 16.
18 Drew Winter, “Ship Ahoy! Automakers Sail Into Recycling,” Ward'sAuto World 29, September 1993, p. 64.
19 Gene Bylinski, “Manufacturing for Reuse,” Forbes 131, February 6,1995.
20 Ibid.21 Winter, p. 64.22 Lindsay Brooke, “The Recyclability Gap,” Automotive Industries 174,
February 1994.

Endnotes 275
23 Warren Brown, “Chrysler Close to Turning Recyclables Into a Car,”Washington Post, September 9, 1997, sec. 3, p. C3.
24 Tom Werner, “Blue Chip Products Isn't Blue–It's in the Chips,”Philadelphia Business Journal 11, February 15, 1993.
25 “Ford Picks 'Core' Carrier,” Purchasing 119, July 13, 1995, p. 101.26 “Auto Parts Remanufacturer Tunes up with Symbol/True Data,"
Industrial Engineering 25, October 1993, p. 34.