REVENUE FORECASTS · Interim Revenue Forecasts Bureau of Finance and Management 2 GENERAL FUND...
24
REVENUE FORECASTS 2018 Interim July 25, 2018
Transcript of REVENUE FORECASTS · Interim Revenue Forecasts Bureau of Finance and Management 2 GENERAL FUND...

REVENUE
FORECASTS
2018 Interim July 25, 2018
Interim Revenue Forecasts Bureau of Finance and Management i
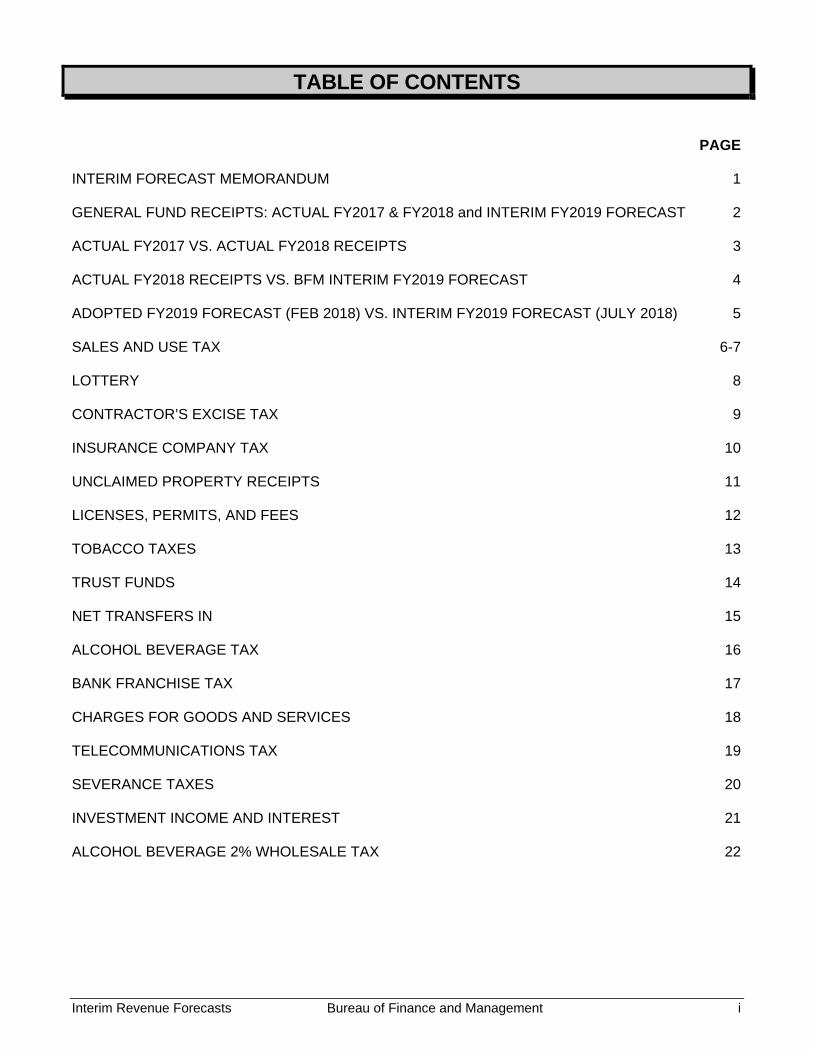
TABLE OF CONTENTS
PAGE INTERIM FORECAST MEMORANDUM 1 GENERAL FUND RECEIPTS: ACTUAL FY2017 & FY2018 and INTERIM FY2019 FORECAST 2 ACTUAL FY2017 VS. ACTUAL FY2018 RECEIPTS 3 ACTUAL FY2018 RECEIPTS VS. BFM INTERIM FY2019 FORECAST 4 ADOPTED FY2019 FORECAST (FEB 2018) VS. INTERIM FY2019 FORECAST (JULY 2018) 5 SALES AND USE TAX 6-7 LOTTERY 8 CONTRACTOR’S EXCISE TAX 9 INSURANCE COMPANY TAX 10 UNCLAIMED PROPERTY RECEIPTS 11 LICENSES, PERMITS, AND FEES 12 TOBACCO TAXES 13 TRUST FUNDS 14 NET TRANSFERS IN 15 ALCOHOL BEVERAGE TAX 16 BANK FRANCHISE TAX 17 CHARGES FOR GOODS AND SERVICES 18 TELECOMMUNICATIONS TAX 19 SEVERANCE TAXES 20 INVESTMENT INCOME AND INTEREST 21 ALCOHOL BEVERAGE 2% WHOLESALE TAX 22

Interim Revenue Forecasts Bureau of Finance and Management 1
M E M O R A N D U M
TO: Governor Dennis Daugaard and Interim Joint Committee on Appropriations
FROM: Jim Terwilliger, Deputy Commissioner Bureau of Finance and Management
SUBJECT: Interim FY2019 Revenue Projections DATE: July 25, 2018
In accordance with the provisions of SDCL 4-8A-16, the following report includes actual revenue for FY2017 and FY2018 and updated revenue projections for FY2019 for the various sources of revenue that flow to the state general fund.
The updated FY2019 revenue estimates from the Bureau of Finance and Management total $1,641,840,477 on an ongoing basis. This updated projection is $294,793 or 0.02 percent higher than the Legislative Adopted FY2019 estimate. Since this most recent forecast is higher than the Adopted FY2019 budgeted level, there is no shortfall in the current fiscal year at this time and no further action is necessary per SDCL 4-8A-16.
Interim Revenue Forecasts Bureau of Finance and Management 2
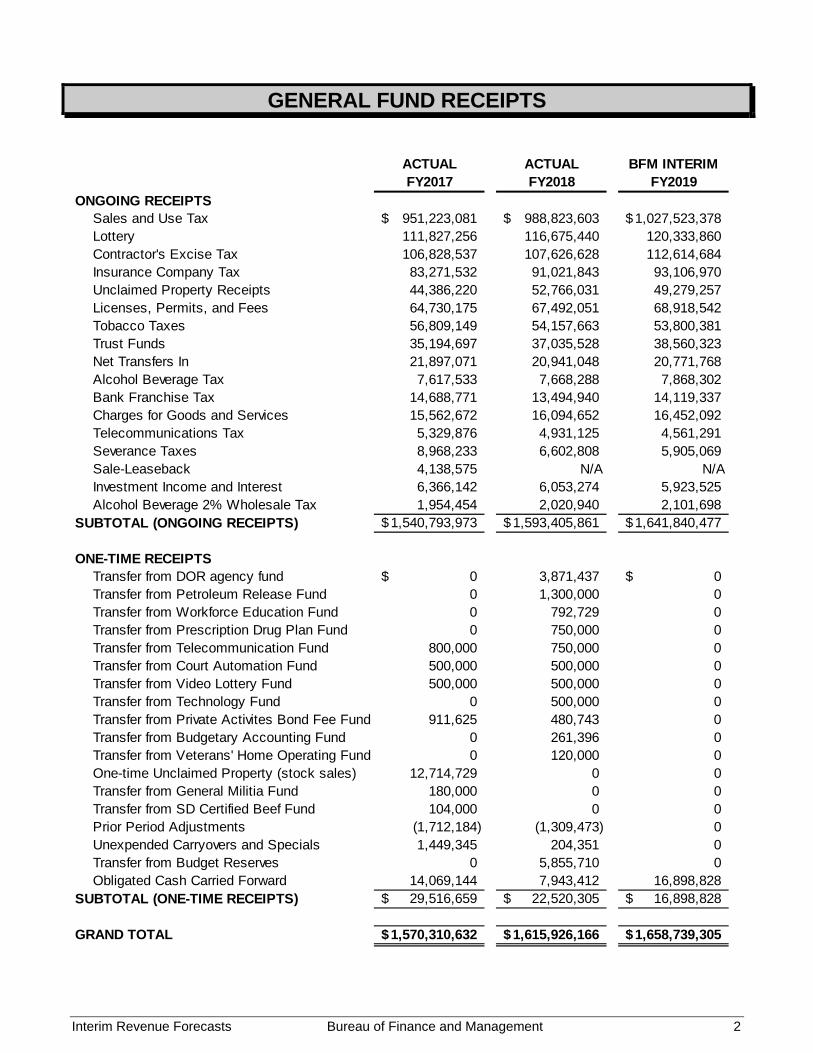
GENERAL FUND RECEIPTS
ACTUAL ACTUAL BFM INTERIMFY2017 FY2018 FY2019
ONGOING RECEIPTSSales and Use Tax 951,223,081$ 988,823,603$ 1,027,523,378$ Lottery 111,827,256 116,675,440 120,333,860Contractor's Excise Tax 106,828,537 107,626,628 112,614,684Insurance Company Tax 83,271,532 91,021,843 93,106,970Unclaimed Property Receipts 44,386,220 52,766,031 49,279,257Licenses, Permits, and Fees 64,730,175 67,492,051 68,918,542Tobacco Taxes 56,809,149 54,157,663 53,800,381Trust Funds 35,194,697 37,035,528 38,560,323Net Transfers In 21,897,071 20,941,048 20,771,768Alcohol Beverage Tax 7,617,533 7,668,288 7,868,302Bank Franchise Tax 14,688,771 13,494,940 14,119,337Charges for Goods and Services 15,562,672 16,094,652 16,452,092Telecommunications Tax 5,329,876 4,931,125 4,561,291Severance Taxes 8,968,233 6,602,808 5,905,069Sale-Leaseback 4,138,575 N/A N/AInvestment Income and Interest 6,366,142 6,053,274 5,923,525Alcohol Beverage 2% Wholesale Tax 1,954,454 2,020,940 2,101,698
SUBTOTAL (ONGOING RECEIPTS) 1,540,793,973$ 1,593,405,861$ 1,641,840,477$
ONE-TIME RECEIPTSTransfer from DOR agency fund 0$ 3,871,437 0$ Transfer from Petroleum Release Fund 0 1,300,000 0Transfer from Workforce Education Fund 0 792,729 0Transfer from Prescription Drug Plan Fund 0 750,000 0Transfer from Telecommunication Fund 800,000 750,000 0Transfer from Court Automation Fund 500,000 500,000 0Transfer from Video Lottery Fund 500,000 500,000 0Transfer from Technology Fund 0 500,000 0Transfer from Private Activites Bond Fee Fund 911,625 480,743 0Transfer from Budgetary Accounting Fund 0 261,396 0Transfer from Veterans' Home Operating Fund 0 120,000 0One-time Unclaimed Property (stock sales) 12,714,729 0 0Transfer from General Militia Fund 180,000 0 0Transfer from SD Certified Beef Fund 104,000 0 0Prior Period Adjustments (1,712,184) (1,309,473) 0Unexpended Carryovers and Specials 1,449,345 204,351 0Transfer from Budget Reserves 0 5,855,710 0Obligated Cash Carried Forward 14,069,144 7,943,412 16,898,828
SUBTOTAL (ONE-TIME RECEIPTS) 29,516,659$ 22,520,305$ 16,898,828$
GRAND TOTAL 1,570,310,632$ 1,615,926,166$ 1,658,739,305$

Interim Revenue Forecasts Bureau of Finance and Management 3
ACTUAL FY2017 vs. ACTUAL FY2018 RECEIPTS
ACTUAL ACTUAL DOLLAR PERCENT FY2017 FY2018 CHANGE CHANGE
ONGOING RECEIPTSSales and Use Tax 951,223,081$ 988,823,603$ 37,600,523$ 3.95Lottery 111,827,256 116,675,440 4,848,184 4.34Contractor's Excise Tax 106,828,537 107,626,628 798,091 0.75Insurance Company Tax 83,271,532 91,021,843 7,750,311 9.31Unclaimed Property Receipts 44,386,220 52,766,031 8,379,811 18.88Licenses, Permits, and Fees 64,730,175 67,492,051 2,761,876 4.27Tobacco Taxes 56,809,149 54,157,663 (2,651,486) (4.67)Trust Funds 35,194,697 37,035,528 1,840,831 5.23Net Transfers In 21,897,071 20,941,048 (956,023) (4.37)Alcohol Beverage Tax 7,617,533 7,668,288 50,754 0.67Bank Franchise Tax 14,688,771 13,494,940 (1,193,831) (8.13)Charges for Goods and Services 15,562,672 16,094,652 531,980 3.42Telecommunications Tax 5,329,876 4,931,125 (398,751) (7.48)Severance Taxes 8,968,233 6,602,808 (2,365,425) (26.38)Sale-Leaseback 4,138,575 0 (4,138,575) (100.00)Investment Income and Interest 6,366,142 6,053,274 (312,868) (4.91)Alcohol Bev 2% Wholesale Tax 1,954,454 2,020,940 66,486 3.40
TOTAL (ONGOING RECEIPTS) 1,540,793,973$ 1,593,405,861$ 52,611,888$ 3.41
ONE-TIME RECEIPTSTransfer from DOR agency fund 0$ 3,871,437$ 3,871,437$ 100.00Transfer from Petroleum Release Fund 0 1,300,000 1,300,000 100.00Transfer from Workforce Education Fund 0 792,729 792,729 100.00Transfer from Prescription Drug Plan Fund 0 750,000 750,000 100.00Transfer from Telecommunication Fund 800,000 750,000 (50,000) (6.25)Transfer from Court Automation Fund 500,000 500,000 0 0.00Transfer from Video Lottery Fund 500,000 500,000 0 0.00Transfer from Technology Fund 0 500,000 500,000 100.00Transfer from Private Activites Bond Fee Fund 911,625 480,743 (430,882) (47.27)Transfer from Budgetary Accounting Fund 0 261,396 261,396 100.00Transfer from Veterans' Home Operating Fund 0 120,000 120,000 100.00One-time Unclaimed Property (stock sales) 12,714,729 0 (12,714,729) (100.00)Transfer from General Militia Fund 180,000 0 (180,000) (100.00)Transfer from SD Certified Beef Fund 104,000 0 (104,000) (100.00)Prior Period Adjustments (1,712,184) (1,309,473) 402,711 (23.52)Unexpended Carryovers and Specials 1,449,345 204,351 (1,244,994) (85.90)Transfer from Budget Reserves 0 5,855,710 5,855,710 100.00Obligated Cash Carried Forward 14,069,144 7,943,412 (6,125,732) (43.54)
SUBTOTAL (ONE-TIME RECEIPTS) 29,516,659$ 22,520,305$ (6,996,354)$ (23.70)
GRAND TOTAL 1,570,310,632$ 1,615,926,166$ $45,615,533 2.90

Interim Revenue Forecasts Bureau of Finance and Management 4
ACTUAL FY2018 RECEIPTS VS. INTERIM FY2019 FORECAST
ACTUAL BFM INTERIM DOLLAR PERCENT FY2018 FY2019 CHANGE CHANGE
ONGOING RECEIPTSSales and Use Tax 988,823,603$ 1,027,523,378$ 38,699,775$ 3.91Lottery 116,675,440 120,333,860 3,658,420 3.14Contractor's Excise Tax 107,626,628 112,614,684 4,988,056 4.63Insurance Company Tax 91,021,843 93,106,970 2,085,127 2.29Unclaimed Property Receipts 52,766,031 49,279,257 (3,486,774) (6.61)Licenses, Permits, and Fees 67,492,051 68,918,542 1,426,491 2.11Tobacco Taxes 54,157,663 53,800,381 (357,282) (0.66)Trust Funds 37,035,528 38,560,323 1,524,795 4.12Net Transfers In 20,941,048 20,771,768 (169,280) (0.81)Alcohol Beverage Tax 7,668,288 7,868,302 200,014 2.61Bank Franchise Tax 13,494,940 14,119,337 624,397 4.63Charges for Goods and Services 16,094,652 16,452,092 357,440 2.22Telecommunications Tax 4,931,125 4,561,291 (369,834) (7.50)Severance Taxes 6,602,808 5,905,069 (697,739) (10.57)Investment Income and Interest 6,053,274 5,923,525 (129,749) (2.14)Alcohol Bev 2% Wholesale Tax 2,020,940 2,101,698 80,758 4.00
TOTAL (ONGOING RECEIPTS) 1,593,405,861$ 1,641,840,477$ 48,434,616$ 3.04
ONE-TIME RECEIPTSTransfer from DOR agency fund 3,871,437$ 0$ (3,871,437)$ (100.00)Transfer from Petroleum Release Fund 1,300,000 0 (1,300,000) (100.00)Transfer from Workforce Education Fund 792,729 0 (792,729) (100.00)Transfer from Prescription Drug Plan Fund 750,000 0 (750,000) (100.00)Transfer from Telecommunication Fund 750,000 0 (750,000) (100.00)Transfer from Court Automation Fund 500,000 0 (500,000) (100.00)Transfer from Video Lottery Fund 500,000 0 (500,000) (100.00)Transfer from Technology Fund 500,000 0 (500,000) (100.00)Transfer from Private Activites Bond Fee Fund 480,743 0 (480,743) (100.00)Transfer from Budgetary Accounting Fund 261,396 0 (261,396) (100.00)Transfer from Veterans' Home Operating Fund 120,000 0 (120,000) (100.00)One-time Unclaimed Property (stock sales) 0 0 0 (100.00)Transfer from General Militia Fund 0 0 0 (100.00)Transfer from SD Certified Beef Fund 0 0 0 (100.00)Prior Period Adjustments (1,309,473) 0 1,309,473 (100.00)Unexpended Carryovers and Specials 204,351 0 (204,351) (100.00)Transfer from Budget Reserves 5,855,710 0 (5,855,710) (100.00)Obligated Cash Carried Forward 7,943,412 16,898,828 8,955,416 112.74
SUBTOTAL (ONE-TIME RECEIPTS) 22,520,305$ 16,898,828$ (5,621,477)$ (24.96)
GRAND TOTAL 1,615,926,166$ 1,658,739,305$ $42,813,139 2.65

Interim Revenue Forecasts Bureau of Finance and Management 5
ADOPTED FY2019 FORECAST VS. INTERIM FY2019 FORECAST
LEG. ADOPTED BFM INTERIM DOLLAR PERCENT FY2019 FY2019 CHANGE CHANGE
ONGOING RECEIPTSSales and Use Tax 1,029,090,230$ 1,027,523,378$ (1,566,852)$ (0.15)Lottery 120,659,812 120,333,860 (325,952) (0.27)Contractor's Excise Tax 111,415,004 112,614,684 1,199,680 1.08Insurance Company Tax 90,176,480 93,106,970 2,930,490 3.25Unclaimed Property Receipts 49,505,508 49,279,257 (226,251) (0.46)Licenses, Permits, and Fees 67,934,656 68,918,542 983,886 1.45Tobacco Taxes 54,514,454 53,800,381 (714,073) (1.31)Trust Funds 38,618,079 38,560,323 (57,756) (0.15)Net Transfers In 21,006,868 20,771,768 (235,100) (1.12)Alcohol Beverage Tax 8,159,825 7,868,302 (291,523) (3.57)Bank Franchise Tax 13,708,579 14,119,337 410,758 3.00Charges for Goods and Services 17,000,000 16,452,092 (547,908) (3.22)Telecommunications Tax 4,385,195 4,561,291 176,096 4.02Severance Taxes 7,082,431 5,905,069 (1,177,362) (16.62)Investment Income and Interest 6,050,000 5,923,525 (126,475) (2.09)Alcohol Bev 2% Wholesale Tax 2,238,563 2,101,698 (136,865) (6.11)
TOTAL (ONGOING RECEIPTS) 1,641,545,684$ 1,641,840,477$ 294,793$ 0.02
ONE-TIME RECEIPTSObligated Cash Carried Forward 0 16,898,828 16,898,828 100.00
SUBTOTAL (ONE-TIME RECEIPTS) -$ 16,898,828$ 16,898,828$ 100.00
GRAND TOTAL 1,641,545,684$ 1,658,739,305$ $17,193,621 1.05

Interim Revenue Forecasts Bureau of Finance and Management 6
SALES AND USE TAX FY2018 Performance: In FY2018, total sales and use tax collections were $988.8 million which was an increase of 4.0% or $37.6 million over FY2017. Sales and use tax audit collections (which are included in the total) for FY2018 were $12.8 million compared to $15.2 million in FY2017. Actual FY2018 collections were $2.8 million lower than the most recent revised adopted estimate.
The average annual increase in collections between FY2010 and FY2018 was 5.3%. Net collections from the sales and use tax account for approximately 62% of ongoing general
fund revenues in FY2018.
600.0650.0700.0750.0
800.0850.0900.0950.0
1,000.01,050.0
FY10FY11
FY12FY13
FY14FY15
FY16FY17
FY18FY19
Millions Forecast
Estimate: Due to the broad nature of the sales and use tax, there are many different variables influencing collections including employment, income, the unemployment rate, inflation, etc. To quantify these theories, regression equations are used to see if historically there has been a statistically significant relationship between these and other variables and sales and use tax collections. The sales and use tax data is divided into five different categories to account for the broad base of the sales and use tax. Independent variables are then used in the equations to see if historically a statistically significant relationship between them and taxable sales has existed. After finding the best fitting regression equation for each of the five categories, sales and use tax collections are forecasted. The regression equations used in the forecast, the coefficient of determination (R2) associated with the equations, and a brief explanation of how to read regression equations are below.
Equation 1: Consumer Spending on Durables and Services (STCDS) STCDS = -294.65+ 0.07*SD Nonfarm Income + 204.56*Seasonal Dummy + 9.66*SD Manufacturing Employment + 24.01*SD Housing Starts R2 = .9942
Equation 2: Business Related Purchases/Consumer Spending on Nondurables (STBUSCND) STBUSCND = -2,507.53 + 7.58 * SD Nonfarm Employment +272.13*Seasonal Dummy + 0.63*Exports + 673.49*CPIF + 0.02 * Farm Proprietors Income
R2 = .9939
Equation 3: Construction Related Purchases (STCON) STCON = -545.29+ 26.24*SD Construction Employment + 0.01*(SD Nonfarm Income*Seasonal dummy) + 7.41*SD Housing Starts + 0.05*Wage and Salary Disbursements + 0.03*Farm Proprietors Income (lagged) R2 = .9862

Interim Revenue Forecasts Bureau of Finance and Management 7
Equation 4: Recreation Related Purchases (STREC) STREC = -3.68 + 0.03*SD Nonfarm Income + 2.80* SD Leisure and Hospitality Employment + 0.01*(SD Disposable Income*Seasonal Dummy) – 0.56*oil prices. R2 = .9950 Equation 5: Utilities (STUTI) STUTI = 79.06 + 0.02*SD Nonfarm Income + 2.88*Consumer Spending on Electricity and Natural Gas + 0.02 * SD Farm Proprietors Income. R2 = .9862
Collection Equation: Sales Tax Collections = -2.3 + 0.045*Total Taxable Sales
R2 =.9917 Basic steps to follow when reading a regression equation are:
1.) Identify the dependent variable (the variable on the left side of the equation) and the independent variables (the variables on the right side of the equation).
2.) Look at the signs of the independent variables. The signs tell you if there is a positive or a negative relationship between the dependent and the independent variable.
3.) Look at the numbers in front of the independent variables. They quantify the change in the dependent variable if there is a one unit change in the independent variable, holding the other independent variables constant.
4.) Look at the R2. This is one way to identify how well an equation fits the data. An R2 value close to one tells you that the equation has a good overall fit.
Interim Estimate for FY2019
Base Sales and Use Tax
Collections
1,015,608,576 + Audit Collections 14,404,671
+ Boat Tax + Off-Road Vehicle Excise Tax
+Mobile Home Tax = Base Estimate
2,145,281 1,629,236
258,171 1,034,045,934
- DOR Indirect Funding (6,522,557) = Net Sales Tax Estimate 1,027,523,378
Actual FY2017
Actual FY2018
Interim Estimate FY2019
Total Receipts 951,223,081 988,823,603 1,027,523,378 Dollar Change 90,317,376 37,600,523 38,699,774 Percent Change 10.49 3.95 3.91

Interim Revenue Forecasts Bureau of Finance and Management 8
LOTTERY FY2018 Performance: Receipts to the general fund from the lottery category totaled $116.7 million in FY2018. Video lottery receipts totaled $109.0 million, which was an increase of $4.1 million or 3.9% over FY2017. Receipts from on-line and instant tickets totaled $7.7 million, which was up $0.7 million or 10.4% compared to FY2017.
All of the net proceeds from the sale of instant lottery tickets are deposited in the general fund. The first $1.4 million of the net proceeds from the sale of on-line lottery tickets are deposited in
the general fund in FY2018 and prior years, with the remaining net proceeds from the sale of on-line lottery tickets are deposited in the Capital Construction Fund.
Beginning in FY2019 through FY2023, the net proceeds from on-line lottery funds to the general fund will increase pursuant to the passage of SB 183 from the 2018 legislative session.
Receipts included in this category account for approximately 7.3% of ongoing general fund revenues in FY2018.
0.0
20.0
40.0
60.0
80.0
100.0
120.0
140.0
FY10FY11
FY12FY13
FY14FY15
FY16FY17
FY18FY19
MillionsForecast
Estimate: The estimates are based on historical collections, current conditions and information provided by the South Dakota Lottery.
Actual FY2017
Actual FY2018
Interim Estimate FY2019
Instant Lottery 5,577,739 6,300,942 5,585,000 Online Lottery 1,400,000 1,400,000 2,050,000 Video Lottery 104,849,517 108,974,498 111,698,860 Total Receipts 111,827,256 116,675,440 120,333,860 Dollar Change 1,769,987 4,848,184 3,658,420 Percent Change 1.61 4.34 3.14

Interim Revenue Forecasts Bureau of Finance and Management 9
CONTRACTOR’S EXCISE TAX FY2018 Performance: In FY2018, net contractor’s excise tax collections were $107.6 million, which was an increase of 0.7% or $0.8 million over FY2017. Actual FY2018 collections were $0.9 million higher than the most recent revised legislative adopted estimate.
The average annual increase in net contractor’s excise tax collections between FY2010 and FY2018 was 4.99%.
Net collections from the contractor’s excise tax account for approximately 6.8% of ongoing general fund receipts in FY2018.
0.0
20.0
40.0
60.0
80.0
100.0
120.0
FY10FY11
FY12FY13
FY14FY15
FY16FY17
FY18FY19
MillionsForecast
Estimate: Contractor’s excise tax collections are estimated using a single regression equation. The equation and its coefficient of determination are below. (An explanation of how to read a regression equation can be found on page 7.) Contractor’s Excise Tax Collections = - 44.90 + 1.80*SD Construction, Natural Resources, and Mining Employment + 0.01*(Seasonal Dummy*SD nonfarm income) – 1.92*SD Unemployment Rate + 4.40*Price Index for Metal Materials and Wood Products + 12.46*Consumer Price Index + 0.43*SD Housing Starts R2 = .9935
Actual
FY2017 Actual FY2018
Interim Estimate FY2019
Total Net Receipts 106,828,537 107,626,628 112,614,684 Dollar Change 5,331,986 798,091 4,988,056 Percent Change 5.25 0.75 4.63

Interim Revenue Forecasts Bureau of Finance and Management 10
INSURANCE COMPANY TAX FY2018 Performance: In FY2018, insurance company tax collections totaled $91.0 million, which was up 9.3% or $7.8 million from FY2017. Actual FY2018 collections were $3.7 million higher than the most recent legislative adopted estimates.
The average annual increase between FY2010 and FY2018 was 4.97%. Collections from this tax account for approximately 5.7% of ongoing general fund revenues in
FY2018.
50.0
60.0
70.0
80.0
90.0
100.0
FY10FY11
FY12FY13
FY14FY15
FY16FY17
FY18FY19
MillionsForecast
Estimate: A regression equation is used to project collections from the insurance company tax. The equation and its coefficient of determination are below. (An explanation of how to read a regression equation can be found on page 7.) Insurance Company Tax Collections = 5.33 + 0.40*SD Nonfarm Income – 3.87*Seasonal Dummy + 0.06*Consumer Spending on Insurance - 0.38*Yield on 2 year Treasury note + 2.68 * Affordable Care Act dummy variable. R2 = .9743
Actual FY2017
Actual FY2018
Interim Estimate FY2019
Receipts 83,271,532 91,021,843 93,106,970 Dollar Change (1,523,772) 7,750,311 3,026,628 Percent Change (1.80) 9.31 2.29

Interim Revenue Forecasts Bureau of Finance and Management 11
UNCLAIMED PROPERTY RECEIPTS FY2018 Performance: In FY2018, unclaimed property receipts to the general fund totaled $52.8 million. In total, actual FY2018 collections were $2.4 million higher than the most recent legislative adopted estimates.
Collections from unclaimed property receipts account for approximately 3.3% of ongoing general fund revenues in FY2018.
The chart below shows the ongoing portion of unclaimed property.
0.0
10.0
20.0
30.0
40.0
50.0
60.0
70.0
FY10FY11
FY12FY13
FY14FY15
FY16FY17
FY18FY19
MillionsForecast
Ongoing UCP
Estimate: The projections for unclaimed property receipts are based on historical collections and current conditions.
Actual FY2017
Actual FY2018
Interim Estimate FY2019
Ongoing UCP 44,386,220 52,766,031 49,279,257 One-Time UCP 12,714,729 0 0 Total UCP 57,100,949 52,766,031 49,279,257 Dollar Change 1,993,433 (4,334,918) (3,486,774) Percent Change 3.62 (7.59) (6.61)

Interim Revenue Forecasts Bureau of Finance and Management 12
LICENSES, PERMITS, AND FEES
FY2018 Performance: In FY2018, collections from licenses, permits, and fees totaled $67.5 million, which was up 4.27% or $2.8 million from FY2017. Actual FY2018 collections were $0.5 million higher than the most recent legislative adopted estimates.
Collections in this category account for approximately 4.2% of ongoing general fund revenues in
FY2018.
35.0
40.0
45.0
50.0
55.0
60.0
65.0
70.0
FY10FY11
FY12
FY13
FY14
FY15
FY16FY
17FY
18FY
19
Millions Forecast
Estimate: The different sources of receipts included in this category are estimated individually based on historical collections and current conditions.
Actual FY2017
Actual FY2018
Interim Estimate FY2019
Receipts 64,730,175 67,492,051 68,918,542 Dollar Change 8,018,125 2,761,876 1,426,491 Percent Change 14.14 4.27 2.11

Interim Revenue Forecasts Bureau of Finance and Management 13
TOBACCO TAXES FY2018 Performance: In FY2018, the total collections from the tobacco taxes were $59.2 million and of which $54.2 million was deposited into the general fund and $5.0 million was dedicated to tobacco prevention. In FY2018, cigarette taxes totaled $49.9 million, which was a decrease of $3.1 million or 5.9% compared to FY2017. Other tobacco taxes totaled $9.3 million, which was an increase of $0.4 million or 5.1% over FY2017.
Approximately 84% of the collections included in this category are from the tax on cigarettes, and the remaining 16% is collected based on the tax on the wholesale purchase price of other tobacco products.
Collections in this category account for approximately 3.4% of ongoing general fund receipts in FY2018.
The total estimates and breakdown of where the dollars go are included in the following table.
Actual FY2017
Actual FY2018
Interim Estimate FY2019
General Fund 30,000,000 30,000,000 30,000,000 TPRTF 5,000,000 5,000,000 5,000,000 Remainder to GF 26,809,149 24,157,663 23,800,381 Total 61,809,149 59,157,663 58,800,381
The following chart includes the amount allocated directly to the general fund:
25.0
30.0
35.0
40.0
45.0
50.0
55.0
60.0
FY10FY11
FY12FY13
FY14FY15
FY16FY17
FY18FY19
MillionsForecast
Estimate: Collections from the tax on cigarettes and other tobacco products are estimated individually. The general fund is forecast to receive $53,800,381 in FY2018.
Actual FY2017
Actual FY2018
Interim Estimate FY2019
Total Receipts 56,809,149 54,157,663 53,800,381 Dollar Change (1,158,563) (12,651,486) (357,282) Percent Change (2.00) (4.67) (0.66)

Interim Revenue Forecasts Bureau of Finance and Management 14
TRUST FUNDS FY2018 Performance: Transfers from the trust funds to the general fund in FY2018 totaled $37.0 million, which was an increase of 5.2% or $1.8 million from FY2017. As of June 30, 2018, the estimated rate of return for FY2018 was approximately 6.4% for each of the three trust funds.
The table below shows the amounts transferred from each of the trust funds to the general fund in FY2017 and FY2018, and the estimated amounts for FY2019.
Actual
FY2017 Actual FY2018
Estimated FY2019
HCTF 4,970,123 5,214,739 5,414,857 EETF 18,242,854 19,377,842 20,430,222 DCTF 11,981,721 12,442,947 12,715,245 Total 35,194,697 37,035,528 38,560,323
Receipts from the trust funds account for approximately 2.3% of ongoing general fund revenues
in FY2018.
10.0
14.0
18.0
22.0
26.0
30.0
34.0
38.0
FY10FY11
FY12FY13
FY14FY15
FY16FY17
FY18FY19
MillionsForecast
Estimate: The estimate for FY2019 includes the constitutionally required transfer from the Dakota Cement Trust and the amounts to be transferred from the Health Care Trust Fund and Education Enhancement Trust Fund pursuant to SDCL 4-5-29.1 and SDCL 4-5-29.2.
Actual FY2017
Actual FY2018
Interim Estimate FY2019
Total Receipts 35,194,697 37,035,528 38,560,323 Dollar Change 2,320,537 1,840,831 1,524,795 Percent Change 6.18 5.23 4.12

Interim Revenue Forecasts Bureau of Finance and Management 15
NET TRANSFERS IN FY2018 Performance: In FY2018, collections from net transfers in totaled $20.9 million, which was down 4.4% or $1.0 million from FY2017. Actual collections in FY2018 were $0.6 million lower than the most recent legislative adopted estimate.
Receipts included in this category account for approximately 1.3% of ongoing general fund revenues in FY2018.
4.0
8.0
12.0
16.0
20.0
24.0
28.0
32.0
36.0
FY10FY11
FY12FY13
FY14FY15
FY16FY17
FY18FY19
MillionsForecast
Estimate: The different sources of receipts included in this category are broken out and estimated individually based on historical collections and current conditions.
Actual FY2017
Actual FY2018
Interim Estimate FY2019
Total Receipts 21,897,071 20,941,048 20,771,768 Dollar Change 1,232,211 (956,023) (169,280) Percent Change 5.96 (4.37) (0.81)

Interim Revenue Forecasts Bureau of Finance and Management 16
ALCOHOL BEVERAGE TAX FY2018 Performance: Alcohol beverage tax collections to the general fund in FY2018 totaled $7.7 million, up 0.67% compared to FY2017. Actual FY2018 collections were $0.4 million lower than the most recent legislative adopted estimate.
Prior to FY2017, the state received 75% of the tax collected, and 25% of the collections went to the municipalities.
Beginning in FY2017 per the passage of SB 2, the state will receive 50% of the tax collected with 25% going to the municipalities and 25% going to the counties.
Collections from this tax account for approximately 0.5% of ongoing general fund revenues in FY2018.
5.0
6.0
7.0
8.0
9.0
10.0
11.0
12.0
FY10
FY11
FY12
FY13
FY14
FY15
FY16
FY17
FY18
FY19
Millions Forecast
Estimate: The estimates are based on historical collections and current conditions.
Actual FY2017
Actual FY2018
Interim Estimate FY2019
Total Receipts 7,617,533 7,668,288 7,868,302 Dollar Change (3,785,543) 50,754 200,014 Percent Change (33.20) 0.67 2.61

Interim Revenue Forecasts Bureau of Finance and Management 17
BANK FRANCHISE TAX FY2018 Performance: In FY2018, bank franchise tax collections totaled $13.5 million, which was down $1.2 million or 8.13% compared to FY2017. Bank card collections totaled $3.9 million, down $3.5 million or 47.8% compared to FY2017. Traditional bank tax collections totaled $9.6 million, up $2.3 million or 32.3% compared to FY2017. Total FY2018 bank tax collections were $4.4 million higher than the most recent legislative adopted estimate.
Ninety-five percent of the taxes paid by bank card taxpayers and 26 2/3% of all other revenues are deposited in the general fund. The remaining 5% of collections from bank card taxpayers and the 73 1/3% of revenues received from all other banks are remitted to the county where the bank or financial institution is located.
Collections from this tax account for approximately 0.8% of ongoing general fund revenues in FY2018.
0.0
10.0
20.0
30.0
40.0
50.0
FY10
FY11FY12
FY13
FY14FY15
FY16
FY17FY18
FY19
MillionsForecast
Estimate: Collections received from bank card taxpayers and other banks are estimated individually. The estimate is based on historical collections and current conditions.
Actual FY2017
Actual FY2018
Interim Estimate FY2019
Total Receipts 14,688,771 13,494,940 14,119,337 Dollar Change 4,176,017 (1,193,831) 624,398 Percent Change 39.72 (8.13) 4.63

Interim Revenue Forecasts Bureau of Finance and Management 18
CHARGES FOR GOODS AND SERVICES FY2018 Performance: In FY2018, the charges for goods and services category totaled $16.1 million, an increase of $0.5 million or 3.42% compared to FY2017 collections. Actual FY2018 collections were $1.1 million lower than the most recent legislative adopted estimate.
Revenues to the general fund from this category are relatively constant from year to year. In FY2017, the primary increase is due to additional receipts from the Department of
Corrections due to the budget restructuring. Receipts included in this category account for approximately 1.0% of ongoing general fund
revenues in FY2018.
0.02.04.06.0
8.010.012.014.016.018.0
FY10FY11
FY12FY13
FY14FY15
FY16FY17
FY18FY19
MillionsForecast
Estimate: The different sources of receipts included in this category are broken out and estimated individually based on historical collections and current conditions.
Actual FY2017
Actual FY2018
Interim Estimate FY2019
Total Receipts 15,562,672 16,094,652 16,452,092 Dollar Change 3,973,155 531,980 357,440 Percent Change 34.28 3.42 2.22

Interim Revenue Forecasts Bureau of Finance and Management 19
TELECOMMUNICATIONS TAX FY2018 Performance: In FY2018, the telecommunications tax totaled $4.9 million, a decrease of $0.4 million or 7.48% compared to FY2017 collections. Actual FY2018 collections were $0.2 million higher than the most recent legislative adopted estimate.
A gross receipts tax is imposed at the rate of 4% of telecommunications services within the state (SDCL 10-33A). Through FY2015, 60% of the revenue generated from this tax was dedicated to the Property Tax Reduction Fund (PTRF) with the remaining 40% deposited into the County Telecommunications Gross Receipts Fund.
Beginning in FY2016, the receipts from this tax are included in this separate classification due to the repeal of the PTRF.
The chart below shows the historical collections of this particular source of revenue that has flowed through the PTRF to the state general fund from FY2010 through FY2015.
0.0
2.0
4.0
6.0
8.0
10.0
FY10FY11
FY12FY13
FY14FY15
FY16FY17
FY18FY19
MillionsForecast
Estimate: Collections from the telecommunications tax is based on historical collections and current conditions.
Actual FY2017
Actual FY2018
Interim Estimate FY2019
Total Receipts 5,329,876 4,931,125 4,561,291 Dollar Change (613,441) (398,751) (369,834) Percent Change (10.32) (7.48) (7.50)

Interim Revenue Forecasts Bureau of Finance and Management 20
SEVERANCE TAXES FY2018 Performance: Severance tax collections totaled $6.6 million in FY2018, which was down $2.4 million or 26.38% from FY2017. Collections from energy mineral severance taxes (primarily oil) totaled $1.4 million, which was up $0.2 million or 12.55% compared to FY2017. Collections from precious metal severance taxes (primarily gold) totaled $5.2 million, which was down $2.5 million or 32.44% compared to FY2017. Total FY2018 severance tax collections were $0.2 million lower than the most recent legislative adopted estimate.
Currently all precious metal severance taxes are deposited in the general fund. One-half of the energy mineral severance taxes received are returned to the county where the
energy minerals were severed and one-half of the taxes are deposited in the general fund. Collections included in this category account for approximately 0.4% of ongoing general fund
revenues in FY2018.
0.01.02.03.04.05.06.07.08.09.0
10.011.0
FY10FY11
FY12FY13
FY14FY15
FY16FY17
FY18FY19
MillionsForecast
Estimate: Collections from taxes on precious metals and energy minerals are estimated separately. The estimates of collections from the severance taxes on gold and precious metals are based on history as well as gold prices. The estimates of collections from the tax on energy minerals are based on history and the projected price of crude oil and natural gas.
Actual FY2017
Actual FY2018
Interim Estimate FY2019
Total Receipts 8,968,233 6,602,808 5,905,069 Dollar Change 2,836,975 (2,365,425) (697,740) Percent Change 46.27 (26.8) (10.57)

Interim Revenue Forecasts Bureau of Finance and Management 21
INVESTMENT INCOME AND INTEREST FY2018 Performance: In FY2018, collections from investment income and interest totaled $6.1 million, a decrease of $0.3 million or 4.91% compared to FY2017. The yield of the cash flow fund was 1.2% for FY2018. Total FY2018 collections were nearly equal to the most recent legislative adopted estimate.
The amounts collected in FY2015 and FY2016 are based on discontinuing the accelerated 90% interest earnings for the current year’s proration starting in FY2015. Thus, only 10% of the previous year’s proration (FY2014) is reflected in FY2015 receipts and 100% of the earnings from the previous year are reflected in FY2016 receipts.
Revenues included in this category are from interest and the investment earnings of the general fund and nonparticipating funds in the cash flow fund. Nonparticipating means the earnings attributable to the company are deposited in the general fund. The South Dakota Investment Council is responsible for investing the money in the cash flow fund.
This category also includes some interest and rent income from the Department of Social Services and the Department of Corrections.
Receipts in this category account for approximately 0.4% of ongoing general fund revenues in FY2018.
0.0
5.0
10.0
15.0
20.0
FY10FY11
FY12FY13
FY14FY15
FY16FY17
FY18FY19
MillionsForecast
Estimate: The estimate is based on information provided by the South Dakota Investment Council and historical collections.
Actual FY2017
Actual FY2018
Interim Estimate FY2019
Total Receipts 6,366,142 6,053,274 5,923,525 Dollar Change 927,531 (312,868) (129,749) Percent Change 17.05 (4.91) (2.14)

Interim Revenue Forecasts Bureau of Finance and Management 22
ALCOHOL BEVERAGE 2% WHOLESALE TAX FY2018 Performance: Collections in FY2018 totaled $2.0 million, up 3.40% from FY2017. Actual FY2018 collections from this tax were $0.1 million lower than the most recent legislative adopted estimate.
Collections from this tax account for approximately 0.1% of ongoing general fund revenues in FY2018.
1,0001,1001,2001,3001,4001,5001,6001,7001,8001,9002,0002,1002,200
FY10FY11
FY12FY13
FY14FY15
FY16FY17
FY18FY19
ForecastThousands
Estimate: The estimates are based on historical collections and current conditions.
Actual FY2017
Actual FY2018
Interim Estimate FY2019
Total Receipts 1,954,454 2,020,940 2,101,698 Dollar Change 103,939 66,486 80,758 Percent Change 5.62 3.40 4.00