REVAMPING OF EQ2 TO EQ5 BERTHS BY...
113
FEASIBILITY REPORT ON REVAMPING OF EQ2 TO EQ5 BERTHS BY CONSTRUCTION A MULTIPURPOSE PURPOSE TERMINAL IN THE INNER HARBOUR AT PORT OF VISAKHAPATNAM INDIAN PORTS ASSOCIATION 1 st Floor, South Tower, NBCC Place, Bhisham Pitamah Marg, Lodi Road, New Delhi-110003 APRIL, 2015
Transcript of REVAMPING OF EQ2 TO EQ5 BERTHS BY...
FEASIBILITY REPORT ON
REVAMPING OF EQ2 TO EQ5 BERTHS
BY CONSTRUCTION A MULTIPURPOSE PURPOSE
TERMINAL IN THE INNER HARBOUR
AT PORT OF VISAKHAPATNAM
INDIAN PORTS ASSOCIATION
1st Floor, South Tower, NBCC Place,
Bhisham Pitamah Marg, Lodi Road, New Delhi-110003
APRIL, 2015

CONTENTS
Chapter Description Page No.
Executive Summary i - v
1 Project Background 1
2 Present Setting & Traffic Profile 5
3 Traffic Forecast 17
4 Development Strategy 59
5 Site Information 64
6 Berth Position and Alignment 70
7 Preliminary Design and Evaluation of Alternatives 72
8 Equipment Requirement 82
9 Capital cost estimate and Implementation schedule 88
10 Operation and Maintenance Cost 91
11 Revenue Estimates 94
12 Viability and Sensitivity Analysis 99
Revamping of EQ2 TO EQ5 berths by construction a Multipurpose Purpose Terminal
in the Inner Harbour at Port of Visakhapatnam
Page | 1
CHAPTER1
PROJECT BACKGROUND
1.1 The Port
The Port of Visakhapatnam, situated on the East Coast of India, is one of the five pre-
independence Ports of the country and was opened to commercial shipping on 7th October,
1933. Strategically located on the East Coast, the Port is endowed with deep water basins,
naturally protected to provide tranquil water frontage to accommodate large size ships. The
Port has two harbour basins namely the inner harbour and the outer harbour. At present, the
inner harbour channel and turning circle can cater to 12.5m draft vessels. To meet the
dynamic changing needs of cargo carriers, the port is making relentless efforts to augment its
infrastructure facilities. As a part of this endeavour, the inner harbour turning circle and
entrance channel are being deepened to cater to fully laden panamax vessels of 14.0 m draft.
1.2 The Berths
Co-terminus with this inner channel deepening project, the port has drawn up an action plan
for deepening the inner harbour berths to cater to 14 m draft vessels with a view to reap the
benefits of this deepening project. As a part of this action plan, the port now intends to
replace the existing EQ2 to EQ5 berths which were of monolithic construction by a single
multipurpose terminal of 560 m length to cater to fully laden panamax vessels of 14 m draft
.Accordingly the port has entrusted the work of preparation of feasibility report for
Replacement of EQ2to EQ5 berths for handling 2 nos. Panamax Size vessels including
mechanization to cater to 14 m draft vessels in the northern arm of Inner Harbour to Indian
Ports Association with the following Terms of Reference (TOR);

Revamping of EQ2 TO EQ5 berths by construction a Multipurpose Purpose Terminal
in the Inner Harbour at Port of Visakhapatnam
Page | 2
1.3 Scope of work
The terms of reference for the study as approved by the Port are given below.
The scope of work shall comprise of the following:
1. Traffic study for the present scenario and traffic forecast study for the existing Berths in the Northern Arm:
Stage wise developmental plans with technical and economic feasibility and financing
options. The study may also cover a detailed traffic analysis including:
(i) Likely increase in traffic after equipping the berths as stated above and
(ii) The likely loss in traffic if the desired draft of 14 meter is not provided keeping view the requirement of trade and the developments taking place in the neighbouring ports.
2. Estimated cost for the development of each individual berth to cater to 14m draft vessels in the Northern Arm including cost of equipment and augmentation of utilities such as power supply yard area, water supply, etc.
3. Estimation of Annual operation and maintenance expenditure of the berth
handling system and facilities proposed on DBFOT basis.
4. Revenue and IRR calculating for each individual berths in Northern Arm.
5. Recommendations on the phase-wise Up-Gradation/Replacement/ Strengthening requirements of the berths.
6. Financial viability including sensitivity analysis of the proposal from DBFOT
Operator perspective.
7. Review and Presentations on the TEFR in phases to VPT for modifications and finalization.
8. Preparation and submission of Draft and Final Report
9. Any other issues connected to above.
10. Any additional connectivity like rail/road.
As can be seen from the above scope of work, the report will be prepared based on the
secondary data and will rely mostly upon the existing reports and data.
Revamping of EQ2 TO EQ5 berths by construction a Multipurpose Purpose Terminal
in the Inner Harbour at Port of Visakhapatnam
Page | 3
1.4 Deliverables
The following will be the deliverables by the consultant.
i) Inception Report
ii) Draft Report
The Draft Report will in general comprise of the following:
� Project Background
� Analysis of the Existing Traffic
� Forecast of Other Dry Bulk and Break bulk cargo traffic i.e. cargo other than Iron ore, coal, liquid and cargoes for which dedicated facilities are available.
� Assessment of likely increase in traffic after reconstruction and mechanization of EQ2 to EQ5 berths.
� Likely loss of Traffic in case the berths are not reconstructed.
� Site Information
� Civil Construction works – Designs, Major civil works, Dredging etc.
� Assessment of equipment requirement
� Utilization plan for the existing equipment
� Technical specification of the equipments proposed
� Capital Cost estimate (Civil works and Mechanical equipment) and Implementation schedule.
� Project viability analysis
� Time frame for the project
iii) Final Report
� All the deliverables listed in the Draft Report with changes based on the feedback from VPT.
1.5. Formation of team
The IPA has formulated a team of experts to carry out the study and prepare the report. As
the work involves traffic study, civil and equipment requirements study and viability of the
project, the team was constituted with a team leader and Mechanical Engineering expert with
a background on port operation and management, two members with Civil engineering
background, and one member each with Traffic and finance background.
The team started the work with a kick off meeting with Chief Engineer (CE) and other
officers of the department. The team also held discussions with the Chairman on the project

Revamping of EQ2 TO EQ5 berths by construction a Multipurpose Purpose Terminal
in the Inner Harbour at Port of Visakhapatnam
Page | 4
and also met Traffic Manager (TM), Chief Mechanical Engineer of the port. The team also
held discussions with other connected officials in these departments.
1.6. Approach & Methodology.
The study will be based on desk study of the reports available on the traffic handled and their
future growth, study the existing berthing structures and layout of the port and review of the
equipment available and recommend the type of construction and layout of the proposed
berths and also recommend the nature of equipments deployed based on the cargo profile.
No primary data is expected to be collected for the study.

Revamping of EQ2 TO EQ5 berths by construction a Multipurpose Purpose Terminal
in the Inner Harbour at Port of Visakhapatnam
Page | 5
CHAPTER2
PRESENT SETTING &
TRAFFIC PROFILE
2.1 Port Basins
The Port has three distinct basins viz.
i) Inner Harbour with a water spread of 100 hectares and an entrance channel
of 1.62 KM in length, a turning basin and three navigable arms – northern,
western and north-western
ii) Outer Harbour with a protected tranquil basin of 200 hectares encompassed
by set of three breakwaters
iii) Fishing Harbour with a water spread of 24 hectares.
A lay out of the port is given in Figure 1
FIGURE 1: GENERAL LAYOUT OF THE VISAKHAPATNAM PORT

Revamping of EQ2 TO EQ5 berths by construction a Multipurpose Purpose Terminal
in the Inner Harbour at Port of Visakhapatnam
Page | 6
2.2 Inner Harbour
In the Inner Harbour, the northern arm is the main commercial arm of the Port and
accommodates 14 multi-commodity berths (including BOT berths). The north-western arm is
fully utilized by the Eastern Naval Command. A part of the western arm is used by the
Hindustan Shipyard Limited and part by the Port where three captive berths (two oil berths
and one fertilizer berth) are located. Thus, the total number of berths in Inner Harbour is 17,
including BOT berths.
As stated earlier, the port had drawn an action plan for phase wise deepening of Inner
Harbour berths to cater to fully laden Panamax vessels .The details in brief are discussed
below:
Keeping in view the increase in demand for imports of steam coal to cater to the existing and
upcoming power plants in the hinterland, a proposal to develop EQ-1 berth by dismantling
the original EQ-1 berth was taken up. The proposal envisaged development of EQ-1 berth to
cater to Panamax size coal vessels up to 80000 DWT. The concession agreement was signed
on 08.08.2012 with M/s. ADANI Vizag Coal Terminal Ltd., an SPV formed by the
consortium of Mundra Port & SEZ Ltd and Adani Enterprises. The PPP project was
completed on 02-09-2014. The commercial operation commenced on 24-10-2014.
With a view to providing mechanized facilities for handling thermal coal, a proposal to
develop EQ-1A berth on south side of East Quay with mechanised handling facilities was
taken up to cater to Panamax Vessels up to 80000 DWT and the work is awarded to a PPP
operator M/s SEW. The construction is in progress and expected to be completed by January
2016. After completion of the work, the berths EQ 1 a nd EQ 1A will have 14 m draft.
EQ2 to EQ4 berths are of monolithic type construction with a draft of 10.06 m and the port
proposes to replace the same by constructing a multipurpose terminal after taking part of the
existing EQ 5 berth to cater to 14 m draft. The present study is intended for the same.
The backup area of the berths EQ5 and EQ6 were strengthened to cater to dredged depth of -
13.5 mtrs.
EQ 7 berth has been given to a PPP operator M/s ABG to develop it as a mechanized cargo
handling facility to handle fertilizer and a small quantity of general cargo. The work is in

Revamping of EQ2 TO EQ5 berths by construction a Multipurpose Purpose Terminal
in the Inner Harbour at Port of Visakhapatnam
Page | 7
progress. This will also have a depth of 13.5 m after dredging.
EQ8 and EQ9 berths built by M/S VSPL were designed to cater to (-) 14.5 m dredged depth.
EQ 10 berth is given to a PPP operator M/s AVR for development. This berth will cater to 14
m draft Panamax vessel.
WQ I and part of WQ 2 berths were strengthened to cater to 12.5 m draft vessels and there
are plans to deepen them to cater to 14m draft vessels.
So also the part of berth WQ 2 and WQ 3 berth are strengthened to cater to 12.5 m draft
vessels and also plans to deepen them to cater to 14 m draft Panamax vessels.
WQ 4 and WQ 5 berths are old and they also need to be strengthened and deepened to cater
to 14 m draft vessel.
WQ 6 berth is given to a PPP operator M/s ABG for development to have a draft of 14 m to
cater to Panamax vessels.
WQ7 and WQ8 are being built through internal resources with an ultimate depth of (-)
16.1 m to cater to 14m draft panamax vessels and the work is in progress.
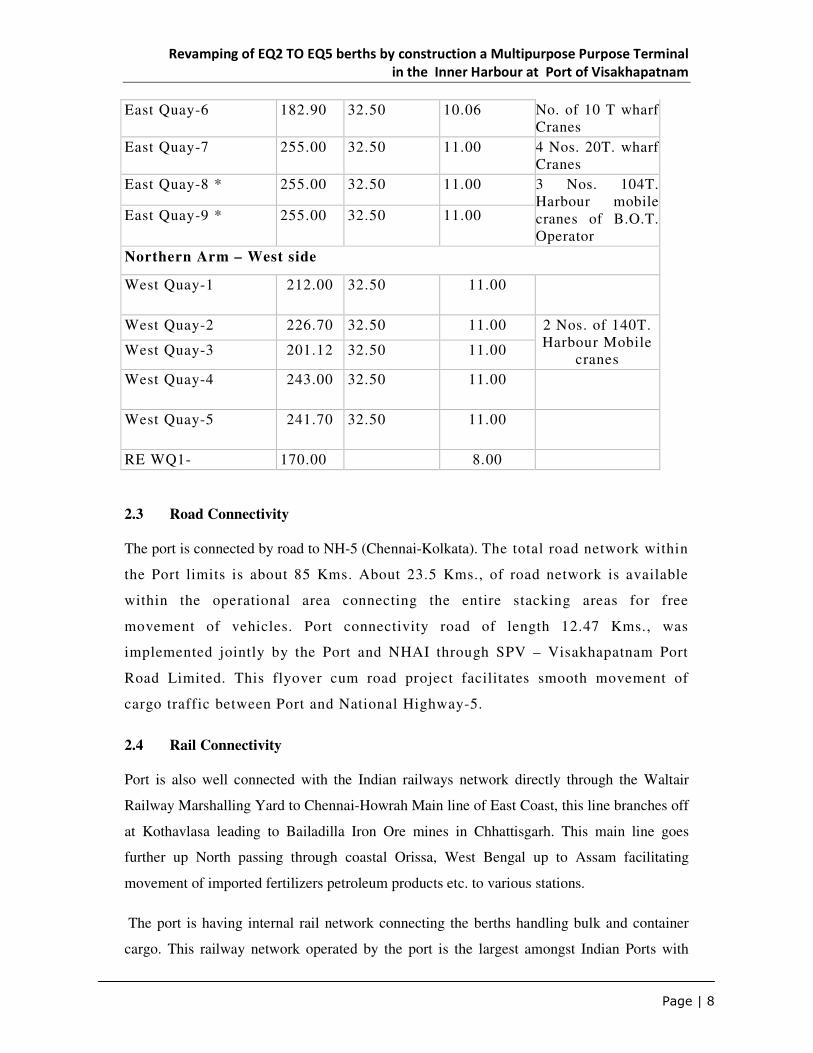
The Berth particulars of Northern arm of Inner Harbour are given below.
Berth No. Berth
length
(Mtrs.)
Permissible
Beam
(Mtrs.)
Permissible
Draft
(Mtrs.)
Crane
deployment
Northern Arm – East side
East Quay-1 (PPP) 32.50 14
East Quay-1A (under progress) 32.50
14
East Quay-2 # 167.64 32.50 10.06
East Quay-3 167.64 32.50 10.06 4 Nos. 15T. wharf Cranes, 1 No. 10 T wharf crane
East Quay-4 231.00 32.50 10.06 4 Nos. 15T. wharf Cranes,1 No. 10 T wharf crane
East Quay-5 167.64 32.50 11.00 2 Nos. 15T. & 1
Revamping of EQ2 TO EQ5 berths by construction a Multipurpose Purpose Terminal
in the Inner Harbour at Port of Visakhapatnam
Page | 8
East Quay-6 182.90 32.50 10.06 No. of 10 T wharf Cranes
East Quay-7 255.00 32.50 11.00 4 Nos. 20T. wharf Cranes
East Quay-8 * 255.00 32.50 11.00 3 Nos. 104T. Harbour mobile cranes of B.O.T. Operator
East Quay-9 * 255.00 32.50 11.00
Northern Arm – West side
West Quay-1 212.00 32.50 11.00
West Quay-2 226.70 32.50 11.00 2 Nos. of 140T. Harbour Mobile
cranes West Quay-3 201.12 32.50 11.00
West Quay-4 243.00 32.50 11.00
West Quay-5 241.70 32.50 11.00
RE WQ1- 170.00 8.00
2.3 Road Connectivity
The port is connected by road to NH-5 (Chennai-Kolkata). The total road network within
the Port limits is about 85 Kms. About 23.5 Kms., of road network is available
within the operational area connecting the entire stacking areas for free
movement of vehicles. Port connectivity road of length 12.47 Kms., was
implemented jointly by the Port and NHAI through SPV – Visakhapatnam Port
Road Limited. This flyover cum road project facilitates smooth movement of
cargo traffic between Port and National Highway-5.
2.4 Rail Connectivity
Port is also well connected with the Indian railways network directly through the Waltair
Railway Marshalling Yard to Chennai-Howrah Main line of East Coast, this line branches off
at Kothavlasa leading to Bailadilla Iron Ore mines in Chhattisgarh. This main line goes
further up North passing through coastal Orissa, West Bengal up to Assam facilitating
movement of imported fertilizers petroleum products etc. to various stations.
The port is having internal rail network connecting the berths handling bulk and container
cargo. This railway network operated by the port is the largest amongst Indian Ports with

Revamping of EQ2 TO EQ5 berths by construction a Multipurpose Purpose Terminal
in the Inner Harbour at Port of Visakhapatnam
Page | 9
over 200km rail length, over 30 Sidings. Port is equipped with 15 WDS-6 locos of 1400 HP
and 3 WDG-3 locos of 3100 HP capacity for carrying out marshalling operations.
2.5 Storage Facilities
Covered Storage (lakh tonnes)
Port Owned 0.86
Others 8.30
Open Storage ( lakh sq.meters)
Port Owned 13.01
Others 4.29
2.6 Cargo handled
2.6.1 The Visakhapatnam Port has a unique distinction in cargo handling as the port
handles all types of cargo including containers. In terms of the volume of the cargo handled
the port stands at 5th position among the major ports during the last year 2014-15. The
details of the cargo handled by the port during the last five years, major commodity wise are
given in the following table.
Major Commodity wise traffic handled during last 5 years.
(In Million tonnes)
COMMODITY 2009-10 2010-11 2011-12 2012-13 2013-14 2014-15
POL Incl. Crude oil 18.29 19.27 18.44 15.04 14.01 14.64
Iron ore 18.94 19.35 16.15 12.31 13.00 8.30
Fertilizers (finished) 2.91 3.27 3.72 2.03 1.77 1.84
Fertiliser raw Materials (dry) 0.78 0.81 0.83 0.56 0.80 0.72
Coal( Coking, Thermal & Steam) 13.86 13.50 14.01 14.05 13.08 18.22
Containers (000 TEU’s)
1.68 (97)
2.57 (145)
4.22 (234)
4.55 (247)
4.92 (262)
4.37 (248)
Other Liquids 1.32 1.25 1.47 1.27 1.57 1.73
Other Bulk 6.60 6.96 7.21 7.96 7.71 6.51
Other Break bulk 1.12 1.06 1.37 1.27 1.64 1.68
Total 65.50 68.04 67.42 59.04 58.50 58.01
Figures in brackets represents Container traffic in thousands TEU’s.

Revamping of EQ2 TO EQ5 berths by construction a Multipurpose Purpose Terminal
in the Inner Harbour at Port of Visakhapatnam
Page | 10
2.6.2 As may be observed from the above table, the cargo profile of the port for the year
2014-15 is predominantly bulk cargo with iron ore and pellets and coal (including thermal
coal) constituting about 46 percent of the total traffic. POL and Other liquids constituted
about 28 percent of total traffic .The share of the container traffic is 8 %. Fertilisers and its
raw materials (dry) constituted 4 percent and balance 14 percent is other cargo such as break
bulk and minor bulks.
2.6.3 Analysis of traffic trends reveals the following
• Despite diversion of RINL cargo to Gangavaram port on economic considerations, coal
traffic remained at the same level. The loss of traffic of coking coal did offset to certain
extent by the increase in imports of coking coal by Jaeswal Neco, Bhusahan power and
steel, increase in imports of steam coal by the Coastal Energy (power plant in the
hinterland) and Sarada Metals and alloys.
• Fertiliser traffic registered substantial decline mainly due to diversion of cargo to
Kakinada and Gangavaram ports. The delay in much awaited mechanised facility at EQ7
could perhaps been one of the contributing factor.
• With the increasing penetration of containerisation, the break bulk cargo remained static
till 2012-13 and marginally increased in 2013-14 due to increase in exports of steel
products by SAIL and Jindal Steel and Power
2.6.4 Overseas/Coastal Distribution
While the proportion of coastal traffic in the overall throughput is 29% in 2013-14, coastal
cargo occupies a predominant share in the cargo loaded . Table 2.8 gives the details.
Overseas/Coastal Distribution in Lakh Tonnes
2013-14 2011-12
Overseas Coastal Total Overseas Coastal Total
Imports 292.29
(88)
40.53
(12) 332.82
311.07
(85)
54.23
(15) 365.30
Exports 118.74
(49)
125.44
(51) 244.18
116.24
(44)
149.42
(56) 265.66
Transhipment 2.95
(37)
5.08
(63) 8.03
20.14
(47)
23.10
(53) 43.24
Total 413.98 171.05 585.03 447.45
(66%)
226.75
(34%) 674.20

Revamping of EQ2 TO EQ5 berths by construction a Multipurpose Purpose Terminal
in the Inner Harbour at Port of Visakhapatnam
Page | 11
2.6.5 Extent of Mechanisation
Of the total traffic of 58.50 million tonnes handled in 2013-14, 35.00 Million Tonnes (60%)
was handled by mechanised means, as shown in Table below
Mechanisation at Port of Visakhapatnam
In million tonnes
Commodity Group Mechanical Non Mechanical Total
Iron ore & pellets (Exp) 8.03 4.97 13.00
Alumina 1.31 0.19 1.50
Liquid bulk 15.58 - 15.58
Other dry cargo 10.08 18.34 28.42
Total 35.00 23.50 58.50
2.6.6 Exports by Destination
Overseas exports in 2013-14 are mostly to China followed by Japan, UAE and South Korea. (lakh tonnes)
Overseas 2013-14
CHINA 37.69
JAPAN 19.40
UAE 10.40
SOUTH KOREA 7.36
SINGAPORE 4.93
MALAYSIA 4.83
VIETNAM 4.50
SAUDI SRABIA 3.77
INDONESIA 3.72
TAIWAN 2.75
BANGLADESH 2.42

Revamping of EQ2 TO EQ5 berths by construction a Multipurpose Purpose Terminal
in the Inner Harbour at Port of Visakhapatnam
Page | 12
Overseas 2013-14
SRI LANKA 1.92
USA 1.32
OTHERS 13.73
TOTAL OVERSEAS 118.74
COASTAL
KOLKATA/HALDIA/ BUDGE
BUDGE 9.05
TUTICORIN 23.43
CHENNAI 3.84
ENNORE 4.74
HAZIRA 42.51
MUMBAI 24.27
NEW MANGALORE 11.48
OTHERS 6.12
TOTAL COASTAL 125.44
GRAND TOTAL 244.18
In case of coastal loading, Hazira and Mumbai are the predominant coastal destination mainly
due to movement of Iron ore fines, Iron ore lumps and Iron pellets followed by Tuticorin on
account of thermal coal meant for power plants of TNEB.
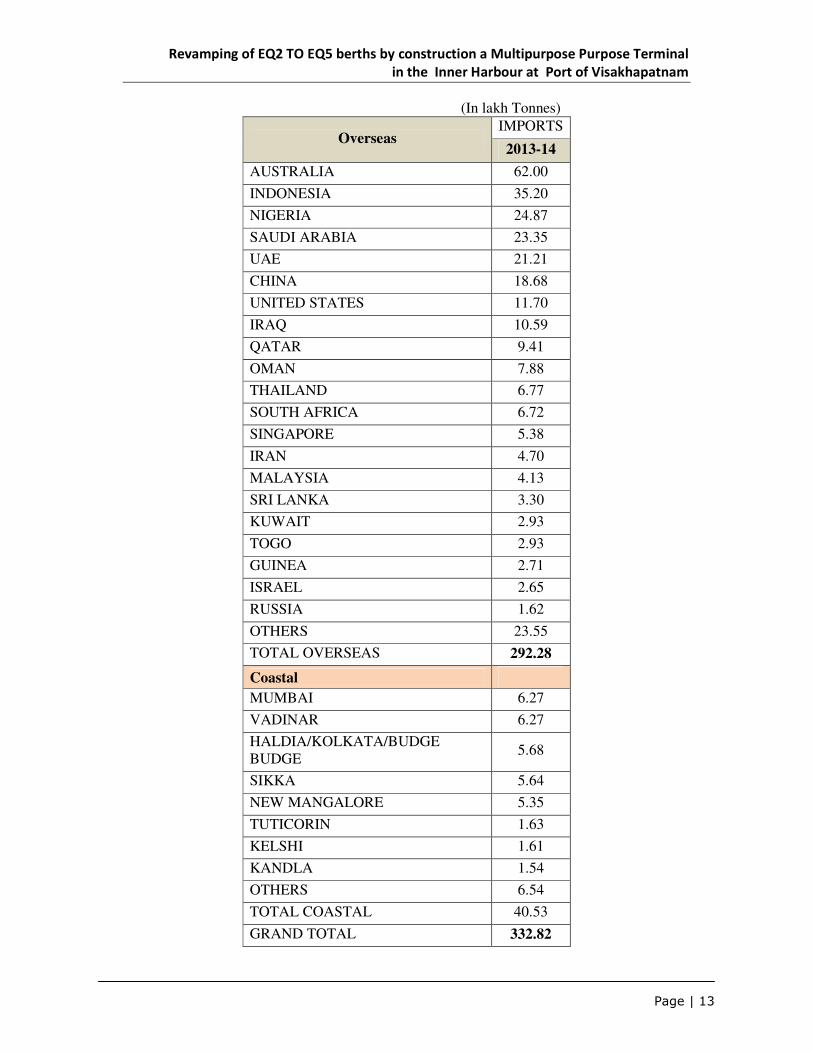
2.6.7 Imports by Origin
The main country of origin for imports is Australia accounting for 21% of the total overseas
imports followed by Iran (12%) and Nigeria (8.5%). Among coastal cargo, the dominant
Port of origin is Mumbai followed by Vadinar. In the case of overseas imports, the principal
cargo imported consists of coal from Australia, crude oil from Iran and Saudi Arabia and
steam coal from Indonesia, and among coastal imports, crude oil from Bombay High is the
dominant cargo. Table below furnishes details.
Revamping of EQ2 TO EQ5 berths by construction a Multipurpose Purpose Terminal
in the Inner Harbour at Port of Visakhapatnam
Page | 13
(In lakh Tonnes)
Overseas IMPORTS
2013-14
AUSTRALIA 62.00
INDONESIA 35.20
NIGERIA 24.87
SAUDI ARABIA 23.35
UAE 21.21
CHINA 18.68
UNITED STATES 11.70
IRAQ 10.59
QATAR 9.41
OMAN 7.88
THAILAND 6.77
SOUTH AFRICA 6.72
SINGAPORE 5.38
IRAN 4.70
MALAYSIA 4.13
SRI LANKA 3.30
KUWAIT 2.93
TOGO 2.93
GUINEA 2.71
ISRAEL 2.65
RUSSIA 1.62
OTHERS 23.55
TOTAL OVERSEAS 292.28
Coastal
MUMBAI 6.27
VADINAR 6.27
HALDIA/KOLKATA/BUDGE BUDGE
5.68
SIKKA 5.64
NEW MANGALORE 5.35
TUTICORIN 1.63
KELSHI 1.61
KANDLA 1.54
OTHERS 6.54
TOTAL COASTAL 40.53
GRAND TOTAL 332.82

Revamping of EQ2 TO EQ5 berths by construction a Multipurpose Purpose Terminal
in the Inner Harbour at Port of Visakhapatnam
Page | 14
2.7 Trends in Capacity augmentation
The commodity wise capacity during 2007-14 is presented below
Capacity Augmentation during 2007-14
in Million Tonnes
Year POL Iron
Ore Coal Fertiliser
Gen /
Break
Bulk
Container Total
31-3-2007 17.15 12.00 - 1.00 26.65 1.70 58.50
31-3-2012 17.65 12.50 - 1.00 32.50 2.68 66.33
31-3-2013 17.65 12.50 - 1.00 33.50 2.68 67.33
31-3-2014 25.65 12.50 - 1.00 47.09 2.68 88.92
2.8 Physical Efficiency Parameters
The efficiency parameters of the port registered improvement in 2013-14 compared to 2011-
12 as the following table presents.
year Av.PBD(days) Av.TRT(days) Output per Berth day (tonnes)
2011-12 2.84 5.68 10701
2012-13 2.50 5.39 10645
2013-14 1.84 4.73 10928
2.10 Private Sector Participation in VPT
Visakhapatnam Port has quickly adapted to the Ministry’s guidelines for private sector
participation and has emerged as the pioneer in identifying capacity augmentation schemes
on PPP mode. Among the total PPP projects on hand at Major Ports, VPT ranks first. For
this achievement, the Port has been adjudged as the Major Port of India for 2010-11.

Revamping of EQ2 TO EQ5 berths by construction a Multipurpose Purpose Terminal
in the Inner Harbour at Port of Visakhapatnam
Page | 15
The details of private sector participation schemes at VPT are detailed below: (Status as on
Dec.2014)
PROJECT CARGO
PROFILE
CAPACITY CONCESSIO
NED TO
STATUS
Coal handling facilities in the
outer harbour
Coking
and steam
coal
10.18 mtpa Vedanta Group
Vizag General
Cargo Berth
Pvt Ltd.(10-
06-2010)
Commissi
oned in
April
2013
Steam Coal handling facilities at
EQ I in Inner Harbour
Steam
coal
6.41 mtpa Mundra Port &
SEZ Ltd and
Adani
Enterprises(08-
08-2012)
Commercial
operation
commenc
ed on 24-
10-2014
Development of EQ10 berth in
Inner Harbour
Caustic
soda Bio-
diesel,
edible oils,
and
chemicals
1.84 mtpa M/s. AVR
Infra Private
Limited
Completed
in March
2015
Development of WQ6 berth in
Inner Harbour
Multi
cargo
2.08 mtpa M/s. West
Quay Multi
Port Pvt Ltd.
March
2015
Thermal coal loading facilities
at EQ IA south side of EQ I
Thermal
coal
loading
7.36 mtpa M/s. SEW
Vizag Coal
Terminal
Pvt.Ltd
Jan, 2016
Upgradation of Existing Facility
in the Outer Harbour and
creation of new facility in the
Inner Harbour for iron ore and
iron ore pellets
Iron ore
and pellets
23 MTPA M/s Vadinar
Oil terminal ltd
2017-18
Mechanised handling facilities
for fertilisers at EQ-7
Fertilisers 5.21 mtpa ABG – ILFS
consortium
Work is
to
commence
Extension of Container
Terminal
Container 5.4 lakh
TEUs
VCTPL CA signed
on
17.12.14

Revamping of EQ2 TO EQ5 berths by construction a Multipurpose Purpose Terminal
in the Inner Harbour at Port of Visakhapatnam
Page | 16
2.11 Schemes taken up through Internal Resources
i) Development of West Quay North
To meet the anticipated demand of dry bulk cargo, a proposal to develop two berths in West
Quay North with a berth length of 560 meters has been taken up. The targeted output rate is
7500 to 10000 tonnes per day. The cargo profile includes Manganese Ore (IMP), bauxite,
gypsum, BF Slag, Ilmenite sand, Limestone and other bulk cargo. An extent of 1.01 lakh sq
meters has been allotted as storage area. The assessed capacity is 4.78 MT. The port is
developing these berths from internal resources. Work was awarded on 20-12-2013.
ii) Other Schemes under pipeline for capacity augmentation include the following:
a) Proposal for setting up of Multimodal Logistic Hub as a JV with M/s Balmer
Lawrie & Co Ltd.
b) Tender process initiated for development of truck terminal;
c) Reconstruction of OR-1 and OR-2 Berths.
d) Development of satellite port at Bheemunipatnam.
Revamping of EQ2 TO EQ5 berths by construction a Multipurpose Purpose Terminal
in the Inner Harbour at Port of Visakhapatnam
Page | 17
CHAPTER3
TRAFFIC FORECAST
3.1 Preamble
As per the scope of the work, traffic study for the present scenario and traffic forecast study
for the existing Berths in the Northern Arm is required to be made. The likely increase in
traffic after equipping the berths and the likely loss in traffic if the desired draft of 14 meter is
not provided keeping in view the requirement of trade and the developments taking place in
the neighbouring ports is required to be assessed.
As brought out in the previous chapter, about 26 percent of the cargo profile is liquid cargo
and the balance is dry cargo. Since the proposed multipurpose terminal is intended to handle
dry cargo, the traffic study is confined to the dry cargo only.
The cyclical nature of the major industries that use Visakhapatnam Port coupled with the
Andhra Pradesh and Odisha Government’s declared policy to develop a number of non-
major ports along the coast line pose difficulties in making an accurate long term forecasts.
Further assessment of future traffic over longer time horizons is subject to several variables
like the county’s future economic scenario in the country and the rest of the world, Industrial
development of the hinterland, development plans of other major and minor ports in the
hinterland, perception of the users about the choice of a particular port visa-a-vis other ports
in terms of costs and benefits.
The forecasts are made using a combination of End- use ,top-down and Bottom up forecast
methods where in the study of the developments in the related sectors in the next 10 years
with particular reference to the Project Influence Zone (PIZ) is made.. Appraisal of the
industrial and economic activities in the PIZ generating new demands for the port has been
made, i.e. the factors that influence trade in major commodities have been analysed The
Working Group Reports of the Planning Commission for the XII Plan (Coal, Steel, Fertiliser,
Cement, Power etc) and other sectoral study reports have been studied and analysed to have a
perspective of the future developments.

Revamping of EQ2 TO EQ5 berths by construction a Multipurpose Purpose Terminal
in the Inner Harbour at Port of Visakhapatnam
Page | 18
A common form of top-down forecast is a world trade macroeconomic projection that has to
be disaggregated to the country’s trade and then to local ports The macro forecasts are
particularly useful for very long-term growth trends for broad categories of cargo such as
bulk, liquid and containerized and up to 10 years. Bottom-up forecasts reflect the opinions
and perspectives of shippers. Most shippers use a short-term forecast timeframe unless there
are capital investments and detailed strategic plans such as those that commonly occur in the
bulk commodity sectors.
Wherever applicable, efforts have been made to identify the potential for diversion to other
ports as a result of other projects. The projections of primarily heterogeneous (such as
containerized cargoes) will likely reflect historical time series adjusted by macroeconomic
projections for future growth of independent variables. Homogeneous commodity flows of
bulk materials will be more susceptible to user surveys to identify expansion plans and the
potential for diverted or induced cargoes resulting from with-project conditions.
3.2 Horizon year for the study
Since the minimum lead time to re construct the berths after getting requisite approvals is
two years, It is felt appropriate to start the assessment from 2018-19. Thus the horizon years
adopted will be: 2018-19, 2021-22, 2026-27 and 2031-32.
3.3 Sectoral Study
3.3.1 Steel Sector
Global Scenario
In 2014, the world crude steel production reached 1661.5 million tonnes (MT) and showed a
growth of 1.2% over 2013. (Source: World Steel Association) China remained the world’s
largest crude steel producer in 2014 (823 MT) followed by Japan (110.7 MT), the USA (88.3
MT) and India occupied the 4th position.
WSA has projected that global apparent steel demand will increase by 2% to 1,562 MT in
2014 following growth of 3.8% in 2013 while in 2015, world steel demand will grow by
another 2% and will reach 1,594 MT. Per capita finished steel consumption in 2013 is
estimated at 219 kg for world and 545 kg for China by WSA.
Revamping of EQ2 TO EQ5 berths by construction a Multipurpose Purpose Terminal
in the Inner Harbour at Port of Visakhapatnam
Page | 19
Domestic Scenario
The Indian steel industry has entered into a new development stage from 2008-09, riding high
on the resurgent economy and rising demand for steel. As per WSA, India’s outlook is
improving and in 2014, India’s steel demand has grown by 3.4%, following growth of 1.8% in
2013. In 2015 structural reforms and improving confidence will support a further 6% growth in
Indian steel demand. As stated above, India emerged as the 4th largest producer of crude steel.
The crude steel capacity expanded to 99.6 MT in 2013-14 and the production was 81.5 MT.
(Source: Outcome budget of ministry of steel).The country emerged as the largest producer of
sponge iron or DRI in the world. The country is expected to become the 2nd largest producer of
crude steel in the world soon, provided all requirements for creation of fresh capacity are
adequately met.
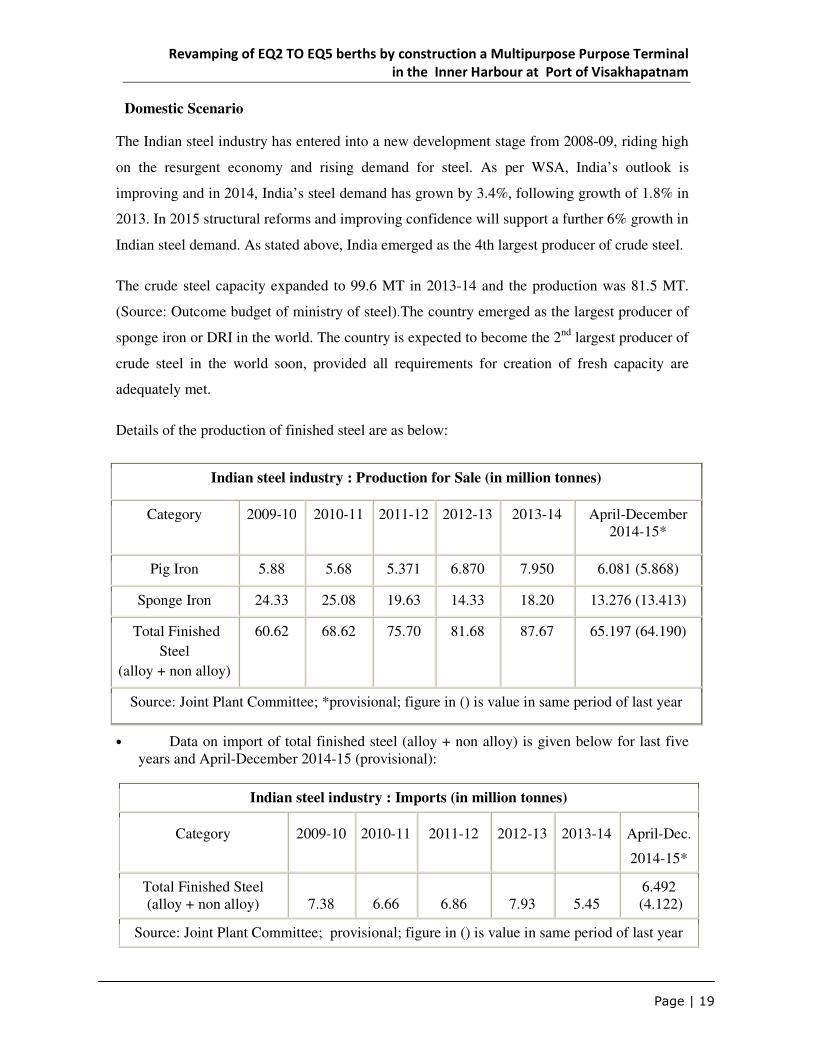
Details of the production of finished steel are as below:
Indian steel industry : Production for Sale (in million tonnes)
Category 2009-10 2010-11 2011-12 2012-13 2013-14 April-December 2014-15*
Pig Iron 5.88 5.68 5.371 6.870 7.950 6.081 (5.868)
Sponge Iron 24.33 25.08 19.63 14.33 18.20 13.276 (13.413)
Total Finished
Steel
(alloy + non alloy)
60.62
68.62 75.70 81.68 87.67 65.197 (64.190)
Source: Joint Plant Committee; *provisional; figure in () is value in same period of last year
• Data on import of total finished steel (alloy + non alloy) is given below for last five years and April-December 2014-15 (provisional):
Indian steel industry : Imports (in million tonnes)
Category 2009-10 2010-11 2011-12 2012-13 2013-14 April-Dec.
2014-15*
Total Finished Steel (alloy + non alloy) 7.38 6.66 6.86 7.93 5.45
6.492 (4.122)
Source: Joint Plant Committee; provisional; figure in () is value in same period of last year

Revamping of EQ2 TO EQ5 berths by construction a Multipurpose Purpose Terminal
in the Inner Harbour at Port of Visakhapatnam
Page | 20
Indian steel industry : Exports (in million tonnes)
Category 2009-10 2010-11 2011-12 2012-13 2013-14 April-Dec 2014-15*
Total Finished Steel (alloy + non alloy) 3.25 3.64 4.59 5.37 5.98
4.066 (4.355)
Source: Joint Plant Committee; *provisional; figure in () is value in same period of last year
In a recent development, steel industry is requesting Finance Ministry for increasing
import duties on the steel products to curb Chinese dumping and provide level playing
field for domestic players. According to RINL Director, the increasing imports from
China are having adverse effect on the industry’s efforts to increase the exports.
As per the report of the Working Group on Steel for the 12th Five Year Plan, there exist
many factors which carry the potential of raising the per capita steel consumption in the
country. These include among others, an estimated infrastructure investment of nearly a
trillion dollars, a projected growth of manufacturing from current 8% to 11-12%, increase in
urban population to 600 million by 2030 from the current level of 400 million, emergence of
the rural market for steel currently consuming around 10 kg per annum buoyed by projects
like Bharat Nirman, Pradhan Mantri Gram Sadak Yojana, Rajiv Gandhi Awaas Yojana
among others.
At the time of its release, the National Steel Policy 2005 had envisaged steel production to
reach 110 million tonnes (MT) by 2019-20. However, the Working Group on Steel for the
12th Five Year Plan has projected that domestic crude steel capacity in the country is likely to
be 140 MT by 2016-17 and has the potential to reach 149 MT based on the assessment of the
current ongoing projects, both in Greenfield and Brownfield. Projects aggregating 35 MT
capacities have already received financial closure. As per the latest estimates of World Steel
Association metal bulletin, the aggregate capacity is likely to reach 123 MT by 2016-17.
Description Million Tonnes
Crude Steel Production 123.0
Total Coking Coal demand 88.2
Non coking coal for sponge iron sector 28.41

Revamping of EQ2 TO EQ5 berths by construction a Multipurpose Purpose Terminal
in the Inner Harbour at Port of Visakhapatnam
Page | 21
Production of coal
In the year 2013-14, the total production of raw coal in India increased by 1.7 % (from
556.402 MT in 2012-13 to 565.766 MT in 2013-14)
The contribution of public sector and private sector in the production (MT) of raw coal in
India in 2013-14 was as follows:
Sector Year 2013-2014
Coking Non-Coking Total Coal
Public 49.503 478.578 528.081
Private 7.315 30.370 37.685
All India 56.818 508.948 565.766
The production of coking coal in 2013-14 in India was 56.818 MT (10.15 % growth over
2012-13) whereas the corresponding figure for non-coking coal was 508.948 MT (0.82 %
growth over 2012-13). Import of coking coal was 37.191 MT in 2013-14 against 35.557 MT
in 2012-13 resulting into an increase of 4.59 % over 2012-13. Import of Non-coking coal was
131.248 MT in 2013-14 against110.238 MT in 2012-13 (an increase of 19.07 % over 2012-
13). Main exporter of coal to India was Indonesia followed by Australia and South Africa.
According to the projection by Ministry of Steel, domestic steel production is slated to reach
200 million tonnes by 2020. However, the current global economic scenario may have a
moderating effect and the production may reach 170 MT by 2020 requiring 120 MT of
coking coal. Thus the total coking coal imports by 2020 are expected to be of the order of 60
to70 MT.
COAL REQUIREMENT FOR PLANTS IN PIZ
The development plans of the plants falling in the PIZ are as below:
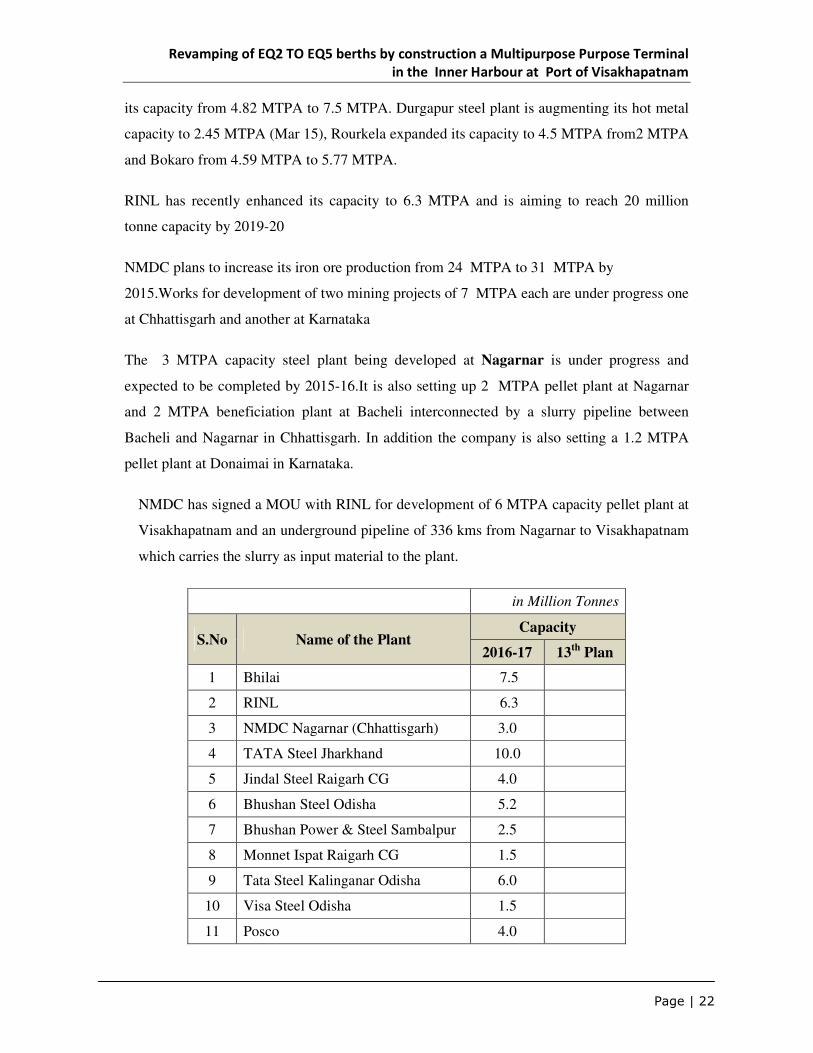
SAIL has planned to increase its Hot metal production capacity at the integrated steel plants
of Bhilai, Bokaro, Rourkela, Durgapur and Salem to increase its total capacity from 13.82
million tonnes per annum to 23.46 million tonnes under its current phase of expansion which
is expected to be complete by 2015-16. As a part of this plan, Bhilai Steel plant has increased
Revamping of EQ2 TO EQ5 berths by construction a Multipurpose Purpose Terminal
in the Inner Harbour at Port of Visakhapatnam
Page | 22
its capacity from 4.82 MTPA to 7.5 MTPA. Durgapur steel plant is augmenting its hot metal
capacity to 2.45 MTPA (Mar 15), Rourkela expanded its capacity to 4.5 MTPA from2 MTPA
and Bokaro from 4.59 MTPA to 5.77 MTPA.
RINL has recently enhanced its capacity to 6.3 MTPA and is aiming to reach 20 million
tonne capacity by 2019-20
NMDC plans to increase its iron ore production from 24 MTPA to 31 MTPA by
2015.Works for development of two mining projects of 7 MTPA each are under progress one
at Chhattisgarh and another at Karnataka
The 3 MTPA capacity steel plant being developed at Nagarnar is under progress and
expected to be completed by 2015-16.It is also setting up 2 MTPA pellet plant at Nagarnar
and 2 MTPA beneficiation plant at Bacheli interconnected by a slurry pipeline between
Bacheli and Nagarnar in Chhattisgarh. In addition the company is also setting a 1.2 MTPA
pellet plant at Donaimai in Karnataka.
NMDC has signed a MOU with RINL for development of 6 MTPA capacity pellet plant at
Visakhapatnam and an underground pipeline of 336 kms from Nagarnar to Visakhapatnam
which carries the slurry as input material to the plant.
in Million Tonnes
S.No Name of the Plant Capacity
2016-17 13th
Plan
1 Bhilai 7.5
2 RINL 6.3
3 NMDC Nagarnar (Chhattisgarh) 3.0
4 TATA Steel Jharkhand 10.0
5 Jindal Steel Raigarh CG 4.0
6 Bhushan Steel Odisha 5.2
7 Bhushan Power & Steel Sambalpur 2.5
8 Monnet Ispat Raigarh CG 1.5
9 Tata Steel Kalinganar Odisha 6.0
10 Visa Steel Odisha 1.5
11 Posco 4.0

Revamping of EQ2 TO EQ5 berths by construction a Multipurpose Purpose Terminal
in the Inner Harbour at Port of Visakhapatnam
Page | 23
in Million Tonnes
S.No Name of the Plant Capacity
2016-17 13th
Plan
12 Electro Steel , Jharkhand 2.2
13 JSPL Odisha 4.0
14 Tata Steel CG (MOU reviewed 5.5
15 SR Steel CG 3.2
M/S NMDC has indicated exclusive dependence on Vizag port for the import of coking coal
for their Nagarnar plant. As per projections given by SAIL, dependence on import of coking
coal through Vizag port is likely to increase to 5.5 MTPA by the end of 12th Plan. In
Chhattisgarh, Bahaspati Iron and Steel (Durg), Hira Power & Steel (Urla), and Narmad Ispat
(Raipur) are some of the promising candidates to use Vizag Port for importing coking coal
Thus the imports of coking coal through Vizag port is likely to be of the order of 12 to 15
MTPA for in the year 2021-22.
3.3.2 Power Sector
The total installed power capacity as on 31st March 2013 is 233930 MW of which 159794
mw is Thermal power. Of this, 138214 mw is coal based, 20381 is gas based and balance
diesel based capacity. Maharashtra is the leading state in power generation (32506mw)
followed by Gujarat. Andhra Pradesh is 4th in the rank with 17285 MW. Odisha and
Chhattisgarh occupy 13th and 14th positions respectively
Coal-based generation is expected to continue to be the predominant source of electricity in
the 12th plan period and beyond. Out of the total capacity addition of 75,785 MW envisaged
during the 12thplan, coal-based capacity addition is expected to be about 62,695 MW i.e.,
about 82.73%. Hydro, Nuclear and Gas based generation is expected to constitute about
12.14%, 3.70% and 1.43%. The estimated coal requirement is 842 MT at the end of 12th Plan
and 1040 MT at the end of 13th Plan. In another set of estimate the coal requirement is
projected at 905 MT corresponding to coal based capacity of 83400 MW
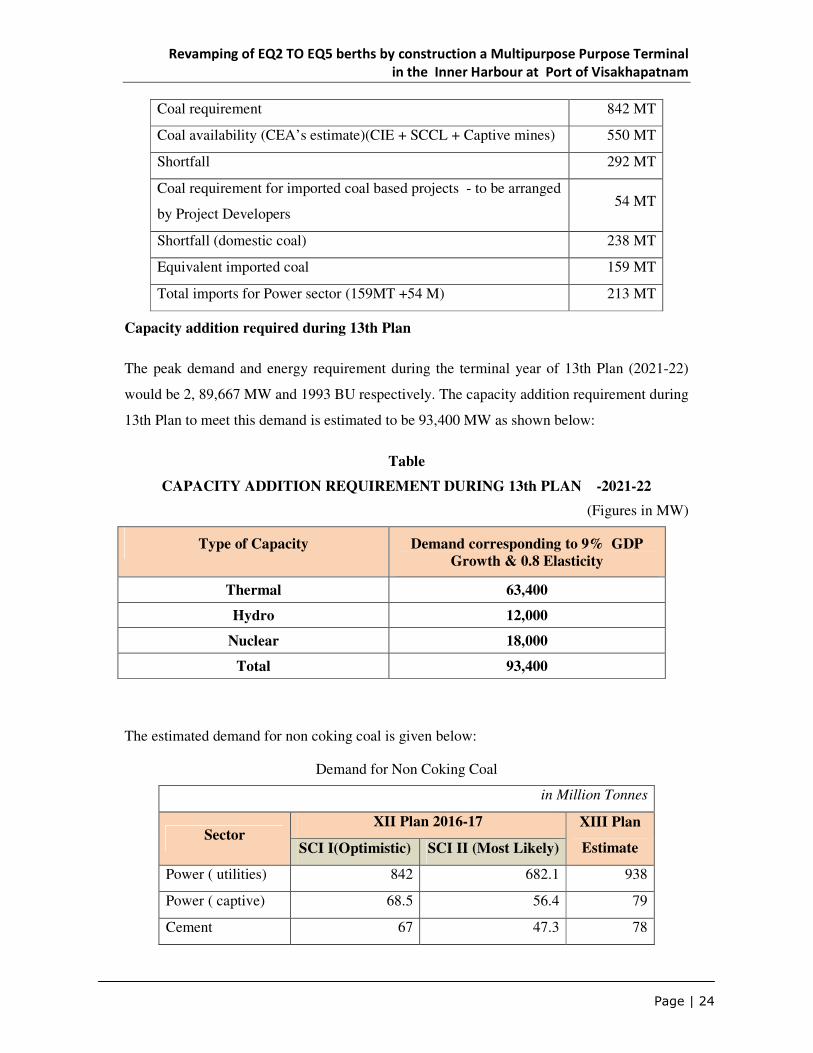
Against the requirement of 842 MT, the estimated import (including import by TPS designed
for imp coal) is 213 MT as detailed below.
Revamping of EQ2 TO EQ5 berths by construction a Multipurpose Purpose Terminal
in the Inner Harbour at Port of Visakhapatnam
Page | 24
Coal requirement 842 MT
Coal availability (CEA’s estimate)(CIE + SCCL + Captive mines) 550 MT
Shortfall 292 MT
Coal requirement for imported coal based projects - to be arranged
by Project Developers 54 MT
Shortfall (domestic coal) 238 MT
Equivalent imported coal 159 MT
Total imports for Power sector (159MT +54 M) 213 MT
Capacity addition required during 13th Plan
The peak demand and energy requirement during the terminal year of 13th Plan (2021-22)
would be 2, 89,667 MW and 1993 BU respectively. The capacity addition requirement during
13th Plan to meet this demand is estimated to be 93,400 MW as shown below:
Table
CAPACITY ADDITION REQUIREMENT DURING 13th PLAN -2021-22
(Figures in MW)
Type of Capacity Demand corresponding to 9% GDP
Growth & 0.8 Elasticity
Thermal 63,400
Hydro 12,000
Nuclear 18,000
Total 93,400
The estimated demand for non coking coal is given below:
Demand for Non Coking Coal
in Million Tonnes
Sector XII Plan 2016-17 XIII Plan
Estimate SCI I(Optimistic) SCI II (Most Likely)
Power ( utilities) 842 682.1 938
Power ( captive) 68.5 56.4 79
Cement 67 47.3 78
Revamping of EQ2 TO EQ5 berths by construction a Multipurpose Purpose Terminal
in the Inner Harbour at Port of Visakhapatnam
Page | 25
in Million Tonnes
Sector XII Plan 2016-17 XIII Plan
Estimate SCI I(Optimistic) SCI II (Most Likely)
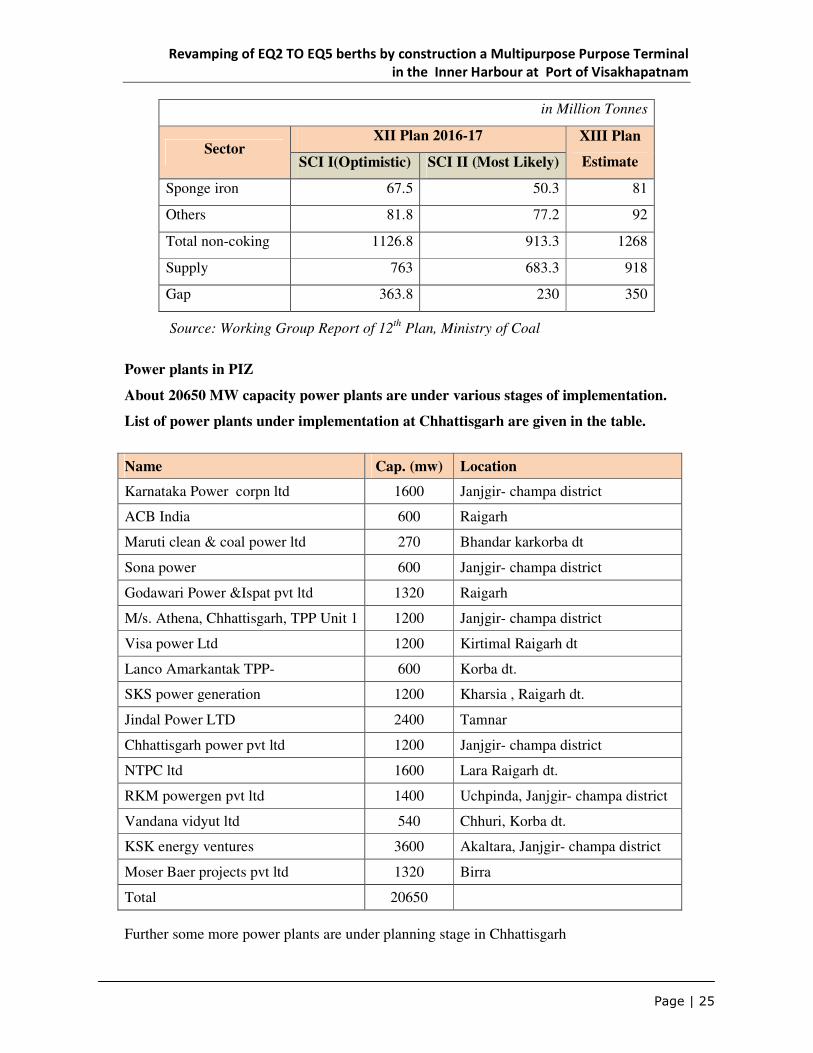
Sponge iron 67.5 50.3 81
Others 81.8 77.2 92
Total non-coking 1126.8 913.3 1268
Supply 763 683.3 918
Gap 363.8 230 350
Source: Working Group Report of 12th
Plan, Ministry of Coal
Power plants in PIZ
About 20650 MW capacity power plants are under various stages of implementation.
List of power plants under implementation at Chhattisgarh are given in the table.
Name Cap. (mw) Location
Karnataka Power corpn ltd 1600 Janjgir- champa district
ACB India 600 Raigarh
Maruti clean & coal power ltd 270 Bhandar karkorba dt
Sona power 600 Janjgir- champa district
Godawari Power &Ispat pvt ltd 1320 Raigarh
M/s. Athena, Chhattisgarh, TPP Unit 1 1200 Janjgir- champa district
Visa power Ltd 1200 Kirtimal Raigarh dt
Lanco Amarkantak TPP- 600 Korba dt.
SKS power generation 1200 Kharsia , Raigarh dt.
Jindal Power LTD 2400 Tamnar
Chhattisgarh power pvt ltd 1200 Janjgir- champa district
NTPC ltd 1600 Lara Raigarh dt.
RKM powergen pvt ltd 1400 Uchpinda, Janjgir- champa district
Vandana vidyut ltd 540 Chhuri, Korba dt.
KSK energy ventures 3600 Akaltara, Janjgir- champa district
Moser Baer projects pvt ltd 1320 Birra
Total 20650
Further some more power plants are under planning stage in Chhattisgarh
Revamping of EQ2 TO EQ5 berths by construction a Multipurpose Purpose Terminal
in the Inner Harbour at Port of Visakhapatnam
Page | 26
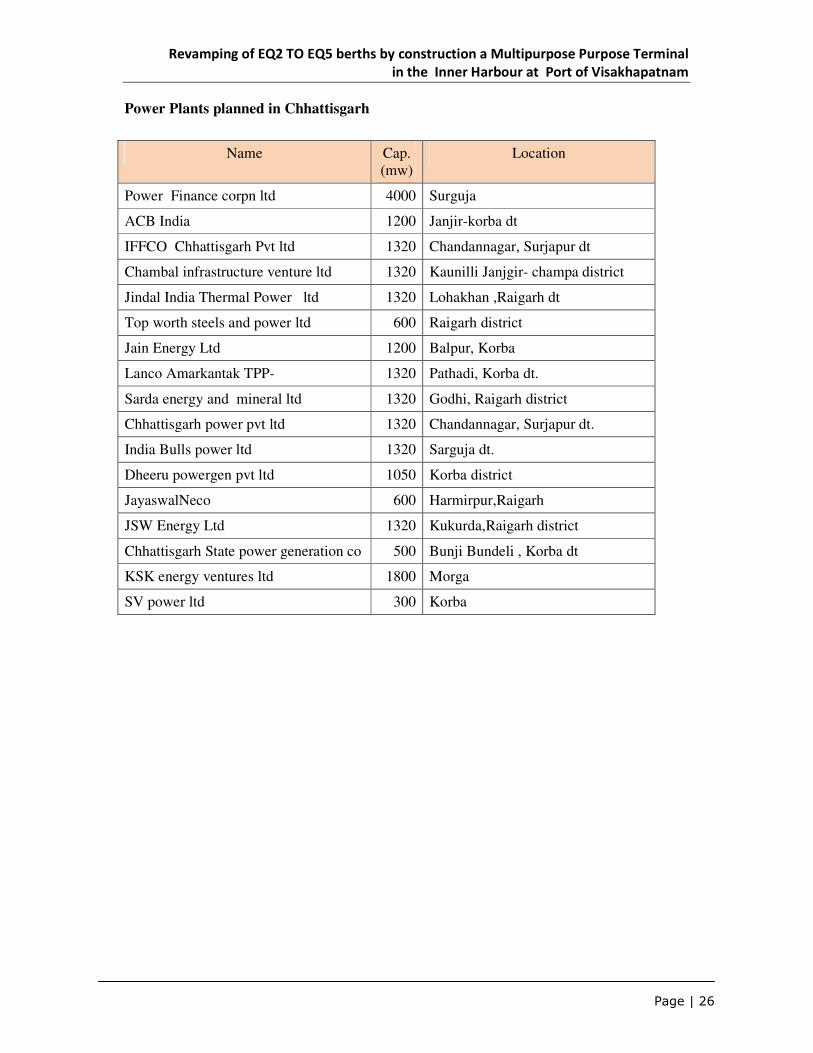
Power Plants planned in Chhattisgarh
Name Cap. (mw)
Location
Power Finance corpn ltd 4000 Surguja
ACB India 1200 Janjir-korba dt
IFFCO Chhattisgarh Pvt ltd 1320 Chandannagar, Surjapur dt
Chambal infrastructure venture ltd 1320 Kaunilli Janjgir- champa district
Jindal India Thermal Power ltd 1320 Lohakhan ,Raigarh dt
Top worth steels and power ltd 600 Raigarh district
Jain Energy Ltd 1200 Balpur, Korba
Lanco Amarkantak TPP- 1320 Pathadi, Korba dt.
Sarda energy and mineral ltd 1320 Godhi, Raigarh district
Chhattisgarh power pvt ltd 1320 Chandannagar, Surjapur dt.
India Bulls power ltd 1320 Sarguja dt.
Dheeru powergen pvt ltd 1050 Korba district
JayaswalNeco 600 Harmirpur,Raigarh
JSW Energy Ltd 1320 Kukurda,Raigarh district
Chhattisgarh State power generation co 500 Bunji Bundeli , Korba dt
KSK energy ventures ltd 1800 Morga
SV power ltd 300 Korba
Revamping of EQ2 TO EQ5 berths by construction a Multipurpose Purpose Terminal
in the Inner Harbour at Port of Visakhapatnam
Page | 27
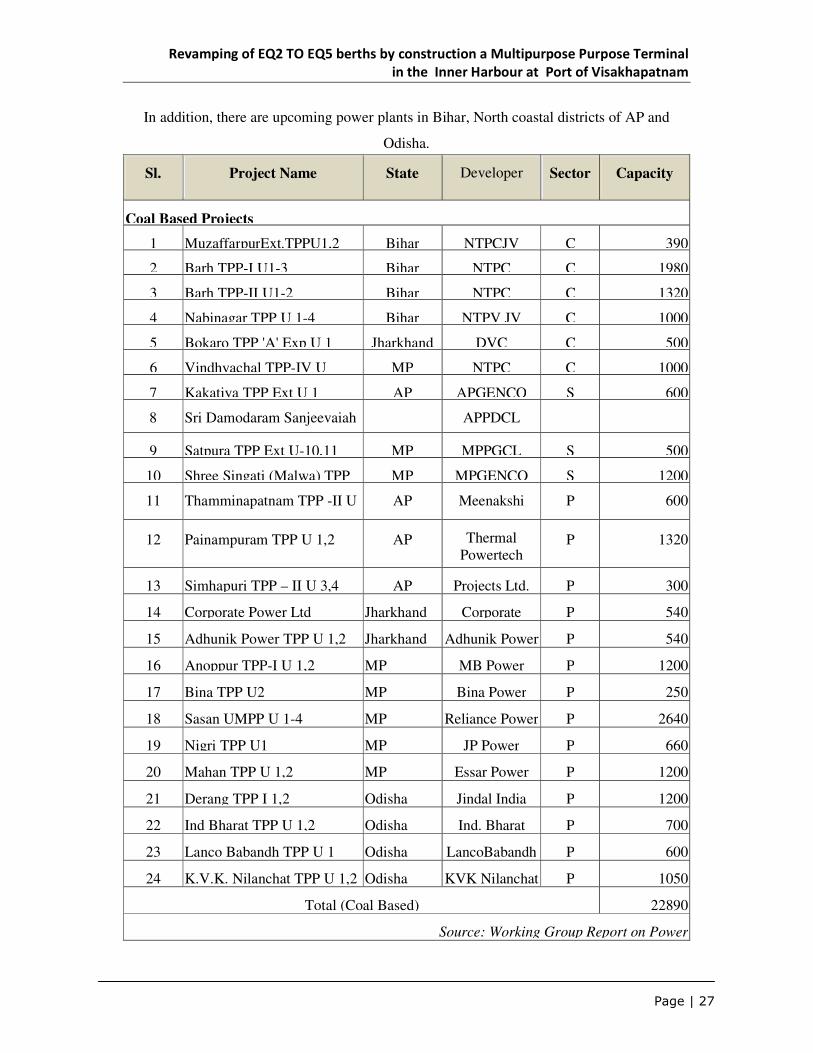
In addition, there are upcoming power plants in Bihar, North coastal districts of AP and
Odisha.
Sl. Project Name State Developer Sector Capacity
Coal Based Projects
1 MuzaffarpurExt.TPPU1,2 Bihar NTPCJV C 390
2 Barh TPP-I U1-3 Bihar NTPC C 1980
3 Barh TPP-II U1-2 Bihar NTPC C 1320
4 Nabinagar TPP U 1-4 Bihar NTPV JV C 1000
5 Bokaro TPP 'A' Exp U 1 Jharkhand DVC C 500
6 Vindhyachal TPP-IV U MP NTPC C 1000
7 Kakatiya TPP Ext U 1 AP APGENCO S 600
8 Sri Damodaram Sanjeevaiah APPDCL
9 Satpura TPP Ext U-10,11 MP MPPGCL S 500
10 Shree Singati (Malwa) TPP MP MPGENCO S 1200
11 Thamminapatnam TPP -II U AP Meenakshi P 600
12 Painampuram TPP U 1,2 AP Thermal Powertech
P 1320
13 Simhapuri TPP – II U 3,4 AP Projects Ltd. P 300
14 Corporate Power Ltd Jharkhand Corporate P 540
15 Adhunik Power TPP U 1,2 Jharkhand Adhunik Power P 540
16 Anoppur TPP-I U 1,2 MP MB Power P 1200
17 Bina TPP U2 MP Bina Power P 250
18 Sasan UMPP U 1-4 MP Reliance Power P 2640
19 Nigri TPP U1 MP JP Power P 660
20 Mahan TPP U 1,2 MP Essar Power P 1200
21 Derang TPP I 1,2 Odisha Jindal India P 1200
22 Ind Bharat TPP U 1,2 Odisha Ind. Bharat P 700
23 Lanco Babandh TPP U 1 Odisha LancoBabandh P 600
24 K.V.K. Nilanchat TPP U 1,2 Odisha KVK Nilanchat P 1050
Total (Coal Based) 22890
Source: Working Group Report on Power
Revamping of EQ2 TO EQ5 berths by construction a Multipurpose Purpose Terminal
in the Inner Harbour at Port of Visakhapatnam
Page | 28
Coal imports (steam)
The coal requirement for the power plants under implementation in the PIZ during 13th Plan
is likely to create an additional demand of 100 million tonnes of which 20 million tonnes
would be imported. Taking into consideration only 50 percent of the 20 MT import
keeping in view the competition from Gangavaram port, the projections for steam coal by
13th Plan works out to 13.5 million tonnes including coastal movement of thermal coal (3.5
MT) under low scenario and 16 MT under high scenario.
One of the proposed berths is ideal for handling steam coal in view of the draft
advantage and availability of back up space. However, keeping in view the growing
public concern about dust emissions, port is not in favour of allotting coal traffic for the
proposed new berths though it is an ideal berth for handling import steam coal and the
projected coal traffic amply justify the same.
3.3.3 Iron Ore and Pellets
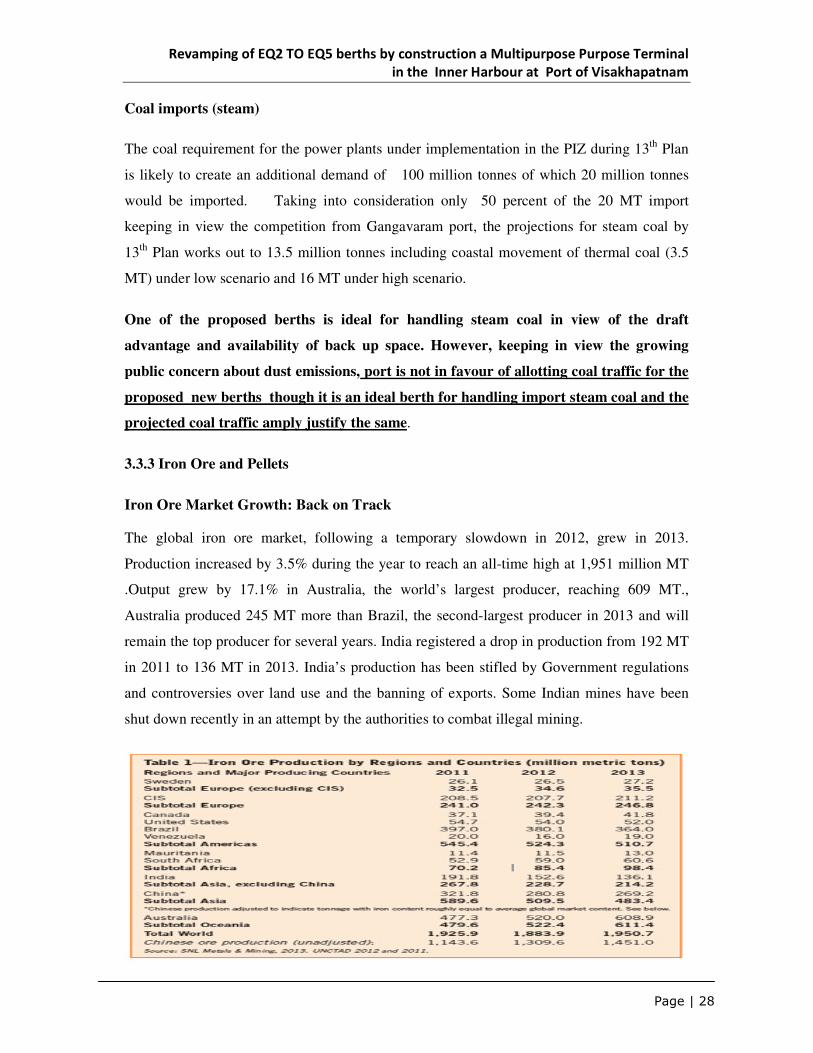
Iron Ore Market Growth: Back on Track
The global iron ore market, following a temporary slowdown in 2012, grew in 2013.
Production increased by 3.5% during the year to reach an all-time high at 1,951 million MT
.Output grew by 17.1% in Australia, the world’s largest producer, reaching 609 MT.,
Australia produced 245 MT more than Brazil, the second-largest producer in 2013 and will
remain the top producer for several years. India registered a drop in production from 192 MT
in 2011 to 136 MT in 2013. India’s production has been stifled by Government regulations
and controversies over land use and the banning of exports. Some Indian mines have been
shut down recently in an attempt by the authorities to combat illegal mining.
Revamping of EQ2 TO EQ5 berths by construction a Multipurpose Purpose Terminal
in the Inner Harbour at Port of Visakhapatnam
Page | 29
World pellet production was steady but lower in 2013, falling by 1.4% from 448 MT to 442
MT in 2013. There is continued increased interest in pellets,
Global Iron Ore Trade: 12 Years of Continuous Growth
Iron ore trade has increased faster than production, and the global seaborne market has grown
primarily due to higher Chinese demand. In 2013, the international iron ore trade reached a
record level of 1,283 MT, up by 12.8% compared to 2012. This is the 12th consecutive year
of growth. The increase was almost entirely the result of higher demand from China.
In 2013, China imported 820 MT, a 10% increase compared to 2012. China now accounts for
65.7% of total world imports. In Japan, iron ore imports grew by 3.7% to 135.9 MT. In the
Republic of Korea, imports fell by 3.9% to 63 MT. Taiwan increased imports by 18.5%.
Taken together, the Southeast Asian region including China now accounts for approximately
84% of total trade of iron ore. .
Formerly the world's No. 3 supplier of iron ore, India has been importing over the last two
years due to court-imposed restrictions aimed at curbing illegal mining in the key producing
states of Karnataka and Goa. The mine closures all over India, starting from Karnataka, Goa,
Odisha and Jharkhand, have created a massive disruption to supply. Mining in the key iron
ore states of Karnataka and Goa was banned in 2011 and 2012, respectively, following a
crackdown on illegal mining by the Supreme Court and the government. Several mines in top
producing Odisha state and in Jharkhand too were closed following government-imposed
restrictions on the renewal of mining licenses. The bulk of India's imports may come from
Australia and South Africa,
India's iron ore imports rose to a record 6.76 million tonnes in the first seven months of its
fiscal year as sliding global prices and limited supply at home pushed steel producers to buy
the raw material overseas. JSW Steel (JSTL.NS), India's third largest steel producer,
imported 4.6 million tonnes of iron ore in April-November, followed by Tata Steel
(TISC.NS) with nearly 1 million tonnes, according to data from industry consultancy
SteelMint, which tracked shipments at 12 ports. Tata Steel brought in 2.2 MT, while Essar
Steel imported half a million tonnes. JSW Steel, may import about 6 million tonnes of iron
ore in 2014-15.

Revamping of EQ2 TO EQ5 berths by construction a Multipurpose Purpose Terminal
in the Inner Harbour at Port of Visakhapatnam
Page | 30
According to the Ministry of Commerce, India’s iron ore imports in the first seven months of
FY 2014-15 stood at around 4.27 million tonnes, compared to a mere 367,000 tonnes in the
full FY2013-14. According to conservative estimates, total iron ore imports by India are
expected to grow to over 10 million tonnes in the FY2014-15. However, other estimates, such
as the one by Industry consultancy Steel Mint, peg the figure at between 11-15 million tonnes
The country may ship in up to 45 million tonnes over the next three years as home-grown
iron ore output falls short of domestic steel production needs. According to Federation of
Indian Mineral Industries the country may import 10 and 15 million tonnes every fiscal year
over the next three years to meet the shortfall,
At the time of the mining ban in 2012, there were 105 mines with environment clearances, of
which 97 were operational. Iron ore mined in Goa, around 90 million tonnes a year before the
ban, was largely exported to China. The government of Goa has decided to grant leases for
mines in phases, in line with the recent Supreme Court (SC) order giving this power to the
state government. Only 22 mines out of 122 that are eligible to restart in Karnataka have
resumed operations, In Odisha, around a third of 56 iron ore mines are still closed and in
Jharkhand, the third biggest producer in the past fiscal year, 12 out of 17 mines are shut.
According to data from the World Steel Association, global apparent steel use and steel
production had each increased by 1.2 per cent during 2012 , China continued to increase its
production with its market share rising from 45.4 per cent in 2011 to 46.3 per cent in 2012.
Australia and Brazil accounted for 73.5 per cent of global exports of 1.11 billion tonnes. In
India, mining bans and taxes on iron-ore exports have significantly constrained the country’s
export volumes.

Revamping of EQ2 TO EQ5 berths by construction a Multipurpose Purpose Terminal
in the Inner Harbour at Port of Visakhapatnam
Page | 31
Iron ore imports at VPT
The imports of iron ore through the port are fluctuating during the last five years ranging
between 33000 in 2013-14 and 8.35 lakhs in 2009-10.These imports are mainly by ESSAR to
supplement the iron ore supply to its pelletisation plant whenever there is disruption to the
transportation of iron ore through the slurry pipeline. The details of imports of iron ore during
past five years is given below:
IMPORTER WISE IRON ORE/ IRON PELLETS AT PORT OF VIZAG
Year Name of the importer Quantity (LT)
Iron ore iron pellets
2009-10
ESSAR 6.23 0.39
Bhushan Power &steel 0.44 1.06
Essel Mining 0.23
TOTAL 6.90 1.45
2010-11
ESSAR STEEL 0.27
Bhushan power & steel 1.68
Nirnidhi/VISA steel 0.36 -
Total 0.63 1.68
2011-12
Bhushan power & steel - 0.73
NOVA iron ore - 0.15
Total 0.88
2012-13
Bhushan power & steel 0.87 0.45
ESSAR STEEL 0.12 -
RINL/SAIL - 1.15
Total 0.99 1.60
2013-14 Essar steels 0.33 -
TOTAL 0.33 -
During the current financial year also, the iron ore imports through Vizag port are miniscule.
Only 64319 tonnes of cargo was imported during 2014-15 against the overall imports of 8
million tonnes by the country.

Revamping of EQ2 TO EQ5 berths by construction a Multipurpose Purpose Terminal
in the Inner Harbour at Port of Visakhapatnam
Page | 32
It is evident from the table that ESSAR is resorting to import of iron ore only at times of short
supply by slurry pipeline. SAIL, has been assured of supply of iron ore from the mines and so
also RINL. Given the expansion plans of NMDC for development of additional mines at
Bailadilla, it is felt that supply to the plants may not be an issue. In the event of augmentation
of expansion of pelletization plant by ESSAR, the company may resort to import of iron ore
fines. However, the quantities are likely to be modest.
Essar Steel Commissioned an integrated Pellet Complex at Paradip IN 2012 in state of
Odisha comprising of Iron ore beneficiation facility at Dabuna (Keonjhar) and 6 MTPA
Pellet plant at Paradeep (Jagatsinghpur) along with 253 kms long slurry pipe line with 12
MTPA carrying capacity connecting beneficiation facility and Pellet Plant. With the
commissioning of this integrated complex, Essar Steel has become the largest Pellet producer
in the country with an annual Pellet production capacity of 14 MTPA – 8 MTPA at Vizag
complex and 6 MTPA at Odisha complex. Further 6 MTPA Pellet plant at Paradeep is
scheduled to be commissioned shortly including the corresponding up scaling of the
Beneficiation Plant, taking the annual Pellet Production capacity of Odisha Complex to 12
MTPA.
Bhushan power & steel is a 2.3 MTPA integrated steel plant in Orissa and is being expanded
to 3.5 MTPA capacity. The company has already been allotted three adjoining non-coking
coal blocks at nearby Jamkhani, Bijhan in Orissa, and Patal East in Jharkhand and has got
one coking coal block at Rohne in Jharkhand, providing added logistic advantage in mining.
Iron ore mines at Chatupura, Jharkhand has been allotted. State of Odisha has recommended
for grant of mining lease for 224 million tons of iron ore reserves in Thakurani block and
Sundergarh Keonjhar block further enhancing the self-reliance. Hence the company is not
likely to import iron ore fines.
As regards the other players, the volumes are minimal and not certain.
EXPORTS OF IRON ORE AND PELLETS –TRAFFIC INCLUDING COASTAL
LOADING
Traffic on account of iron ore and pellets at VPT is predominantly coastal .M/S ESSAR and
ISPAT (JSW) are the main drivers of traffic thro’ Vizag PORT. Essar Steel has built an 8
MTPA iron ore pellet plant in Visakhapatnam, Andhra Pradesh, to cater to the pellet

Revamping of EQ2 TO EQ5 berths by construction a Multipurpose Purpose Terminal
in the Inner Harbour at Port of Visakhapatnam
Page | 33
requirements of the HBI plant in Hazira, Gujarat. The plant has an assured supply of high-
quality iron ore from the beneficiation plant at Bailadilla, Chhattisgarh. The plant is capable
of producing both DR and BF grade pellets and is linked to the Visakhapatnam port through
conveyors to enable easy material movement in and out of the plant .The plant has built 267
km long Kirandul- Vizag Slurry Pipe line for transportation of Iron ore. M/s ESSAR has a
proposal to augment the capacity to 12 MTPA by 2021-22.
JSW Steel plans to focus on expansion of the unit. With an opportunity to expand capacity up
to 15 million tonnes a year at a much lower cost, the company has decided to enhance
capacity initially to 5 million tonnes from the current 3.3 million tonnes, for a ₹3,300-crore
investment. Government of India has entered in to a short term agreement with Japan for
export of 2.75 MTPA of iron ore thro’ Vizag up to 2015-16. These exports are likely to
continue at the level of 2 to 2.5 MTPA by the channelizing agency MMTC. Welspun Max is
one of the regular trading partners moving close to half million tonnes of iron ore coastally.
Taking all these facts in to consideration the iron ore and pellet traffic is likely to be the
order of 17.3 MTPA and 22.5 MTPA by end of 12th plan and 13th plan respectively. These
cargoes will be handled at two iron ore berths of outer harbour and WQ1 berth of Inner
harbour. And the facility is concessioned to Vadinar oil Terminal (ESSAR steel).
Outer Harbour Inner Harbour
Infrastructure Berth: 295m X 2 berths Berth: 280m;
Draft: 21m Draft: 14m
Capacity 16.2 MMTPA6.8 MMTPA
Cargo Iron ore and Iron ore pellets
Project status Berths already operational.
Mechanization to start 1 year after
signing of concession Concessionaire and period VADINAR OIL TERMINAL 30 years .
This cargo is also ruled out for the present project as these cargoes have been identified
for ore berths in the outer harbour and WQI berth in the Inner harbour and
concessioned to Vadinar oil terminal
Revamping of EQ2 TO EQ5 berths by construction a Multipurpose Purpose Terminal
in the Inner Harbour at Port of Visakhapatnam
Page | 34
3.3.4 Aluminium Industry
Aluminium is one of the most common and widely used metals and the metal' s production
outstrips that of all other non-ferrous metals. Aluminium ranks second, next only to steel, in
terms of volumes used, due to its versatility, which stems from its excellent properties.
Bauxite is still the only ore used for commercial production.
World Scenario:
World alumina refining capacity has increased from 68.4 million tonnes in 2005 to about
105.9 million tonnes in 2010. The world production of alumina has increased from 61 million
tonnes in 2005 to about 95.6 million tonnes in 2012. China is the main producer of alumina in
the world (39%) followed by Australia (22%)
The total world bauxite resources (Measured, Indicated and Inferred) are estimated to be of
the order of 55 to 75 billion tonnes while the reserves (Measured) are estimated to be at 28
billion tonnes.
World Bauxite production is 211 million tonnes in 2010. Major producers are Australia,
China, Brazil, India and Guinea, and Jamaica. Australia alone accounts for 33% of the world
production. Besides aluminium, which consumes bulk of the bauxite production, chemical,
refractory and cement industries together consume bauxite to the tune of 10 – 12% of total
production.
Indian Scenario
As per Mineral Year Book, the installed capacity of alumina plants in the country was 4.885
million tonnes per annum, as on 31st march 2013 with breakup of NALCO 2.3 million
tonne, Vedanta 1 million tonne, and HINDALCO 1.5 million tonnes. The total production of
alumina in India is 3.6 million tonnes in 2012-13.
The production of primary aluminium in India was 1.72 million tonnes in 2012-13.The “Per
Capita” consumption is about 1.3 kg (which was in the range of 0.5 kg about a decade back)
as compared to world average of 12-15 kg.
It is projected that aluminium production capacity in India at the end of the 12th Plan period
would be about 4.7 million tonnes. This would require about 9.2 million tonnes of alumina.
Revamping of EQ2 TO EQ5 berths by construction a Multipurpose Purpose Terminal
in the Inner Harbour at Port of Visakhapatnam
Page | 35
So, if all the announced alumina capacity additions fructify, India would be surplus in
alumina and would be a significant player in alumina trade. To produce 13.3 million tonnes
of alumina at the end of the 12th Plan period, the bauxite requirement would be about 40
million tonnes.
Aluminium is the metal of the future. In India more than 45 percent of Aluminium is used in
power generation .In order to realise the mission of supplying 24x7 power to all, there is an
imminent need to augment the production of Aluminium.
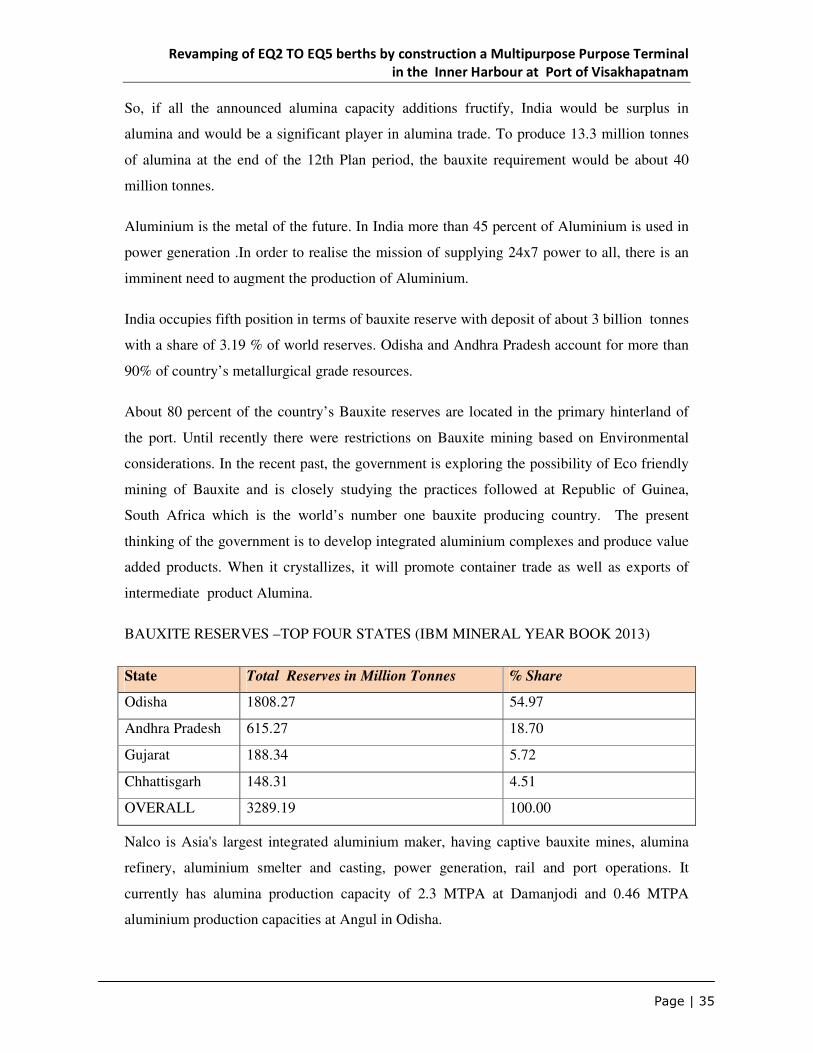
India occupies fifth position in terms of bauxite reserve with deposit of about 3 billion tonnes
with a share of 3.19 % of world reserves. Odisha and Andhra Pradesh account for more than
90% of country’s metallurgical grade resources.
About 80 percent of the country’s Bauxite reserves are located in the primary hinterland of
the port. Until recently there were restrictions on Bauxite mining based on Environmental
considerations. In the recent past, the government is exploring the possibility of Eco friendly
mining of Bauxite and is closely studying the practices followed at Republic of Guinea,
South Africa which is the world’s number one bauxite producing country. The present
thinking of the government is to develop integrated aluminium complexes and produce value
added products. When it crystallizes, it will promote container trade as well as exports of
intermediate product Alumina.
BAUXITE RESERVES –TOP FOUR STATES (IBM MINERAL YEAR BOOK 2013)
State Total Reserves in Million Tonnes % Share
Odisha 1808.27 54.97
Andhra Pradesh 615.27 18.70
Gujarat 188.34 5.72
Chhattisgarh 148.31 4.51
OVERALL 3289.19 100.00
Nalco is Asia's largest integrated aluminium maker, having captive bauxite mines, alumina
refinery, aluminium smelter and casting, power generation, rail and port operations. It
currently has alumina production capacity of 2.3 MTPA at Damanjodi and 0.46 MTPA
aluminium production capacities at Angul in Odisha.

Revamping of EQ2 TO EQ5 berths by construction a Multipurpose Purpose Terminal
in the Inner Harbour at Port of Visakhapatnam
Page | 36
It is projected that aluminium production capacity in India at the end of the 12th Plan Period
viz, 2016-17 would be about 4.7 million tonnes. This would require about 9.2 million tonnes
of alumina.
NALCO has been granted mining lease over Gudam and KR Konda bauxite reserves in
Andhra Pradesh and Pottangi in Odisha. Based on bauxite reserve, the company plans to
develop a 42 LTPA bauxite mines and 14 LTPA alumina refinery complex in Andhra
Pradesh.
Nalco will add an additional one million tonnes per annum capacity by 2016 to its existing
2.3 MTPA alumina refinery in Odisha. The company feeds the alumina refinery from its
captive bauxite mine at Panchpatmali hills of Koraput district, having 6.3 MTPA production
capacities. It is also in the process of expanding the capacity of the mine to 6.8 MTPA by this
year. According to vision 2020 document of Nalco, the company has plans to have 4.70
MTPA alumina making and 1.730 MTPA aluminium producing capacities in India by then at
an investment of over Rs 40,000 crores
Hindalco's Greenfield projects have made significant progress. Utkal Alumina, 1.5 MTPA
alumina refining project, made considerable headway. The company is also setting up3.60
LTPA aluminium smelter at Bargawan and 900 MW captive power plant at Mahan in
Madhya Pradesh, based on captive coal consumption (JV) from Sidhi district, Madhya
Pradesh. The other integrated aluminium project, namely, Aditya Alumina & Aluminium
Project, alumina refinery at Koraput, 3.60 LTPA aluminium smelter at Lapanga, Odisha and
900 MW captive power plants was on schedule. A joint venture agreement on bauxite mines
was signed with OMC Ltd.
Another Greenfield project, viz Jharkhand Aluminium Project at Sonahatu, 55 km from
Ranchi, entails setting up a 7.20 LTPA aluminium smelter with 1650 MW captive power
plant. The project is likely to be commissioned in mid-2015. In addition, company's ongoing
Brownfield expansion is progressing well;
Vedanta plans to invest to expand its alumina refining capacity from 10 LTPA at Lanjigarh in
Odisha to 50 LTPA, subject to Government approval by increasing the capacity of the
current alumina refinery from 10 LTPA to 20 LTPA through de-bottlenecking and by
constructing a 30 LTPA alumina refinery and an associated 210 MW captive power plant.

Revamping of EQ2 TO EQ5 berths by construction a Multipurpose Purpose Terminal
in the Inner Harbour at Port of Visakhapatnam
Page | 37
The construction of alumina refinery project is on hold and awaiting approvals. Work on
setting up another12.5 LTPA aluminium smelter in Jharsuguda, is under progress. Further,
Vedanta Aluminium entered into an agreement with the Orissa Mining Corporation (OMC)
regarding the establishment of the alumina refinery, an aluminium smelter and associated
captive plants in the Lanjigarh and Jharsuguda district of Odisha. . So, if all the announced
alumina capacity additions fructify, India would be surplus in alumina and would be a
significant player in alumina trade. To produce 13.3 million tonnes of alumina at the end of
the 12th Plan period, the bauxite requirement would be about 40 million tonnes.
The Report of the Sub Group for the 12th Plan Period has recommended that all efforts
should be directed towards ensuring bauxite availability to the alumina refineries.
The port may revisit their earlier plans of allotting one of the berths of West Quay North for
development of Mechanised facility to the Alumina industry.
(Source report of working group on mineral exploration and development other than coal and
lignite and IBM mineral year book 2013)
Anrak Alumina
The firm has a proposal for setting up a 1.5 to 2 MTPA Alumina Refinery in Visakhapatnam
District. Initial volume of exports would be 1.5 MTPA. In a recent development, the firm has
approached the Port for allotment of land for construction of storage tanks for storing alumina
and to allot a berth for handling 1.5 million tonnes of Alumina. Port has tentatively identified
EQ 5/EQ 6 berth for this cargo.
3.3.5 Food grains
Ministry of Commerce has been extending financial support for infrastructural Projects for
Export promotion under ASIDE (Assistance to States for Infrastructure development for
Exports) scheme. Vizag Port has identified the following schemes under ASIDE.
• Mechanized Facility For Export of Food grains
• Development of satellite port including Fishing Harbour at Bheemli.
• Development of SEZ at Lankelapalem
• Development of CFS at Mindi
• Up gradation and strengthening of Railway system.
Revamping of EQ2 TO EQ5 berths by construction a Multipurpose Purpose Terminal
in the Inner Harbour at Port of Visakhapatnam
Page | 38
Though these schemes were identified initially, a view was taken to consider the project for
developing mechanized facilities for export of food grains on priority basis under ASIDE
scheme. The port has identified one berth i.e. EQ5 in the inner harbour as a captive facility
for export of food grains and has conceptualized a proposal to set up mechanized facility for
export of food grains under ASIDE scheme. In response, APIIC , in the month of January
2014, had submitted a report for Mechanisation of Food grains export infrastructure at port
of Visakhapatnam prepared by the Consultancy Development Centre (CDC), under the
Ministry of Science and Technology. The important findings of the report are summarized
below;
Findings of the report of CDC (APIIC)
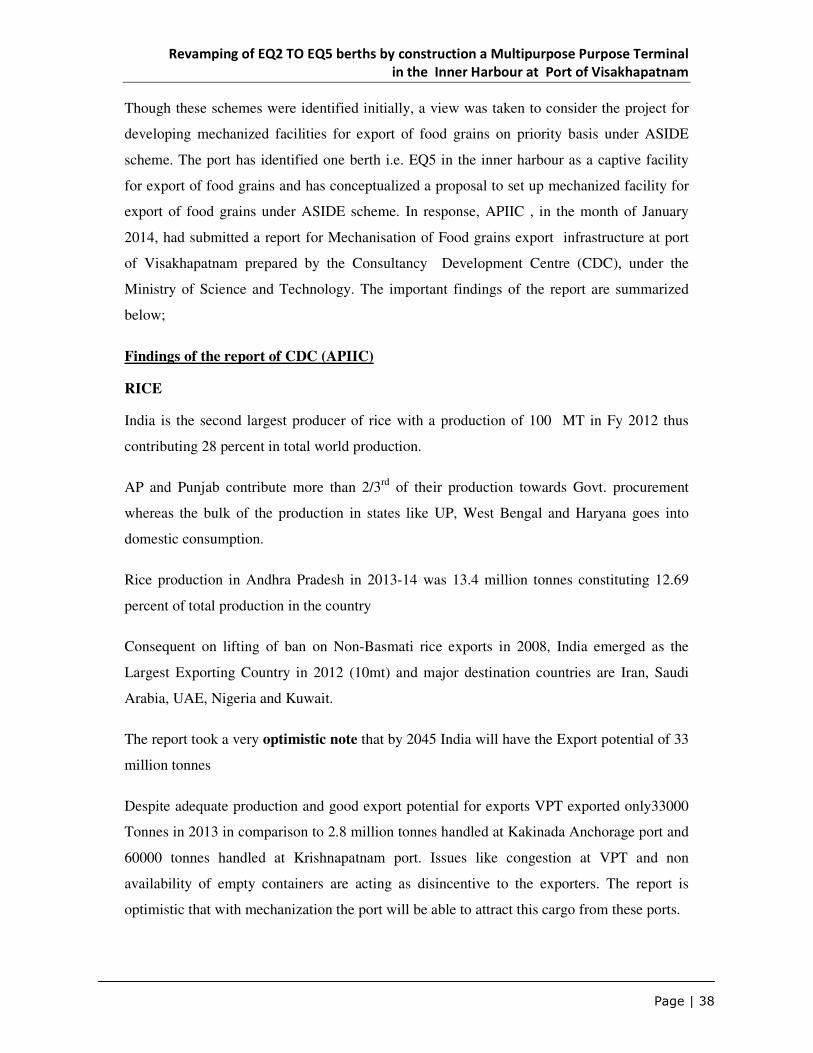
RICE
India is the second largest producer of rice with a production of 100 MT in Fy 2012 thus
contributing 28 percent in total world production.
AP and Punjab contribute more than 2/3rd of their production towards Govt. procurement
whereas the bulk of the production in states like UP, West Bengal and Haryana goes into
domestic consumption.
Rice production in Andhra Pradesh in 2013-14 was 13.4 million tonnes constituting 12.69
percent of total production in the country
Consequent on lifting of ban on Non-Basmati rice exports in 2008, India emerged as the
Largest Exporting Country in 2012 (10mt) and major destination countries are Iran, Saudi
Arabia, UAE, Nigeria and Kuwait.
The report took a very optimistic note that by 2045 India will have the Export potential of 33
million tonnes
Despite adequate production and good export potential for exports VPT exported only33000
Tonnes in 2013 in comparison to 2.8 million tonnes handled at Kakinada Anchorage port and
60000 tonnes handled at Krishnapatnam port. Issues like congestion at VPT and non
availability of empty containers are acting as disincentive to the exporters. The report is
optimistic that with mechanization the port will be able to attract this cargo from these ports.

Revamping of EQ2 TO EQ5 berths by construction a Multipurpose Purpose Terminal
in the Inner Harbour at Port of Visakhapatnam
Page | 39
Wheat
India’s Wheat production in the year 2012 reached an all time high of 95 MT. Uttar Pradesh
is the largest contributor followed by Punjab. India Exported 7 MT of wheat in 2012 and 6.5
MT in 2013 .The major export destination countries are USA, Australia, Canada, Russia,
Argentina and Ukraine.
WHEAT export from VPT is derived from volume brought in from northern states like
Punjab, Uttar Pradesh and Haryana by road/ rail. However decision in regard to exports from
a port is not controlled by individual parties, rather the volume designated by the Central
Government while deciding to export is the absolute limit a port can handle.
As per the report the export volume is likely to be of the order of 20 MT by 2045.
Maize
Karnataka, Maharashtra, Rajasthan, Madhya Pradesh and Andhra Pradesh are the top five
producers of the maize in the country. Karnataka accounts for 20% while Rajastan and
Maharastra have contributed 10% each. Andhra Pradesh produced 4 million tonnes of maize
in 2013-14.
In Andhra Pradesh, export of Maize is undertaken only from Kakinada and VPT. However
since 2012, Krishnapatnam also started handling maize and in 2013, Vizag and Kakinada
ports handled 1millon tonnes each and Krishnapatnam port handled 0.2 MT
According to Directorate of Maize research, the Maize production is expected to treble by
2050 while the consumption would grow by more than two fold.
The report projected the exports of Maize as 10 million tonnes by 2045. The states that use
VPT for the export of maize are Bihar, Chattisgarh, Karnataka and West Bengal
SOYABEAN
Madhya Pradesh, Maharashtra and Rajasthan are the major soya bean producers in the
country. Andhra Pradesh had only 1.6 percent share in the production.
Bulk of produce is exported in addition to the consignments that are dispatched from other
soya producing states like Madhya Pradesh and Chhattisgarh.

Revamping of EQ2 TO EQ5 berths by construction a Multipurpose Purpose Terminal
in the Inner Harbour at Port of Visakhapatnam
Page | 40
Around1.5 Million Tonnes of SBM is estimated to be exported to Iran in the fiscal 2013-14.
This was possible due to the trade sanctions imposed by the western countries on Iran. As a
result countries like Brazil and Argentina could not trade with Iran. But recently Iran signed a
deal with 6 other countries to agree to inspection. India is a loser of this outcome.
TOTAL FOODGRAIN EXPORT FROM THE COUNTRY IS ESTIMATED AS 63
MILLION TONNES BY 2045
COMPETING FACILITIES
Krishnapatnam port is the major competitor for rice and wheat. The port is able to attract
cargo from Vizag and Kakinada ports. The port has been handling rice in the bagged form in
containers. Better rake handling facility at the port‘s container terminal is a major advantage
to the port.
In the recent past Krishnapatnam port started handling Rice in bulk. Sea Shell Logistics who
has been exporting rice through the port has experimented this endeavour and proposes to
continue. (Source: VIZAG industrial scan JAN 2015)
Kakinada port is a big competitor for rice and maize export. About 3 million tonnes of rice
was exported in the year 2013 from Kakinada port. The port handled about 1 million tonne of
Maize in the year 2013. .Proximity of major maize producing regions is one of the
advantages for the Kakinada port.
As far as Soya Bean Meal is concerned, Krishnapatnam and Kakinada are not likely to pose
much competition to VPT and VPT is likely to have dominance in SBM handling with
moderate to high probability after mechanisation.
PROJECTION CONSIDERED FOR VIZAG PORT BY THE CDC The report has
considered 6%, 10%and 15% share respectively for Low, Medium and High growth scenarios
for Vizag port and the projected volumes are given below
PROJECTED CARGO TRAFFIC OF RICE, MAIZE, WHEAT AND SOYABEAN THRO’
VIZAG PORT
2016-17 2017-18 2021-22 2026-27 2031-32
Low growth 1.5 1.6 1.9 2.2 2.6
Medium Growth 2.5 2.6 3.1 3.7 4.3
High growth 3.8 4.0 4.7 5.5 6.5
Revamping of EQ2 TO EQ5 berths by construction a Multipurpose Purpose Terminal
in the Inner Harbour at Port of Visakhapatnam
Page | 41
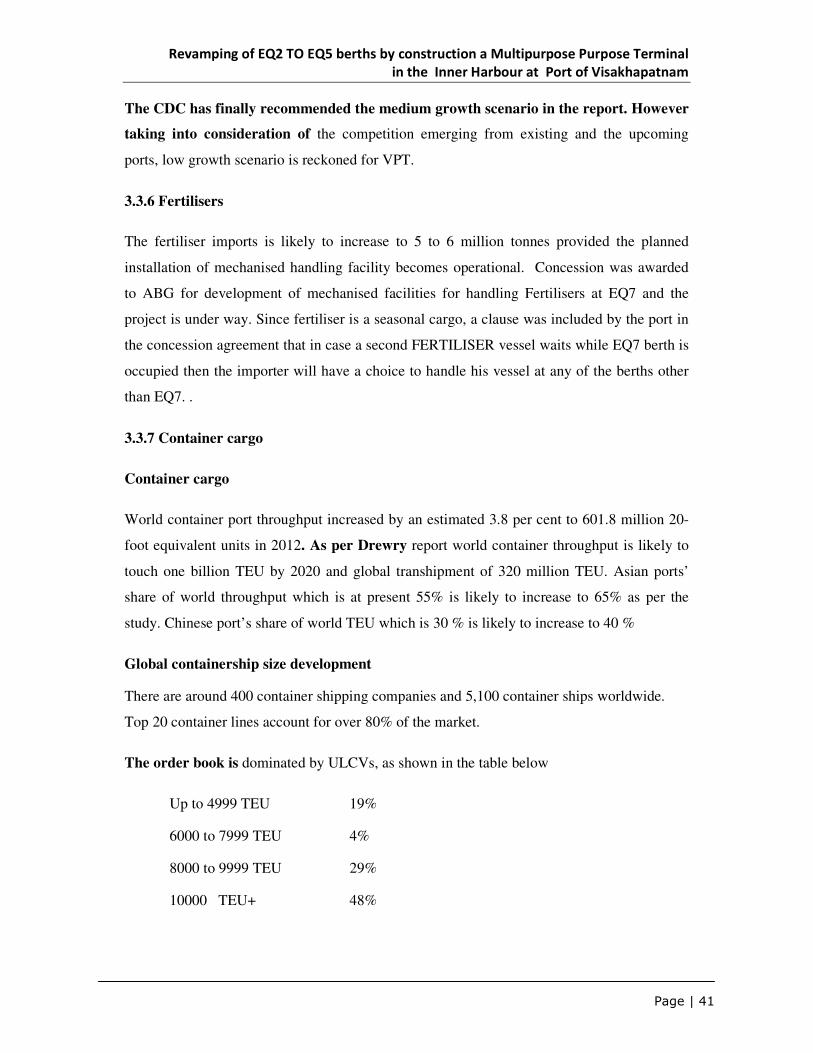
The CDC has finally recommended the medium growth scenario in the report. However
taking into consideration of the competition emerging from existing and the upcoming
ports, low growth scenario is reckoned for VPT.
3.3.6 Fertilisers
The fertiliser imports is likely to increase to 5 to 6 million tonnes provided the planned
installation of mechanised handling facility becomes operational. Concession was awarded
to ABG for development of mechanised facilities for handling Fertilisers at EQ7 and the
project is under way. Since fertiliser is a seasonal cargo, a clause was included by the port in
the concession agreement that in case a second FERTILISER vessel waits while EQ7 berth is
occupied then the importer will have a choice to handle his vessel at any of the berths other
than EQ7. .
3.3.7 Container cargo
Container cargo
World container port throughput increased by an estimated 3.8 per cent to 601.8 million 20-
foot equivalent units in 2012. As per Drewry report world container throughput is likely to
touch one billion TEU by 2020 and global transhipment of 320 million TEU. Asian ports’
share of world throughput which is at present 55% is likely to increase to 65% as per the
study. Chinese port’s share of world TEU which is 30 % is likely to increase to 40 %
Global containership size development
There are around 400 container shipping companies and 5,100 container ships worldwide.
Top 20 container lines account for over 80% of the market.
The order book is dominated by ULCVs, as shown in the table below
Up to 4999 TEU 19%
6000 to 7999 TEU 4%
8000 to 9999 TEU 29%
10000 TEU+ 48%

Revamping of EQ2 TO EQ5 berths by construction a Multipurpose Purpose Terminal
in the Inner Harbour at Port of Visakhapatnam
Page | 42
LARGEST DEPLOYED VESSELS, 2014:
Asia - North Europe: 18,270 teu
Asia - Mediterranean: 14,000 teu
Asia - US West Coast: 13,800 teu
Asia - East Coast South America: 9,700 teu
Europe - East Coast South America 8,800 teu
Asia - West Coast South America: 9,200 teu
Asia - Middle East: 14,000 teu
Europe - South Africa - Asia: 12,500 teu
India’s Mundra Port handled one of the largest and longest container vessel - MSC Valeria,
having a capacity of 14,000 teu in June 2013
The typical dimensions of container vessels according to size are given below. The Outer
harbour can accommodate even the largest vessel where as the inner harbour can
accommodate vessels of 2000 to 2500 TEUs due to basin width restriction to handle vessels
of beam larger than panamax.
TEU LENGTH BEAM DRAFT BOXES WIDE
12000 365-380 48-50 15.5 19-20
15000 400 56 16 22
18000 400 59 16 23
22-25000 440-450 59-61 16.5 23-24
Panamax specifications have been in effect since the opening of the canal in 1914. Ships that
do not fall within the Panamax-sizes are called post-Panamax. In 2009 the ACP published the
"New Panamax" that will be in effect when the canal's third set of locks, larger than the
current two, becomes operational.
PANAMAX THIRD LOCK NEO PANAMAX
Length(m) 294.13 427 366
Width(m) 32.31 55 49
Draft(m) 12.04 18.3 15.2
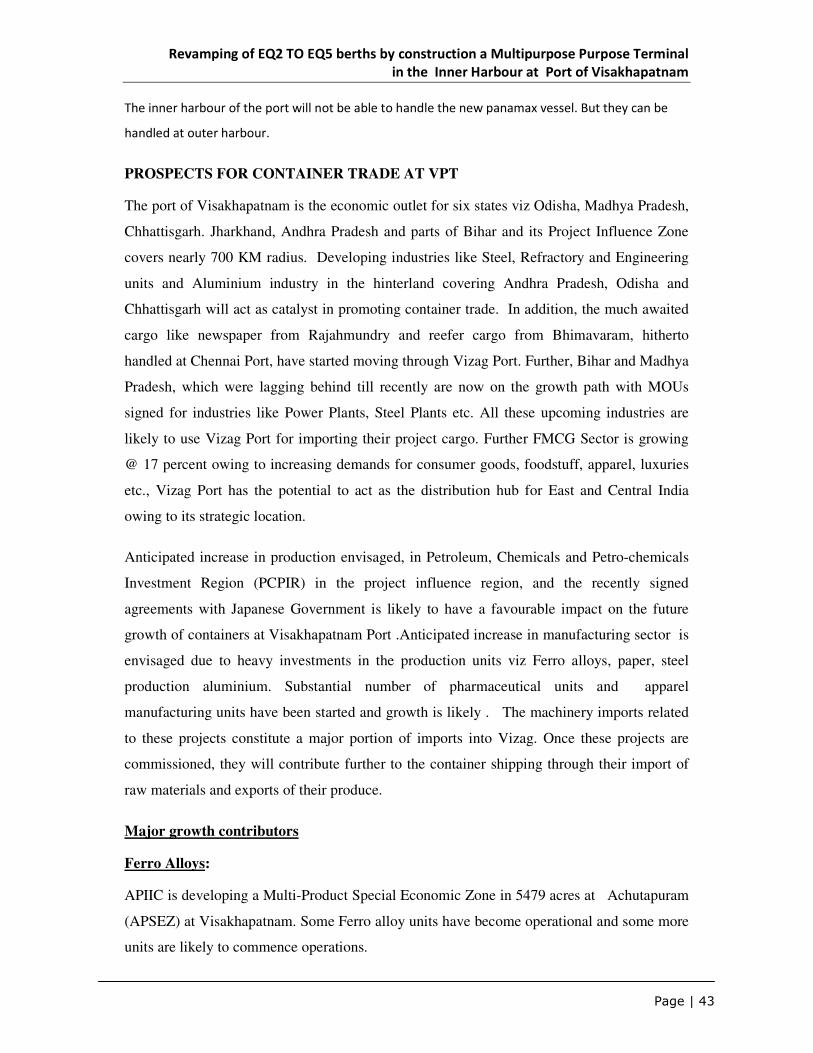
Revamping of EQ2 TO EQ5 berths by construction a Multipurpose Purpose Terminal
in the Inner Harbour at Port of Visakhapatnam
Page | 43
The inner harbour of the port will not be able to handle the new panamax vessel. But they can be
handled at outer harbour.
PROSPECTS FOR CONTAINER TRADE AT VPT
The port of Visakhapatnam is the economic outlet for six states viz Odisha, Madhya Pradesh,
Chhattisgarh. Jharkhand, Andhra Pradesh and parts of Bihar and its Project Influence Zone
covers nearly 700 KM radius. Developing industries like Steel, Refractory and Engineering
units and Aluminium industry in the hinterland covering Andhra Pradesh, Odisha and
Chhattisgarh will act as catalyst in promoting container trade. In addition, the much awaited
cargo like newspaper from Rajahmundry and reefer cargo from Bhimavaram, hitherto
handled at Chennai Port, have started moving through Vizag Port. Further, Bihar and Madhya
Pradesh, which were lagging behind till recently are now on the growth path with MOUs
signed for industries like Power Plants, Steel Plants etc. All these upcoming industries are
likely to use Vizag Port for importing their project cargo. Further FMCG Sector is growing
@ 17 percent owing to increasing demands for consumer goods, foodstuff, apparel, luxuries
etc., Vizag Port has the potential to act as the distribution hub for East and Central India
owing to its strategic location.
Anticipated increase in production envisaged, in Petroleum, Chemicals and Petro-chemicals
Investment Region (PCPIR) in the project influence region, and the recently signed
agreements with Japanese Government is likely to have a favourable impact on the future
growth of containers at Visakhapatnam Port .Anticipated increase in manufacturing sector is
envisaged due to heavy investments in the production units viz Ferro alloys, paper, steel
production aluminium. Substantial number of pharmaceutical units and apparel
manufacturing units have been started and growth is likely . The machinery imports related
to these projects constitute a major portion of imports into Vizag. Once these projects are
commissioned, they will contribute further to the container shipping through their import of
raw materials and exports of their produce.
Major growth contributors
Ferro Alloys:
APIIC is developing a Multi-Product Special Economic Zone in 5479 acres at Achutapuram
(APSEZ) at Visakhapatnam. Some Ferro alloy units have become operational and some more
units are likely to commence operations.

Revamping of EQ2 TO EQ5 berths by construction a Multipurpose Purpose Terminal
in the Inner Harbour at Port of Visakhapatnam
Page | 44
Pharma industry
The value of Pharma industry is around $1032 billion. The Worldwide growth of Pharma
industry is 2 to 3 percent where as in India the growth of Pharma industry is between 15 to 18
percent. The city of Vizag which has traditionally been a strong PSU base has gained the
attention of becoming significant Pharma Hub. The Jawaharlal Nehru Pharma city situated in
Parawada, Visakhapatnam district which was started in 2004 as a JV between RAMKY and
APIIC has since given 105 Licenses of which 60 are operational. More than 60 Pharma units
are located in north coastal districts .Major players like Aurobindo, Hetero, Pharmazell,
Dr.Reddy’s Lab, SNF India Pvt Ltd., Glochem Industries are some of the units located in the
region. An Innovator Japanese company has its unit here and so does one of World’s leading
Generic Company Hospira. Bicon expected to troop in about Rs. 12000 crores worth of
pharma exports were made in 2013-14. VPT has all necessary facilities but due to lack of
clearance facilities pharma companies should get permission from Chennai or Hyderabad. As
such there is a strong request from the trade to post additional drug controller office at Vizag.
New and upcoming pharmaceutical units will induce additional volumes to the
container trade.
FMCG SECTOR
The market size of the Indian FMCG sector is expected to reach US$ 135 billion by 2020
from US$ 44.9 billion in 2013. It is also the fourth largest sector in the Indian economy and
has grown at an annual average of about 11 per cent over the last decade. Food products, the
leading market segment with 43 per cent of the overall market revenue together with personal
care at 22 per cent make up two-thirds of the sector's revenue. There is a lot of scope for
growth in the FMCG sector from rural markets with consumption expected to grow in these
areas as penetration of brands increases. Also, with rising per capita income, which is
projected to expand at a CAGR of 7.4 per cent over the period 2013-19, the FMCG sector is
anticipated to witness some major growth.

Revamping of EQ2 TO EQ5 berths by construction a Multipurpose Purpose Terminal
in the Inner Harbour at Port of Visakhapatnam
Page | 45
Developments in the Project Influence Zone of Vizag
Industry Present
capacity Existing industries
Addition
to the
capacity in
the next
decade
Up–Coming
Industries
Ferro Alloys 0.7 MT
FACOR, GMR. IMFA. Andhra Ferro Alloys Deccan Ferro Alloys, Visa Steel, Abhijeet FerroAlloys, Anjaney Ferro, Sundaram Ferro Alloys
6 Lakh
Tonnes
SEML, Rohit Ferro Tech, Sarda Energy, VisaBao
Aluminium 1.55 MT NALCO 4 MTPA
Vedanta BALCO, Aditya Birla Anrak Alumina
Refractory units
0.8 MT
IFGL,RHI CLASIL,TATA
Refractories, OCL Refractories, Manishri Neelachal Khemka Raasi
0.5 Lakh
Tonnes Neelachal
SEA FOOD 7000 TEUs Coastal belt of AP
12000
TEUS BY
2013-14
Paper Industry
1000 TEUS of waste paper and wood pulp import and export of 300 TEUS of paper per month
ITC,APPM (International Paper) Vamsadhara Small mills of Rajahmundry, JK Paper
JK PAPER EXPANSION
VSEZ AND APSEZ
Apparel, Electrical goods, Alloy wheels, Batteries, Ferro Alloys etc., Pharmaceuticals
Insulators, Stones, Glass, Fabric, Steel Pipes, Glass sheets, Cylinders, Metal Scrap, Chemicals Machinery
PHARMA
industry
Aurobindo, Divis Labs,Matrix Labs,Dr Reddy’s Labs In Pydi Bheemavaram
JNPC, Pharmazel,Esai-pharama Technology, Vivin Labs, SMS Pharmaceuticals, Smilax Labs, Glochem Industries, Vijaysri Organics
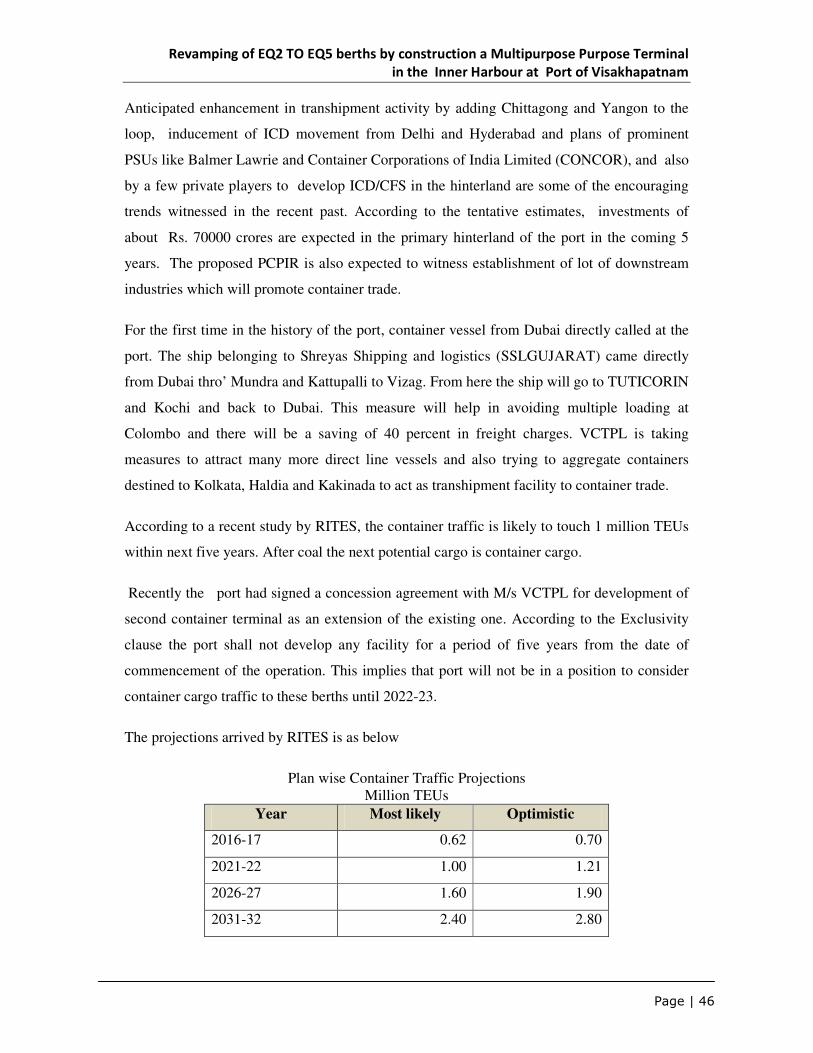
Revamping of EQ2 TO EQ5 berths by construction a Multipurpose Purpose Terminal
in the Inner Harbour at Port of Visakhapatnam
Page | 46
Anticipated enhancement in transhipment activity by adding Chittagong and Yangon to the
loop, inducement of ICD movement from Delhi and Hyderabad and plans of prominent
PSUs like Balmer Lawrie and Container Corporations of India Limited (CONCOR), and also
by a few private players to develop ICD/CFS in the hinterland are some of the encouraging
trends witnessed in the recent past. According to the tentative estimates, investments of
about Rs. 70000 crores are expected in the primary hinterland of the port in the coming 5
years. The proposed PCPIR is also expected to witness establishment of lot of downstream
industries which will promote container trade.
For the first time in the history of the port, container vessel from Dubai directly called at the
port. The ship belonging to Shreyas Shipping and logistics (SSLGUJARAT) came directly
from Dubai thro’ Mundra and Kattupalli to Vizag. From here the ship will go to TUTICORIN
and Kochi and back to Dubai. This measure will help in avoiding multiple loading at
Colombo and there will be a saving of 40 percent in freight charges. VCTPL is taking
measures to attract many more direct line vessels and also trying to aggregate containers
destined to Kolkata, Haldia and Kakinada to act as transhipment facility to container trade.
According to a recent study by RITES, the container traffic is likely to touch 1 million TEUs
within next five years. After coal the next potential cargo is container cargo.
Recently the port had signed a concession agreement with M/s VCTPL for development of
second container terminal as an extension of the existing one. According to the Exclusivity
clause the port shall not develop any facility for a period of five years from the date of
commencement of the operation. This implies that port will not be in a position to consider
container cargo traffic to these berths until 2022-23.
The projections arrived by RITES is as below
Plan wise Container Traffic Projections
Million TEUs
Year Most likely Optimistic
2016-17 0.62 0.70
2021-22 1.00 1.21
2026-27 1.60 1.90
2031-32 2.40 2.80
Revamping of EQ2 TO EQ5 berths by construction a Multipurpose Purpose Terminal
in the Inner Harbour at Port of Visakhapatnam
Page | 47
The combined capacity of existing and the proposed facility of VCTPL is 1 million TEU. As
such the proposed multipurpose terminal can act as a complementary facility after the
Exclusivity period by which time volumes are also likely to cross 1 million marks.
3.3.8 Manganese Ore, Other Ores (Import)
Manganese Ore
Manganese ore is an indispensable raw material in manufacture of steel where it is used in the
form of ferro-manganese and also as a direct feed to the blast furnace. . It has important
application in ceramic and glass industry as colouring agent. About 90 to 95% world
production of manganese ore is used in metallurgy of iron and steel.
World Scenario: The total world reserves are approximately 5200 million tonnes. The
largest manganese reserves are in South Africa which account for 77% of world reserves.
96% of global production of manganese today is from barely 7 countries viz. CIS, RSA,
Brazil, Gabon, Australia, China and India in decreasing order of tonnages raised annually.
The global resource base is close to 12 billion tonnes.
World production of manganese ore was about 58 million tonnes . China is the leading
producer at 23 million tonnes, accounting for about 40% of the total world production. India
accounts for only 4 percent of total world production. Many steel producing countries do not
possess manganese ore reserves. As such about 48 percent of manganese ore is traded
globally.
Indian Scenario The total reserves of manganese ore in the country as per Mineral year book
as on 1.4.2010 are placed at 430 million tonnes. The production of Manganese ore in 2013
was 2.57 million tonnes as against 3.06 million tonnes in 2010-11.. Madhya Pradesh and
Orissa were the leading producing states. Next in the order of production were Maharashtra
Karnataka and Andhra Pradesh. The remaining 3% of total production was reported from
Goa, Gujarat, Jharkhand, and Rajasthan.
Imports
India is the second largest importer of Manganese ore in the world. During 2013-14,
India imported 2.18 million tonnes of Manganese ore as against 0.284 million tonnes in
2006-07. Imports were mainly from South Africa and Australia Gabon and Brazil. The

Revamping of EQ2 TO EQ5 berths by construction a Multipurpose Purpose Terminal
in the Inner Harbour at Port of Visakhapatnam
Page | 48
CAGR in import of this cargo during past seven years is 33.8 percent and the trend is likely
to continue.
With the targeted capacity of 200 to 250 million tonnes of crude steel, the requirement of
Manganese ore is projected at 10 million tonnes excluding manganese ore required for
ferroalloy industry. This growth coupled with the increasing export of Ferro alloys
necessitates imports of manganese ore. During 2013-14, the country exported 1.1 million
tonnes of Ferro alloys (Ferro manganese and silicon manganese, source:DGFT)
Demand and Supply
The estimated production is about 6.700 million tonnes by 2016-17 and the apparent
consumption is estimated at 7.31 million tonnes by 2016-17 at 8% growth rate.
DEMAND IN THE HINTERLAND
APIIC is developing one Multi Modal Logistic hub in the primary service area. About nine to
ten industries are functioning. These industries are ferro alloy making firms and Manganese
ore is the important raw material for them. As per the report on multimodal logistics hub the
manganese ore imports are estimated to be of the order of 1.30 million tonnes by 2021-22.
Anjaneya Alloys, Sundaram Alloys and Abhijit Ferro Tech Ltd have already started
importing Manganese ore through Vizag Port. During the current fiscal 2015, the port
imported 1.3 million tonnes of Manganese ore.
A quantity of 1 .6 million tonnes of manganese ore has been reckoned by the port for
West Quay north. As such this cargo was not considered for the proposed multipurpose
terminal.
3.3.9 Ilmenite Sand
World scenario: The total world reserves for ilmenite sand are 650.05, million tonnes. The
total world ilmenite sand production (in thousand tonnes) in 2009 was 9305, -. The major
producers are South Africa, Canada, Australia, China etc.
Indian Scenario: The total Indian mineral reserves of ilmenite sand are estimated at 514.38
million tonnes in 2009. These resources are predominantly located in the states of Andhra
Pradesh, Odisha, Tamil Nadu and Kerala. The major chunk of consumption of the ilmenite
Revamping of EQ2 TO EQ5 berths by construction a Multipurpose Purpose Terminal
in the Inner Harbour at Port of Visakhapatnam
Page | 49
Sand is for manufacture of Synthetic Rutile. The current demand is 3, 50,000 TPA for the
country and the supply is around 8,00,000 TPA. Excess mineral is exported. The demand of
ilmenite as per the GDP growth rate of 8%, 9% and 10% is 3.19, 3.27 & 3.35 lakh tones. The
projected production is around 8, 00,000 tonnes per annum.
M/s Indian Rare Earths Ltd is exporting ilmenite sand through VPT from their plant of 3
MTPA capacity located in Chatrapur, Odisha. In addition, Trimex Sands have also exported
the cargo through the port. During 2013-14, 1.5 and 1.6 lakh tonnes of cargo were exported
by these two firms respectively. Indian Rare Earths Ltd indicated that from 2014-15, 2 lakh
tonnes of cargo will be exported through the port. Accordingly the traffic on account of this
cargo is estimated at 4 lakh tonnes including the exports by other firms. . However this
cargo has already been assigned to west quay north and hence not considered.
3.3.10 CEMENT AND LIMESTONE
Limestone is the primary and major constituent for the manufacture of cement. Indian cement
industry has been serving the nation’s construction industry since 1914 and has now achieved
a remarkable status with total installed capacity of about 360 million tonnes as on 31st March
2014 and Cement Production of 251 million tonnes in 2012-13 and 300 million tonnes in
2013-14 which is second largest in the world, being next to China. Cement production is
targeted to reach 407 million tonnes by 2016-17(CAGR 10.1%).
World Scenario
The world cement production in the year 2013 is 4000 million tonnes. China with 2480
million tonnes tops the list. India is only next to the largest producer of cement in the world,
namely China. During the last one decade cement production in the world has gone up by
more than 75%. The consumption level of Cement in the Asian countries continues to
increase rapidly.
The per capita consumption of cement is considered as an important index of the country’s
economic growth. Paradoxically, per capita cement consumption in India is still one of the
lowest among major cement producing countries (195kg). Growth of cement industry is
bound to spur a proportionate demand on limestone availability.
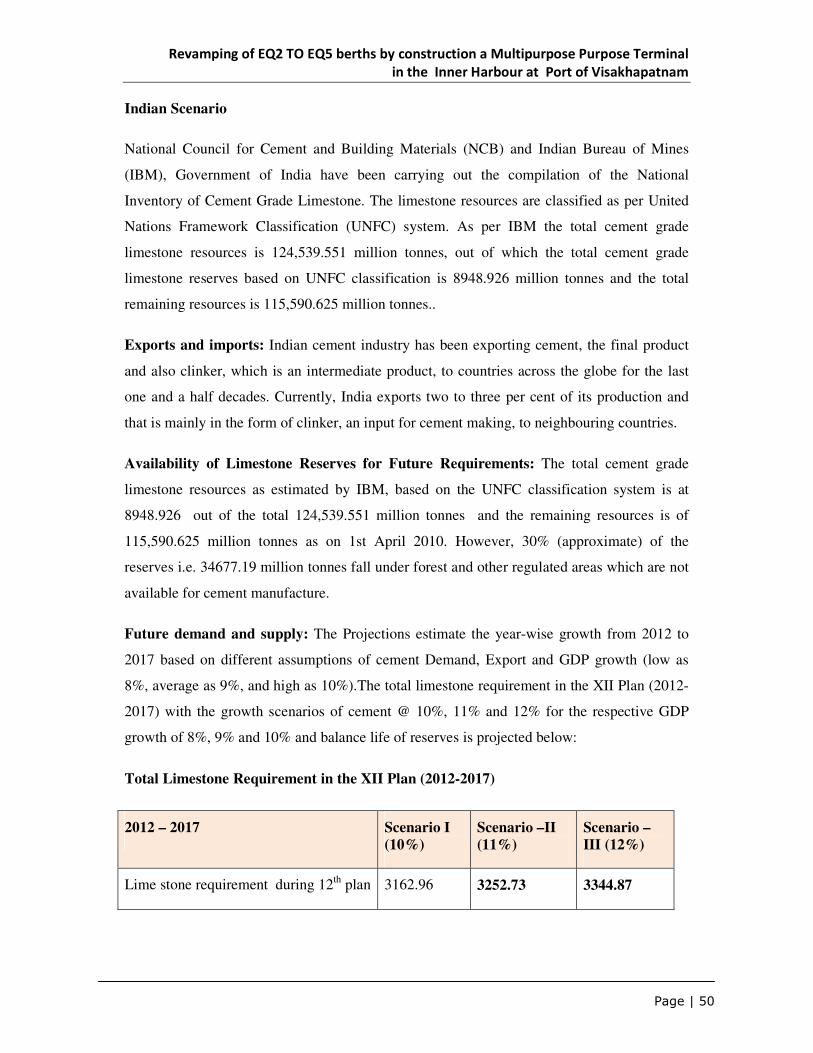
Revamping of EQ2 TO EQ5 berths by construction a Multipurpose Purpose Terminal
in the Inner Harbour at Port of Visakhapatnam
Page | 50
Indian Scenario
National Council for Cement and Building Materials (NCB) and Indian Bureau of Mines
(IBM), Government of India have been carrying out the compilation of the National
Inventory of Cement Grade Limestone. The limestone resources are classified as per United
Nations Framework Classification (UNFC) system. As per IBM the total cement grade
limestone resources is 124,539.551 million tonnes, out of which the total cement grade
limestone reserves based on UNFC classification is 8948.926 million tonnes and the total
remaining resources is 115,590.625 million tonnes..
Exports and imports: Indian cement industry has been exporting cement, the final product
and also clinker, which is an intermediate product, to countries across the globe for the last
one and a half decades. Currently, India exports two to three per cent of its production and
that is mainly in the form of clinker, an input for cement making, to neighbouring countries.
Availability of Limestone Reserves for Future Requirements: The total cement grade
limestone resources as estimated by IBM, based on the UNFC classification system is at
8948.926 out of the total 124,539.551 million tonnes and the remaining resources is of
115,590.625 million tonnes as on 1st April 2010. However, 30% (approximate) of the
reserves i.e. 34677.19 million tonnes fall under forest and other regulated areas which are not
available for cement manufacture.
Future demand and supply: The Projections estimate the year-wise growth from 2012 to
2017 based on different assumptions of cement Demand, Export and GDP growth (low as
8%, average as 9%, and high as 10%).The total limestone requirement in the XII Plan (2012-
2017) with the growth scenarios of cement @ 10%, 11% and 12% for the respective GDP
growth of 8%, 9% and 10% and balance life of reserves is projected below:
Total Limestone Requirement in the XII Plan (2012-2017)
2012 – 2017 Scenario I
(10%)
Scenario –II
(11%)
Scenario –
III (12%)
Lime stone requirement during 12th plan 3162.96 3252.73 3344.87
Revamping of EQ2 TO EQ5 berths by construction a Multipurpose Purpose Terminal
in the Inner Harbour at Port of Visakhapatnam
Page | 51
PORT SHARE
NMDC indicated the import requirement of limestone through Vizag Port as 5 lakh tonnes.
Traffic on account of limestone is therefore expected to be of the order of 8 lakh tonnes by
2016-17 including the imports by other players. This cargo has already been assigned to
WEST QUAY NORTH (WQ7 AND WQ8).
3.3.11 Pet Coke Import
Rain CII (CARBON) Vizag ltd formerly known as RAIN Calcining, is Asia’s largest and
among the top five global manufacturers of calcined petroleum coke. It offers Calcined
Petroleum Coke (CPC), which is primarily used as the main carbon source for anodes in
aluminum smelting. CPC is also used in the manufacture of titanium dioxide and steel
produced using electric-arc-furnace. Rain Calcining’s manufacturing facility is located in
Visakhapatnam, with two rotary kilns having a capacity of 580,000 tonnes per annum of
CPC.
It is a 100% export oriented unit in the primary hinterland of VPT, imports Raw Petroleum
Coke and after calcining, the value added product i.e. Calcined Pet Coke is exported .The
firm has imported about 7 lakh tonnes of raw pet coke in 2013-14 and the export of CPC was
of the order of 3 lakh tonnes. The firm indicated the import requirement as 7 lakh tonnes and
export as 5 lakh tonnes in the coming years. SANVEERA is setting up a calcinations plant in
Achyulapuram. The estimated import requirement of this firm is 5 lakhs tones. The total
estimate of import of raw pet coke by these two firms is 12 lakhs tones of which only 10
lakhs has been considered for the multipurpose terminal. As the export of CPC has already
been assigned to WQ6 berth (PPP), the same is not considered. Only Import of raw Pet coke
is reckoned for the multipurpose terminal
3.3.12 OTHER BULKS
3.3.12.1 GYPSUM AND BAUXITE
GYPSUM
As per the planning commission working group, India's cement manufacturing capacity may
climb to 479 million tons by 2017, despite the existing over-capacity scenario. According to
some analysts, India’s cement production will expand to 550 million tons by 2020 and its
Revamping of EQ2 TO EQ5 berths by construction a Multipurpose Purpose Terminal
in the Inner Harbour at Port of Visakhapatnam
Page | 52
annual per capita use of cement will rise to 350 kg from 150 kg. Some even point to India
achieving 860 million tons of cement capacities by 2030. Historically, the cement industry in
India met their gypsum requirement predominantly from natural gypsum sources in Rajasthan
and by-product gypsum from industrial sources. However, such sources for gypsumpeaked
and stagnated in recent years, around three to 3.5 million tons annually. In 2010, it produced
around 2.5 percent of the world’s 146 million tons of natural gypsum. The country’s total
recoverable cement and plaster grade gypsum reserves are 54 million tons (2005) with the
majority located in Rajasthan .As per the Indian Bureau of Mines (IBM), around five million
tons of waste gypsum, such as phospho- and flouro- gypsum, are generated annually. In the
last three years, the cement sector has used between 2.25 and three million tons. These
quantities are constant and cannot increase substantially due to higher transportation costs. In
total, local gypsum production/availability is limited to six to seven million tons per year;
thus, the balance demand must be met by imported gypsum.
Imported Natural Gypsum
Indian cement producers are dependent on the import of high quality natural gypsum, mainly
from Thailand. Other reserves that India could use are in the Sul-tanate of Oman and more
distant countries like Australia, Mexico, and Morocco. Thailand has reserves of 200 million
tons, but the Thai government is taking steps to increase the selling price of gypsum before
stopping exports. Given the potential shortfall in supply, and an increase in gypsum demand
in India, a significant price increase for gypsum in the coming years is likely. Even though
gypsum accounts for just two to three percent of the total cost of cement sales, cement
manufactures cannot help but remain sensitive to any price increase. Against this backdrop,
the potential supply of gypsum from the Sultanate of Oman becomes a very attractive
prospect.
GYPSUM IMPORTS AT VPT
During 2013-14, a quantity of 1.01 million tonnes is imported which declined to 6.6 lakhs
tones in 2014-15.The port has already reckoned 1.3 million tonnes of Gypsum to West
Quay North.
BAUXITE
As already discussed, Bauxite imports are likely in the coming decade, given the expansion

Revamping of EQ2 TO EQ5 berths by construction a Multipurpose Purpose Terminal
in the Inner Harbour at Port of Visakhapatnam
Page | 53
plans of Alumina industry. The imports thro the port is already in the range of 6 to 7 lakh
tonnes during the past five years and the major importer is Vedanta Group. Port has reckoned
0.8 million tonnes of Bauxite for West Quay North.
3.3.12.2 BF SLAG
The port witnessed a declining trend in the exports of B F SLAG in the recent past mainly
due to diversion to neighboring ports. However on optimistic note port has considered 9
lakh tones of traffic on account of this cargo for West Quay North.
3.3.12.3 Rock Phosphate: Global Scenario. The total world reserves are 65,000 Million
tonnes. World production of marketable phosphate rock was 176 million tonnes in 2010, a
6% increase compared with that of 2009. The United States with 26 million tonnes, China
with 65 million tonnes and Morocco and Western Sahara with 26 million tonnes were the
leading producing countries, accounting for 67% of the production. India’s production is a
meagre 1.55 million tonnes. As a result, India will continue to rely on imports to meet its
demand.
Indian Scenario: The estimated total resources of rock phosphate as per IBM as on 1.4.2010
are 296 million tonnes of which 35 million tonne are Reserves are 261 million tonnes are
resources The total production was at 1.65 million tonnes in 2010-11, which increased to
2.33 million tonnes in 2011-12 because of more lifting of ore at crushing plant of RSMML,
Rajasthan.
Future demand and supply The apparent demand of apatite and rock phosphate was 7.23
million tonnes in 2009-10. The apparent consumption of apatite and rock phosphate is
estimated at 13.22 million tonnes by 2016-17 at 9% growth rate
3.3.13 Pig iron and Steel Products
India is also an important producer of pig iron. In post-liberalization period, with setting up
several units in the private sector, not only imports have drastically reduced but also India has
turned out to be a net exporter of pig iron. The private sector accounted for 93% of total
production for sale of pig iron in the country in 2013-14. The production for sale of pig iron
has increased from 1.6 MT in 1991-92 to 7.95 MT in 2013-14.
The present through put of this cargo is around 1 million tonnes. The major exporters are

Revamping of EQ2 TO EQ5 berths by construction a Multipurpose Purpose Terminal
in the Inner Harbour at Port of Visakhapatnam
Page | 54
Jindal steel and power and SAIL in case of steel products and RINL in case of Pig Iron. The
export of steel products on account of SAIL and other steel plants is likely to increase
consequent on expansion of capacity. The capacity of Bhilai Steel Plant is likely to increase
to 7.5 MTPA . For the upcoming steel plants in the PIZ Visakhapatnam is the economic
outlet. The traffic on account of this cargo is likely to touch 1 to 1.5 million tonnes by 2021-
22. However a quantity of 3.7 lakh tonnes has been reckoned for WQ 6, which is
concessioned to ABG. As such only incremental cargo has been reckoned for the proposed
multipurpose terminal.
Regarding pig iron, it may be noted that RINL during the past five years is exporting thro
Vizag port only though it is importing coal thro’ Gangavaram port. Given the expansion
plans of RINL, a moderate traffic of exports thro Vizag is likely to continue.
3.4 COMPETING FACILITY FOR THE OTHER BULK CARGO
The cargo handled by Gangavaram port recorded an increase of 28 percent during first
nine months of current fiscal compared to the corresponding period of the previous
year. Coal imports recorded 29 percent increase while other bulks also recorded an
upward trend as the following table illustrates:
Table: Traffic handled by Gangavaram Port Ltd (Million tonnes)
Cargo APRIL-DECEMBER
2013 2014
Coal 8.9 11.56
Other bulk(Fert, Limestone, Bauxite,
Alumina,Coke etc
2.40 3.33
IRON ORE 0.97 0.75
TOTAL 12.27 15.64

Revamping of EQ2 TO EQ5 berths by construction a Multipurpose Purpose Terminal
in the Inner Harbour at Port of Visakhapatnam
Page | 55
3.5 Cargoes identified for private sector participation MTPA
West Quay 6 (WQ6) : Capacity 2.08 MTPA
CP coke : 0.75 LAM coke: 0.75 Steel Products: 0.37 Granite: 0.21
West Quay 1 (WQ1) Capacity : 6.8 MTPA
Iron ore and pellets : 6.8
East Quay 7 (EQ7) Capacity: 5.21 MTPA
Fertilisers and General Cargo : 5.21
East Quay 1 (EQ1) Capacity 6.41 MTPA
Steam Coal : 6.41
East Quay 1A (EQ1A) Capacity:7.36 MTPA
Thermal coal : 7.36
East Quay 10 (EQ10) Capacity 1.84 MTPA
Caustic Soda lye, Edible Oils Chemicals Other liquid cargo
General Cargo Berth (GCB)Capacity: 10.18 MTPA
Coking Coal Steam Coal
Container Terminal Capacity 4.6 Lakh Teus
Modernisation of OHC Capacity 6.8 MTPA
Iron ore Iron ore pellets
3.6 Cargoes indentified for the proposed WQ North taken up with Port Internal
Resources. (MTPA)
West Quay North Capacity 6.05 MTPA
Manganese ore imp1.6 Bauxite0.8 Gypsum1.3 Limestone0.8
BF slag0.9 Other ores0.15 Iiliminatesand0.50
3.7 Other minor bulk and break bulk
The throughput of other cargo other than discussed above and other than identified for
PPP/IR projects is about 4 lakh tonnes comprising Timber, Dolomite stone chips, salt, peas,
stone/rock boulders, project cargo and other general cargo. With the penetration of
containerization some of these cargoes maybe containerized .As such a moderate growth of 4
percent is reckoned for these cargoes.
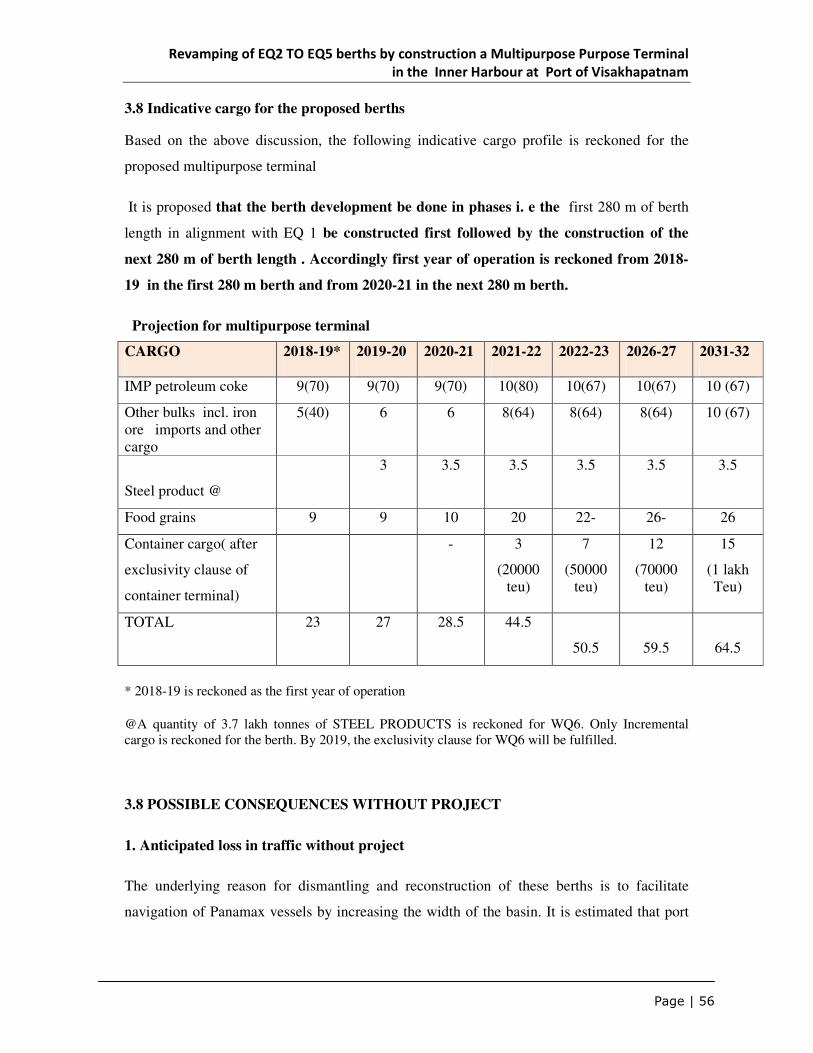
Revamping of EQ2 TO EQ5 berths by construction a Multipurpose Purpose Terminal
in the Inner Harbour at Port of Visakhapatnam
Page | 56
3.8 Indicative cargo for the proposed berths
Based on the above discussion, the following indicative cargo profile is reckoned for the
proposed multipurpose terminal
It is proposed that the berth development be done in phases i. e the first 280 m of berth
length in alignment with EQ 1 be constructed first followed by the construction of the
next 280 m of berth length . Accordingly first year of operation is reckoned from 2018-
19 in the first 280 m berth and from 2020-21 in the next 280 m berth.
Projection for multipurpose terminal
CARGO 2018-19* 2019-20 2020-21 2021-22 2022-23 2026-27 2031-32
IMP petroleum coke 9(70) 9(70) 9(70) 10(80) 10(67) 10(67) 10 (67)
Other bulks incl. iron ore imports and other cargo
5(40) 6 6 8(64) 8(64) 8(64) 10 (67)
Steel product @
3 3.5 3.5 3.5 3.5 3.5
Food grains 9 9 10 20 22- 26- 26
Container cargo( after
exclusivity clause of
container terminal)
- 3
(20000 teu)
7
(50000 teu)
12
(70000 teu)
15
(1 lakh Teu)
TOTAL 23 27 28.5 44.5
50.5
59.5
64.5
* 2018-19 is reckoned as the first year of operation
@A quantity of 3.7 lakh tonnes of STEEL PRODUCTS is reckoned for WQ6. Only Incremental cargo is reckoned for the berth. By 2019, the exclusivity clause for WQ6 will be fulfilled.
3.8 POSSIBLE CONSEQUENCES WITHOUT PROJECT
1. Anticipated loss in traffic without project
The underlying reason for dismantling and reconstruction of these berths is to facilitate
navigation of Panamax vessels by increasing the width of the basin. It is estimated that port
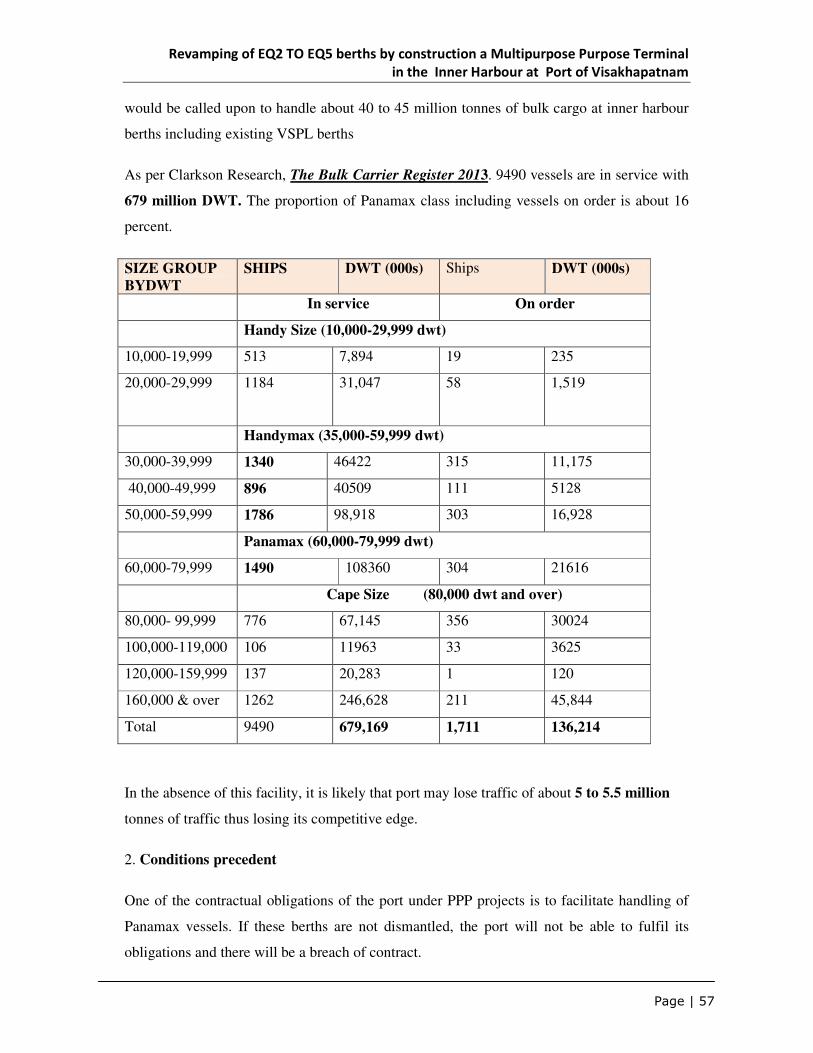
Revamping of EQ2 TO EQ5 berths by construction a Multipurpose Purpose Terminal
in the Inner Harbour at Port of Visakhapatnam
Page | 57
would be called upon to handle about 40 to 45 million tonnes of bulk cargo at inner harbour
berths including existing VSPL berths
As per Clarkson Research, The Bulk Carrier Register 2013. 9490 vessels are in service with
679 million DWT. The proportion of Panamax class including vessels on order is about 16
percent.
SIZE GROUP
BYDWT SHIPS DWT (000s) Ships DWT (000s)
In service On order
Handy Size (10,000-29,999 dwt)
10,000-19,999 513 7,894 19 235
20,000-29,999 1184 31,047 58 1,519
Handymax (35,000-59,999 dwt)
30,000-39,999 1340 46422 315 11,175
40,000-49,999 896 40509 111 5128
50,000-59,999 1786 98,918 303 16,928
Panamax (60,000-79,999 dwt)
60,000-79,999 1490 108360 304 21616
Cape Size (80,000 dwt and over)
80,000- 99,999 776 67,145 356 30024
100,000-119,000 106 11963 33 3625
120,000-159,999 137 20,283 1 120
160,000 & over 1262 246,628 211 45,844
Total 9490 679,169 1,711 136,214
In the absence of this facility, it is likely that port may lose traffic of about 5 to 5.5 million
tonnes of traffic thus losing its competitive edge.
2. Conditions precedent
One of the contractual obligations of the port under PPP projects is to facilitate handling of
Panamax vessels. If these berths are not dismantled, the port will not be able to fulfil its
obligations and there will be a breach of contract.
Revamping of EQ2 TO EQ5 berths by construction a Multipurpose Purpose Terminal
in the Inner Harbour at Port of Visakhapatnam
Page | 58
3. Safety These berths were built in 1933 and outlived their economic life. Continuation of
cargo handling operations may be at the cost of safety and security.
4. Scalability of the facilities
By creating a deep water basin the port is enhancing its scalability and will be able to meet
the challenges emanating from the international trade in the years to come.
5. Economies of Scale
There will be a freight difference of 2 to 3 dollar per tonne between panamax and supramax
vessels thus enabling the importers and exporters to reduce the costs.
Revamping of EQ2 TO EQ5 berths by construction a Multipurpose Purpose Terminal
in the Inner Harbour at Port of Visakhapatnam
Page | 59
CHAPTER 4
DEVELOPMENT APPROACH
4.1 The existing berths EQ2 to EQ5 were built in 1933 and are monolithic berths. The life
of the berths as per the life norms fixed by the Ministry of Shipping is 50 years. As per this
norm these berths outlived their lives and are due for replacement/reconstruction. The drafts
originally available at these berths were 9.14 m which was subsequently deepened to 10.5 m.
With the ongoing dredging plan executed by the port in three phases, the drafts at these berths
are undergoing changes. The phase I and phase II of the dredging works are over which
resulted in increasing the draft to 12.5 m at these berths. When phase III is completed by
2015, the draft will get further increased to 14 m. The port is ensuring the draft of 14 m with
the completion of the phase III dredging at the basin of northern arm.
The ongoing exercise undertaken by the port to deepen the basin and approach to the northern
arm to ensure a draft of 14.0 m, is with an objective to handle panamax vessels. However this
can be accomplished only when the berths at this northern arm are also capable of handling
panamax vessels. That is, the berths at the northern arm should be structurally strong enough
to withstand the berthing forces generated by the Panamax vessels. If not, the berths need to
be dismantled and reconstructed to receive those vessels. Further as the Panamax vessels
carry the dry bulk cargo in the range of 70,000 to 80,000 tons, the berths are to be equipped
with bulk cargo handling equipments such as ship loader/un loader, stacker/reclaimer,
conveyor systems and other associated mechanical handling equipments for mechanised
handling. On the other hand, if the loading/unloading operations are to be only through cranes
and the rest of the shore operations are not mechanised, then the berth will only be equipped
with the mobile cranes alone. The berthing structure should be designed to cater to both these
type of operation.
Under these circumstances, the revamping or reconstruction of the berths EQ 2 to EQ 5 is a
must. There are certain issues which require to be studied in order to draw up the
development plan. The major ones are brought out below.
Revamping of EQ2 TO EQ5 berths by construction a Multipurpose Purpose Terminal
in the Inner Harbour at Port of Visakhapatnam
Page | 60
1. As the EQ 1 berth with a part of EQ 2 were already given to a PPP operator to build
the berth with the alignment going backward by about 30 m, it is to be examined
whether the reconstructed terminal should also align with this EQ 1 berth. If so is it
feasible?
2. The berths EQ 2 to EQ 5 are also having number of wharf cranes of different
capacities. The utilization or otherwise of these cranes needs to be examined to decide
on their retention or disposal
3. The port has handled approximately 2.7 million tons of cargo in the berths EQ 2 to
EQ 5 during the year 2013-14. The continuance of handling of these cargos needs to be
looked into.
4. When the next phase of 280 m berth length construction is taken up by dismantling
the EQ 4 and part of EQ 5 berths, a decision is to be taken on the disposal of the 3
numbers 15 tons wharf crane operating in EQ 4 berths.
The above four issues are discussed below.
Issue 1
As the EQ 1 berth with a part of EQ 2 were already given to a PPP operator to build
with the alignment of the berth going backward by about 30 m, it is to be examined
whether the reconstructed terminal should also align with this EQ 1 berth. If so is it
feasible?
If the site conditions are permitting to construct the terminal landward side in alignment
with EQ 1 PPP berth, it is ideal and prudent to align so. The landward area available has been
studied and found that adequate area is available and is possible to carry out the construction
of the terminal in alignment with EQ 1
Issue 2
The berths EQ 2 to EQ 5 are also having number of wharf cranes of different capacities.
The utilization or otherwise of these cranes also needs to be examined to decide on their
retention or disposal
The list of wharf cranes available as of now at EQ 2 to EQ 5 berths is given in the following
table.

Revamping of EQ2 TO EQ5 berths by construction a Multipurpose Purpose Terminal
in the Inner Harbour at Port of Visakhapatnam
Page | 61
Sl.No Make Crane Numbers Capacity Positioned at
the berth
Vintage
1 TRF TF 20* 10 T EQ 5 1.8.1998
2 TRF TF 21# 15 T EQ 5 1.10.1998
3 JESSOP JF 17* 15 T EQ 5 28.10.1999
4 MUKUND MT 12 10 T EQ 4 26.5.2000
5 MUKUND MT 5* 10 T EQ 3 1.6.2000
6 TRF TF 1 15 T EQ 3 9.2.2001
7 TRF TF 2, 15 T EQ 3 9.2.2001
8 TRF TF 3 , 15 T EQ 3 26.3.2001
9 TRF TF 4 15 T EQ 3 26.3.2001
10 TRF TF 13# 15 T EQ 4 26.3.2001
11 TRF TF 14 15 T EQ 4 26.3.2001
12 TRF TF 15 15 T EQ 4 3.4.2001
13 TRF TF 16 15 T EQ 4 5.6.2001
14 MUKUND NC 1 20 T EQ 7 21.3.2004
15 MUKUND NC 2 20 T EQ 7 30.4.2004
16 MUKUND NC 3 20 T EQ 7 17.5.2004
17 MUKUND NC 4 20 T EQ 7 15.6.2004
*These three cranes are in the process of disposal.
#These two cranes are likely to be taken up for disposal
The above table lists 17 cranes positioned at EQ 3 to EQ 5 and EQ 7. Of these 17 cranes, 5
cranes are getting disposed of. The balance available after disposal will be 1 number 10 tons
, 7 numbers 15 tons and 4 numbers 20 tons, The utilization of 10 tons crane is almost nil.
Hence the remaining one number 10 tons crane can also be disposed of. This will leave 4
numbers of 15 tons crane in berth EQ 3, 3 numbers of 15 tons crane in berth EQ 4and 4
numbers of 20 tons crane in EQ 7.

Revamping of EQ2 TO EQ5 berths by construction a Multipurpose Purpose Terminal
in the Inner Harbour at Port of Visakhapatnam
Page | 62
When the dismantling of part of EQ 2, full EQ 3 and part EQ 4 berths are commenced for
construction of first 280 m of berth length for the multipurpose terminal, 4 numbers 15 tons
cranes in EQ 3 have to be shifted to other berths or to be disposed of. When the dismantling
begins in the year 2016-17, the residual life left for the 4 number cranes (all the 4 are 2001
vintage) will be 5 years. At this point of time, the written down value of each of the crane is
Rs. 1.04 crores. The utilization of these cranes during the past years has been drastically
declining. It has declined from a value of 44% to 5% in the years 2010-11 and 2013-14
respectively. Further, as the berth EQ 4 is already having 3 numbers of 15 tons cranes, these 4
cranes cannot be moved to this berth and has to necessarily be shifted to some other berths.
This would involve dismantling them from EQ 3 berth and re assembling in the other
identified berth. This work of shifting would cost approximately 0.8 to 1.0 crores per crane
including the cost of hire of crane for dismantling works. Moreover there is no berth available
as the 4 numbers 20 tons cranes presently in EQ 7 need to be moved to EQ 6 / EQ 5 when the
berth EQ 7 is handed over to the PPP operator shortly. Considering all these factors it is
prudent to dispose of these 4 cranes straight way.
Issue 3
The port has handled approximately 2.7 million tons of cargo in the berths EQ 2 to EQ
5 during the year 2013-14. The continuance of handling of these cargos needs to be
looked into.
These berths are handling variety of cargo such as CP coke, ilmenite sand, maize, wheat,
stone dust, granite blocks, pig iron, steel, rice, alumina, lime stone, pet coke, steam coal,
finished fertilizer, project cargo. Considering the nature and variety of cargo and the sizable
quantum, it is not advisable to forego these cargos by dismantling the berths EQ 2 to EQ 5
simultaneously. Hence the cargo handling activities have to be continued in the remaining EQ
4 berth length (approximately 180 m out of 233 m) and in berth EQ 5 when the remaining
part of EQ 2 berth (approximately 65 m), entire EQ 3 berth (approximately 167 m) and part
of EQ 4 berth (approximately 50 m) are dismantled for construction of the first 280 m of
berth length of the multipurpose terminal.
When the first 280 m berth gets ready for operation by 2018-19, the above cargo handling
operation may get shifted to this berth from EQ 4 and EQ 5, making the way for dismantling
those two berths. .

Revamping of EQ2 TO EQ5 berths by construction a Multipurpose Purpose Terminal
in the Inner Harbour at Port of Visakhapatnam
Page | 63
Issue 4
When the next phase of 280 m berth length construction is taken up by dismantling the
EQ 4 and part of EQ 5 berths, a decision is to be taken on the disposal of the 3 numbers
15 tons wharf crane operating in EQ 4 berth.
At present the port is having 4 numbers 20 tons wharf cranes at berth EQ 7 which berth has to
be handed over to the private operator with whom the CA has been already entered into.
When the berth is handed over, these four cranes have to be shifted to some other berths. As
the berths EQ 7, EQ 6 and EQ 5 are in one alignment and these berths are also provided with
crane track for the 20 tons cranes, they can be moved straightaway to EQ 6. Hence the EQ 6
berth will not be available for shifting the 3 numbers 15 tons cranes from EQ 4. Further the
reasons brought out earlier for disposal of the four cranes also stand valid for these three
cranes. Hence these 3 cranes in EQ 4 can be disposed of when the berth is dismantled.
Conclusion
Summarizing the development approach for revamping of the present berths EQ 2 to EQ 5 by
constructing a multipurpose terminal in their place, is as follows.
i) New berths will be reconstructed at landward side in alignment with the EQ 1 PPP
berth and the existing berths consisting of part of EQ 2, EQ 3, EQ 4 and part of EQ 5
will be dismantled in two stages to pay way for the construction of the multipurpose
terminal.
ii) When the first stage of construction takes place in the year 2016-17 by dismantling
part of EQ 2, full EQ 3 and part EQ 4 berths, the cargo operation in balance EQ 4 and
EQ 5 berths will continue. Four numbers 15 tons wharf cranes in the berth EQ 3 will
get disposed of.
iii) When the second stage of construction of the terminal commences in the year 2019-
20, the three numbers of 15 tons cranes in EQ 4 are to be disposed of. The first part of
the 280 m berth of the multipurpose terminal constructed can commence the operation
by fully equipping with full range of cargo handling equipment, the details of which is
discussed later.
Revamping of EQ2 TO EQ5 berths by construction a Multipurpose Purpose Terminal
in the Inner Harbour at Port of Visakhapatnam
Page | 64
CHAPTER 5
SITE INFORMATION
5.1Climate and Meteorological conditions
a) Climate
The Climate of this region is governed by its location in the tropics and the monsoons.
The climate of the South East coast of Bay of Bengal is characterized by the recurring
seasonal monsoons, which divide the year into four seasons as follows:
� The pre-monsoon period is from March to May, usually the beginning of the
hottest period of the year, when the winds shifted in South-westerly direction,
� South-West monsoon period falls between May and October with
predominantly South-Westerly winds, cloudy weather and frequent rains.
� The post-monsoon period is from the middle of October to the end of
November with variable weather and witnesses cyclones with relatively
greater frequency.
� The climatic division is, of course, not absolute and there is some overlap
between seasons.
b) Temperature
The annual mean maximum temperature is 30oC and the annual mean minimum
temperature is 24.3oC. The highest temperature is recorded in May and June and the lowest in
December and January. The highest temperature recorded was 38oC in May and the lowest
temperature recorded was 24.3o in January for the year 2007.
c) Relative Humidity
The humidity is comparatively high and fairly uniform throughout the year. The
annual mean value of daily relative humidity recorded varies from 72% to 76%. Highest
recorded value is 81% and lowest recorded value is 64%.
d) Rainfall
The rainy season persists during the south-west monsoon and also during North-East
monsoon. September and October are the wettest months of the year with an average rainfall

Revamping of EQ2 TO EQ5 berths by construction a Multipurpose Purpose Terminal
in the Inner Harbour at Port of Visakhapatnam
Page | 65
of 167.3 mm and 259.3 mm respectively. The average annual rainfall is about 973.6 mm.
The average number of rainy days per year is 50.
e) Wind
The predominant direction of wind is South-West and North-East, for most of the
time. The maximum wind speed recorded is 110 KMPH.
f) Cyclones
Cyclones are common to occur in the Bay of Bengal.
Average number of cyclones occurring at Visakhapatnam is 3 to 4 per year. Cyclonic
storms and depressions occur with greatest frequency is August, October and November
generally.
g) Visibility
Visibility is good throughout the year as fog is infrequent at sea in all seasons.
Reduction in visibility is mostly due to heavy rainfall during the South-West monsoon. The
highest monthly average duration recorded of fog is 0.1 day in some months from December
to May.
5.2 Oceanographic Data
a) Tidal Data
Highest high water recorded (Nov. 2007) : +2.38 M
Mean high water level spring : +2.06 M
Mean high water level neap : +1.50 M
Mean sea level : 0.80 M
Mean low water level spring : +0.16 M
Mean low water level neap : +0.50 M
Chart datum (CD) : 0.00 M
Lowest low water recorded (March 2007) : (-)0.39 M
Note: During the ‘tsunami’ occurred in December 2004 the max. & min. levels of
sea water have varied between a max. of +3.0 m to a min. of –1.0 m.
Revamping of EQ2 TO EQ5 berths by construction a Multipurpose Purpose Terminal
in the Inner Harbour at Port of Visakhapatnam
Page | 66
b) Waves
The proposed project location is inside the Inner Harbour which is well protected
from the wave action outside of Outer Harbour. Hence no adverse wave effect is expected at
the project site.
c) Currents
Currents in the Bay of Bengal are seasonal and are mainly due to South-West and North-
East monsoons. From February to June offshore currents flow towards the North-East and
from August to December towards South-West at velocities ranging from 0.5 to 1 knot in the
Outer Harbour. However, the project location is free from any significant current effect.
d) Littoral Drift
There is a strong littoral drift of sand northwards from March to September. Maximum
amount of drift takes place from May to August when the waves are the highest. It is
believed that the drift is largely confined to a zone within 200m of the shore and is within the
6m contour. The quantum of annual maintenance dredging carried out in 2009-2010 was 4.46
lakh cubic meters.
The results of soil investigation carried out recently in the vicinity of the project are appended
to this report (Appendix-5.1 & Appendix-5.2). The locations of the boreholes are indicated in
the Borehole location plan attached as Appendix-5.3.

Revamping of EQ2 TO EQ5 berths by construction a Multipurpose Purpose Terminal
in the Inner Harbour at Port of Visakhapatnam
Page | 67
Appendix-5.1

Revamping of EQ2 TO EQ5 berths by construction a Multipurpose Purpose Terminal
in the Inner Harbour at Port of Visakhapatnam
Page | 68
Appendix-5.2

Revamping of EQ2 TO EQ5 berths by construction a Multipurpose Purpose Terminal
in the Inner Harbour at Port of Visakhapatnam
Page | 69
Appendix-5.3
The Borehole location plan

Revamping of EQ2 TO EQ5 berths by construction a Multipurpose Purpose Terminal
in the Inner Harbour at Port of Visakhapatnam
Page | 70
CHAPTER 6
BERTH POSITION AND ALIGNMENT
6.1 Berth Position
The existing berths in the northern arm were designed for maximum dredged depth of
10.06/12.10 m. Considering the vessel sizes corresponding to this design depth of the basin
the slip width provided for the existing basin is about 170 m. In view of the present trend in
deployment of large size vessels due to economies of scale in marine transport the new berth
constructions and revamping of existing berths in the northern arm are done for 14.0 m draft
vessels. The design size of vessels considered for 14.0 m draft is Panamax class bulk carriers
with 230 m length and 32.50 m beam. This basin has berthing facility on either side. The
basin width requirement for navigation with berths on either side of the basin having vessels
is governed by the manoeuvring space requirement for un berthing and sailing out of a vessel
with the assistance of tugs. The width comprises of the space for the vessels at berth on sides
(two times beam), vessel manoeuvring space (two times the beam) and 60 to 100 m for the
working of the tugs. Thus a basin width of 190- 230 m is required for the safe manoeuvring
and berthing of the design size vessels in the basin. Considering the wind conditions in the
area an absolute minimum width of 200 m is required for ensuring safe vessel operations. As
the revamping of EQ-1 berth has already been completed with shifting of its frontage towards
land by 30 m the basin in front of the existing EQ-2 to EQ-4 berths is now the narrowest
portion in the basin, with width of 170 m. Therefore, the new berths would be positioned with
a minimum set back of 30 m from the frontage of existing berths.
The berths EQ-2 to EQ-4 are more than 80 years old and EQ-5&6 berths are more than 50
years old. These berths have outlived their economic life. The berths EQ-2 to EQ-4 are with
dredged depth limitations of 10.06 m whereas the dredged depth requirement for 14.0 m draft
vessels is 16.10 m. No structural improvement is possible for increasing the dredged depth as
well as the service life. In view of the above constraints, it is essential to reconstruct these
berths for its continued use.
6.2 Length and Alignment of Proposed Berths
280 m berth length is required for the safe mooring and operation of the design vessel with
230 m length. A portion of the EQ-2 berth has already been merged with the revamped EQ-1

Revamping of EQ2 TO EQ5 berths by construction a Multipurpose Purpose Terminal
in the Inner Harbour at Port of Visakhapatnam
Page | 71
berth. The remaining length of EQ-2 together with EQ-3 and EQ-4 berths and a portion of
EQ-5 berth (about 89 m) are proposed to be merged for developing two berths each of 280m.
The revamped EQ-2 berth will be aligned in the same line of the revamped EQ-1 whereas the
revamped EQ-3 will be aligned in the line joining the ends of revamped EQ-2 and the portion
of EQ-5 to be merged.
Revamping of EQ2 TO EQ5 berths by construction a Multipurpose Purpose Terminal
in the Inner Harbour at Port of Visakhapatnam
Page | 72
CHAPTER 7
PRELIMINARY DESIGN AND
EVALUATION OF ALTERNATIVES
7.1 Type of Construction
The selected type of construction should ensure the stability of the existing adjacent
structures and also enable the safe removal of the existing berth frontage. It should also
enable to continue the operation of the existing berths to the extent possible during the
revamping works, to avoid the shifting of cargo operations elsewhere. The revamped adjacent
berth is with earth retaining structure positioned on the berthing side. In view of the foregoing
requirements and constraints, open type construction which require pre-dredging and slope
formation before deck construction is not practicable and the berth structure should be with a
front side earth retaining arrangement in the line of adjacent berths so that the frontage would
be in tact without any yielding when the existing structures are removed and berth frontage is
dredged to (-) 16.1 m.
In case the construction of the second berth (revamped EQ-3) is not taken up in continuation
to the EQ-2, it is proposed to provide earth stability arrangement at the interface of EQ-2&3
by extending the EQ-2 berth structure by about 50 m and excavating the frontage of the
extended portion with a slope of 2H to 1V and protecting the slope with rubble pitching. This
would enable easy removal of the protective arrangements when the revamping works of EQ-
3 is taken up.
Construction sequence of the berth is such that the new berth frontage shall be constructed
first and there after the dismantling of the existing structures and dredging of the area up to
50 m from the new berth frontage will be taken up and completed. The new berth has to be
constructed towards land side of the existing berth. The back-up area of the existing berth is
at about +3.6 m offering excellent access for the construction equipment from landside and
operating in the area construction activities would be land based. The land based construction
would be faster and less expensive compared to the construction over water.
For operational flexibility of the berths for different type of cargo as available in future, it has
to be designed for the operation of high capacity Mobile Harbour Crane of LHM 600 range
Revamping of EQ2 TO EQ5 berths by construction a Multipurpose Purpose Terminal
in the Inner Harbour at Port of Visakhapatnam
Page | 73
and Rail Mounted Quay Gantry Crane to work over Panamax Class container vessels apart
from the loads normally considered for the berth design.
Considering the safety of adjacent structures, loading and other importance of the structure as
well as the available geo-technical data, a diaphragm wall earth retaining structure with
anchoring system using rectangular or circular piles or a combination of both is found to be
the most appropriate type of construction. Since hard rock stratum is available at reasonable
depth, the piles and diaphragm wall would be socketed in the hard rock. There are various
alternatives solutions with respect to the type and size of diaphragm wall as well as type and
size of anchor piles. Three alternatives are developed with reference to above parameters and
preliminary designs prepared and costing studied for the selection of the most promising
alternative the details of which are presented below.
7.2. Basic Design Criteria
Berth structure is the most important components of the terminal development. Preliminary
designs of the berth have been made for estimate purpose based on the Basic Design Criteria
detailed hereunder.
i) Design Vessel
Dry bulk carrier : 80000 dwt
Displacement tonnage : 98000 Say 100,000
Length : 230 m
Beam : 32.5 m
Draft : 14.0 m
ii) Design Loads
Design loads for berth shall conform to IS: 4651 (part-III) and comprise of the following
loads
Dead Load
Live Load
Impact or Dynamic effect of Live Load
Tractive force due to breaking of vehicles
Earth Pressure
Hydrostatic and Hydrodynamic forces
Berthing Forces from the vessels
Mooring Forces from the vessel
Revamping of EQ2 TO EQ5 berths by construction a Multipurpose Purpose Terminal
in the Inner Harbour at Port of Visakhapatnam
Page | 74
Wind Force
Temperature Stresses
Shrinkage stresses
Seismic Forces
a. Details of Live Loads
Live load comprise of the following.
a) Uniformly distributed load: 5 t/m2
b) Container loads: equivalent point load associated with containers stacked 3high incorporating the load reduction factor for 3 high stacking – 72 t at one point from the corners of four containers.
c) Container Quay Crane/ wharf crane: Equivalent UDL – 100 t/m over one rail (70t wheel load at wheel spacing of 0.70m)
d) 45t Reach Stacker: Max. Wheel load- 25 t; Twin wheel configuration
e) Mobile Harbour Crane: 100 t capacity
f) 4 pads ; each 1.8m x 5.5m; maximum load on each pad – 336 t
g) Vehicle load: IRC Class A, AA or 70R; parallel or perpendicular to berth
b. Details of Berthing Force
Considering approach velocity of 0.15m/s as applicable for the vessel size and marine
conditions, the berthing energy works out to 103t ultimate energy capacity of 145 tm
with a normal reaction of m as per the formula in BIS code. The ultimate energy
absorption capacity of the selected fender should be 40% more than the calculated
berthing energy. IRM cone fender DCN 1300H; R1 grade has ultimate energy
absorption capacity of 146 tm and it is considered in the design. The corresponding
impact force is 217 t and according the berthing forces considered for the design is
220 t normal to the berth.
c. Details of Mooring Force
As per the IS Code mooring force of the vessels with displacement tonnage up to
100000 is 100t. Accordingly 100t mooring force is considered for the design of the
berth
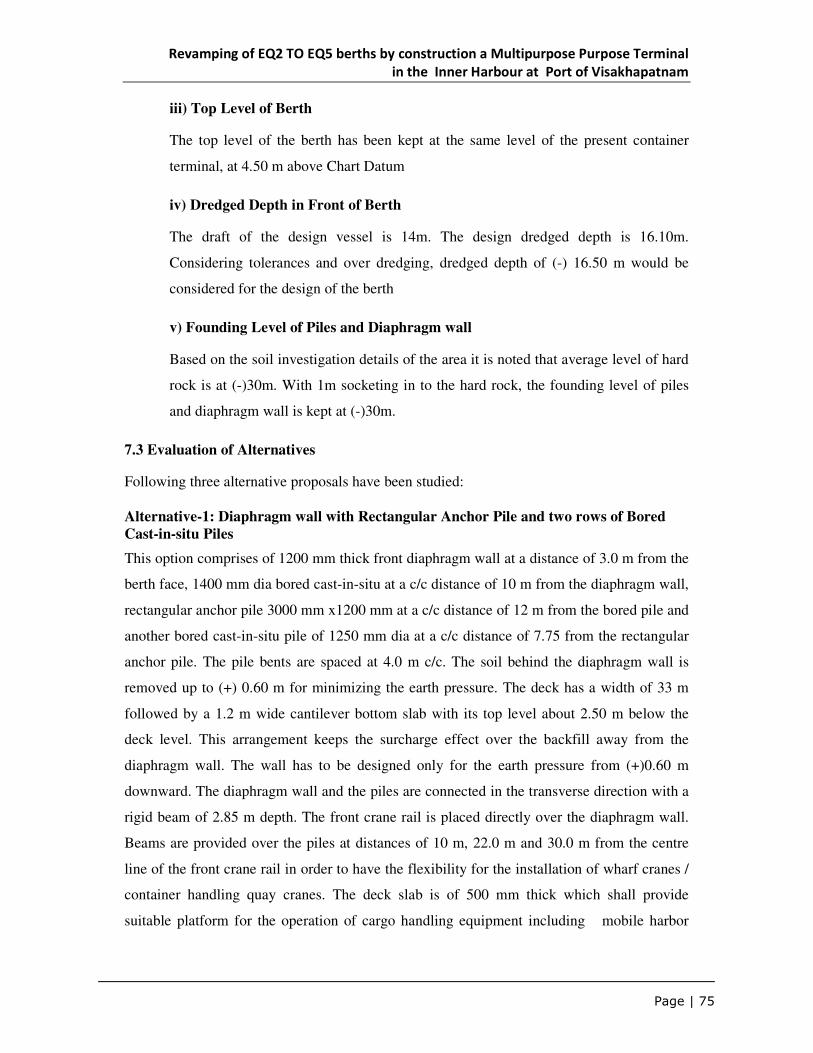
Revamping of EQ2 TO EQ5 berths by construction a Multipurpose Purpose Terminal
in the Inner Harbour at Port of Visakhapatnam
Page | 75
iii) Top Level of Berth
The top level of the berth has been kept at the same level of the present container
terminal, at 4.50 m above Chart Datum
iv) Dredged Depth in Front of Berth
The draft of the design vessel is 14m. The design dredged depth is 16.10m.
Considering tolerances and over dredging, dredged depth of (-) 16.50 m would be
considered for the design of the berth
v) Founding Level of Piles and Diaphragm wall
Based on the soil investigation details of the area it is noted that average level of hard
rock is at (-)30m. With 1m socketing in to the hard rock, the founding level of piles
and diaphragm wall is kept at (-)30m.
7.3 Evaluation of Alternatives
Following three alternative proposals have been studied: Alternative-1: Diaphragm wall with Rectangular Anchor Pile and two rows of Bored
Cast-in-situ Piles
This option comprises of 1200 mm thick front diaphragm wall at a distance of 3.0 m from the
berth face, 1400 mm dia bored cast-in-situ at a c/c distance of 10 m from the diaphragm wall,
rectangular anchor pile 3000 mm x1200 mm at a c/c distance of 12 m from the bored pile and
another bored cast-in-situ pile of 1250 mm dia at a c/c distance of 7.75 from the rectangular
anchor pile. The pile bents are spaced at 4.0 m c/c. The soil behind the diaphragm wall is
removed up to (+) 0.60 m for minimizing the earth pressure. The deck has a width of 33 m
followed by a 1.2 m wide cantilever bottom slab with its top level about 2.50 m below the
deck level. This arrangement keeps the surcharge effect over the backfill away from the
diaphragm wall. The wall has to be designed only for the earth pressure from (+)0.60 m
downward. The diaphragm wall and the piles are connected in the transverse direction with a
rigid beam of 2.85 m depth. The front crane rail is placed directly over the diaphragm wall.
Beams are provided over the piles at distances of 10 m, 22.0 m and 30.0 m from the centre
line of the front crane rail in order to have the flexibility for the installation of wharf cranes /
container handling quay cranes. The deck slab is of 500 mm thick which shall provide
suitable platform for the operation of cargo handling equipment including mobile harbor

Revamping of EQ2 TO EQ5 berths by construction a Multipurpose Purpose Terminal
in the Inner Harbour at Port of Visakhapatnam
Page | 76
cranes and crawler cranes. The sketch showing the part typical plan and cross section of
Alternative-1 is attached (Appendix- .7.1)
Alternative-2: T -Diaphragm wall with Rectangular Anchor Pile and three rows of
Bored Cast-in-situ Piles
This alternative consists of front earth retaining structure of RCC T - Diaphragm wall of size
4000 mm x 800 mm flange and 2200 mm x 800 mm rib. The centre line of the flange is at a
distance of 2.75 m from the berth face. From the centre line of the flange, the first bored cast-
in-situ pile of 1250 mm dia, second bored cast-in-situ pile of the same size, rectangular
anchor pile of 3000 mm x 800 mm size and the third bored cast-in-situ pile of 1400 mm dia
are located at 10 m, 16 m, 22 m and 30 m respectively. The pile bents are spaced at 4.0 m c/c.
The soil behind the diaphragm wall is removed up to (+) 1.80 m for minimizing the earth
pressure. The deck has a width of 33.45 m. The diaphragm wall has to be designed mainly for
the earth pressure from (+) 1.80 m downward. The diaphragm wall and the piles are
connected in the transverse direction with a rigid beam of 1.80 m depth. The front crane rail
is placed directly over the diaphragm wall at a distance of 2.75 m from the berth frontage.
The piles are connected with beams in the longitudinal direction. Longitudinal beams
provided over the piles at distances of 10 m, 22.0 m and 30.0 m from the centre line of the
front crane rail have been specially designed for carrying loads from container handling quay
cranes in order to have the flexibility for the installation of wharf cranes / container handling
quay cranes. The deck slab is of 400 mm thick which shall provide suitable platform for the
operation of cargo handling equipment including mobile harbor cranes and crawler cranes.
The sketch showing the part typical plan and cross section of Alternative-2 is attached
(Appendix - .7.2)
Alternative-3: T -Diaphragm wall and six rows of Bored Cast-in-situ Piles
In this alternative, front earth retaining structure is similar to Alternative No.2 viz. RCC T -
Diaphragm wall of size 4000 mm x 800 mm flange and 2200 mm x 800 mm rib. The centre
line of the flange is at a distance of 2.75 m from the berth face. The first bored cast-in-situ
pile is located at a distance of 10 m from the centre line of the diaphragm wall flange. The
first to sixth bored cast-in-situ piles are provided at equal spacing of 4 m. The first to third
bored cast-in-situ piles are of 1250 mm dia whereas the other three piles are of 1400 mm dia.

Revamping of EQ2 TO EQ5 berths by construction a Multipurpose Purpose Terminal
in the Inner Harbour at Port of Visakhapatnam
Page | 77
The pile bents are spaced at 4.0 m c/c. The soil behind the diaphragm wall is removed up to
(+) 1.80 m for minimizing the earth pressure. The deck has a width of 33.45 m. The
diaphragm wall has to be designed mainly for the earth pressure from (+) 1.80 m downward.
The diaphragm wall and the piles are connected in the transverse direction with a rigid beam
of 1.80 m depth. The front crane rail is placed directly over the diaphragm wall at a distance
of 2.75 m from the berth frontage. The piles are connected with beams in the longitudinal
direction. Longitudinal beams provided over the piles at distances of 10 m, 22.0 m and 30.0
m from the centre line of the front crane rail have been specially designed for carrying loads
from container handling quay cranes in order to have the flexibility for the installation of
wharf cranes / container handling quay cranes. The deck slab is of 400 mm thick which shall
provide suitable platform for the operation of cargo handling equipment including mobile
harbor cranes and crawler cranes. The sketch showing the part typical plan and cross section
of Alternative-3 is attached (Appendix - 7 .3)
Comparison of Alternatives
The three technically acceptable design alternatives are compared with respect to cost of
construction of the berth, construction easiness and structural performance.
Sl. No. Attribute Alternative-1:
Diaphragm wall
with
Rectangular
Anchor Pile and
two rows of
Bored Cast-in-
situ Piles
Alternative-2:
T -Diaphragm
wall with
Rectangular
Anchor Pile and
three rows of
Bored Cast-in-
situ Piles
Alternative-3:
T -Diaphragm
wall and six
rows of Bored
Cast-in-situ Piles
1. Berth
construction cost
for 280 m length
(Rs. Crores)
102.75 100.89 116.24
2. Construction
Easiness
Plain diaphragm
wall enables
choosing panel
width according
to the
construction
convenience. It
For T-diaphragm
wall, ribs are to
be provided at
fixed spacing
which requires
the construction
of panels in fixed
For T-diaphragm
wall, ribs are to
be provided at
fixed spacing
which requires
the construction
of panels in fixed

Revamping of EQ2 TO EQ5 berths by construction a Multipurpose Purpose Terminal
in the Inner Harbour at Port of Visakhapatnam
Page | 78
The Alternative-1: diaphragm wall with rectangular anchor pile and two rows of bored cast-
in-situ piles, although marginally costlier, is the most promising one on considerations of
construction easiness and structural performance. Accordingly this alternative is chosen for
the costing in the feasibility report.
would be possible
to use the same
grab both for
diaphragm wall
construction and
rectangular piles
by appropriately
choosing the
panel width.
4 m width.
Further, separate
grabs are required
for Rectangular
piles which
would reduce the
construction
flexibility
4 m width. This
would the
construction
flexibility
3. Structural
Performance
Plain diaphragm
wall is flexible
with respect to
the soil yielding.
This effect would
reduce the active
soil pressure and
increase resisting
soil passive
pressure
T-diaphragm wall
is rigid with
respect to the soil
yielding. This
effect would
increase the
active soil
pressure and
reduce resisting
soil passive
pressure
T-diaphragm wall
is rigid with
respect to the soil
yielding. This
effect would
increase the
active soil
pressure and
reduce resisting
soil passive
pressure

Revamping of EQ2 TO EQ5 berths by construction a Multipurpose Purpose Terminal
in the Inner Harbour at Port of Visakhapatnam
Page | 79
Appendix - 7.1
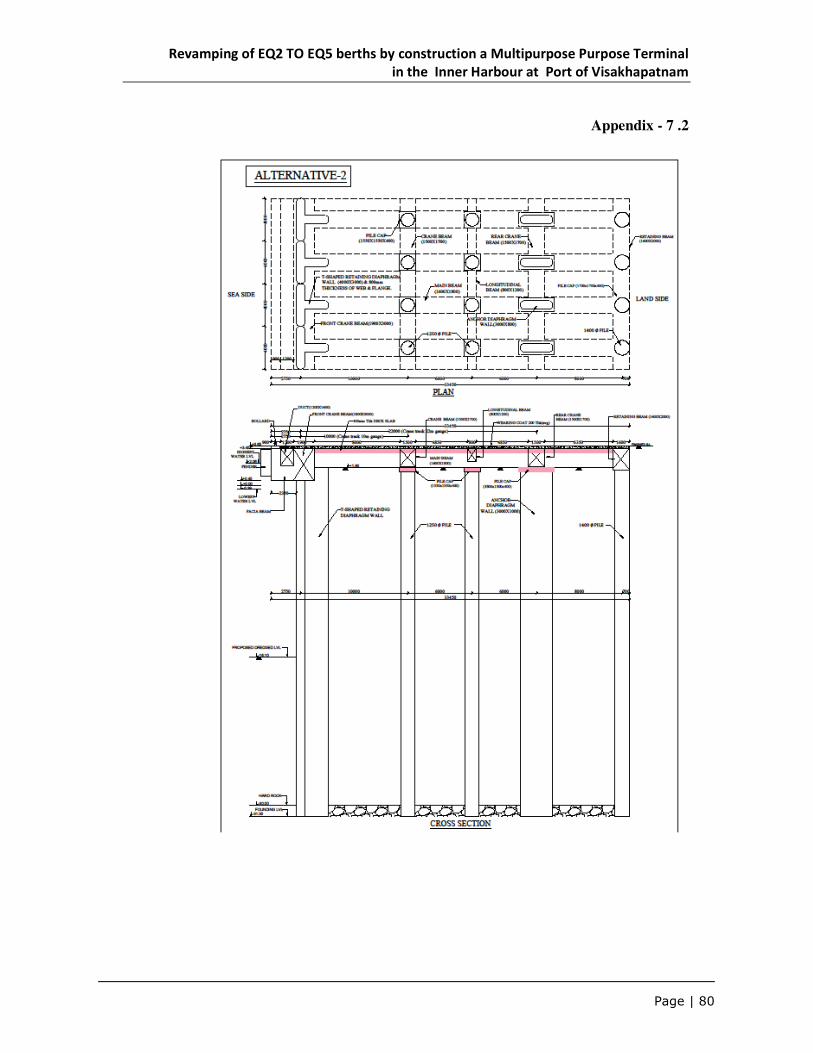
Revamping of EQ2 TO EQ5 berths by construction a Multipurpose Purpose Terminal
in the Inner Harbour at Port of Visakhapatnam
Page | 80
Appendix - 7 .2
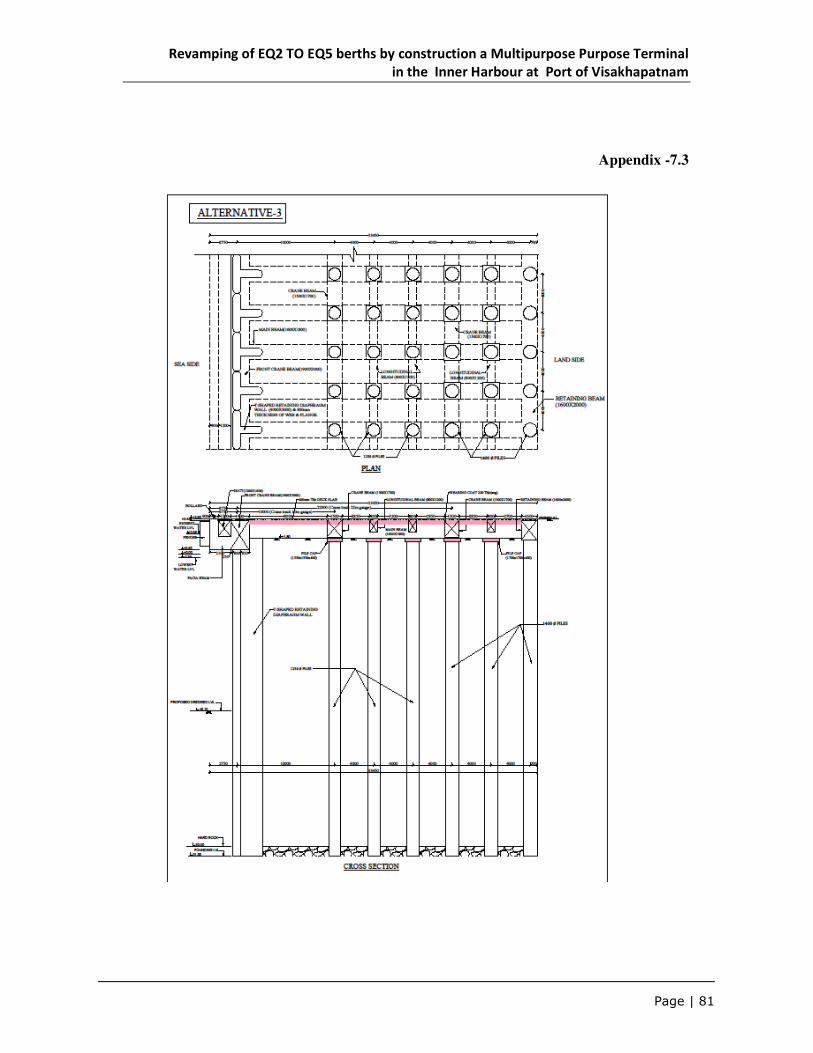
Revamping of EQ2 TO EQ5 berths by construction a Multipurpose Purpose Terminal
in the Inner Harbour at Port of Visakhapatnam
Page | 81
Appendix -7.3
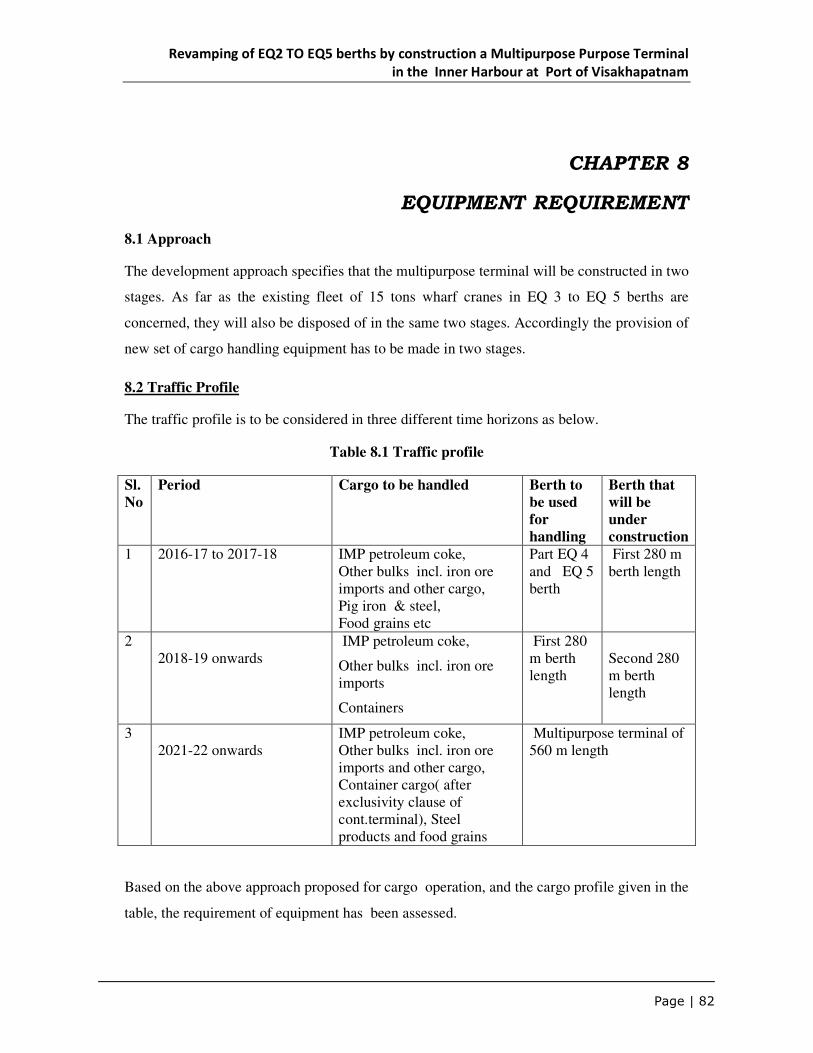
Revamping of EQ2 TO EQ5 berths by construction a Multipurpose Purpose Terminal
in the Inner Harbour at Port of Visakhapatnam
Page | 82
CHAPTER 8
EQUIPMENT REQUIREMENT
8.1 Approach
The development approach specifies that the multipurpose terminal will be constructed in two
stages. As far as the existing fleet of 15 tons wharf cranes in EQ 3 to EQ 5 berths are
concerned, they will also be disposed of in the same two stages. Accordingly the provision of
new set of cargo handling equipment has to be made in two stages.
8.2 Traffic Profile
The traffic profile is to be considered in three different time horizons as below.
Table 8.1 Traffic profile
Sl.
No
Period Cargo to be handled Berth to
be used
for
handling
Berth that
will be
under
construction
1 2016-17 to 2017-18 IMP petroleum coke, Other bulks incl. iron ore imports and other cargo, Pig iron & steel, Food grains etc
Part EQ 4 and EQ 5 berth
First 280 m berth length
2 2018-19 onwards
IMP petroleum coke,
Other bulks incl. iron ore imports
Containers
First 280 m berth length
Second 280 m berth length
3 2021-22 onwards
IMP petroleum coke, Other bulks incl. iron ore imports and other cargo, Container cargo( after exclusivity clause of cont.terminal), Steel products and food grains
Multipurpose terminal of 560 m length
Based on the above approach proposed for cargo operation, and the cargo profile given in the
table, the requirement of equipment has been assessed.

Revamping of EQ2 TO EQ5 berths by construction a Multipurpose Purpose Terminal
in the Inner Harbour at Port of Visakhapatnam
Page | 83
8.3 Assessment of equipment requirement
The cargo forecast for the multipurpose terminal as assessed and presented in the earlier
chapter is reproduced below.
CARGO 2018-19* 2019-20 2020-21 2021-22 2022-23 2026-27 2031-32
IMP petroleum coke 9(70) 9(70) 9(70) 10(80) 10(67) 10(67) 10 (67)
Other bulks incl. iron ore imports and other cargo
5(40) 6 6 8(64) 8(64) 8(64) 10 (67)
Steel product
3 3.5 3.5 3.5 3.5 3.5
Food grains 9 9 10 20 22- 26- 26
Container cargo
( after exclusivity clause of cont.terminal)
- 3
(20000 teu)
7
(50000teu)
12
(70000 teu)
15
(1 lakh Teu)
TOTAL 23 27 28.5 44.5
50.5
59.5
64.5
8.3.1 Petroleum coke and other bulk cargo, steel products and containers
For handling those cargos which are mainly bulk, it is proposed to provide Harbour Mobile
Cranes (HMC) for ship to shore handling with grab attachments. For handling steel products
and containers, the same type of HMC will be adequate to handle these two types of cargos
with hook and spreader attachments.
Productivity approved for 100 tons HMC by TAMP is 1 2,500 tons per day. Considering the
quantum of cargo to be handled ultimately which is 20 lakhs tons of bulk cargo, 3.5 lakhs
tons of steel products and 15 lakhs tons of containers, three HMCs are proposed taking into
consideration the productivity norm approved by TAMP.
For shore handling matching equipment are to be provided. For handling bulk cargo which
will be stored in the open yard close to the berth, dumpers and pay loaders are proposed. For
handling steel products which come in the form of coils, rods etc., Fork Lift Trucks (FLT)
and mobile cranes are pr0posed. For container handling, Rubber Tyred Gantry (RTG) cranes,
tractor trailers and reach stackers are proposed.

Revamping of EQ2 TO EQ5 berths by construction a Multipurpose Purpose Terminal
in the Inner Harbour at Port of Visakhapatnam
Page | 84
For arriving at the number and capacity, the quantum of cargo to be handled, productivity of
each equipment and the packaging sizes are considered. On this basis, the type, capacity and
number of these equipments required had been worked out and listed below.
a. 25 tons capacity dumpers : 5 Nos.
b. 10 tons capacity pay loaders : 5 Nos.
c. 25 tons FLT : 2 Nos.
d. 25 tons mobile cranes : 1 No.
e. RTGs : 4 Nos.
f. Tractor trailers : 8 Nos
g. Reach stackers : 2 Nos.
8.3.2 Food grains export
For handling food grains, a dedicated handling system with silos for storage, conveyor
systems for the transportation of food grain from silos to the loading berth and ship loader for
loading the food grains into the ship is proposed.
The system will operate as follows.
a) The food grains will be received from hinterland through trucks or by rail
b) The cargo will be offloaded into the ware house for temporary storage.
c) It will be transhipped to the silos through a system of conveyors and elevators
d) The cargo will be stored in 6 nos. silos to store four different food grains
e) From the silos the cargo will be conveyed to the berth apron through conveyor system
f) A dedicated ship loader will load the food grains into the ship
A block cost has been provided for this system.
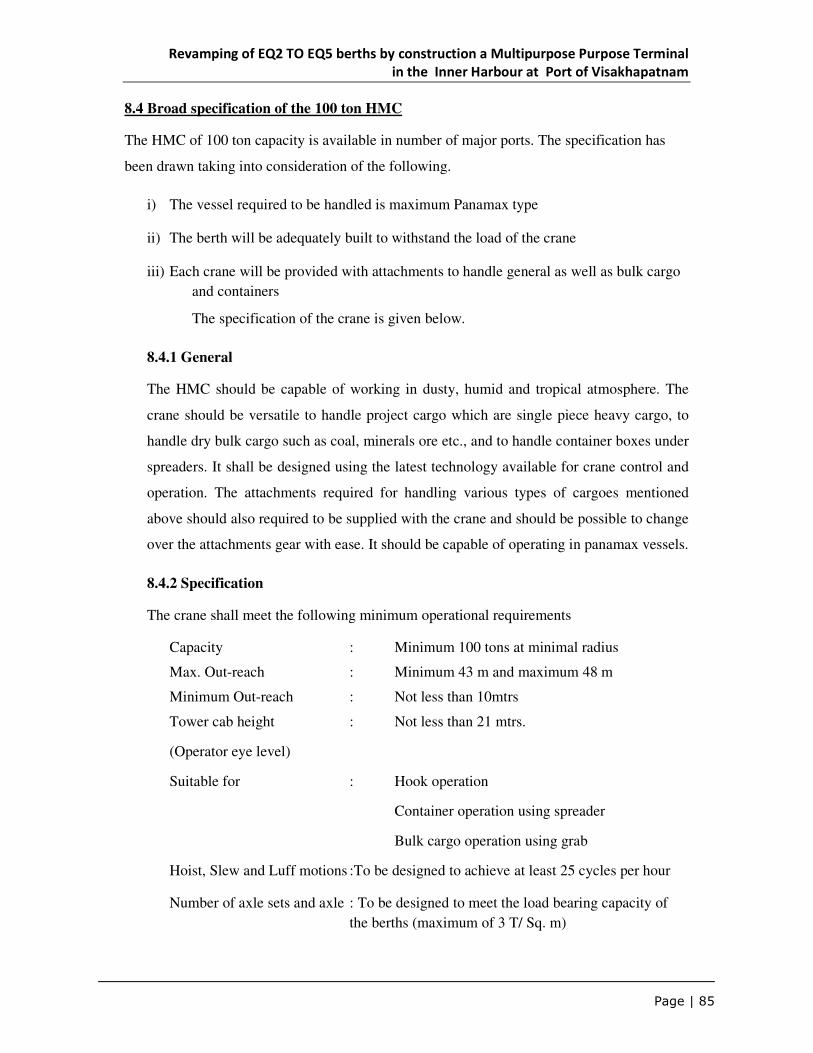
Revamping of EQ2 TO EQ5 berths by construction a Multipurpose Purpose Terminal
in the Inner Harbour at Port of Visakhapatnam
Page | 85
8.4 Broad specification of the 100 ton HMC
The HMC of 100 ton capacity is available in number of major ports. The specification has
been drawn taking into consideration of the following.
i) The vessel required to be handled is maximum Panamax type
ii) The berth will be adequately built to withstand the load of the crane
iii) Each crane will be provided with attachments to handle general as well as bulk cargo
and containers
The specification of the crane is given below.
8.4.1 General
The HMC should be capable of working in dusty, humid and tropical atmosphere. The
crane should be versatile to handle project cargo which are single piece heavy cargo, to
handle dry bulk cargo such as coal, minerals ore etc., and to handle container boxes under
spreaders. It shall be designed using the latest technology available for crane control and
operation. The attachments required for handling various types of cargoes mentioned
above should also required to be supplied with the crane and should be possible to change
over the attachments gear with ease. It should be capable of operating in panamax vessels.
8.4.2 Specification
The crane shall meet the following minimum operational requirements
Capacity : Minimum 100 tons at minimal radius
Max. Out-reach : Minimum 43 m and maximum 48 m
Minimum Out-reach : Not less than 10mtrs
Tower cab height : Not less than 21 mtrs.
(Operator eye level)
Suitable for : Hook operation
Container operation using spreader
Bulk cargo operation using grab
Hoist, Slew and Luff motions :To be designed to achieve at least 25 cycles per hour
Number of axle sets and axle : To be designed to meet the load bearing capacity of
the berths (maximum of 3 T/ Sq. m)
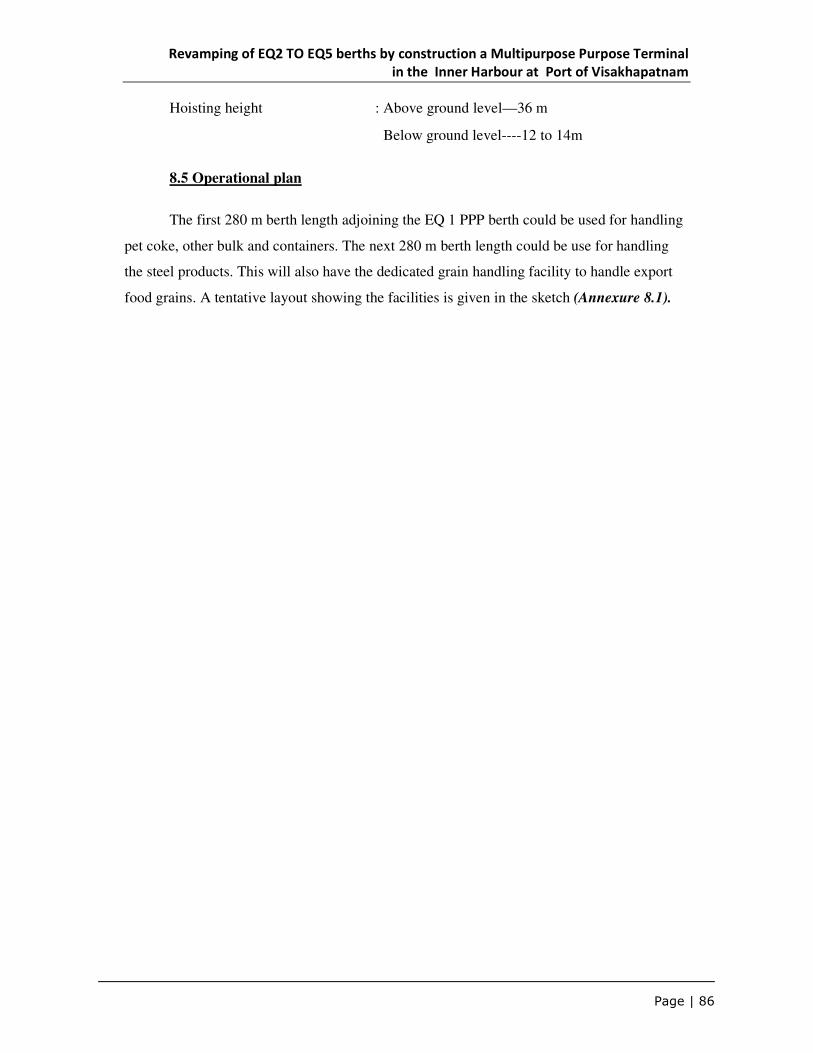
Revamping of EQ2 TO EQ5 berths by construction a Multipurpose Purpose Terminal
in the Inner Harbour at Port of Visakhapatnam
Page | 86
Hoisting height : Above ground level—36 m
Below ground level----12 to 14m
8.5 Operational plan
The first 280 m berth length adjoining the EQ 1 PPP berth could be used for handling
pet coke, other bulk and containers. The next 280 m berth length could be use for handling
the steel products. This will also have the dedicated grain handling facility to handle export
food grains. A tentative layout showing the facilities is given in the sketch (Annexure 8.1).

Revamping of EQ2 TO EQ5 berths by construction a Multipurpose Purpose Terminal
in the Inner Harbour at Port of Visakhapatnam
Page | 87
Annexure-8.1

Revamping of EQ2 TO EQ5 berths by construction a Multipurpose Purpose Terminal
in the Inner Harbour at Port of Visakhapatnam
Page | 88
CHAPTER 9
CAPITAL COST ESTIMATE AND
IMPLEMENTATION SCHEDULE
9.1 Capital Cost
Capital cost estimate is prepared based on quantities estimated with reference to structural
sections derived based on preliminary designs. The rates for various items are derived with
reference to the rates in the ongoing contracts of VPT for the works of (a) Extension of West
Quay Return end in replacement of existing RCC lay by Jetty for coastal cargo etc. and (b)
Development of West Quay-North (WQ7&8), with updating to the current cost level and
obtaining budgetary quotations/obtaining rates through market enquiries for items for which
rates are not available in the on-going contracts. As regard to equipment cost, the estimated
cost is based on budgetary offers received for the proposed equipments/ in house data of IPA
for similar equipments duly considering 5% towards miscellaneous cost as per TAMP
Guidelines 2008 which includes cost of facilities required for operation of the berth and
includes upfront payment, interest during construction (IDC), working capital margin, etc..
9.2 The total Capital cost of the project taking into consideration the above factors works out
to Rs.426.26Crores, the details of which are presented below.
I. Civil cost Rs. In lakhs
a. Construction of berths 20550.82
b. Berth Fixtures 587.82
c. Dredging 1337.28
d. Dismantling of Existing Structures & Dredging 1968.98
e. Dismantling and Removing Return Retaining structures 301.80
f. 3% Contingencies 742.40
g. 7% Project Supervision Charges 1274.46
f. Environmental Measures (0.5%) 123.73
g. Cess (1% on Base cost) 247.47
h. Development of Stacking Area for Containers 900.00
i. Development of Stacking Area for Dry Bulk 1800.00
j. Civil Cost for Food Grain Handling 2400.00
32234.76
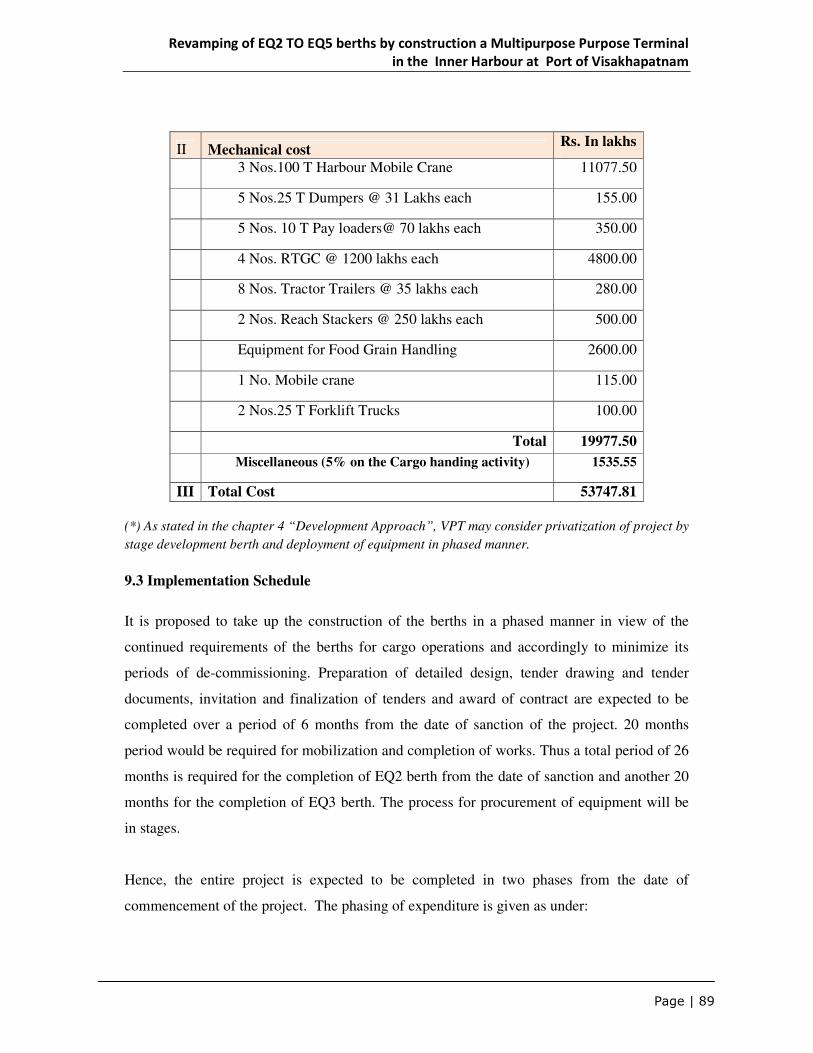
Revamping of EQ2 TO EQ5 berths by construction a Multipurpose Purpose Terminal
in the Inner Harbour at Port of Visakhapatnam
Page | 89
II Mechanical cost Rs. In lakhs
3 Nos.100 T Harbour Mobile Crane 11077.50
5 Nos.25 T Dumpers @ 31 Lakhs each 155.00
5 Nos. 10 T Pay loaders@ 70 lakhs each 350.00
4 Nos. RTGC @ 1200 lakhs each 4800.00
8 Nos. Tractor Trailers @ 35 lakhs each 280.00
2 Nos. Reach Stackers @ 250 lakhs each 500.00
Equipment for Food Grain Handling 2600.00
1 No. Mobile crane 115.00
2 Nos.25 T Forklift Trucks 100.00
Total 19977.50
Miscellaneous (5% on the Cargo handing activity) 1535.55
III Total Cost 53747.81
(*) As stated in the chapter 4 “Development Approach”, VPT may consider privatization of project by
stage development berth and deployment of equipment in phased manner.
9.3 Implementation Schedule
It is proposed to take up the construction of the berths in a phased manner in view of the
continued requirements of the berths for cargo operations and accordingly to minimize its
periods of de-commissioning. Preparation of detailed design, tender drawing and tender
documents, invitation and finalization of tenders and award of contract are expected to be
completed over a period of 6 months from the date of sanction of the project. 20 months
period would be required for mobilization and completion of works. Thus a total period of 26
months is required for the completion of EQ2 berth from the date of sanction and another 20
months for the completion of EQ3 berth. The process for procurement of equipment will be
in stages.
Hence, the entire project is expected to be completed in two phases from the date of
commencement of the project. The phasing of expenditure is given as under:

Revamping of EQ2 TO EQ5 berths by construction a Multipurpose Purpose Terminal
in the Inner Harbour at Port of Visakhapatnam
Page | 90
(Rs. In lakhs)
Year Civil Mechanical Total
2016-17 4083.50 0 4083.50
2017-18 10596.95 9032.00 19628.95
2018-19 1361.17 5657.40 7018.57
2019-20 4056.92 0 4056.92
2020-21 10774.69 4099.72 14874.41
2021-22 1362.31 2723.15 4085.46
32235.54 21512.27 53747.81
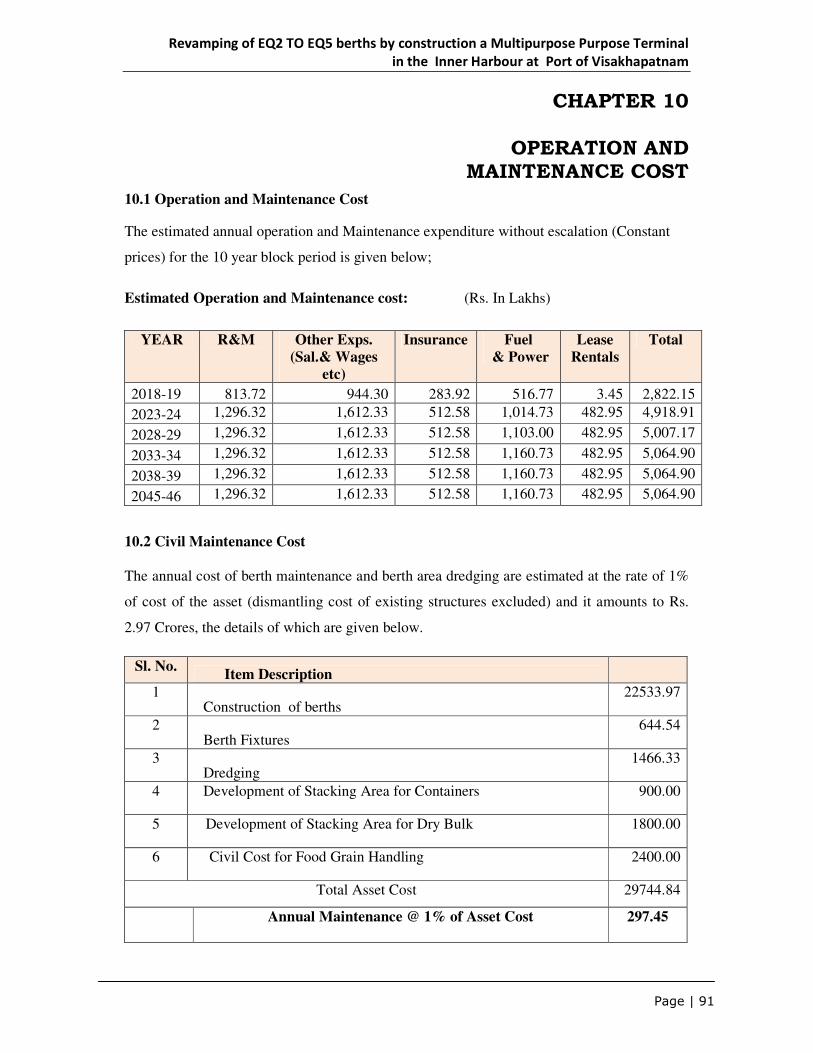
Revamping of EQ2 TO EQ5 berths by construction a Multipurpose Purpose Terminal
in the Inner Harbour at Port of Visakhapatnam
Page | 91
CHAPTER 10
OPERATION AND
MAINTENANCE COST
10.1 Operation and Maintenance Cost
The estimated annual operation and Maintenance expenditure without escalation (Constant
prices) for the 10 year block period is given below;
Estimated Operation and Maintenance cost: (Rs. In Lakhs)
YEAR R&M Other Exps.
(Sal.& Wages
etc)
Insurance Fuel
& Power
Lease
Rentals
Total
2018-19 813.72 944.30 283.92 516.77 3.45 2,822.15
2023-24 1,296.32 1,612.33 512.58 1,014.73 482.95 4,918.91
2028-29 1,296.32 1,612.33 512.58 1,103.00 482.95 5,007.17
2033-34 1,296.32 1,612.33 512.58 1,160.73 482.95 5,064.90
2038-39 1,296.32 1,612.33 512.58 1,160.73 482.95 5,064.90
2045-46 1,296.32 1,612.33 512.58 1,160.73 482.95 5,064.90
10.2 Civil Maintenance Cost
The annual cost of berth maintenance and berth area dredging are estimated at the rate of 1%
of cost of the asset (dismantling cost of existing structures excluded) and it amounts to Rs.
2.97 Crores, the details of which are given below.
Sl. No. Item Description
1 Construction of berths
22533.97
2 Berth Fixtures
644.54
3 Dredging
1466.33
4 Development of Stacking Area for Containers 900.00
5 Development of Stacking Area for Dry Bulk 1800.00
6 Civil Cost for Food Grain Handling 2400.00
Total Asset Cost 29744.84
Annual Maintenance @ 1% of Asset Cost 297.45
Revamping of EQ2 TO EQ5 berths by construction a Multipurpose Purpose Terminal
in the Inner Harbour at Port of Visakhapatnam
Page | 92
b) Mechanical Maintenance Cost.
Annual Operation & Maintenance Cost for the equipment to be deployed for the project is
estimated based on TAMP guidelines for fixation of upfront tariff (2008). The key
assumptions are given below:
i. Repairs & Maintenance cost at 5% of the Original Capital cost of the equipment
as per the TAMP Guidelines..
ii. Other expenses at the rate of 5% of the Original Capital cost of the asset as per the
TAMP guidelines 2008. which include the following :
(a) Salaries and wages of operating and maintenance staff including welfare and other expenses towards them.
(b) Management and general overheads and other miscellaneous cost.
iii. Fuel consumption is taken as per the TAMP tariff orders/ guidelines at prevailing
Diesel Price Rs. 54.66/- per litre (28-4-2014)
iv. The Power consumption for area illumination is taken at 1.2 lakh units per annum
per hectare. ( TAMP allowed 2.4 lakh units per annum per hectare for PPT Multi
purpose Berth as per norms prescribed for Liquid Bulk Terminal by TAMP.
v. Unit rate of electricity is considered as Rs.6.17/ unit.
vi. The working hours of each equipment is considered based on the working time of
vessels at the optimum capacity.
vii. Depreciation is estimated at 10.34% of the capital cost of the equipment and
3.34% on Capital cost of civil structures on Straight line method under Companies
Act, 1961 as per TAMP Guidelines..
viii. The Insurance cost @ 1% of capital cost is considered as per TAMP Guidelines.
under the O&M expenditure.
The year-wise breakup of operation and maintenance expenditure iw annexed at Appendix –
10.01

Revamping of EQ2 TO EQ5 berths by construction a Multipurpose Purpose Terminal
in the Inner Harbour at Port of Visakhapatnam
Page | 93
Appendix- 10.01
Estimated Annual Operation & Maintenance Expenditure
Rs. In lakhs
2015-16
2016-17 263.45 263.45
2017-18 263.45 263.45
2018-19 813.72 944.30 283.92 516.77 263.45 2,822.15
2019-20 813.72 944.30 283.92 630.12 482.95 3,155.00
2020-21 813.72 944.30 283.92 666.20 482.95 3,191.08
2021-22 1,296.32 1,612.33 512.58 872.34 482.95 4,776.52
2022-23 1,296.32 1,612.33 512.58 956.97 482.95 4,861.15
2023-24 1,296.32 1,612.33 512.58 1,014.73 482.95 4,918.91
2024-25 1,296.32 1,612.33 512.58 1,030.66 482.95 4,934.84
2025-26 1,296.32 1,612.33 512.58 1,046.59 482.95 4,950.76
2026-27 1,296.32 1,612.33 512.58 1,078.44 482.95 4,982.62
2027-28 1,296.32 1,612.33 512.58 1,086.41 482.95 4,990.58
2028-29 1,296.32 1,612.33 512.58 1,103.00 482.95 5,007.17
2029-30 1,296.32 1,612.33 512.58 1,123.57 482.95 5,027.74
2030-31 1,296.32 1,612.33 512.58 1,127.55 482.95 5,031.73
2031-32 1,296.32 1,612.33 512.58 1,160.73 482.95 5,064.90
2032-33 1,296.32 1,612.33 512.58 1,160.73 482.95 5,064.90
2033-34 1,296.32 1,612.33 512.58 1,160.73 482.95 5,064.90
2034-35 1,296.32 1,612.33 512.58 1,160.73 482.95 5,064.90
2035-36 1,296.32 1,612.33 512.58 1,160.73 482.95 5,064.90
2036-37 1,296.32 1,612.33 512.58 1,160.73 482.95 5,064.90
2037-38 1,296.32 1,612.33 512.58 1,160.73 482.95 5,064.90
2038-39 1,296.32 1,612.33 512.58 1,160.73 482.95 5,064.90
2039-40 1,296.32 1,612.33 512.58 1,160.73 482.95 5,064.90
2040-41 1,296.32 1,612.33 512.58 1,160.73 482.95 5,064.90
2041-42 1,296.32 1,612.33 512.58 1,160.73 482.95 5,064.90
2042-43 1,296.32 1,612.33 512.58 1,160.73 482.95 5,064.90
2043-44 1,296.32 1,612.33 512.58 1,160.73 482.95 5,064.90
2044-45 1,296.32 1,612.33 512.58 1,160.73 482.95 5,064.90
2045-46 1,296.32 1,612.33 512.58 1,160.73 482.95 5,064.90
Total 34849.26 43141.07 13666.22 29664.25 13829.88 135150.68
R&M
Other Exps.
(Sal.&
Wages etc) Insurance Fuel & PowerLicense Fee Total
YEAR

Revamping of EQ2 TO EQ5 berths by construction a Multipurpose Purpose Terminal
in the Inner Harbour at Port of Visakhapatnam
Page | 94
CHAPTER 11
ANNUAL REVENUE ESTIMATES
11.1 The financial analysis is based on the premise that the project will be carried out
through PPP mode. The revenue earnings from the project is basically the Berth hire charges
and Handling charges. The Revenue share from the prospective PPP operator will accrue to
the port, which mainly depends on the cargo growth and the other developments in the
hinterland of the port. The estimated annual revenue on constant tariff (without tariff
escalation) at the each 5 year block period is given below
Estimated Revenue from the project:
(Rs. In Lakhs)
Year Handling Charges
Berth Hire Total
2018-19 2,512.92 1,042.47 3,555.40
2023-24 9,016.45 3,458.31 12,474.76
2028-29 10,540.01 3,891.30 14,431.31
2033-34 11,293.90 4,107.73 15,401.63
2038-39 11,293.90 4,107.73 15,401.63
2045-46 11,293.90 4,107.73 15,401.63
11.2 The broad assumptions for the estimating the revenue are as follows.
The Handling charges and berth hire charges have been estimated out based on the
preliminary calculations as per the TAMP Guidelines for determination of upfront tariff
(2008.). In this regard, it is to be noted that the Projected Cargo Profile comprises varied
cargoes viz., Containers, Break bulk cargoes like Steel Products and Dry bulk cargoes like
Pet Coke, Food Grains etc. The equipment planned for the proposed 560 meters of Berth
Length for faster and efficient handling includes Container handling equipment, Harbour
Mobile Cranes with supporting Bulk Handling Equipment and Mechanised handling
facilities to a small extent for Dry Bulk Cargoes like Food Grains. Thus the Terminal will
have combination of features of Container Terminal and Multi-Purpose Cargo Berth. In view
of the uniqueness of the Project, no notified Reference Tariff is available across the Major

Revamping of EQ2 TO EQ5 berths by construction a Multipurpose Purpose Terminal
in the Inner Harbour at Port of Visakhapatnam
Page | 95
Ports except in Paradip Port Trust where Reference Tariff has been notified for its Multi-
Purpose Berth to handle clean cargoes including containers. However, TAMP while notifying
the said tariff, has mentioned that the approach adopted by the PPT for adoption of rates from
two different projects of a particular port on account of uniqueness of the project at PPT
should not be cited as a precedent in fixation of Reference tariff at any other Major Port
Trust. Also, the TAMP had put a check on the equipment proposed to be deployed at the PPT
facility. Hence, the Reference Tariff of PPT is not reckoned for estimation of revenue
earnings for this project. The other option available as per TAMP guidelines is that the tariff
determined for a particular commodity under 2008 guidelines at that Major Port Trust or any
other Major Port Trust is not a representative Reference Tariff for that commodity, then to
approach TAMP with a proposal to refix Reference Tariff under 2008 guidelines. Accordingly,
the Handling charges and berth hire charges have been estimated out based on the
preliminary calculations as per the TAMP Guidelines for determination of upfront tariff
(2008).
11.3 The handling charges proposed in this exercise is a composite rate for handling from
ship to Shore, Shore clearance, transportation to stackyard.
The estimated year-wise revenue for the projected traffic is given in Appendix – 11.01 and
11.3 for a project life of 30 years.
11.4 The revenue from Port Dues and Pilotage as per the General scale of rates shall accrue
to the port, however, the same has not been considered for the cash flows.
11.5 The Revenue loss due to likely loss in traffic of around 4.8 million tonnes per annum
(Iron ore – 1.2 MMTPA, Fertilisers – 1.0 MMTPA and Other bulk – 2.60 MMTPA) if the
Project is not undertaken is considered as opportunity benefit for the Project and assumed
that it will offset the loss in revenue on the traffic heither to being handled in EQ 2 to EQ 5
which are proposed to be revamped to take up this project.
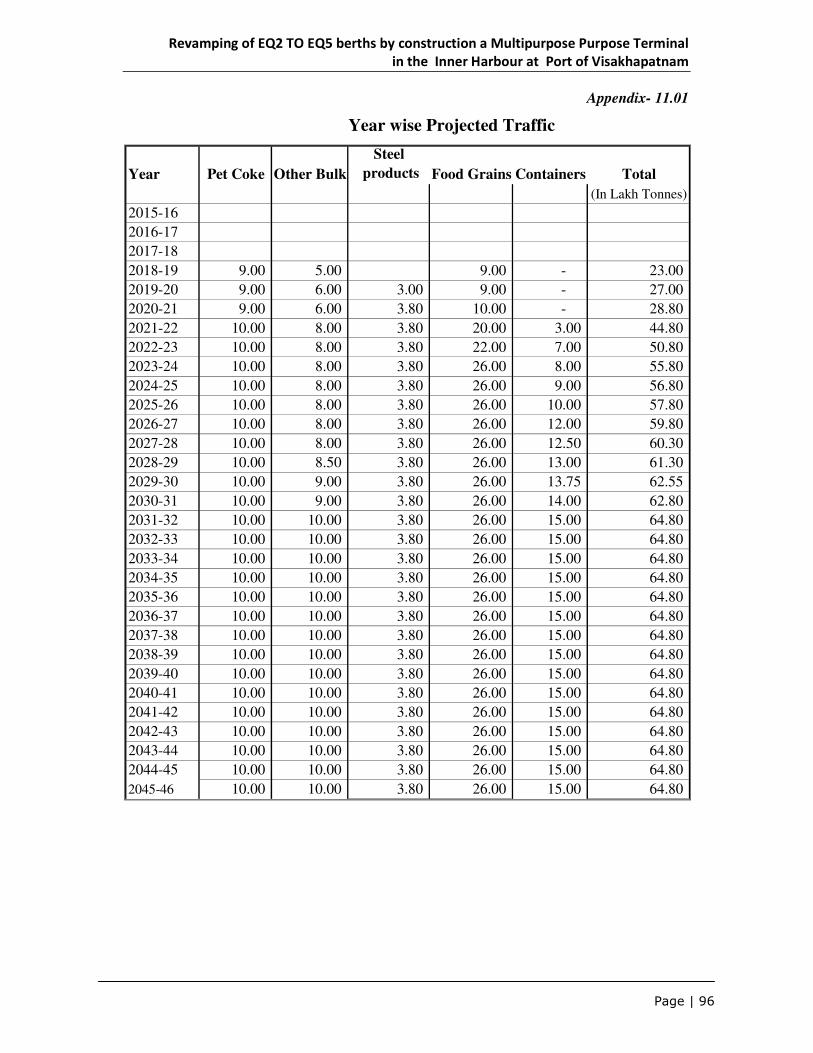
Revamping of EQ2 TO EQ5 berths by construction a Multipurpose Purpose Terminal
in the Inner Harbour at Port of Visakhapatnam
Page | 96
Appendix- 11.01
Year wise Projected Traffic
Year Pet Coke Other Bulk
Steel
products Food Grains Containers Total
(In Lakh Tonnes)
2015-16
2016-17
2017-18
2018-19 9.00 5.00 9.00 - 23.00
2019-20 9.00 6.00 3.00 9.00 - 27.00
2020-21 9.00 6.00 3.80 10.00 - 28.80
2021-22 10.00 8.00 3.80 20.00 3.00 44.80
2022-23 10.00 8.00 3.80 22.00 7.00 50.80
2023-24 10.00 8.00 3.80 26.00 8.00 55.80
2024-25 10.00 8.00 3.80 26.00 9.00 56.80
2025-26 10.00 8.00 3.80 26.00 10.00 57.80
2026-27 10.00 8.00 3.80 26.00 12.00 59.80
2027-28 10.00 8.00 3.80 26.00 12.50 60.30
2028-29 10.00 8.50 3.80 26.00 13.00 61.30
2029-30 10.00 9.00 3.80 26.00 13.75 62.55
2030-31 10.00 9.00 3.80 26.00 14.00 62.80
2031-32 10.00 10.00 3.80 26.00 15.00 64.80
2032-33 10.00 10.00 3.80 26.00 15.00 64.80
2033-34 10.00 10.00 3.80 26.00 15.00 64.80
2034-35 10.00 10.00 3.80 26.00 15.00 64.80
2035-36 10.00 10.00 3.80 26.00 15.00 64.80
2036-37 10.00 10.00 3.80 26.00 15.00 64.80
2037-38 10.00 10.00 3.80 26.00 15.00 64.80
2038-39 10.00 10.00 3.80 26.00 15.00 64.80
2039-40 10.00 10.00 3.80 26.00 15.00 64.80
2040-41 10.00 10.00 3.80 26.00 15.00 64.80
2041-42 10.00 10.00 3.80 26.00 15.00 64.80
2042-43 10.00 10.00 3.80 26.00 15.00 64.80
2043-44 10.00 10.00 3.80 26.00 15.00 64.80
2044-45 10.00 10.00 3.80 26.00 15.00 64.80
2045-46 10.00 10.00 3.80 26.00 15.00 64.80
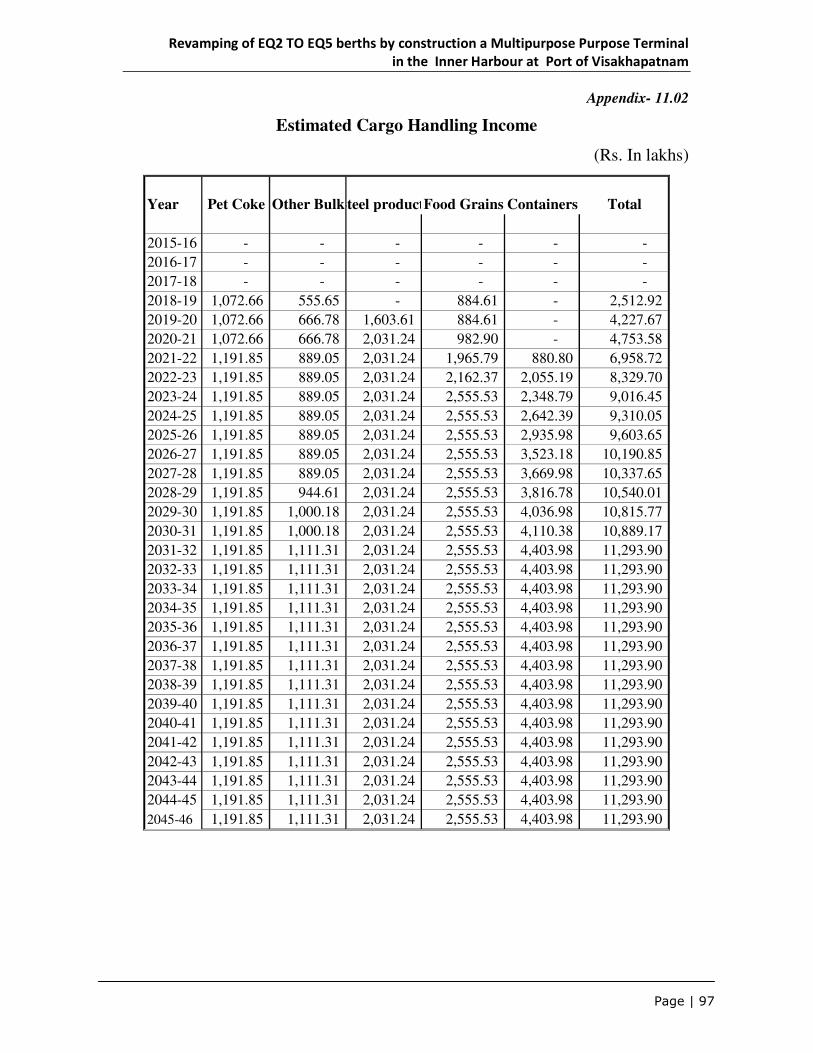
Revamping of EQ2 TO EQ5 berths by construction a Multipurpose Purpose Terminal
in the Inner Harbour at Port of Visakhapatnam
Page | 97
Appendix- 11.02
Estimated Cargo Handling Income
(Rs. In lakhs)
Year Pet Coke Other BulkSteel productsFood Grains Containers Total
2015-16 - - - - - -
2016-17 - - - - - -
2017-18 - - - - - -
2018-19 1,072.66 555.65 - 884.61 - 2,512.92
2019-20 1,072.66 666.78 1,603.61 884.61 - 4,227.67
2020-21 1,072.66 666.78 2,031.24 982.90 - 4,753.58
2021-22 1,191.85 889.05 2,031.24 1,965.79 880.80 6,958.72
2022-23 1,191.85 889.05 2,031.24 2,162.37 2,055.19 8,329.70
2023-24 1,191.85 889.05 2,031.24 2,555.53 2,348.79 9,016.45
2024-25 1,191.85 889.05 2,031.24 2,555.53 2,642.39 9,310.05
2025-26 1,191.85 889.05 2,031.24 2,555.53 2,935.98 9,603.65
2026-27 1,191.85 889.05 2,031.24 2,555.53 3,523.18 10,190.85
2027-28 1,191.85 889.05 2,031.24 2,555.53 3,669.98 10,337.65
2028-29 1,191.85 944.61 2,031.24 2,555.53 3,816.78 10,540.01
2029-30 1,191.85 1,000.18 2,031.24 2,555.53 4,036.98 10,815.77
2030-31 1,191.85 1,000.18 2,031.24 2,555.53 4,110.38 10,889.17
2031-32 1,191.85 1,111.31 2,031.24 2,555.53 4,403.98 11,293.90
2032-33 1,191.85 1,111.31 2,031.24 2,555.53 4,403.98 11,293.90
2033-34 1,191.85 1,111.31 2,031.24 2,555.53 4,403.98 11,293.90
2034-35 1,191.85 1,111.31 2,031.24 2,555.53 4,403.98 11,293.90
2035-36 1,191.85 1,111.31 2,031.24 2,555.53 4,403.98 11,293.90
2036-37 1,191.85 1,111.31 2,031.24 2,555.53 4,403.98 11,293.90
2037-38 1,191.85 1,111.31 2,031.24 2,555.53 4,403.98 11,293.90
2038-39 1,191.85 1,111.31 2,031.24 2,555.53 4,403.98 11,293.90
2039-40 1,191.85 1,111.31 2,031.24 2,555.53 4,403.98 11,293.90
2040-41 1,191.85 1,111.31 2,031.24 2,555.53 4,403.98 11,293.90
2041-42 1,191.85 1,111.31 2,031.24 2,555.53 4,403.98 11,293.90
2042-43 1,191.85 1,111.31 2,031.24 2,555.53 4,403.98 11,293.90
2043-44 1,191.85 1,111.31 2,031.24 2,555.53 4,403.98 11,293.90
2044-45 1,191.85 1,111.31 2,031.24 2,555.53 4,403.98 11,293.90
2045-46 1,191.85 1,111.31 2,031.24 2,555.53 4,403.98 11,293.90
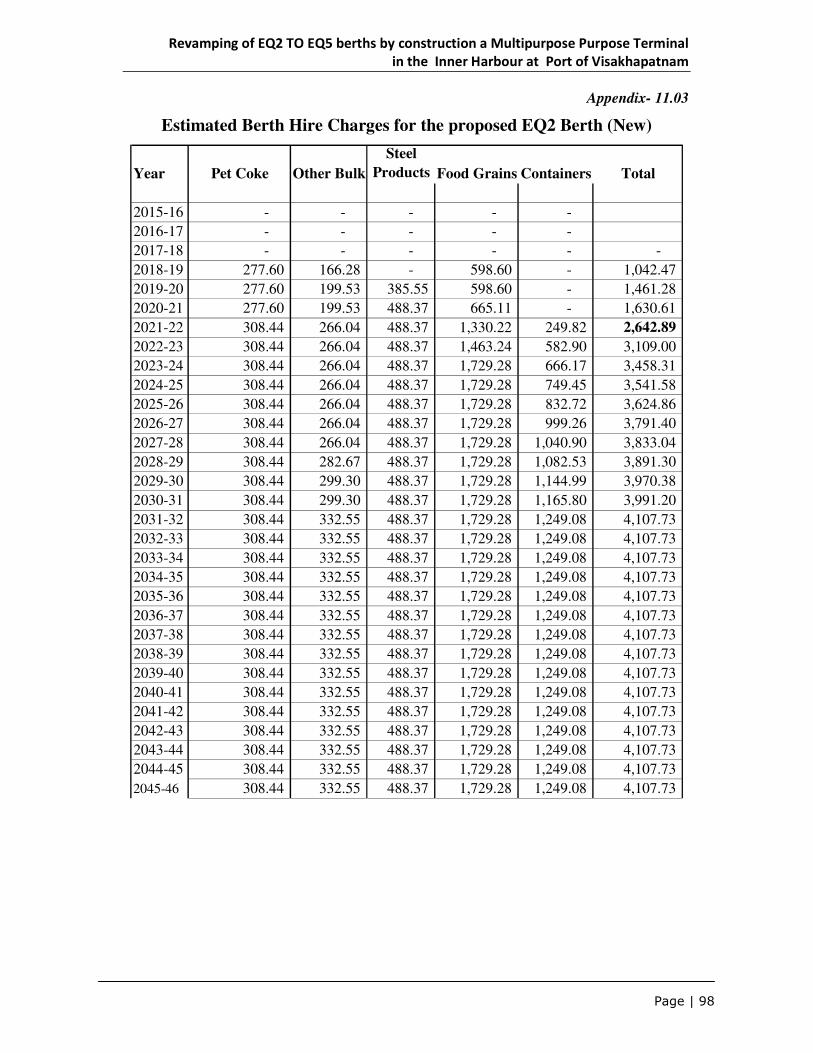
Revamping of EQ2 TO EQ5 berths by construction a Multipurpose Purpose Terminal
in the Inner Harbour at Port of Visakhapatnam
Page | 98
Appendix- 11.03
Estimated Berth Hire Charges for the proposed EQ2 Berth (New)
Year Pet Coke Other Bulk
Steel
Products Food Grains Containers Total
2015-16 - - - - -
2016-17 - - - - -
2017-18 - - - - - -
2018-19 277.60 166.28 - 598.60 - 1,042.47
2019-20 277.60 199.53 385.55 598.60 - 1,461.28
2020-21 277.60 199.53 488.37 665.11 - 1,630.61
2021-22 308.44 266.04 488.37 1,330.22 249.82 2,642.89
2022-23 308.44 266.04 488.37 1,463.24 582.90 3,109.00
2023-24 308.44 266.04 488.37 1,729.28 666.17 3,458.31
2024-25 308.44 266.04 488.37 1,729.28 749.45 3,541.58
2025-26 308.44 266.04 488.37 1,729.28 832.72 3,624.86
2026-27 308.44 266.04 488.37 1,729.28 999.26 3,791.40
2027-28 308.44 266.04 488.37 1,729.28 1,040.90 3,833.04
2028-29 308.44 282.67 488.37 1,729.28 1,082.53 3,891.30
2029-30 308.44 299.30 488.37 1,729.28 1,144.99 3,970.38
2030-31 308.44 299.30 488.37 1,729.28 1,165.80 3,991.20
2031-32 308.44 332.55 488.37 1,729.28 1,249.08 4,107.73
2032-33 308.44 332.55 488.37 1,729.28 1,249.08 4,107.73
2033-34 308.44 332.55 488.37 1,729.28 1,249.08 4,107.73
2034-35 308.44 332.55 488.37 1,729.28 1,249.08 4,107.73
2035-36 308.44 332.55 488.37 1,729.28 1,249.08 4,107.73
2036-37 308.44 332.55 488.37 1,729.28 1,249.08 4,107.73
2037-38 308.44 332.55 488.37 1,729.28 1,249.08 4,107.73
2038-39 308.44 332.55 488.37 1,729.28 1,249.08 4,107.73
2039-40 308.44 332.55 488.37 1,729.28 1,249.08 4,107.73
2040-41 308.44 332.55 488.37 1,729.28 1,249.08 4,107.73
2041-42 308.44 332.55 488.37 1,729.28 1,249.08 4,107.73
2042-43 308.44 332.55 488.37 1,729.28 1,249.08 4,107.73
2043-44 308.44 332.55 488.37 1,729.28 1,249.08 4,107.73
2044-45 308.44 332.55 488.37 1,729.28 1,249.08 4,107.73
2045-46 308.44 332.55 488.37 1,729.28 1,249.08 4,107.73

Revamping of EQ2 TO EQ5 berths by construction a Multipurpose Purpose Terminal
in the Inner Harbour at Port of Visakhapatnam
Page | 99
CHAPTER 12
VIABILITY AND
SENSITIVITY ANALYSIS
12.1 The financial viability has been done for the entire multipurpose terminal of 560
meters constructed after demolishing the existing EQ2 to EQ5 berths and installation,
operati0n & maintenance of equipment for cargo handling by a private operator on PPP
mode, duly reckoning 30 years concession period from the date of Concession. Sensitivity
analysis has also been carried out to gauge the impact of increase in cost and reduction of
revenue earnings on the viability of the proposal. The results of the analysis are presented
below. (Annexure-12.01)
Sl. No. Scenario IRR (%)
1 Base case 12.63
2 Capital Cost up by 10% 11.46
3 Revenue down by 10% 11.76
4 Annual O&M Cost up by 10% 10.43
5 Combined effect of Sl. no. 2, 3 & 4 8.47
12.2 The above indicates the project is not highly viable to attract private investment.
However, if the private operator is able attract more volumes of cargo than projected in this
report through his marketing efforts and strategies the project may become more viable. The
viability of the project will be further prospective, in the event PPP operator achieves the
productivity norms and eligible for 15% productivity increase in tariff over the notified tariff.
12.3 In view of the above scenario, if operator is provided with Viability Gap Funding
(VGF) at the rate of 20% of the Capital cost as per the prevalent procedures, the viability of
the project will be as follows.
Sl. No. Scenario IRR (%) With VGF
20% of capital cost
1 Base case 14.22
2 Capital Cost up by 10% 13.04
3 Revenue down by 10% 13.31
4 Annual O&M Cost up by 10% 11.98
5 Combined effect of Sl. no. 2, 3 & 4 10.00
The cash flow analysis with viability gap funding is attached herewith (Annexure 12.02).

Revamping of EQ2 TO EQ5 berths by construction a Multipurpose Purpose Terminal
in the Inner Harbour at Port of Visakhapatnam
Page | 100
12.4 Alternately, if the port undertakes the construction of the berth from the internal
resources duly entrusting terminal operations viz installation, operating and maintenance of
equipment for cargo handling to a private operator on PPP mode, the pre-tax project IRR is as
follows.
Sl. No. Scenario IRR (%)
Port
Investment
IRR (%)
Operator
Investment
1 Base case 13.38 12.30
2 Capital Cost up by 10% 12.18 11.20
3 Revenue down by 10% 13.22 10.87
4 Annual O&M Cost up by 10% 11.89 9.59
5 Combined effect of Sl. no. 2, 3 & 4 10.61 7.11
12.5 Cash flow statement for the above analysis is given at Appendix-12.03 and 12.04
respectively.
12.6. The above table indicates that the viability for the private operator to take up only the
operation is slightly better than the earlier option.
12.7. In this connection , it is to be noted that the above exercise of arriving at the financial
viability under two options are based on the tariff approximately worked out on the basis of
TAMP 2008 Guidelines. However, the tariff could also be based on reference tariff as per
TAMP 2013 Guidelines. This aspect has also been examined and the findings are furnished
below.
An examination of tariff fixed by TAMP in the recent period for multipurpose cargo berths
were carried out. It is found that similarity exists between this proposed project and the multi
cargo berth of Paradip Port Trust (PPT). A comparative picture is given below.
Sl.
no.
Commodities of PPT
Project / (Output
Rates)
Commodities of VPT
Project / (Output Rates)
Commodities of KPT
Projects as originally
based for Ref Tariff
Ref Tariff Rate
notified for PPT
in Mar 14
(i). Iron & Steel products (4000 TPD)
Iron & Steel products ( 6000 TPD )
Steel and Bagged cargo (4000 TPD)
Rs.447.25/MT
(ii). Pig Iron (4505 TPD)
Other dry bulk ( 25000 TPD )
Other dry bulk (4505 TPD)
Rs.397.32/MT
(ii). Food Grains (10000 TPD)
Food Grains ( 12500 TPD )
Food grains & Fertilisers (10000 TPD)
Rs.238.65/MT
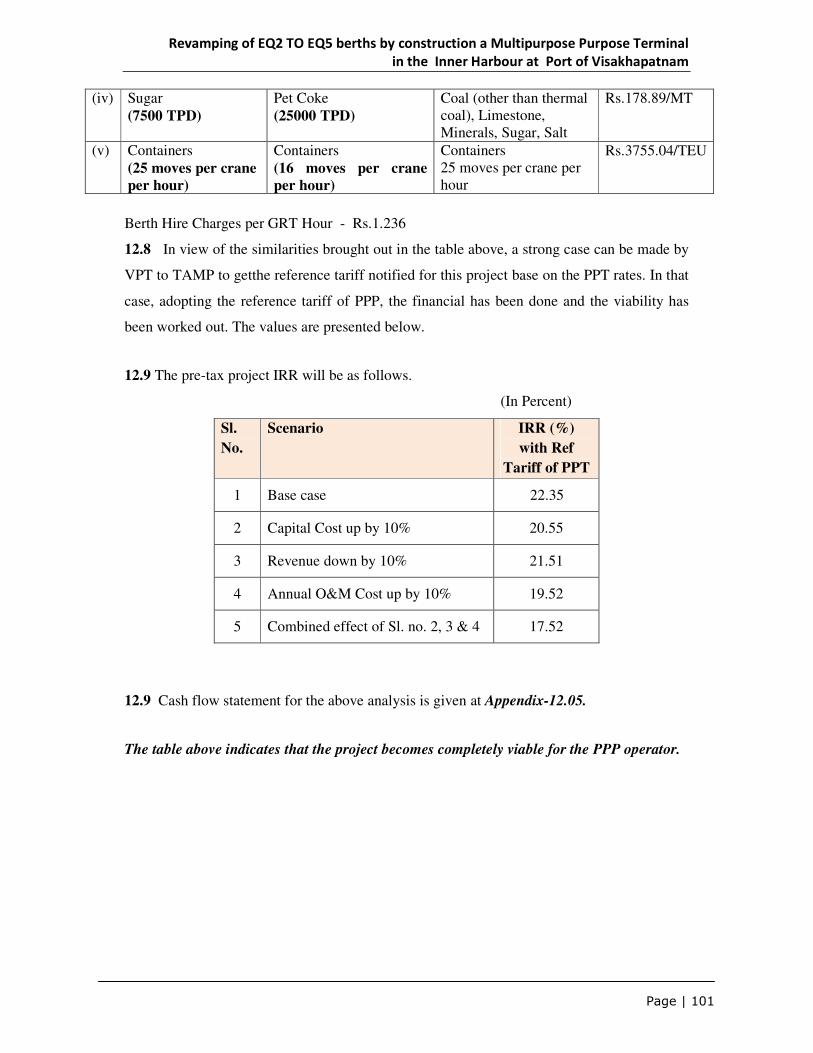
Revamping of EQ2 TO EQ5 berths by construction a Multipurpose Purpose Terminal
in the Inner Harbour at Port of Visakhapatnam
Page | 101
(iv) Sugar (7500 TPD)
Pet Coke (25000 TPD)
Coal (other than thermal coal), Limestone, Minerals, Sugar, Salt
Rs.178.89/MT
(v) Containers (25 moves per crane
per hour)
Containers (16 moves per crane
per hour)
Containers 25 moves per crane per hour
Rs.3755.04/TEU
Berth Hire Charges per GRT Hour - Rs.1.236
12.8 In view of the similarities brought out in the table above, a strong case can be made by
VPT to TAMP to getthe reference tariff notified for this project base on the PPT rates. In that
case, adopting the reference tariff of PPP, the financial has been done and the viability has
been worked out. The values are presented below.
12.9 The pre-tax project IRR will be as follows.
(In Percent)
Sl.
No.
Scenario IRR (%)
with Ref
Tariff of PPT
1 Base case 22.35
2 Capital Cost up by 10% 20.55
3 Revenue down by 10% 21.51
4 Annual O&M Cost up by 10% 19.52
5 Combined effect of Sl. no. 2, 3 & 4 17.52
12.9 Cash flow statement for the above analysis is given at Appendix-12.05.
The table above indicates that the project becomes completely viable for the PPP operator.
Revamping of EQ2 TO EQ5 berths by construction a Multipurpose Purpose Terminal
in the Inner Harbour at Port of Visakhapatnam
Page | 102
ANNEXURE 12.01
(Rs. In lakhs)
YEAR CAPITAL ANNUAL TOTAL REVENUE NET
COST O&M COST EARNINGS BENEFITSCAPITAL ANNUAL REVENUE COMBINED
COST COST O&M COST EFFECT
(+) 10% (+)10% (-)10% OF ALL
2016-17 4083.50 263.45 4346.95 -4346.95 -4755.30 -4373.30 -4346.95 -4781.65
2017-18 19628.95 263.45 19892.39 -19892.39 -21855.29 -19918.74 -19892.39 -21881.63
2018-19 7018.57 2822.15 9840.72 3555.40 -6285.33 -6987.18 -6567.54 -6640.87 -7624.94
2019-20 4056.92 3155.00 7211.92 5688.95 -1522.97 -1928.67 -1838.47 -2091.87 -2813.06
2020-21 14874.41 3191.08 18065.49 6384.19 -11681.30 -13168.74 -12000.41 -12319.72 -14126.27
2021-22 4085.46 4776.52 8861.98 9601.61 739.63 331.09 261.98 -220.53 -1106.73
2022-23 0.00 4861.15 4861.15 11438.69 6577.55 6577.55 6091.43 5433.68 4947.56
2023-24 4918.91 4918.91 12474.76 7555.86 7555.86 7063.97 6308.38 5816.49
2024-25 4934.84 4934.84 12851.63 7916.80 7916.80 7423.32 6631.64 6138.15
2025-26 4950.76 4950.76 13228.51 8277.74 8277.74 7782.66 6954.89 6459.81
2026-27 1005.00 4982.62 5987.62 13982.25 7994.63 7894.13 7496.36 6596.40 5997.64
2027-28 4990.58 4990.58 14170.68 9180.10 9180.10 8681.04 7763.03 7263.97
2028-29 380.00 5007.17 5387.17 14431.31 9044.14 9006.14 8543.42 7601.01 7062.29
2029-30 5027.74 5027.74 14786.15 9758.41 9758.41 9255.64 8279.80 7777.02
2030-31 5031.73 5031.73 14880.37 9848.65 9848.65 9345.47 8360.61 7857.44
2031-32 115.00 5064.90 5179.90 15401.63 10221.73 10210.23 9715.24 8681.56 8163.57
2032-33 5064.90 5064.90 15401.63 10336.73 10336.73 9830.24 8796.56 8290.07
2033-34 5064.90 5064.90 15401.63 10336.73 10336.73 9830.24 8796.56 8290.07
2034-35 1005.00 5064.90 6069.90 15401.63 9331.73 9231.23 8825.24 7791.56 7184.57
2035-36 5064.90 5064.90 15401.63 10336.73 10336.73 9830.24 8796.56 8290.07
2036-37 100.00 5064.90 5164.90 15401.63 10236.73 10226.73 9730.24 8696.56 8180.07
2037-38 5064.90 5064.90 15401.63 10336.73 10336.73 9830.24 8796.56 8290.07
2038-39 12465.00 5064.90 17529.90 15401.63 -2128.27 -3374.77 -2634.76 -3668.44 -5421.43
2039-40 5064.90 5064.90 15401.63 10336.73 10336.73 9830.24 8796.56 8290.07
2040-41 5064.90 5064.90 15401.63 10336.73 10336.73 9830.24 8796.56 8290.07
2041-42 6407.50 5064.90 11472.40 15401.63 3929.23 3288.48 3422.74 2389.06 1241.82
2042-43 1005.00 5064.90 6069.90 15401.63 9331.73 9231.23 8825.24 7791.56 7184.57
2043-44 5064.90 5064.90 15401.63 10336.73 10336.73 9830.24 8796.56 8290.07
2044-45 100.00 5064.90 5164.90 15401.63 10236.73 10226.73 9730.24 8696.56 8180.07
2045-46 5064.90 5064.90 15401.63 10336.73 10336.73 9830.24 8796.56 8290.07
Total 76330.31 135150.68 211480.99 378498.93 167017.95 159384.92 153502.88 129168.05 108019.96
NPV @12% 2046.26 (1874.32) (789.75) (4914.96) (11671.55)
IRR 12.63% 11.46% 11.76% 10.43% 8.47%
SENSITIVITY ANALYSIS
DEVELOPMENT OF MULTIPURPOSE TERMINAL AT VISAKHAPATNAM PORT TRUST
CASH FLOW STATEMENT FOR CALCULATION OF FIRR (PRE TAX PROJECT IRR)

Revamping of EQ2 TO EQ5 berths by construction a Multipurpose Purpose Terminal
in the Inner Harbour at Port of Visakhapatnam
Page | 103
ANNEXURE 12.02
With Viability Gap Funding (Rs. In lakhs)
YEAR CAPITAL ANNUAL TOTAL REVENUE NET
COST O&M COST EARNINGS BENEFITS CAPITAL ANNUAL REVENUECOMBINED
COST COST O&M COST EFFECT
(+) 10% (+)10% (-)10% OF ALL
2016-17 4083.50 263.45 4346.95 -4346.95 -4755.30 -4373.30 -4346.95 -4781.65
2017-18 19628.95 263.45 19892.39 -19892.39 -21855.29 -19918.74 -19892.39 -21881.63
2018-19 7018.57 2822.15 9840.72 3555.40 -6285.33 -6987.18 -6567.54 -6640.87 -7624.94
2019-20 4056.92 3155.00 7211.92 5688.95 -1522.97 -1928.67 -1838.47 -2091.87 -2813.06
2020-21 14874.41 3191.08 18065.49 6384.19 -11681.30 -13168.74 -12000.41 -12319.72 -14126.27
2021-22 4085.46 4776.52 8861.98 9601.61 739.63 331.09 261.98 -220.53 -1106.73
2022-23 -10749.56 4861.15 -5888.41 11438.69 17327.11 18402.06 16840.99 16183.24 16772.08
2023-24 4918.91 4918.91 12474.76 7555.86 7555.86 7063.97 6308.38 5816.49
2024-25 4934.84 4934.84 12851.63 7916.80 7916.80 7423.32 6631.64 6138.15
2025-26 4950.76 4950.76 13228.51 8277.74 8277.74 7782.66 6954.89 6459.81
2026-27 1005.00 4982.62 5987.62 13982.25 7994.63 7894.13 7496.36 6596.40 5997.64
2027-28 4990.58 4990.58 14170.68 9180.10 9180.10 8681.04 7763.03 7263.97
2028-29 380.00 5007.17 5387.17 14431.31 9044.14 9006.14 8543.42 7601.01 7062.29
2029-30 5027.74 5027.74 14786.15 9758.41 9758.41 9255.64 8279.80 7777.02
2030-31 5031.73 5031.73 14880.37 9848.65 9848.65 9345.47 8360.61 7857.44
2031-32 115.00 5064.90 5179.90 15401.63 10221.73 10210.23 9715.24 8681.56 8163.57
2032-33 5064.90 5064.90 15401.63 10336.73 10336.73 9830.24 8796.56 8290.07
2033-34 5064.90 5064.90 15401.63 10336.73 10336.73 9830.24 8796.56 8290.07
2034-35 1005.00 5064.90 6069.90 15401.63 9331.73 9231.23 8825.24 7791.56 7184.57
2035-36 5064.90 5064.90 15401.63 10336.73 10336.73 9830.24 8796.56 8290.07
2036-37 100.00 5064.90 5164.90 15401.63 10236.73 10226.73 9730.24 8696.56 8180.07
2037-38 5064.90 5064.90 15401.63 10336.73 10336.73 9830.24 8796.56 8290.07
2038-39 12465.00 5064.90 17529.90 15401.63 -2128.27 -3374.77 -2634.76 -3668.44 -5421.43
2039-40 5064.90 5064.90 15401.63 10336.73 10336.73 9830.24 8796.56 8290.07
2040-41 5064.90 5064.90 15401.63 10336.73 10336.73 9830.24 8796.56 8290.07
2041-42 6407.50 5064.90 11472.40 15401.63 3929.23 3288.48 3422.74 2389.06 1241.82
2042-43 1005.00 5064.90 6069.90 15401.63 9331.73 9231.23 8825.24 7791.56 7184.57
2043-44 5064.90 5064.90 15401.63 10336.73 10336.73 9830.24 8796.56 8290.07
2044-45 100.00 5064.90 5164.90 15401.63 10236.73 10226.73 9730.24 8696.56 8180.07
2045-46 5064.90 5064.90 15401.63 10336.73 10336.73 9830.24 8796.56 8290.07
Total 65580.75 135150.68 200731.42 378498.93 177767.51 171209.43 164252.44 139917.62 119844.47
NPV @12% 6908.82 3474.49 4072.80 (52.40) (6322.74)
IRR 14.22% 13.04% 13.31% 11.98% 10.00%
DEVELOPMENT OF MULTIPURPOSE TERMINAL AT VISAKHAPATNAM PORT TRUST
CASH FLOW STATEMENT FOR CALCULATION OF FIRR (PRE TAX PROJECT IRR)
SENSITIVITY ANALYSIS
Revamping of EQ2 TO EQ5 berths by construction a Multipurpose Purpose Terminal
in the Inner Harbour at Port of Visakhapatnam
Page | 104
ANNEXURE 12.03
FINANCIAL IRR FOR PORT INVESTMENT (Rs. In lakhs)
YEAR CAPITAL ANNUAL TOTAL REVENUE NET
COST O&M COST EARNINGSBENEFITSCAPITAL ANNUAL REVENUE COMBINED
COST COST O&M COST EFFECT
(+) 10% (+)10% (-)10% OF ALL
Berth constructed by Port and handing operation under PPP mode
2016-17 4083.50 0.00 4083.50 -4083.50 -4491.85 -4083.50 -4083.50 -4491.85
2017-18 8167.01 0.00 8167.01 -8167.01 -8983.71 -8167.01 -8167.01 -8983.71
2018-19 1361.17 246.45 1607.62 1323.76 -283.86 -419.97 -308.50 -416.23 -576.99
2019-20 4056.92 246.45 4303.37 1855.58 -2447.79 -2853.49 -2472.44 -2633.35 -3063.69
2020-21 8113.85 246.45 8360.30 2070.59 -6289.70 -7101.09 -6314.35 -6496.76 -7332.79
2021-22 1352.31 492.90 1845.20 3356.01 1510.80 1375.57 1461.52 1175.20 990.68
2022-23 492.90 492.90 3947.89 3454.99 3454.99 3405.70 3060.20 3010.91
2023-24 492.90 492.90 4391.46 3898.56 3898.56 3849.27 3459.41 3410.12
2024-25 492.90 492.90 4497.20 4004.30 4004.30 3955.01 3554.58 3505.29
2025-26 492.90 492.90 4602.94 4110.04 4110.04 4060.75 3649.75 3600.46
2026-27 492.90 492.90 4814.42 4321.52 4321.52 4272.23 3840.08 3790.79
2027-28 492.90 492.90 4867.29 4374.39 4374.39 4325.10 3887.66 3838.37
2028-29 492.90 492.90 4941.27 4448.38 4448.38 4399.09 3954.25 3904.96
2029-30 492.90 492.90 5041.69 4548.80 4548.80 4499.51 4044.63 3995.34
2030-31 492.90 492.90 5068.13 4575.23 4575.23 4525.94 4068.42 4019.13
2031-32 492.90 492.90 5216.10 4723.20 4723.20 4673.91 4201.59 4152.30
2032-33 492.90 492.90 5216.10 4723.20 4723.20 4673.91 4201.59 4152.30
2033-34 492.90 492.90 5216.10 4723.20 4723.20 4673.91 4201.59 4152.30
2034-35 492.90 492.90 5216.10 4723.20 4723.20 4673.91 4201.59 4152.30
2035-36 492.90 492.90 5216.10 4723.20 4723.20 4673.91 4201.59 4152.30
2036-37 492.90 492.90 5216.10 4723.20 4723.20 4673.91 4201.59 4152.30
2037-38 492.90 492.90 5216.10 4723.20 4723.20 4673.91 4201.59 4152.30
2038-39 492.90 492.90 5216.10 4723.20 4723.20 4673.91 4201.59 4152.30
2039-40 492.90 492.90 5216.10 4723.20 4723.20 4673.91 4201.59 4152.30
2040-41 492.90 492.90 5216.10 4723.20 4723.20 4673.91 4201.59 4152.30
2041-42 492.90 492.90 5216.10 4723.20 4723.20 4673.91 4201.59 4152.30
2042-43 492.90 492.90 5216.10 4723.20 4723.20 4673.91 4201.59 4152.30
2043-44 492.90 492.90 5216.10 4723.20 4723.20 4673.91 4201.59 4152.30
2044-45 492.90 492.90 5216.10 4723.20 4723.20 4673.91 4201.59 4152.30
2045-46 492.90 492.90 5216.10 4723.20 4723.20 4673.91 4201.59 4152.30
Total 27134.76 13061.77 40196.53 129019.71 88823.18 86109.70 87517.00 75921.20 71901.55
NPV @12% 2215.29 315.99 1948.74 (172.08) (2337.92)
IRR 13.38% 12.18% 13.22% 11.89% 10.61%
DEVELOPMENT OF MULTIPURPOSE TERMINAL AT VISAKHAPATNAM PORT TRUST
CASH FLOW STATEMENT FOR CALCULATION OF FIRR (PRE TAX PROJECT IRR)
SENSITIVITY ANALYSIS

Revamping of EQ2 TO EQ5 berths by construction a Multipurpose Purpose Terminal
in the Inner Harbour at Port of Visakhapatnam
Page | 105
ANNEXURE 12.04
FINANCIAL IRR FOR PRIVATE INVESTMENT (Rs. In lakhs)
YEAR CAPITAL ANNUAL TOTAL REVENUE NET
COST O&M COST EARNINGSBENEFITSCAPITAL ANNUAL REVENUECOMBINED
COST COST O&M COST EFFECT
(+) 10% (+)10% (-)10% OF ALL
Berth constructed by Port and handing operation under PPP mode
2016-17 0.00 263.45 263.45 -263.45 -263.45 -289.79 -263.45 -289.79
2017-18 11321.10 263.45 11584.55 -11584.55 -12716.66 -11610.89 -11584.55 -12743.00
2018-19 5657.40 2455.63 8113.03 2125.55 -5987.48 -6553.22 -6233.04 -6200.03 -7011.33
2019-20 2788.47 2788.47 3676.87 888.40 888.40 609.55 520.71 241.87
2020-21 6619.73 2824.56 9444.28 4138.23 -5306.05 -5968.02 -5588.50 -5719.87 -6664.30
2021-22 2733.15 3985.05 6718.20 5992.20 -726.00 -999.31 -1124.50 -1325.22 -1997.04
2022-23 0.00 4069.68 4069.68 7217.76 3148.08 3148.08 2741.11 2426.30 2019.34
2023-24 4127.44 4127.44 7783.42 3655.99 3655.99 3243.24 2877.64 2464.90
2024-25 4143.36 4143.36 8052.77 3909.41 3909.41 3495.07 3104.13 2689.79
2025-26 4159.29 4159.29 8322.12 4162.83 4162.83 3746.90 3330.62 2914.69
2026-27 1005.00 4191.15 5196.15 8860.82 3664.67 3564.17 3245.55 2778.59 2258.97
2027-28 4199.11 4199.11 8995.49 4796.38 4796.38 4376.47 3896.83 3476.92
2028-29 280.00 4215.70 4495.70 9179.68 4683.98 4655.98 4262.41 3766.01 3316.44
2029-30 4236.27 4236.27 9431.20 5194.93 5194.93 4771.31 4251.81 3828.19
2030-31 4240.25 4240.25 9498.54 5258.29 5258.29 4834.26 4308.43 3884.41
2031-32 4273.43 4273.43 9866.92 5593.49 5593.49 5166.14 4606.79 4179.45
2032-33 4273.43 4273.43 9866.92 5593.49 5593.49 5166.14 4606.79 4179.45
2033-34 4273.43 4273.43 9866.92 5593.49 5593.49 5166.14 4606.79 4179.45
2034-35 1005.00 4273.43 5278.43 9866.92 4588.49 4487.99 4161.14 3601.79 3073.95
2035-36 4273.43 4273.43 9866.92 5593.49 5593.49 5166.14 4606.79 4179.45
2036-37 4273.43 4273.43 9866.92 5593.49 5593.49 5166.14 4606.79 4179.45
2037-38 4273.43 4273.43 9866.92 5593.49 5593.49 5166.14 4606.79 4179.45
2038-39 7665.00 4273.43 11938.43 9866.92 -2071.51 -2838.01 -2498.86 -3058.21 -4252.05
2039-40 4273.43 4273.43 9866.92 5593.49 5593.49 5166.14 4606.79 4179.45
2040-41 4273.43 4273.43 9866.92 5593.49 5593.49 5166.14 4606.79 4179.45
2041-42 3832.50 4273.43 8105.93 9866.92 1760.99 1377.74 1333.64 774.29 -36.30
2042-43 1005.00 4273.43 5278.43 9866.92 4588.49 4487.99 4161.14 3601.79 3073.95
2043-44 4273.43 4273.43 9866.92 5593.49 5593.49 5166.14 4606.79 4179.45
2044-45 4273.43 4273.43 9866.92 5593.49 5593.49 5166.14 4606.79 4179.45
2045-46 4273.43 4273.43 9866.92 5593.49 5593.49 5166.14 4606.79 4179.45
Total 41123.88 114264.29 155388.17 241278.40 85890.23 81777.85 74463.80 61762.39 46223.58
NPV @12% 515.70 (1431.96) (1897.89) (3897.12) (8258.38)
IRR 12.30% 11.20% 10.87% 9.59% 7.11%
DEVELOPMENT OF MULTIPURPOSE TERMINAL AT VISAKHAPATNAM PORT TRUST
CASH FLOW STATEMENT FOR CALCULATION OF FIRR (PRE TAX PROJECT IRR)
SENSITIVITY ANALYSIS

Revamping of EQ2 TO EQ5 berths by construction a Multipurpose Purpose Terminal
in the Inner Harbour at Port of Visakhapatnam
Page | 106
ANNEXURE 12.05
(Rs. In lakhs)
YEAR CAPITAL ANNUAL TOTAL REVENUE NET
COST O&M COST EARNINGSBENEFITSCAPITAL ANNUAL REVENUECOMBINED
COST COST O&M COST EFFECT
(+) 10% (+)10% (-)10% OF ALL
2016-17 4083.50 263.45 4346.95 -4346.95 -4755.30 -4373.30 -4346.95 -4781.65
2017-18 19628.95 263.45 19892.39 -19892.39 -21855.29 -19918.74 -19892.39 -21881.63
2018-19 7018.57 2822.15 9840.72 6843.52 -2997.21 -3699.06 -3279.42 -3681.56 -4665.63
2019-20 4056.92 3155.00 7211.92 9041.22 1829.30 1423.60 1513.80 925.17 203.98
2020-21 14874.41 3191.08 18065.49 9820.65 -8244.84 -9732.28 -8563.95 -9226.90 -11033.45
2021-22 4085.46 4776.52 8861.98 15029.78 6167.81 5759.26 5690.16 4664.83 3778.63
2022-23 0.00 4861.15 4861.15 17008.40 12147.25 12147.25 11661.14 10446.41 9960.30
2023-24 4918.91 4918.91 18590.24 13671.33 13671.33 13179.44 11812.31 11320.42
2024-25 4934.84 4934.84 18929.58 13994.75 13994.75 13501.26 12101.79 11608.30
2025-26 4950.76 4950.76 19268.92 14318.16 14318.16 13823.08 12391.27 11896.19
2026-27 1005.00 4982.62 5987.62 19947.60 13959.98 13859.48 13461.72 11965.22 11366.46
2027-28 4990.58 4990.58 20117.27 15126.69 15126.69 14627.63 13114.96 12615.90
2028-29 380.00 5007.17 5387.17 20506.78 15119.61 15081.61 14618.89 13068.93 12530.21
2029-30 5027.74 5027.74 20981.12 15953.38 15953.38 15450.61 13855.27 13352.49
2030-31 5031.73 5031.73 21065.96 16034.23 16034.23 15531.06 13927.64 13424.47
2031-32 115.00 5064.90 5179.90 21844.97 16665.07 16653.57 16158.58 14480.57 13962.58
2032-33 5064.90 5064.90 21844.97 16780.07 16780.07 16273.58 14595.57 14089.08
2033-34 5064.90 5064.90 21844.97 16780.07 16780.07 16273.58 14595.57 14089.08
2034-35 1005.00 5064.90 6069.90 21844.97 15775.07 15674.57 15268.58 13590.57 12983.58
2035-36 5064.90 5064.90 21844.97 16780.07 16780.07 16273.58 14595.57 14089.08
2036-37 100.00 5064.90 5164.90 21844.97 16680.07 16670.07 16173.58 14495.57 13979.08
2037-38 5064.90 5064.90 21844.97 16780.07 16780.07 16273.58 14595.57 14089.08
2038-39 12465.00 5064.90 17529.90 21844.97 4315.07 3068.57 3808.58 2130.57 377.58
2039-40 5064.90 5064.90 21844.97 16780.07 16780.07 16273.58 14595.57 14089.08
2040-41 5064.90 5064.90 21844.97 16780.07 16780.07 16273.58 14595.57 14089.08
2041-42 6407.50 5064.90 11472.40 21844.97 10372.57 9731.82 9866.08 8188.07 7040.83
2042-43 1005.00 5064.90 6069.90 21844.97 15775.07 15674.57 15268.58 13590.57 12983.58
2043-44 5064.90 5064.90 21844.97 16780.07 16780.07 16273.58 14595.57 14089.08
2044-45 100.00 5064.90 5164.90 21844.97 16680.07 16670.07 16173.58 14495.57 13979.08
2045-46 5064.90 5064.90 21844.97 16780.07 16780.07 16273.58 14595.57 14089.08
Total 76330.31 135150.68 211480.99 544825.66 333344.67 325711.64 319829.60 278862.10 257714.01
NPV @12% 35392.00 31471.42 32555.99 25096.21 18339.61
IRR 22.35% 20.55% 21.51% 19.52% 17.12%
DEVELOPMENT OF MULTIPURPOSE TERMINAL AT VISAKHAPATNAM PORT TRUST
CASH FLOW STATEMENT FOR CALCULATION OF FIRR (PRE TAX PROJECT IRR)
SENSITIVITY ANALYSIS
i
EXECUTIVE SUMMARY
1. The proposal relates replace the existing EQ2 to EQ5 berths by constructing a
multipurpose terminal to cater to fully laden panamax vessels of 14 m draft to co-
terminus with this inner channel deepening project and deepening the inner harbour
berths to cater to 14 m draft vessels.
2. The underlying reasons for dismantling and reconstruction of EQ2 to EQ5 berths are
as follows;
a) To facilitate navigation of Panamax vessels by increasing the width of the basin. It
is estimated that port would be called upon to handle about 40 to 45 million
tonnes of bulk cargo at Inner Harbour berths. In the absence of this facility, it is
likely that port may lose traffic of about 5 to 5.5 million tonnes of traffic thus
losing its competitive edge.
b) If these berths are not dismantled, the port will not be able to fulfil its Contractual
obligations under PPP projects is to facilitate handling of Panamax vessels and
there will be a breach of contract.
c) These berths were built in 1933 and outlived their economic life, continuation of
cargo handling operations may be at the cost of safety and security.
3. The Traffic study reveals, about 26 percent of the cargo profile of the Port is liquid
cargo and the balance is dry cargo. The Northern arm of Inner Harbour mainly
handles dry cargo. Hence the study was confined to dry cargo traffic projections.
4. Based on the traffic projections, the proposed terminal is expected to handle total
cargo of 2.3 Million tonnes initially (on completion of Phase-I) comprising imported
pet coke including other dry bulk and food grains. On completion of phase-II, the
terminal is expected to handle total cargo of 4.45 Million tonnes by 2021-22, which is
expected to reach to 6.45 ultimately by 2031-32. The Cargo projections of the
proposed multipurpose terminal are as under.

ii
(in Lakhs tonnes)
CARGO 2018-19* 2019-20 2020-21 2021-22 2022-23 2026-27 2031-32
IMP petroleum coke 9(70) 9(70) 9(70) 10(80) 10(67) 10(67) 10 (67)
Other bulks incl. iron
ore imports and other
cargo
5(40) 6 6 8(64) 8(64) 8(64) 10 (67)
Steel product @
3 3.5 3.5 3.5 3.5 3.5
Food grains 9 9 10 20 22- 26- 26
Container cargo( after
exclusivity clause of
container terminal)
- 3
(20000
teu)
7
(50000
teu)
12
(70000
teu)
15
(1 lakh
Teu)
TOTAL 23 27 28.5 44.5
50.5
59.5
64.5
* 2018-19 is reckoned as the first year of operation
@A quantity of 3.7 lakh tonnes of STEEL PRODUCTS is reckoned for WQ6. Only Incremental
cargo is reckoned for the berth. By 2019, the exclusivity clause for WQ6 will be fulfilled.
5. A berth length of 280 m is required for the safe mooring and operation of the design
vessel with 230 m length. The remaining length of EQ-2 together with EQ-3 and EQ-
4 berths and a portion of EQ-5 berth (about 89m) are proposed to be merged for
developing a multipurpose terminal to cater to two vessels of each of 230m.
6. Harbour Mobile cranes are proposed for Harbour Mobile Cranes (HMC) for ship to
shore handling with grab attachments to handle bulk cargo viz. Pet Coke, Other bulk.
For handling steel products and containers, the same type of HMC will be adequate to
handle these two types of cargos with hook and spreader attachments.
7. For Shore clearance, dumpers and pay loaders are proposed for bulk cargoes, Fork
Lift Trucks (FLT) and mobile cranes are proposed for steel cargo and for container
handling, Rubber Tyred Gantry (RTG) cranes, tractor trailers and reach stackers are
proposed.
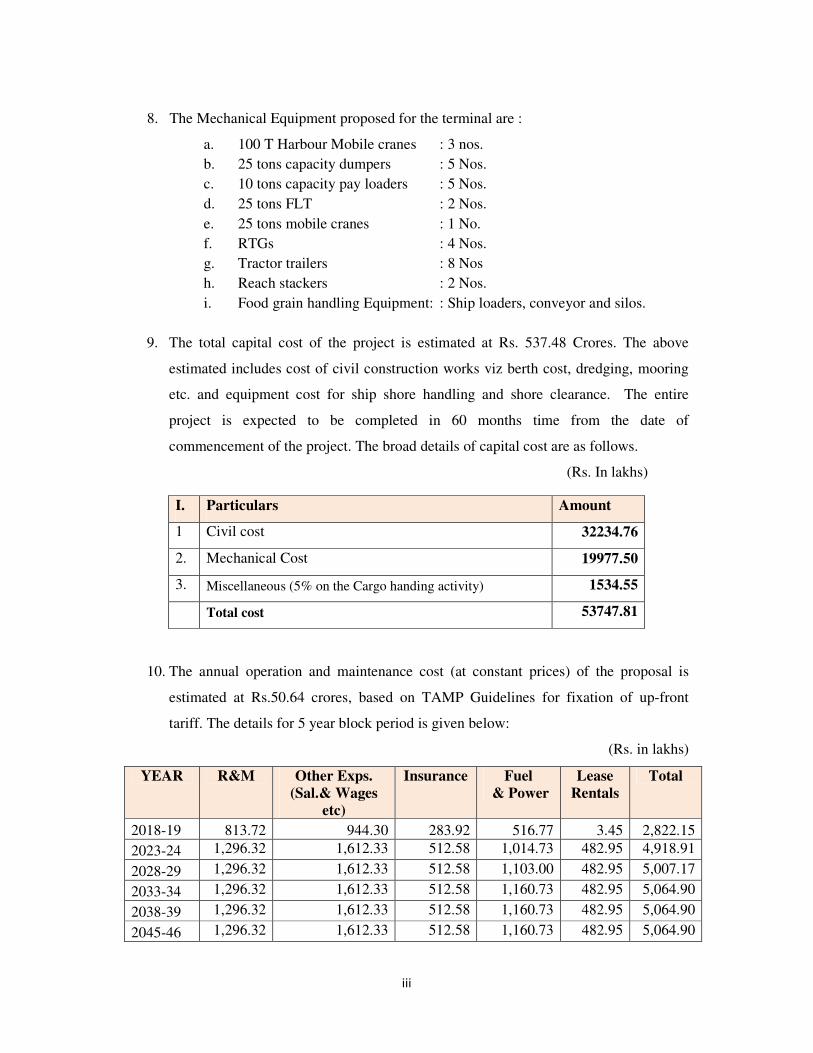
iii
8. The Mechanical Equipment proposed for the terminal are :
a. 100 T Harbour Mobile cranes : 3 nos.
b. 25 tons capacity dumpers : 5 Nos.
c. 10 tons capacity pay loaders : 5 Nos.
d. 25 tons FLT : 2 Nos.
e. 25 tons mobile cranes : 1 No.
f. RTGs : 4 Nos.
g. Tractor trailers : 8 Nos
h. Reach stackers : 2 Nos.
i. Food grain handling Equipment: : Ship loaders, conveyor and silos.
9. The total capital cost of the project is estimated at Rs. 537.48 Crores. The above
estimated includes cost of civil construction works viz berth cost, dredging, mooring
etc. and equipment cost for ship shore handling and shore clearance. The entire
project is expected to be completed in 60 months time from the date of
commencement of the project. The broad details of capital cost are as follows.
(Rs. In lakhs)
I. Particulars Amount
1 Civil cost 32234.76
2. Mechanical Cost 19977.50
3. Miscellaneous (5% on the Cargo handing activity) 1534.55
Total cost 53747.81
10. The annual operation and maintenance cost (at constant prices) of the proposal is
estimated at Rs.50.64 crores, based on TAMP Guidelines for fixation of up-front
tariff. The details for 5 year block period is given below:
(Rs. in lakhs)
YEAR R&M Other Exps.
(Sal.& Wages
etc)
Insurance Fuel
& Power
Lease
Rentals
Total
2018-19 813.72 944.30 283.92 516.77 3.45 2,822.15
2023-24 1,296.32 1,612.33 512.58 1,014.73 482.95 4,918.91
2028-29 1,296.32 1,612.33 512.58 1,103.00 482.95 5,007.17
2033-34 1,296.32 1,612.33 512.58 1,160.73 482.95 5,064.90
2038-39 1,296.32 1,612.33 512.58 1,160.73 482.95 5,064.90
2045-46 1,296.32 1,612.33 512.58 1,160.73 482.95 5,064.90
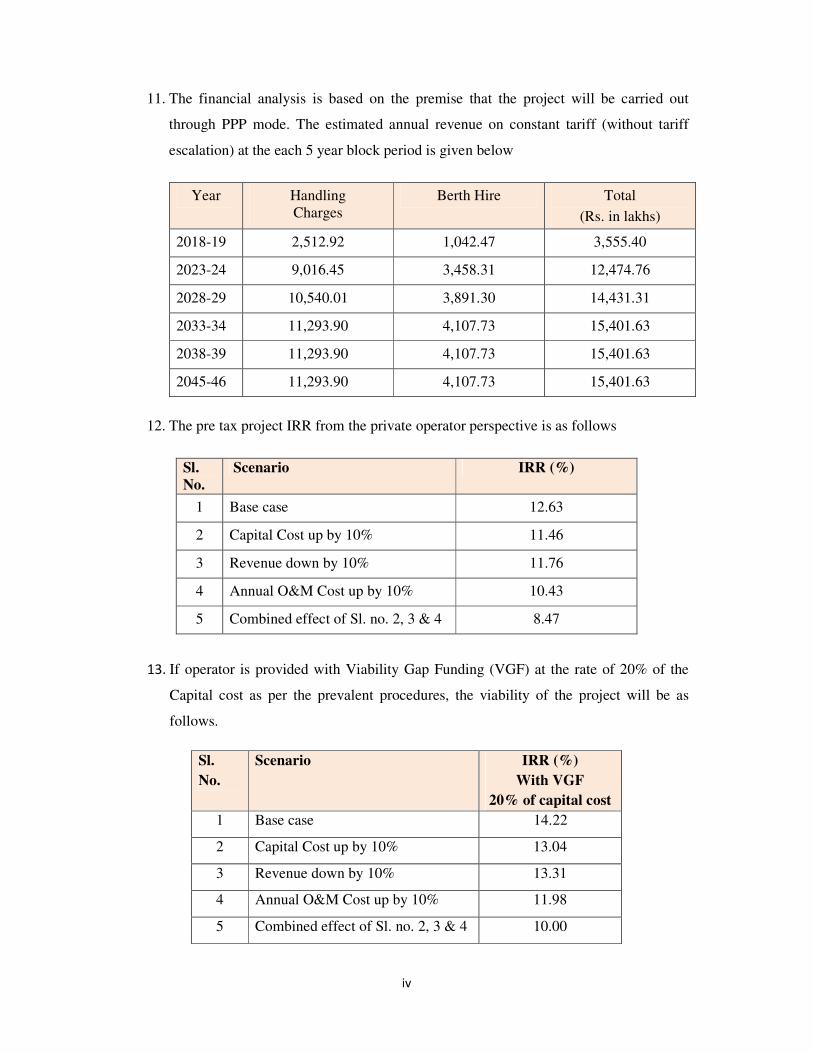
iv
11. The financial analysis is based on the premise that the project will be carried out
through PPP mode. The estimated annual revenue on constant tariff (without tariff
escalation) at the each 5 year block period is given below
Year Handling
Charges
Berth Hire Total
(Rs. in lakhs)
2018-19 2,512.92 1,042.47 3,555.40
2023-24 9,016.45 3,458.31 12,474.76
2028-29 10,540.01 3,891.30 14,431.31
2033-34 11,293.90 4,107.73 15,401.63
2038-39 11,293.90 4,107.73 15,401.63
2045-46 11,293.90 4,107.73 15,401.63
12. The pre tax project IRR from the private operator perspective is as follows
Sl.
No.
Scenario IRR (%)
1 Base case 12.63
2 Capital Cost up by 10% 11.46
3 Revenue down by 10% 11.76
4 Annual O&M Cost up by 10% 10.43
5 Combined effect of Sl. no. 2, 3 & 4 8.47
13. If operator is provided with Viability Gap Funding (VGF) at the rate of 20% of the
Capital cost as per the prevalent procedures, the viability of the project will be as
follows.
Sl.
No.
Scenario IRR (%)
With VGF
20% of capital cost
1 Base case 14.22
2 Capital Cost up by 10% 13.04
3 Revenue down by 10% 13.31
4 Annual O&M Cost up by 10% 11.98
5 Combined effect of Sl. no. 2, 3 & 4 10.00

v
14. Alternately, if the port undertakes the construction of the berth from the internal
resources duly entrusting terminal operations viz installation, operating and
maintenance of equipment for cargo handling to a private operator on PPP mode, the
pre-tax project IRR is as follows.
Sl.
No.
Pre-Tax Project IRR at
Constant prices
Port
Investment
(in percent)
Operator
Investment
(in percent)
1 Base case 13.38 12.30
2 Capital Cost up by 10% 12.18 11.20
3 Revenue down by 10% 13.22 10.87
4 Annual O&M Cost up by 10% 11.89 9.59
5 Combined effect of Sl. no. 2, 3 & 4 10.61 7.11
15. In view of the similarities of the project “ Development of Multi Cargo Terminal to
handle Clear cargo” at Paradip Port Trust (PPT) with the present proposed Tariff, a
strong case can be made by VPT to TAMP to get the reference tariff notified for this
project base on the PPT rates. In that case, adopting the reference tariff of PPP, the
financial has been done and the viability has been worked out. The values are
presented below.
(In Percent)
Sl.
No.
Pre-Tax Project IRR at
Constant prices
Total Project
PPP Mode
with Ref
Tariff of PPT
1 Base case 22.35
2 Capital Cost up by 10% 20.55
3 Revenue down by 10% 21.51
4 Annual O&M Cost up by 10% 19.52
5 Combined effect of Sl. no. 2, 3 & 4 17.52
* * *