
RETAILING IN TOUGH ECONOMIC TIMES: THE IMPACT...
36
1 RETAILING IN TOUGH ECONOMIC TIMES: THE IMPACT OF RECESSIONARY SHOCKS ON DISCOUNTERS’ SUCCESS MITCHEL VOSS TILBURG UNIVERSITY ACCOUNTANCY DEPARTMENT DATE OF COMPLETION: JUNE 20, 2016 Abstract: This paper investigates the link between the success of the rapidly growing US discount retail channel and business cycle fluctuations. It is examined whether discounters gain market share in economic contraction periods and whether these discounters permanently benefit from the occurrence of a crisis. Due to decreasing households’ disposable incomes in adverse economic conditions, this study hypothesizes that US consumers are more likely to shop in the price-aggressive discount outlets during recession periods. The “no-frills” format of discounters may not only be temporarily popular in contractions. Unchanged crisis-induced shopping behavior in post-recession periods may have a long-lasting impact on discounters’ success. Over the 1967-2014 period, a sample of US retailers is studied for the relationship between the US economic climate and discounters’ success. Principal component analysis, cluster analysis, and a business cycle filtering procedure are used to classify retailers according to their strategic approach and to subsequently determine the market shares of discounters. In line with the hypotheses, regression results indicate that the discount outlets gain market share during hard economic times and remain permanently popular after such a downswing. The successful discounters permanently capture market share from structurally ill-positioned traditional retailers. The findings clearly signal to conventional retailers that these companies should take firm action to avoid losing market share in recession and non-recession periods. Keywords: discount retailing, market share, traditional retailers, business cycles, time series econometrics 1. INTRODUCTION In the previous financial crisis that started in 2007 and reached a climax in 2008, several sectors in the economic system were severely hit. While the developments in the housing sector and
Transcript of RETAILING IN TOUGH ECONOMIC TIMES: THE IMPACT...

1
RETAILING IN TOUGH ECONOMIC TIMES:
THE IMPACT OF RECESSIONARY SHOCKS ON DISCOUNTERS’
SUCCESS
MITCHEL VOSS
TILBURG UNIVERSITY
ACCOUNTANCY DEPARTMENT
DATE OF COMPLETION: JUNE 20, 2016
Abstract: This paper investigates the link between the success of the rapidly growing US
discount retail channel and business cycle fluctuations. It is examined whether discounters gain
market share in economic contraction periods and whether these discounters permanently
benefit from the occurrence of a crisis. Due to decreasing households’ disposable incomes in
adverse economic conditions, this study hypothesizes that US consumers are more likely to
shop in the price-aggressive discount outlets during recession periods. The “no-frills” format
of discounters may not only be temporarily popular in contractions. Unchanged crisis-induced
shopping behavior in post-recession periods may have a long-lasting impact on discounters’
success. Over the 1967-2014 period, a sample of US retailers is studied for the relationship
between the US economic climate and discounters’ success. Principal component analysis,
cluster analysis, and a business cycle filtering procedure are used to classify retailers according
to their strategic approach and to subsequently determine the market shares of discounters. In
line with the hypotheses, regression results indicate that the discount outlets gain market share
during hard economic times and remain permanently popular after such a downswing. The
successful discounters permanently capture market share from structurally ill-positioned
traditional retailers. The findings clearly signal to conventional retailers that these companies
should take firm action to avoid losing market share in recession and non-recession periods.
Keywords: discount retailing, market share, traditional retailers, business cycles, time series
econometrics
1. INTRODUCTION
In the previous financial crisis that started in 2007 and reached a climax in 2008, several sectors
in the economic system were severely hit. While the developments in the housing sector and

2
the banking industry were probably the most noticeable events, the slump in the retail sector
has not gone unnoticed either. Salerno (2012) notes that the 2008 US retail sales decreased by
almost eleven percent compared to 2007. Data in other contraction periods does not show such
a large fall in retail sales as in the last economic downturn (Federal Reserve Bank of St. Louis
2010). In addition, Goodman and Mance (2011) and McCall (2011) observe that the previous
crisis was very damaging to US retail trade employment, with more than one million job losses.
However, bad economic conditions also offer opportunities for retailers. Deleersnyder,
Dekimpe, Steenkamp, and Koll (2007) indicate that discounters are better positioned in the
market than traditional retailers during an economic recession, when consumers watch their
pennies due to decreasing households’ disposable incomes. Walmart’s financial performance
in 2008 is an example that shows that discounters perform better than other more expensive
retailers in tough economic times. While the total US grocery sales declined in that crisis year,
the American low-cost retailer reported a significant sales increase (Williamson and Zeng
2009). Moreover, a study of Lamey (2014) points out that European discount groceries perform
better during economic contraction years and remain successful when the economy picks back
up. In addition, Lamey, Deleersnyder, Dekimpe, and Steenkamp (2007, 2012) show that
consumers are more likely to buy private-label brands in a recession, after which consumers do
not switch back to premium-priced national brands in a flourishing economy. These
observations suggest that consumers do not change their recession-induced shopping patterns
in post-crisis periods. The short- and long-term success of low-cost retailers is also discussed
in other qualitative research (Heerde, Gijsenberg, Dekimpe, and Steenkamp 2013; Little, Little,
and Coffee 2009; Little, Mortimer, Keene, and Henderson 2011; Zielke and Komor 2015).
This empirical study investigates two main issues: it will be examined (i) whether the
market shares of US discount retailers show temporary upward swings in crisis periods and
temporary downward swings in prosperous economic times (a counter-cyclical effect), and (ii)
whether these discounters remain permanently popular after recessionary shocks.
Consequently, the twofold research question that this paper addresses, is the following: to what
extent does the market share of US discount retailers evolve cyclically (counter-, pro- or a-
cyclically), and to what extent does the occurrence of a crisis have a long-lasting impact on the
US discounters’ market share? It is expected that discounters gain temporary market share in a
contraction period, due to more price-conscious consumers which can spend less money. These
market share gains of discounters are predicted to consolidate after economic downswings, due
to consumer’s crisis-induced shopping patterns which are not reversed in prosperous economic
times. In the little exposed academic area of discount retailing, this study extends literature by

3
(i) including more retail firms in the sample, (ii) covering multiple economic up- and
downswings in a longer period (1967-2014), (iii) analyzing performances of all types of US
retail stores, and (iv) investigating whether the occurrence of a recession has a long-lasting
impact on the popularity of low-cost retailers.
Over the 1967-2014 period, this paper uses a sample of US retailers to investigate the
relationship between the state of the US economy and discounters’ success. Principal
component analysis, cluster analysis, and the business cycle filtering procedure of Hodrick and
Prescott (1997) are performed to identify the group of discounters in the entire sample of US
retailers and to subsequently determine the quarterly market shares of discounters in the US
retail market. Regression results indicate that the “no-frills” format of discounters gains market
share during harsh economic times and shows a positive (average) sales growth in every quarter.
The results also reveal that the growth of the discounters’ market share in recessions is long-
lasting, in a way that the gained market share of discounters does not dissipate after
economically difficult times. Additional analyses show that the increasing popularity of low-
cost retailers leads to permanently diminishing market shares of structurally ill-positioned
retailers. With these research findings, this study enhance the understanding of the impact of
recessions on the retail business. It is clearly signaled to conventional retailers that losing
ground to discounters in economic downturns leads to permanently decreasing market shares
of these traditional companies. In order to avoid losing market share, firm action should be
taken by this retail segment in both recession and non-recession periods. Examples of actions
which can be taken by these middle-market retailers are extending aggressively priced private-
label lines, increasing marketing budgets, moving up or down in the strategy spectrum, and
creating and capturing uncontested market spaces.
The structure of the remainder of this paper is as follows. Section 2 reviews relevant
academic literature and develops the hypotheses. Section 3 and 4 describe the methodology and
the data collection, respectively. Section 5 documents and interprets the findings. The
conclusions are reported in section 6.
2. LITERATURE REVIEW AND HYPOTHESIS DEVELOPMENT
Firstly, this section provides an overview of existing business strategy research, with particular
attention to the discounters’ strategic approach in this literature (2.1). Then, hypotheses are
developed for the temporary effect of a contraction period on discounters’ success (2.2), as well
as the permanent effect of an economic downturn (2.3).

4
2.1 Discounters in the business strategy literature
Several business strategy frameworks exist in traditional management literature. Porter’s (1980)
model is best-known and most-cited for business-level strategies. The typologies in the studies
of March (1991), Miles and Snow (1978, 2003), and Treacy and Wiersema (1995) are used to
a lesser extent in academic research. Although all these different theoretical models assume
different strategy classifications, all frameworks have in common that organizations at both
ends of the strategy continuum are clearly identified. Porter (1980) finds a trio of generic
strategic approaches that gain sustainable competitive advantage, namely differentiation, cost
leadership and focus strategies. The focus strategy concerns the competitive scope (narrow or
niche segment) and is either based on differentiation or on cost leadership. It results in a
differentiation focus or a cost focus strategy. “Generic” refers to the fact that Porters’ model is
generalizable across different industries. Porter (1980) does not state that one of the three
generic strategic approaches is better than others. All three have equal chances of success in
outperforming the competition. In Porter’s framework, it is crucial that a firm makes a
fundamental choice which of the three strategies it is going to develop. Failing to make such a
choice leads to strategic mediocrity, whereby an unfavorable situation of “stuck in the middle”
arises (Morschett, Swoboda, and Schramm-Klein 2006). Below-average profitability is almost
guaranteed in this case.
When making a distinction between the differentiation and the cost leadership strategy,
retailers with a differentiation strategy aim to differentiate their products to achieve competitive
advantage. Brand management plays a crucial role in this strategy. After all, making customers
aware of the uniqueness of a differentiated product results in a price premium (Colla 1994).
Dent (1990) reports that other characteristic features of this strategic approach are decentralized
control systems, a relatively broad domain of products, and the focus on change and innovation.
Alternatively, a cost leadership strategy is focused on gaining sustainable competitive
advantage by offering products to customers at a lower cost than competitors. Cost efficiency
can be achieved through optimizing production processes, keeping overhead costs under tight
control, experience effects, making optimal use of economies of scale, and standardizing
products (Little et al. 2011). Standardization is achieved by removing peripheral advanced
features from a product. Focusing on the product key features, which are instrumental to the
perceived product performance, allows a discounter to price their “no-frills” products in an
aggressive manner (Deleersnyder et al. 2007).
Andersen and Poulfelt (2007) argue that the discounters’ combination of stripping
peripheral product features and focusing on essential features does not necessarily result in

5
declining perceived product performance. Just offering core products at discount prices may
even lead to an increasing price/quality measure perceived by customers (Anderson and Poulfelt
2007). Research of Kukar-Kinney and Carlson (2015) documents that the low prices for
qualitatively acceptable goods are the main characteristic of the discount retail format. For a
basket with comparable goods, price differences of around thirty per cent are observed between
discount outlets and traditional formats (Kukar-Kinney and Carlson 2015). While customers in
discount shops value this price level most, they accept both the absence of well-known brand
names and the relatively limited assortment in the shop (Colla, 2003). Moreover, Zurawicki and
Braidot (2005) note that the discounter’s basic and simple store layout does not only aim to
reduce costs and to keep selling prices low, but also aims to create spatial perception in the
shop. It contributes to the desired discounter’s store image, namely “low prices for satisfactory
quality” (Zurawicki and Braidot 2005).
2.2 Temporary effect: switching to discounters during recession periods
The US retail industry severely slumped in the previous financial crisis. The largest fall in retail
sales was observed in 2008, with an eleven percent decrease compared to 2007 (Salerno 2012).
In this period, more than one million people lost their jobs in the retail trade (Goodman and
Mance 2011). These observations illustrate that macro-economic developments have a
significant impact on retailers. The retail firms face challenging times in such economic
slowdowns, since consumer behavior in recessions turned out to be different from the behavior
of consumers in favorable economic times (Colla 1994). Therefore, having insight in
consumers’ shopping trends is crucial for all retailers in the market place.
One of the main trends during crisis periods is the decreasing ability of recession-hit
consumers to purchase goods. It is caused by an average decline in households’ disposable
income in these periods, which reduces the consumption budget (Stocks and Watson 1999).
Constraining expenditures or changing purchase habits are the two options which consumers
have in these situations (Lamey et al. 2007). Deleersnyder et al. (2004) show that buying
decisions are significantly affected by adverse economic conditions. These researchers report
that consumers mostly tend to save money on relatively expensive durables in recessions.
Purchases of these consumer durables are postponed until more stable economic conditions are
ahead. However, cutting back on the quantity of so-called frequently purchased consumer goods
(FPCG) is a less logical option for the majority of shoppers in a time of frugality (Kamakura
and Du 2012). Most of these non-durables, such as clothing and food, are necessary and

6
essential to buy. Kamakura and Du (2012) find that consumers are going to focus more on
prices then, in order to reduce total expenditures in FPCG categories. People’s behavior to
economize on prices partly explains the counter-cyclical popularity of lower-priced private-
label brands (Lamey et al. 2012). In addition, academic research shows that the price-conscious
consumers do not only want to improve price knowledge through a more thorough search for
price information, but also want to compare a particular product more carefully to its
alternatives (Lamey 2014).
Kukar-Kinney and Carlson (2015) document that discount retail formats set prices
thirty percent lower than conventional retailers for a shopping basket with comparable goods.
Given the increasing importance of the price attribute in consumers’ decision-making processes
during recessions, the observation of Kukar-Kinney and Carlson (2015) suggests that low-cost
retailers become more popular when the economy sours. Switching from traditional retailers to
price-aggressive discount stores namely results in a reduction of expenditures. Diminishing
confidence and trust in the economy also contribute to adjustments in buying behavior, and
consequently affect switching behavior (Ang, Leong, and Kotler 2000). Furthermore,
Deleersnyder et al. (2007) note that shoppers get out of their purchase habits more quickly and
drastically in times of a recession than in times of an expansion. Budget-conscious consumers
exhibit less inertia when making shopping decisions during adverse economic conditions
(Deleersnyder et al. 2007). As an example of this crisis phenomenon, González-Benito (2001)
finds that consumers become less loyal to brands and stores for making purchases in an
economic downswing. The recession-hit shoppers – characterized as multi-store shoppers –
simply hunt for bargains in stores with the lowest prices (González-Benito 2001).
Prior research indicates that consumers’ increasing focus on low prices and diminishing
consumer inertia during recessionary shocks have a positive impact on discounters’ popularity
in contraction periods. Therefore, the following hypothesis is formulated:
H1: US discounters’ market share behaves counter-cyclically, going up in recessions
and going down in economic expansions
2.3 Permanent effect: a positive long-lasting effect of recessions on discounters’ popularity
Once a crisis period is over and the economic climate starts to improve, it can be questioned
whether consumer behavior in the new situation is influenced by the adverse economic
conditions. Will consumers keep shopping in discount stores after an economic slowdown or
will they switch back to conventional retailers? It can be argued that post-recession consumers

7
are less incentivized to focus on low prices. That may lead to diminishing popularity of
discounters in economic expansions. However, recent observations demonstrate that low-cost
retailers continue to be successful in stable economic times. For instance, Dollar Three, Dollar
General, and Family Dollar – the three main (listed) US dollar stores – showed a steady sales
growth in the last decade (Dutt and Padmanabhan 2011). Net sales of the well-known American
discounter Walmart increased as well, from USD 404 billion in recovery year 2010 to USD 482
billion in 2015 (Walmart 2015).
The observed phenomenon that discounters are also successful in economic upswings
can be explained by the role of habits in the consumers’ decision-making process. The
formation of habits is discussed in a large body of academic literature (e.g., Christiano,
Eichenbaum, and Evans 2005; Fuhrer 2000). This research stream states that buying decisions
in a particular time period are influenced by buying decisions in the prior time period. These
correlated preferences apply to all kinds of products, both addictive and non-addictive products.
Several papers link the role of habit formation to the continued success story of discounters in
a flourishing economy. For example, Lamey (2014) and Rhee and Bell (2002) state that
consumers’ status quo affects the permanent discounters’ popularity. Shoppers become used to
do purchases in price-aggressive discount outlets during crisis periods and do not reverse this
recession-induced shopping pattern in prosperous economic times (Lamey 2014; Rhee and Bell
2002). In addition, Chou and Chen (2004) argue that the occurrence of a crisis “helped”
shoppers to gain a positive actual experience with the discount format. The shopping trips to
low-cost retailers in tough economic times positively contributed to consumers’ perceptions.
Shoppers learned that discount outlets offer lower-priced products of almost the same quality
compared to traditional retailers (Chou and Chen 2004). Actions of discounters may also affect
the shoppers’ perceptions. Marketing campaigns of both American and German low-cost
retailers in the past – especially aimed at consumers in the middle-class segment – were
intended to permanently remove the former discounters’ image of “cheap” and “low-quality”,
and to take away social stigma that was associated with visiting discount outlets (Zielke and
Komor 2015). Gijsbrechts et al. (2008) finds that shoppers do not attach great importance to the
discounters’ basic store-layout and the limited customer service. Only the absence of some
special goods in the discount outlets, such as local and “green” products, induces people to
switch to the traditional retail channel (Gijsbrechts et al. 2008).
The sharp increase in the number of discount outlets, as observed over the last decades,
also contributes to the discounters’ success story (Lamey 2014). This growing number makes
consumers permanently aware of the presence of the discount channel, while the mostly

8
convenient locations of the stores also make the discounters more accessible for consumers.
Consequently, low-cost retailers “do not fly under the radar any longer” (Lamey 2014). As an
example of the accelerated growth of discounters’ shops, the highly profitable Dutch low-cost
retailer Action has significantly increased the number of outlets in the Netherlands, at an
average annual rate of five percent over the last ten years (Zielke and Komor 2015). In addition,
new large discount corporations emerged in this century, such as the big UK supermarket Asda
(Cronin and Kelley 2015). The trend also applies to the US retail trade. Food discounters Aldi
and Lidl want to gain further momentum in the US market and are planning expansion of the
number of outlets in operation. In Aldi’s case, Cronin and Kelley (2015) hypothesize that it is
possible that the German retailer, having nearly 1,500 US stores in 2015, become the largest
supermarket chain in the US by 2020.
On this point, it should be noted that both Aldi and Lidl can be characterized as hard
discounters, rather than soft discounters. Hard discounters have a more limited range of
available products, mainly carry private-label products, and are more price-aggressive than soft
discounters (Gijsbrechts, Campo, and Nisol 2008). Soft discounters, such as the US
supermarket chain Save-A-Lot and the French hypermarket Carrefour, offer a broader
assortment. These retailers do not only sell their own labels, but branded products are also
available in their outlets (Heerde et al. 2013). In this way, the soft discount format resembles
traditional retailers to some extent. However, soft discounters are relatively more attractive due
to their lower-priced products, as argued in the study of Heerde et al. (2013).
Because of consumers’ status quo, positive experiences during recessions, changed
consumers’ perceptions of discounters, and the increasing number of discount outlets over time,
it seems likely that shoppers see no or little reason to switch back to the more expensive
conventional retailers in a post-recession recovery period. Based on these factors, it is thus
expected that recessionary shocks have a positive permanent impact on the success of low-cost
retailers. The following hypothesis is formulated:
H2: the occurrence of a recession has a positive long-lasting impact on US discounters’
market share
3. RESEARCH METHOD
The empirical analysis starts with categorizing the sample of all US retailers according to their
strategy. At this point, it will be examined whether a particular retail firm can be classified as a
discounter or not. Principal component analysis and cluster analysis separate the group of

9
discounters from all other retailers (3.1). Then, the quarterly market shares of discounters over
the sample period will be determined (3.2). Finally, section 3.3 analyzes the temporary and
permanent effects of recessions on discounters’ market share.
3.1 Stage 1: Identifying US discounters
Companies follow different strategic approaches to gain sustainable competitive advantage.
Each pursued strategy is positioned along the strategy continuum and has some characteristic
features. Table 1 presents the 10 most relevant strategic variables which capture the firm’s
competitive strategy along the strategy spectrum. These strategy operationalization metrics are
all based on prior literature (e.g., Andersen and Poulfelt 2007; Bentley, Omer, and Sharp 2013;
Dent 1990; Evans and Green 2000; Gibcus and Kemp 2003; Hambrick 1983; Higgins, Omer,
and Phillips 2014; Little et al. 2009, 2011; Nissim and Penman 2009; Soliman 2008).
Table 1: strategic variables in PCA analysis
Variable Definition
1 Research and development costs to
sales ratio (RD/SALES)
Capturing to which extent a firm engages in innovative
development of new products.
2 Selling, general and administrative
expenses to sales ratio (SGA/SALES)
Measuring the effort that a firm put in marketing
activities. The metric is a proxy for product
differentiation.
3 Quarterly percentage sales change
(CHANGESALES)
Capturing the growth increase and the opportunities for
growth.
4 Operating profit margin (OPM) Measuring the firm’s profitability. The ratio scales the
operating income by sales revenue.
5 Gross margin (GM) Measuring the firm’s profitability by dividing the gross
profit by sales revenue.
6 Employees to sales ratio
(EMPL/SALES)
Measuring efficiency in the production process. Is the
firm able to do more with less people employed?
7 Asset turnover (AT) Showing the operating efficiency within the company. It
is calculated by dividing the sales by total assets.
8 Inventory turnover (IT) Scaling the sales by inventory shows the firm’s efficiency
in managing inventory.
9 Operating expense ratio
(SALES/OPEXP)
Capturing the efficiency of a company in the production
of goods and/or services. The metric divides sales
revenue by total operating expenses.
10 Property, Plant and Equipment to total
assets ratio (PPE/ASSETS)
This capital intensity metric shows whether an
organization has an automated and capital intensive
production processes or a more labor intensive process.

10
Retailers with a differentiation approach are expected to have a relatively higher score on the
first six ratios (1-6) in Table 1. Hambrick (1983) and Higgins et al. (2014) report that
differentiation firms put greater emphasis on both R&D and marketing activities, resulting in
relatively higher RD/SALES and SGA/SALES ratios. The study of Higgins et al. (2014) also
states that the growth of differentiators (due to fast product-market development) occurs in
spurts, while the growth of cost leaders (due to increased market penetration) can be
characterized as steady. As a result, the CHANGESALES metric is predicted to be relatively
higher for differentiators. Drawing on previous papers (Little et al. 2009, 2011; Nissim and
Penman 2009; Soliman 2008), it is also expected that differentiators are relatively more
profitable. A differentiator that offers a (unique) distinguished product should be able to charge
a price premium. The relatively higher priced products may result in relatively higher OPM and
GM ratios. Moreover, since the processes of differentiators are more labor intensive (rather than
capital intensive), it is also likely that the EMPL/SALES metric is relatively higher for retailers
with a differentiation strategy (Bentley et al. 2013).
It is expected that discounters score relatively higher on the last four metrics (7-10) in
Table 1. The reduction of costs is key for these retailers, and can be achieved by optimizing
production processes, experience effects, making optimal use of economies of scale, keeping
overhead costs under tight control, and standardizing products (Little et al. 2011). The three
metrics IT, AT and SALES/OPEXP are all related to efficiency in production and distribution
processes, and are thus expected to be relatively higher for low-cost retailers. Bentley et al.
(2013) state that cost leaders also tend to invest more in technological efficiency, resulting in
mechanization and routinization. Therefore, the capital intensity PPE/ASSETS is also predicted
to be relatively higher for cost leaders.
Based on relevant strategic characteristics (10 in this study), researchers use several
statistical techniques for grouping firms according to their strategy. Frequently used techniques
are factor analysis, a priori groupings, generalized multidimensional scaling, and linear
discriminant analysis. Following existing academic research (e.g. Harrigan 1985; Utrilla,
Torraleja, Vázquez, and Ogáyar 2012), this paper executes 2 stages in the process of
categorizing retailers according to their strategic approach, in order to identify the group/cluster
of retail discounters. Firstly, a principal component analysis (PCA) is performed. The Varimax
rotated method with Kaiser normalization is used to make interpretation easier. By examining
the structure in relationships among the strategic variables, PCA reduces the ten strategic
standardized variables into a smaller group of common strategy components. Secondly, the
extracted components in the PCA are used as the input in a cluster analysis. The goal of

11
clustering is to identify homogeneous groups (each group having a similar strategy), whereby
this paper is interested in the identification of the discounters’ group. This study executes a
hierarchical cluster analysis to find the number of clusters and subsequently undertakes a non-
hierarchical K-means cluster analysis in which the retailers are divided in the different clusters.
3.2 Stage 2: Calculating discounters’ market share
Once PCA and cluster analysis separated the group of discounters from the group(s) of all other
retailers, the market shares of these discounters in the retail sector will be determined. For each
quarter, this paper compares the total sales (in US dollars) of the US discounters group to the
total sales (in US dollars) of all US retailers. It results in a series of discounters’ market shares
over the sample period. The aggregated market shares show how low-cost retailers perform in
the US retail market.
3.3 Stage 3: Temporary and permanent recession effects on market share
After categorizing the sample of retailers according to their strategy and calculating the series
of discounters’ market shares, analyses can be carried out on the two effects of recessions on
discounters’ success. These two expected effects are the temporary and the permanent effect,
which are both included in the research question. The temporary effect relates to (potential)
upward swings in discounters’ market share during crisis periods and (potential) downward
swings in market share during post-recession recovery periods. The permanent effect reflects
the extent to which recessionary shocks contribute to a long-lasting impact on discounters’
market share. Before determining whether there are temporary effects (stage 3b) and permanent
effects (stage 3c), a business cycle filtering procedure is used to decompose the time series of
the different variables into cyclical and non-cyclical/trend/long-term components (stage 3a).
3.3.1 Stage 3a: Cyclical and trend components in time series
The reason that observed economic time series should be decomposed into cyclical and non-
cyclical components, is that these two different times series patterns have different
characteristics and different forces which influence the components. The trend component
reflects the long-run movement in the series and varies smoothly and slowly over time periods;
the cyclical component includes the periodic fluctuations around this trend and represents
booms and recessions (Holly and Stannett 1995). Certain shocks may cause that variables
deviate from the trend, but the trend is ultimately restored over time.

12
Since this research focuses on the relationship between economic climate and market
shares of discounters, fluctuations in the series of discounters’ market share which relate to
periodicities in the business cycle, should be extracted. To separate the cyclical component from
the non-cyclical component, this study uses the Hodrick-Prescott filter (1997) (henceforth, HP
filter). This business cycle filtering procedure is incorporated in many other economic studies
(e.g., Deleersnyder et al. 2004, 2007, 2009; Harvey 2006; Holly and Stannett 1995; Lamey et
al. 2007, 2012; Lamey 2014; Mills 2001; Stock and Watson 1999). The HP filter shows that the
log-transformed 𝑦𝑡 (economic series) can be divided in 𝑦𝑡𝐶 (the cyclical component) and 𝑦𝑡
𝐿𝑇
(the long-term component). It results in the equation:
𝑦𝑡 = 𝑦𝑡𝐶 + 𝑦𝑡
𝐿𝑇 [1]
The HP filter formally determines the long-term component 𝑦𝑡𝐿𝑇 by minimizing:
∑(𝑦𝑡 − 𝑦𝑡𝐿𝑇)2
𝑇
𝑡=1
+ λ ∑((𝑦𝑡+1𝐿𝑇 − 𝑦𝑡
𝐿𝑇)(𝑦𝑡𝐿𝑇 − 𝑦𝑡−1
𝐿𝑇 ))2
𝑇−1
𝑡=2
[2]
As analyzed by Deleersnyder et al. (2004), the first part of equation [2] is the summation of the
squared deviations of the economic series (𝑦𝑡) from the long-run trend (𝑦𝑡𝐿𝑇) and reflects a
“goodness of fit measure”. The second part of the equation provides a penalty for changes in
the growth rate of this trend and reflects the smoothness of the long-term trend. If the non-
negative smoothing parameter λ increases, the trend 𝑦𝑡𝐿𝑇 will be smoother. Baxter and King
(1999) suggest that setting λ to a level of 100 is reasonable for annual data, while setting λ equal
to 1600 is a justified choice for quarterly data. As a significant amount of research follows this
approach (e.g., Deleersnyder et al. 2004; Lamey et al. 2012; Lamey 2014; Mills 2001), this
study also sets λ to 1600 for the quarterly data. In the results section, sensitivity checks are
performed to check the robustness of the results for different values of λ.
Once the long-term component 𝑦𝑡𝐿𝑇 is determined, rewriting equation [1] gives the
following equation for calculating the cyclical component 𝑦𝑡𝐶 in the time series of a particular
variables.
𝑦𝑡𝐶 = 𝑦𝑡 − 𝑦𝑡
𝐿𝑇 [3]

13
3.3.2 Stage 3b: Temporary recession effect on market share
For examining the temporary impact of a crisis on discounters’ performance, the cyclical
component in the logarithmic series of quarterly discounters’ market share (𝐷𝐼𝑆𝑆𝐻𝐴𝑅𝐸𝑡𝐶)
should be isolated from the long-term component (see equation [2] and [3]). Cyclical
fluctuations in the discounters’ market share should then be linked to cyclical fluctuations in
economic activity. The state of the US economy is represented by US real GDP, as this measure
is considered as the best proxy for overall economic activity (Colla 1994; McCall 2011).
Regressing the cyclical component in quarterly discounter’s market share (𝐷𝐼𝑆𝑆𝐻𝐴𝑅𝐸𝑡𝐶) on
the cyclical component in quarterly US GDP (𝐺𝐷𝑃𝑡𝐶) results in the following equation for the
temporary effect of hard economic times on discounters’ market share:
𝐷𝐼𝑆𝑆𝐻𝐴𝑅𝐸𝑡𝐶 = 𝛼 + 𝛽1 𝐺𝐷𝑃𝑡
𝐶 + 𝛽2 𝐷𝐼𝑆𝑆𝐻𝑂𝑃𝑡 + 𝛽3 𝐼𝑁𝐸𝑄𝑡 + 𝛽4 𝐶𝑂𝑁𝐹𝑡 + 휀𝑡 [4]
This equation gives the so-called cyclical co-movement elasticity, represented by 𝛽1. It is
allowed to interpret 𝛽1 as an elasticity coefficient, since the variables’ time series are log-
transformed prior to the HP filtering procedure. As a result, 𝛽1 indicates to which degree
discounters’ quarterly market share fluctuates (thereby deviating from the underlying trend)
during economic contractions and economic booms. If the cyclical co-movement elasticity is
smaller than zero (i.e., 𝛽1<0), discounter’s market share behaves counter-cyclically, with
upward swings in discounters’ market share in crisis periods and downward swings in market
share in a prosperous economy. If the cyclical co-movement elasticity is larger than zero (i.e.,
𝛽1>0), the market share behaves pro-cyclically. There is an a-cyclical relationship if the cyclical
co-movement elasticity is equal to zero (i.e., 𝛽1=0).
Three control variables are included in equation [4], namely the number of discount
stores in the US (𝐷𝐼𝑆𝑆𝐻𝑂𝑃𝑡), US income inequality (𝐼𝑁𝐸𝑄𝑡), and US consumer confidence
(𝐶𝑂𝑁𝐹𝑡). 𝐷𝐼𝑆𝑆𝐻𝑂𝑃𝑡 reflects the total number of discount shops in operation in the US. Lamey
(2014) states that the increasing number of discount outlets does only make people more aware
of the presence of the discount format, but also makes the low-cost retailers more accessible for
consumers. Therefore, it can be stated that opening more discount outlets boosts discounters’
popularity and consequently boosts discounters’ market share. 𝐼𝑁𝐸𝑄𝑡 measures US income
inequality by the Gini coefficient. This coefficient takes a value between 0 and 1. The extreme
value of 1 indicates complete inequality in income distribution, while the other extreme value
of 0 indicates complete equality in income distribution. A more unequal income distribution
leads to a widened gap between high-income and low-income consumers. In that situation,

14
people tend to shop more at the two ends of the retail spectrum (higher-end and lower-end)
(Zielke and Komor 2015). Discounters and differentiators probably reap the benefits. 𝐶𝑂𝑁𝐹𝑡
measures US consumer confidence by the score on the Consumer Confidence Index (CCI). The
confidence of shoppers in the economic environment influences purchase behavior. A lower
CCI score suggests that people are concerned about the current and future economic climate,
even when GDP grows (Ang et al. 2000). Consumers watch their pennies and become more
price-focused in this situation. It may have a positive impact on discounters’ market share.
For the control variables 𝐷𝐼𝑆𝑆𝐻𝑂𝑃𝑡 and 𝐼𝑁𝐸𝑄𝑡, only annual data is available. To
convert this annual data to quarterly data, several advanced statistical techniques can be used,
such as cubic spline interpolation. However, this paper makes the assumption that the two
control variables do not change within a particular year. It means that the number of discount
outlets in operation (𝐷𝐼𝑆𝑆𝐻𝑂𝑃𝑡) is assumed to be same over the four quarters and that the level
of income inequality (𝐼𝑁𝐸𝑄𝑡) is also assumed to be the same over the four quarters.
3.3.3 Stage 3c: Permanent recession effect on market share
By excluding the permanent trend from the series, the previous section (3.3.2) focused on the
cyclical co-movement elasticity for examining the link between temporary fluctuations in
economic activity and quarterly discounters’ market share. This section discusses the
permanent effect that relates to the growth in the long-term component. Consistent with
procedures in existing literature (e.g., Franses, 2001; Kontolemis, 1997; Lamey et al. 2007,
2012; Lamey 2014; Mills 2001), the following equation should be tested for this permanent
effect of a recession on discounters’ market share:
∆𝐷𝐼𝑆𝑆𝐻𝐴𝑅𝐸𝑡𝐿𝑇 = 𝛾 + 𝛿1𝐷𝑈𝑀𝐶𝑅𝐼𝑆𝑡 + 𝛿2𝐷𝐼𝑆𝑆𝐻𝑂𝑃𝑡 + 𝛿3𝐼𝑁𝐸𝑄𝑡 + 𝛿4𝐶𝑂𝑁𝐹𝑡+ 휀𝑡 [5]
The HP business cycle filtering procedure gives the trend component in the discounters’ market
share (𝐷𝐼𝑆𝑆𝐻𝐴𝑅𝐸𝑡𝐿𝑇) (see equation [2]). The quarterly growth in this market share is
represented by ∆𝐷𝐼𝑆𝑆𝐻𝐴𝑅𝐸𝑡𝐿𝑇. If the economy is in a crisis period, the crisis dummy
(𝐷𝑈𝑀𝐶𝑅𝐼𝑆𝑡) is set to 1, while the dummy is set to 0 if the economy is booming. The three
control variables, which were introduced in the previous section, are also included as controls
in this equation. Drift parameter 𝛾 (the intercept) reflects all unobserved factors which
contribute to the long-run growth in the discounters’ market share, but which are not included
in the equation.

15
Consequently, if the economy is in an expansion period (i.e., 𝐷𝑈𝑀𝐶𝑅𝐼𝑆𝑡 = 0), the sum
(𝛾 + 𝛿2 + 𝛿3 + 𝛿4) reflects the mean quarterly trend growth in the discounters’ market share.
If the economy is in a contraction period (i.e., 𝐷𝑈𝑀𝐶𝑅𝐼𝑆𝑡 = 1), the sum (𝛾 + 𝛿1 + 𝛿2 + 𝛿3 +
𝛿4) reflects the mean quarterly trend growth in the market share. As a result, 𝛿1 equals the mean
incremental trend growth in the discounter’s market share in a crisis quarter that does not
dissipate after a recessionary shock. Therefore, 𝛿1 will be used as a measure for permanent
growth in discounters’ performance due to adverse economic conditions. If 𝛿1 is larger than
zero, it implies a permanent gain of a downturn on discounters’ market share.
4. DATA
The sample includes all types of US retailers and is based on fiscal years 1967 to 2014. Several
sources are used to gather data. This study uses the database in Statista that provides quarterly
financial data for US retailers. As a result, this paper can determine the quarterly discounters’
market shares, as a percentage of total US retail sales. The state of the US economy is measured
by real US GDP, as this measure is considered as the best proxy for overall economic activity
(Colla 1994; McCall 2011). Quarterly real GDP series are used to calculate the cyclical
component of GDP (reflecting cyclical fluctuations in the economy), and to subsequently
determine the cyclical co-movement elasticity in equation [4]. GDP data is gathered from the
US Bureau of Economic Analysis (BEA). For the control variables, data on the US Gini
coefficients and US consumer confidence is collected from the Organization for Economic Co-
operation and Development (OECD), while Statista also provides data on the number of
discount outlets in the US.
To measure permanent growth in discounter’s performance in equation [5], contraction
and expansion periods in the US economy should be determined. It is common practice to use
the dates of these periods which are identified by the Business Cycle Dating Committee, part
of the National Bureau of Economic Research (NBER) (e.g., Baxter and King 1999; Christiano
and Fitzgerald 2003; Lamey et al. 2007; Stock and Watson 1999). However, the same papers
also state that there are some points of criticism regarding the NBER method. It is argued that
the NBER methodology is not only characterized by a lack of transparency and reproducibility,
but also misses statistical foundation to a certain extent. Nevertheless, this paper uses NBER
on the moments of business cycle turning points, as it is the most widely accepted approach in
academic literature.
16
5. RESULTS
The empirical results of this study are reported in this section. Firstly, PCA and cluster analysis
are performed to identify the discounters’ group in the large sample of all US retailers (5.1 and
5.2). Once the group of discounters is separated from all other retailers, the market shares of
these low-cost retailers are calculated over the sample period (5.3). Then, in order to answer
the twofold research question, section 5.4 analyzes the temporary and permanent effects of a
contraction period on discounters’ market shares. Finally, additional analyses and robustness
checks are reported (5.5).
5.1 Principal component analysis
The ten most relevant strategic variables – as presented in Table 1 (see section 3.1) – capture a
firm’s competitive strategy along the strategy continuum. PCA is performed to find a smaller
set of similar strategic dimensions, which can indicate underlying relationships with groups of
strategic variables. Thereby, PCA reduces the number of strategic variables. Before conducting
this PCA, several issues will be discussed to check whether PCA is an appropriate statistical
technique for this study. A discussion is followed for respectively (i) the Pearson correlation
coefficients among the strategic variables, (ii) Bartlett's test of sphericity, (iii) the determinant
of the Pearson correlation matrix, and (iv) the Kaiser-Meyer Olkin (KMO) measure of sampling
adequacy.
Table 2 gives the correlation matrix that shows the associations between the ten strategic
variables. The variables are not all measured on the same scale. Therefore, each variable is
standardized by subtracting the mean and dividing by the standard deviation. As can be seen in
the matrix, there is a positive correlation between RD/SALES and SGA/SALES (ρ = 0.643). It
suggests that firms which engage in R&D activities to a large (small) extent, engage in
marketing activities to a large (small) extent as well, and vice versa. Relatively strong positive
associations are also found between cost efficiency metrics AT and IT (ρ = 0.337), between AT
and the cost efficiency ratio SALES/OPEXP (ρ = 0.322), and between IT and SALES/OPEXP
(ρ = 0.411). The Bartlett's test of sphericity examines intercorrelation by testing the correlation
matrix’ significance. The results of the performed test allow to reject the null hypothesis that
states that the correlation matrix is an identity matrix, in which there are no intercorrelated
variables (χ2 = 27123.91, p < 0.001).

17
Table 2: correlation matrix for the 10 strategic variables
RD/
SALES
SGA/
SALES
CHANGE
SALES
OPM GM EMPL/
SALES
AT IT SALES/
OPEXP
PPE/
SALES
RD/SALES 1
SGA/SALES 0.643 1
CHANGESALES 0.002 0.093 1
OPM 0.292 0.361 -0.088 1
GM 0.113 0.225 -0.110 0.621 1
EMPL/SALES 0.112 0.215 -0.044 -0.125 -0.211 1
AT -0.013 0.021 -0.020 -0.031 -0.185 0.211 1
IT -0.001 0.004 -0.025 -0.002 -0.145 0.144 0.337 1
SALES/OPEXP 0.248 0.206 0.074 -0.814 -0.520 0.285 0.322 0.411 1
PPE/SALES 0.165 0.250 0.064 -0.409 -0.333 -0.401 0.029 0.128 0.398 1
While the strategic variables should be intercorrelated and are actually intercorrelated, too
highly intercorrelated variables may result in singularity and multicollinearity (Friend 2000).
The determinant of the correlation matrix shows whether there is an indication for
multicollinearity. Since this matrix yields a determinant value of 0.095, that is greater than the
critical value of 0.00001 (Harrigan 1985), there is no indication for multicollinearity. Finally,
the KMO statistic is calculated, as the last step for determining the PCA appropriateness. This
KMO overall measure for sample adequateness takes a value between 0 and 1. An extreme
value of 0 shows that the sum of partial correlations is large relatively to the sum of the original
correlations, which suggest that the correlations patterns are diffused. PCA is inappropriate in
that case. An extreme value of 1 indicates that the sum of partial correlations is small relatively
to the sum of the original correlations, which indicate that the variables share common
components. Doing a PCA is useful in that latter situation. In any case, the KMO value should
exceed 0.5 (Hair, Anderson, Tatham and Black 1995). Because of the fact that this criterion is
fulfilled as well – the calculated KMO value is 0.542 –, it can be concluded that PCA is an
appropriate technique for the data.
Subsequently, PCA is conducted on the ten standardized strategic variables, in order to
extract components which have an eigenvalue larger than 1. Table 3 reports the PCA results.
Three components emerge and explain 61.9% of the variance in the data. Drawing on prior
research (Dent 1990; Hair et al. 1995), strategic variables loading at 0.40 or more are included
in the components. One variable (CHANGESALES, the change in quarterly sales) does not
load into any component and is therefore excluded from further analysis and interpretation.
Table 3 suggests that the pattern of the calculated component loadings are in line with Porter’s
(1980) generic organizational strategies of differentiation and cost leadership.

18
Table 3: results PCA analysis
Variables Component 1 Component 2 Component 3
RD/SALES 0.608
SGA/SALES 0.754 0.420
OPM 0.522
GM 0.855
EMPL/SALES 0.582
AT 0.717 0.471
IT 0.630
SALES/OPEXP 0.412
PPE/SALES 0.591
Component 1 seems to correspond to the differentiation approach. This component is namely
highly related to both R&D and marketing activities which differentiators put relatively great
emphasis on. Relatively high differentiators’ willingness to develop new products and their
brand management approach result in higher R&D expenses and higher SG&A expenses
(Andersen and Poulfelt 2007; Hambrick 1983; Higgins et al. 2014). The finding that the
operating profit margin is also associated with this component, can be explained by
observations in existing academic research as well (Little et al. 2009, 2011; Nissim and Penman
2009; Soliman 2008). These papers report that differentiators are, on average, relatively more
profitable. Component 2 appears to represent the cost leadership strategy that is focused on cost
efficiency. The three variables which load highly into this component – AT, IT, and
SALES/OPEXP – support this strategy. Component 3 is harder to interpret since this component
is not dominated by variables with similar characteristics. Therefore, this component can be
classified as the “residual component”.
5.2 Cluster analysis: identifying discounters
In order to identify the homogeneous discounters’ group in the large sample of all US retailers,
the PCA is followed by a two-stage cluster analysis. The extracted component scores of PCA
are used as input in this cluster analysis. Firstly, a hierarchical cluster analysis is undertaken to
find an appropriate number of clusters and to identify outliers. Secondly, an executed non-
hierarchical K-means cluster analysis divides the US retailers into different groups.
Following previous academic papers (Harrigan 1985; Utrilla et al. 2012), this study uses
Ward’s (1963) hierarchical clustering method that yields relatively homogeneous clusters. The
component scores from the three-component rotated solution in the PCA are used for this
analysis. No outliers are detected, since all scores are within the critical range between -3 and

19
3. Both the coefficients of the dendrogram and the record clustering data indicate the presence
of three clusters. Then, the component scores are used for conducting the non-hierarchical K-
means cluster analysis. Table 4 shows the resulting cluster centroids, which are mean
component scores in a particular cluster. For clarification of the presented numbers in the table:
the 0.05 value in the fourth column indicates for example slightly above-average activity on
Component 1, that corresponds to the differentiation strategy.
Table 4: cluster centroids and ANOVA results
Cluster 1 Cluster 2 Cluster 3 F-value
Component 1 1.85 -0.37 0.05 521.254***
Component 2 -0.02 1.35 -0.17 854.547***
Component 3 -0.52 -0.25 0.31 424.452***
Note: *** denotes statistical significance at 1%, all one-tailed
Retailers in Cluster 1 (43.2% of the sample) have adopted the differentiation approach, given
the relatively high mean score of Component 1 in this cluster. Cluster 2 (34.1% of the sample)
has a relatively high mean score of Component 2 (representing the cost leadership strategy),
which suggest that retailers in this group can be characterized as discounters. It appears that
corporations in Cluster 3 (22.7% of the sample) show a lack of strong commitment to a
differentiation or a cost leadership strategy. These firms do not follow a clear identifiable
strategy. The last column in Table 4 shows the results of the one-way analysis of variances
(ANOVA). This analysis is performed to test whether the three clusters are significantly
different from each other. Since the mean component values turn out to be significantly
difference across the three clusters – all p-values are smaller than 0.001 –, it can be stated that
the clusters are distinguishable.
Table 5 presents a more detailed comparison between the different strategic approaches
of the firms in the sample. For every standardized strategic variable that is included in the
analysis, the mean and standard deviation are presented by cluster. This table is complementary
to Table 4, in the way that Table 5 confirms the basis of the significant differences across the
three clusters. Cluster 1 (the differentiators group) is characterized by relatively high means for
RD/SALES, SGA/SALES, OPM, GM, and EMPL/SALES. In Cluster 2 (the discounters
group), relatively high means are reported for AT, IT, SALES/OPEXP, and PPE/SALES. In
that way, Cluster 1 is the opposite of Cluster 2. It is important to mention that for the remainder
of the analysis in this section, this study mainly focuses on the discount retailers in Cluster 2.
This cluster represents the discounters.

20
Table 5: descriptive statistics of the strategic variables, by cluster
Cluster 1 Cluster 2 Cluster 3
RD/SALES 0.034
(0.014)
0.021
(0.010)
0.014
(0.008)
SGA/SALES 0.142
(0.049)
0.095
(0.045)
0.139
(0.048)
OPM 0.085
(0.032)
0.068
(0.015)
0.067
(0.021)
GM 0.328
(0.085)
0.285
(0.062)
0.269
(0.079)
EMPL/SALES 0.055
(0.018)
0.037
(0.011)
0.038
(0.022)
AT 2.125
(0.715)
3.114
(1.032)
2.855
(0.899)
IT 7.992
(1.002)
9.751
(1.442)
9.554
(0.952)
SALES/OPEXP 4.452
(1.521)
5.124
(0.841)
5.113
(1.339)
PPE/SALES 0.332
(0.075)
0.547
(0.068)
0.365
(0.055)
Note: the presented numbers are the mean and standard deviation (in parentheses), respectively
5.3 Business cycles and quarterly discounters’ market shares
The following two graphs (Figure 1 and 2) show the up- and down-movements in US GDP and
US discounters’ market share over the sample period (1967-2014). In these business cycles, the
NBER identifies seven contraction periods: (i) Q4 1969 – Q4 1970, (ii) Q4 1973 – Q1 1975,
(iii) Q1 1980 – Q3 1980, (iv) Q3 1981 – Q4 1982, (v) Q3 1990 – Q1 1991, (vi) Q1 2001 – Q4
2001, (vii) Q4 2007 – Q2 2009. The dark regions in the figures reflect recession periods in the
US business cycle.
Figure 1 shows the fluctuations in the US business cycle through isolating the cyclical
component in the logarithmic US real GDP series from its long-term component. The HP filter
is used to obtain this component. The graph suggests that the cyclical component in the US real
GDP series decreases during downswings and increases when the aggregate economy picks
back up. The permanent component grows smoothly and slowly over the time periods. Figure
2 suggests that the discounters’ market share behaves counter-cyclically, with upward swings
in discounters’ market share when the economy winds down and downward swings in market
share in post-recession recovery periods. Regression analyses are needed to give decisive
answers on the twofold research question whether the market share of low-cost retailers evolves
counter-cyclically (temporary effect), and whether these discounters remain permanently
popular after harsh economic times (permanent effect).

21
Figure 1: up-and down-movements in the US business cycle
Figure 2: relationship between aggregate economy and discounters’ market share
5.4 Temporary and permanent effects of recessions on market share
For examining the temporary effect of a recession on discounters’ market share (first
hypothesis), equation [4] will be tested. The cyclical co-movement elasticity, represented by 𝛽1
in the equation, is the relevant coefficient in this case. This coefficient indicates to which extent
the discounters’ market share fluctuates during economically difficult times and more affluent
periods. It is expected that the discounters’ market share evolves counter-cyclically (i.e., 𝛽1<0),
with upward swings in discounters’ share when the economy turns sour and downward swings
when the economic climate improves. In line with these predictions, the empirical regression
-0,03
-0,02
-0,01
0
0,01
0,02
0,03
Cyclical component in the logarithmic GDP series (US dollars)
Trend component in the logarithmic GDP series (US dollars)
-0,08
-0,06
-0,04
-0,02
0
0,02
0,04
0,06
0,08
Cyclical component in the logarithmic discounters' market share series (%)
Cyclical component in the logarithmic GDP series (US dollars)

22
results (documented in Table 6) reveal that the cyclical co-movement elasticity is indeed
negative and significant (𝛽1= -1.510, p = 0.038). Consumer confidence has a significantly
negative association with discounters’ market share (𝛽4= -0.879, p = 0.061).
The results indicate that the quarterly discounters’ market share behaves counter-
cyclically: if US economic activity decreases (increases) by one percent, it is predicted that, on
average, the quarterly US discounters’ market share increases (decreases) by 1.51 percent. In
other words: if quarterly US GDP decreases (increases) one percent below (above) its estimated
long-run average, it is expected that, on average, the quarterly US discounters’ market share is
1.51 percent higher (lower) than its estimated long-run average.
Table 6: regression analysis on temporary and permanent effects
of recessionary shocks on discounters’ market shares
Temporary effecta Permanent effectb
CONSTANT 0.009 (0.013)*** 2.134 (0.045)**
𝐺𝐷𝑃𝑡𝐶 -1.510 (0.038)**
𝐷𝑈𝑀𝐶𝑅𝐼𝑆𝑡
𝐷𝐼𝑆𝑆𝐻𝑂𝑃𝑡
𝐼𝑁𝐸𝑄𝑡
𝐶𝑂𝑁𝐹𝑡
0.099 (0.211)
0.425 (0.109)
-0.879 (0.061)*
0.844 (0.077)*
0.412 (0.038)**
0.612 (0.093)*
-0.693 (0.155)
Number of observations
Adjusted R2
F-statistic
Highest VIFc
192
0.212
28.541 (0.001)***
3.854
191
0.185
22.167 (0.001)***
3.009 aThis model tests equation [4] for the temporary effect of a recession on discounters’ market share, with 𝐷𝐼𝑆𝑆𝐻𝐴𝑅𝐸𝑡
𝐶 as
dependent variable bThis model tests equation [5] for the long-lasting impact of a recession on discounters’ market share, with ∆𝐷𝐼𝑆𝑆𝐻𝐴𝑅𝐸𝑡
𝐿𝑇 as
dependent variable cGiven the observation that none of the Variance Inflation Factors (VIF’s) exceeds the critical level of ten (Field 2000), it can
be stated that multicollinearity is not an issue in both models
Notes: *, **, *** denote statistical significance at 10%, 5% and 1%, respectively, all one-tailed. The corresponding p-values
are given in parentheses.
Table 6 also contains the regression results for equation [5], relating to the permanent growth
in the discounters’ share due to an economic downswing (second hypothesis). The results reveal
that the occurrence of a crisis has a positive long-lasting impact on the performance of US low-
cost retailers. Firstly, the sum (𝛾 + 𝛿2 + 𝛿3 + 𝛿4) reflects the mean trend growth in the
discounters’ market share in an economic expansion quarter (see section 3.3.3) and is equal to
2.465 (2.134 + 0.412 + 0.612 – 0.693). It implies that the discounters’ market share shows a
mean quarterly growth of 2.465 percent. This growth rate is expressed in relative terms. It
means that if, for example, the current quarterly discounters’ share is 20 percent, the 1.865
23
percent mean growth during an economic expansion quarter indicates that the market share
increases – in absolute terms – by 0.49 percent (2.465%*20) to 20.49 percent. This finding
confirms conventional knowledge that the discount retail segment is not only a phenomenon in
recession periods, but is successful in both economic expansion and contraction quarters.
Secondly, testing equation [5] also provides the evidence that hard economic times lead
to incremental permanent boosts for low-cost retailers. In economic contraction quarters, the
mean additional discounters’ growth is 0.844 percent (𝛿1 = 0.844, p = 0.077). This growth rate
– significant at a level of 0.10 – is permanent, in a way that these gains in market share tend to
consolidate and are thus not cancelled out in subsequent expansions. Moreover, higher numbers
of discount shops in the US (𝛿2 = 0.412, p = 0.038) and higher levels of US income inequality
(𝛿3 = 0.612, p = 0.093) also have a long-lasting impact on discounters’ performance. Thus,
where the discounters’ market share increases, on average, with 1.865 percent in an economic
expansion quarter, the growth of the market share in an economic contraction quarter (the sum
𝛾 + 𝛿1 + 𝛿2 + 𝛿3 + 𝛿4) is, on average, 3.309 percent (2.134 + 0.844 + 0.412 + 0.612 – 0.693).
These growth rates are all expressed in relative terms.
In sum, the empirical results indicate that, on average, the discounters’ market share
behaves counter-cyclically and shows a positive long-term growth every quarter. The findings
also reveal that the growth in the discounters’ market share in recessions is long-lasting, in a
way that the discounters’ market share does not dissipate after economically difficult times.
These results are in line with the two formulated hypotheses.
5.5 Additional analyses and robustness checks
Serial correlation. Several studies state that business cycle filtering procedures, such as
the HP filter in this study, may induce persistent serial correlation in the data (Engle 1974;
Singleton 1988). The assumption that the error terms are independent of each other, would be
violated then. This issue is particular relevant in time series research, since the error term in a
given time period may be correlated with the error term in the adjacent time period. In other
words: the error in a particular time period can be influenced by the error in the prior period. If
there is an overestimate at a point of time (a positive error, since the observation is larger than
predicted), it is likely that an overestimate also occurs in the subsequent time period. An upward
bias in the error in the next period is then created.
If there is serial correlation in the data, equation [4] can be extended with an
autoregressive (AR) error term. The Breusch-Godfrey serial correlation LM test and the well-
known Durbin-Watson statistic give decisive answers on the question whether serial

24
correleation is present, and whether an AR error term should be therefore included. The
Breusch-Godfrey test does not only check for first-order autocorrelation among the error terms,
but also checks for higher-order autocorrelation (King and Rebelo 1993). Given the results of
the Breusch-Godfrey test (χ2 = 91.82, p > 0.10) and the Durbin-Watson test (d = 1.897 > dU =
1.828; 4-d = 2.103 > dU = 1.828), the null hypotheses (stating that there is no autocorrelation)
cannot be rejected in both tests. Hence, no further action is required for the potential issue of
serial correlation.
Heteroscedasticity. Ordinary Least Squares (OLS) is used for testing the two hypotheses
and assumes homogeneity of the variance of the error terms. The residual variance is
heteroscedastic if the variance of the error terms is non-constant. Firstly, a plot of the residuals
against the independent variable in equation [4] is visually inspected for the presence of
heteroscedasticity. This eye-ball test indicates that there is an uneven pattern of residuals,
suggesting that the homogeneity assumption of OLS would be violated. Two formal tests are
carried out to investigate whether heteroscedasticity is an issue in equation [4]. The results in
both the Breusch-Pagan test (p < 0.10) and the White test (p < 0.10) allow to reject the null
hypotheses (stating in both tests that the variance of error terms is homoscedastic). It reveals
the presence of heteroscedasticity in the data. Therefore, White’s robust/heteroscedasticity-
consistent standard errors are used in this study and are already reported in Table 6.
Endogeneity. The issue of endogeneity arises when there is correlation between the
independent variable and the error term. Reverse causality problems and an omitted variable
bias are the main factors which lead to endogeneity. It ultimately leads to biased and
inconsistent regression coefficients in the model. Firstly, several important control variables are
included in both equation [4] and [5] to mitigate the problem of an omitted variable bias.
Secondly, this paper does not expect that the issue of reverse causality drives the regression
results. It is considered to be unlikely that discounters’ market share has a causal impact on
either GDP (equation [4]) or the occurrence of an economic downturn (equation [5]). In this
respect, Lee, Singal, and Kang (2013) note that successful firms (discounters in this study) can
stimulate economic activity by, for instance, creating new jobs. On the other hand, these well
performing firms may beat underperforming rivals in the market. Employees in the
underperforming companies consequently lose their jobs in this situation, which have a negative
impact on economic activity (Lee et al. 2013). This reasoning rules out that a strong effect of
discounters’ market share on the aggregate economy exists.
25
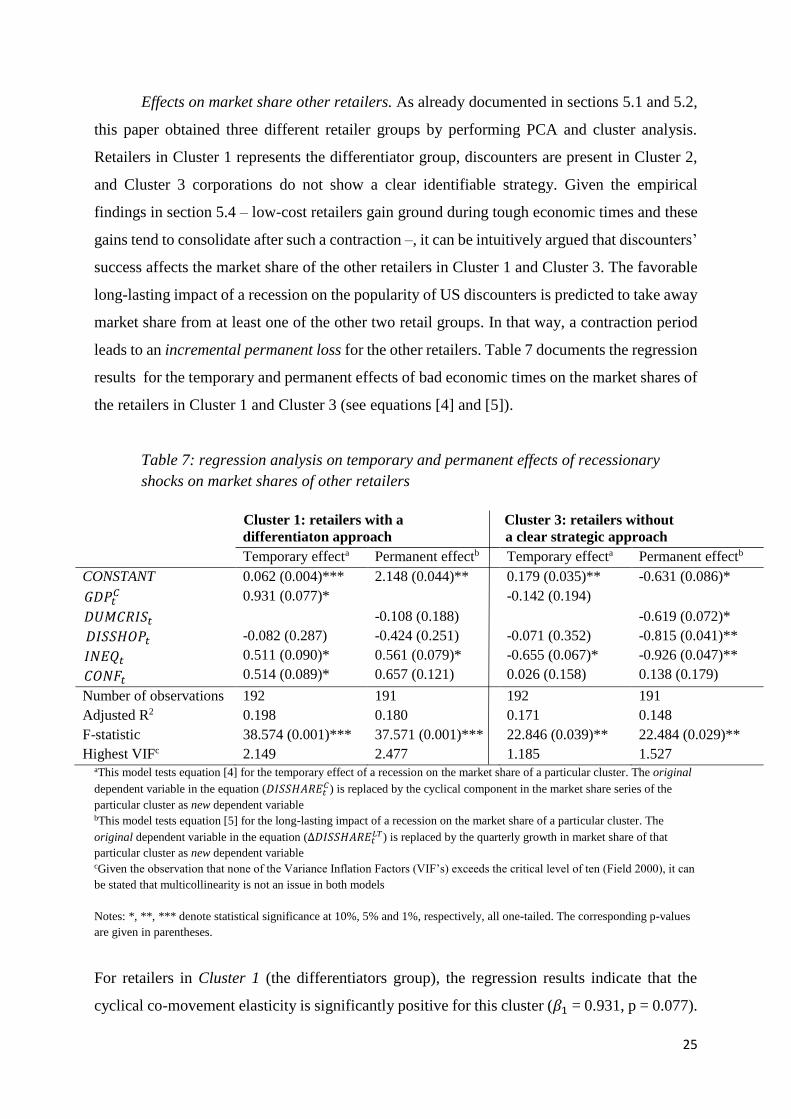
Effects on market share other retailers. As already documented in sections 5.1 and 5.2,
this paper obtained three different retailer groups by performing PCA and cluster analysis.
Retailers in Cluster 1 represents the differentiator group, discounters are present in Cluster 2,
and Cluster 3 corporations do not show a clear identifiable strategy. Given the empirical
findings in section 5.4 – low-cost retailers gain ground during tough economic times and these
gains tend to consolidate after such a contraction –, it can be intuitively argued that discounters’
success affects the market share of the other retailers in Cluster 1 and Cluster 3. The favorable
long-lasting impact of a recession on the popularity of US discounters is predicted to take away
market share from at least one of the other two retail groups. In that way, a contraction period
leads to an incremental permanent loss for the other retailers. Table 7 documents the regression
results for the temporary and permanent effects of bad economic times on the market shares of
the retailers in Cluster 1 and Cluster 3 (see equations [4] and [5]).
Table 7: regression analysis on temporary and permanent effects of recessionary
shocks on market shares of other retailers
Cluster 1: retailers with a Cluster 3: retailers without
differentiaton approach a clear strategic approach
Temporary effecta Permanent effectb Temporary effecta Permanent effectb
CONSTANT 0.062 (0.004)*** 2.148 (0.044)** 0.179 (0.035)** -0.631 (0.086)*
𝐺𝐷𝑃𝑡𝐶 0.931 (0.077)* -0.142 (0.194)
𝐷𝑈𝑀𝐶𝑅𝐼𝑆𝑡
𝐷𝐼𝑆𝑆𝐻𝑂𝑃𝑡
𝐼𝑁𝐸𝑄𝑡
𝐶𝑂𝑁𝐹𝑡
-0.082 (0.287)
0.511 (0.090)*
0.514 (0.089)*
-0.108 (0.188)
-0.424 (0.251)
0.561 (0.079)*
0.657 (0.121)
-0.071 (0.352)
-0.655 (0.067)*
0.026 (0.158)
-0.619 (0.072)*
-0.815 (0.041)**
-0.926 (0.047)**
0.138 (0.179)
Number of observations
Adjusted R2
F-statistic
Highest VIFc
192
0.198
38.574 (0.001)***
2.149
191
0.180
37.571 (0.001)***
2.477
192
0.171
22.846 (0.039)**
1.185
191
0.148
22.484 (0.029)**
1.527 aThis model tests equation [4] for the temporary effect of a recession on the market share of a particular cluster. The original
dependent variable in the equation (𝐷𝐼𝑆𝑆𝐻𝐴𝑅𝐸𝑡𝐶) is replaced by the cyclical component in the market share series of the
particular cluster as new dependent variable bThis model tests equation [5] for the long-lasting impact of a recession on the market share of a particular cluster. The
original dependent variable in the equation (∆𝐷𝐼𝑆𝑆𝐻𝐴𝑅𝐸𝑡𝐿𝑇) is replaced by the quarterly growth in market share of that
particular cluster as new dependent variable cGiven the observation that none of the Variance Inflation Factors (VIF’s) exceeds the critical level of ten (Field 2000), it can
be stated that multicollinearity is not an issue in both models
Notes: *, **, *** denote statistical significance at 10%, 5% and 1%, respectively, all one-tailed. The corresponding p-values
are given in parentheses.
For retailers in Cluster 1 (the differentiators group), the regression results indicate that the
cyclical co-movement elasticity is significantly positive for this cluster (𝛽1 = 0.931, p = 0.077).

26
It shows that the quarterly market share of differentiation retailers evolves pro-cyclically. If US
GDP increases (decreases) by one percent, it is predicted that, on average, the quarterly US
differentiators’ share increases (decreases) by 0.931 percent. The value of the coefficient of the
permanent recession effect (𝛿1) is -0.108 (p = 0.188). Since this value does not significantly
differs from zero, it means that differentiators do not permanently benefit or suffer from the
occurrence of a crisis. Furthermore, the coefficients of the control variables 𝐼𝑁𝐸𝑄𝑡 and 𝐶𝑂𝑁𝐹𝑡
suggest that higher levels of both US income inequality and US consumer confidence have a
positive impact on short- and long-term differentiators’ performance.
For retailers in Cluster 3 (not following a clear strategic approach), there is no
significantly temporary effect of cyclical GDP fluctuations on their market shares
(𝛽1 = -0.142, p = 0.194). Regarding the permanent recession effect, the value of 𝛿1 equals -
0.619 (p = 0.072). It means that the incremental permanent loss of Cluster 3 firms due to an
economic downswing is, on average, 0.619 percent. Thus, where their mean market share
deceases by 2.234 percent in an economic expansion quarter (-2.234 equals the sum 𝛾 + 𝛿2 +
𝛿3 + 𝛿4), their mean market share decreases by 2.853 percent in an economic recession quarter
(-2.853 equals the sum 𝛾 + 𝛿1 + 𝛿2 + 𝛿3 + 𝛿4). This last finding is in line with the model of
Porter (1980). Consistent with Porter’s framework, the result provides evidence that not making
a fundamental choice for one of the proposed generic strategic approaches, leads to a situation
of strategic mediocrity and below-average profitability in the long-run. These badly positioned
retailers are doomed to be outperformed by rivals at both end of the strategy spectrum.
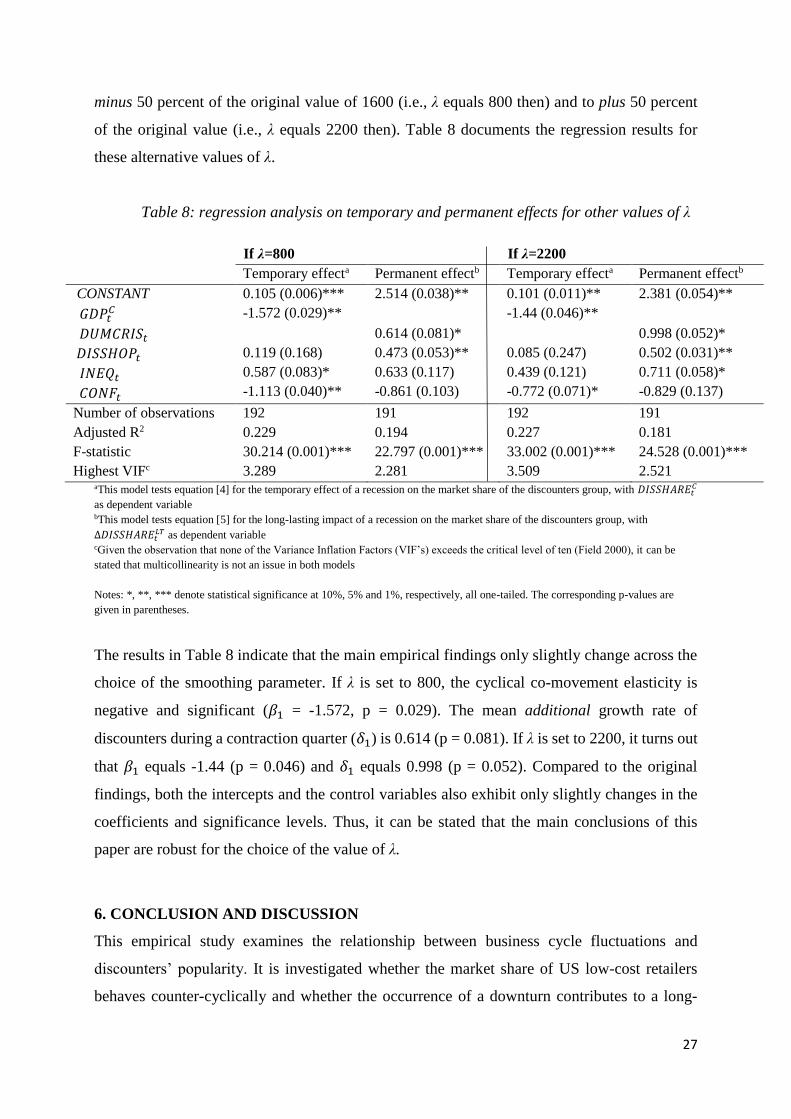
Different values for λ (smoothing parameter). This paper uses the de-trending HP filter
to separate cyclical components from non-cyclical components. The trend component in
variables’ series is formally determined by minimizing equation [2]. As already discussed in
section 3.3.1, the second part of this equation provides a penalty for changes in the growth rate
of the long-term trend. This part reflects the smoothness of the stochastic trend. Drawing on
most prior studies (e.g., Baxter and King 1999; Deleersnyder et al. 2004, 2009; Lamey et al.
2012; Lamey 2014; Lee, Singal, and Kang 2013; Mills 2001), this paper sets the smoothing
parameter λ to 1600 for the quarterly data. However, some other academics argue that lower or
higher smoothing values are more suitable for quarterly data (Canova 1994; Harvey and Jaeger
1993; Ravn and Uhlig 2001). Varying the value of λ results in different non-cyclical
components and cyclical components which will be derived. This may also change the
conclusions. Therefore, a sensitivity analysis is performed to check the robustness of the choice
of parameter λ. Similar to the analysis of Harvey (2006), the alternative values of λ are set to
27
minus 50 percent of the original value of 1600 (i.e., λ equals 800 then) and to plus 50 percent
of the original value (i.e., λ equals 2200 then). Table 8 documents the regression results for
these alternative values of λ.
Table 8: regression analysis on temporary and permanent effects for other values of λ
If λ=800 If λ=2200
Temporary effecta Permanent effectb Temporary effecta Permanent effectb
CONSTANT 0.105 (0.006)*** 2.514 (0.038)** 0.101 (0.011)** 2.381 (0.054)**
𝐺𝐷𝑃𝑡𝐶 -1.572 (0.029)** -1.44 (0.046)**
𝐷𝑈𝑀𝐶𝑅𝐼𝑆𝑡
𝐷𝐼𝑆𝑆𝐻𝑂𝑃𝑡
𝐼𝑁𝐸𝑄𝑡
𝐶𝑂𝑁𝐹𝑡
0.119 (0.168)
0.587 (0.083)*
-1.113 (0.040)**
0.614 (0.081)*
0.473 (0.053)**
0.633 (0.117)
-0.861 (0.103)
0.085 (0.247)
0.439 (0.121)
-0.772 (0.071)*
0.998 (0.052)*
0.502 (0.031)**
0.711 (0.058)*
-0.829 (0.137)
Number of observations
Adjusted R2
F-statistic
Highest VIFc
192
0.229
30.214 (0.001)***
3.289
191
0.194
22.797 (0.001)***
2.281
192
0.227
33.002 (0.001)***
3.509
191
0.181
24.528 (0.001)***
2.521 aThis model tests equation [4] for the temporary effect of a recession on the market share of the discounters group, with 𝐷𝐼𝑆𝑆𝐻𝐴𝑅𝐸𝑡
𝐶
as dependent variable bThis model tests equation [5] for the long-lasting impact of a recession on the market share of the discounters group, with
∆𝐷𝐼𝑆𝑆𝐻𝐴𝑅𝐸𝑡𝐿𝑇 as dependent variable
cGiven the observation that none of the Variance Inflation Factors (VIF’s) exceeds the critical level of ten (Field 2000), it can be
stated that multicollinearity is not an issue in both models
Notes: *, **, *** denote statistical significance at 10%, 5% and 1%, respectively, all one-tailed. The corresponding p-values are
given in parentheses.
The results in Table 8 indicate that the main empirical findings only slightly change across the
choice of the smoothing parameter. If λ is set to 800, the cyclical co-movement elasticity is
negative and significant (𝛽1 = -1.572, p = 0.029). The mean additional growth rate of
discounters during a contraction quarter (𝛿1) is 0.614 (p = 0.081). If λ is set to 2200, it turns out
that 𝛽1 equals -1.44 (p = 0.046) and 𝛿1 equals 0.998 (p = 0.052). Compared to the original
findings, both the intercepts and the control variables also exhibit only slightly changes in the
coefficients and significance levels. Thus, it can be stated that the main conclusions of this
paper are robust for the choice of the value of λ.
6. CONCLUSION AND DISCUSSION
This empirical study examines the relationship between business cycle fluctuations and
discounters’ popularity. It is investigated whether the market share of US low-cost retailers
behaves counter-cyclically and whether the occurrence of a downturn contributes to a long-
28
lasting impact on discounters’ market share. Principal component analysis, cluster analysis, and
the HP business cycle filtering procedure are used to classify US retailers according to their
strategic approach and to subsequently determine the market shares of the retail discount
segment in the 1967-2014 period. In line with the two formulated hypotheses, regression results
reveal that the market share of the discount retail format indeed evolves counter-cyclically and
thus increases in tough economic times. This suggests that crisis-hit consumers pay more
attention to prices in their decision-making process during recessions and are more inclined to
shop in the price-aggressive discount outlets. Moreover, the findings indicate that low-cost
retailers show a positive (average) sales growth in every quarter. The growth in the discounters’
market share in recessions is permanent, in a way that the gained market share of discounters
does not evaporate after economically difficult times. It indicates that consumers do not change
their recession-induced shopping behavior in post-recession recovery periods. In addition,
regression results show that the increasing success of the discount channel leads to permanently
diminishing market shares of structurally ill-positioned conventional retailers. The study also
provides evidence that retailers in the differentiation segment do not suffer or benefit – in terms
of losing/gaining market share – from the occurrence of recessions. All conclusions are robust
for different values of the HP smoothing parameter.
6.1 Managerial implications
With the aforementioned outcomes, this research is valuable in the little exposed academic area
of discount retailing. The study enhances the understanding of the impact of recessions on the
retail business. It signals to traditional retailers that losing market share to discounters in an
economic slowdown leads to a permanent decreased market share of these traditional firms.
Low-cost retailers even want to gain further momentum now, after they have sharply increased
their number of discount shops over the last decades. Numerous leading discounters over the
world have aggressive expansion plans to further increase the number of outlets in both the
national and international retail market. In addition, new large discount corporations emerged
in the previous decade and captured market share of the traditional formats. All these
developments cause serious concerns for conventional retailers. Although these retailers do not
have any control on macro-economic developments, such as the occurrence of economic up-
and downswings, the affected companies can and should take firm action to avoid losing market
share in non-recession and recession periods.
Traditional retailers can take several actions to prevent that shoppers switch to
discounters during an economic downswing. As an example of such an action, the UK grocery

29
store Tesco developed a counter-strategy in the previous financial crisis to fight against their
discount competitors. Part of this strategic approach were the introduction of a broad range of
cheap store brands (called Discount Brands) and a large marketing campaign to change price
perception of consumers (Lamey 2014). Dutch retailer Albert Heijn and Belgian supermarket
chain Delhaize have also put lots of effort in the extension of their private-label line, in
conjunction with actions to alter price perception (Heerde et al. 2013). Lamey et al. (2012)
argue that spending more on advertising and promotion activities can be an effective option for
retailers to survive in crisis periods. However, the same paper finds evidence that marketing
budgets of retailers shrink during adverse economic conditions. It seems that retailers easily cut
on marketing expenses in such periods.
Given the empirical finding that structurally ill-positioned retailers suffer most from
discounters’ success, these firms should take action to reverse this observed pattern. Moving to
the extreme ends of the strategy continuum is one of the potential actions that the middle of the
market enables to regain the lost market share. For instance, Dutch department store De
Bijenkorf – positioned between the middle and high segment in the past – have heavily invested
in a “premium experience strategy” for some time now. With this strategic movement to the
higher-end of the spectrum, the firm has successfully differentiated itself from competitors.
Moreover, badly positioned retailers also have the option to create so-called “blue oceans of
uncontested market space”. This blue ocean strategy is introduced in the well-known book of
Kim and Mauborgne (2005). The authors note that several retailers adopted this strategic
approach of creating and capturing new markets, instead of competing in existing markets.
Some of the examples they provide are Southwest Airlines (first airliner with a “no-frills”
format), Cirque du Soleil (combing the circus format with theatrical acts, without animals),
Tupperware (selling home products in a party setting), and Dell (directly selling computers to
consumers).
6.2 Research limitations and suggestions for future research
The research findings implicate that the aforementioned strategic changes of conventional
retailers – in both recession and non-recession periods – are indeed necessary to retain shoppers
in their stores. However, Zielke and Komor (2015) note that a significant amount of retailers
worldwide have not acknowledged the tremendous sales growth of discounters yet. These
traditional companies are still positioned in the middle of the strategy spectrum and are
therefore likely to be outperformed by retailers at both ends of the continuum. On this point,
future research should focus on the question how, and to what extent, non-discounters can avoid

30
losing market share in both recession and non-recession periods. Should traditional retailers
extend their line of cheaper store brands (Tesco, Albert Heijn and Delhaize), should they move
to the extreme ends of the strategy spectrum (De Bijenkorf), or should they develop a
sustainable blue ocean strategy (Southwest, Cirque du Soleil, Dell, and Tupperware)? Or is
there another effective strategy to fight against the price-aggressive discounters? In addition,
more research is also necessary to further elaborate on the success story of the low-cost retailers.
For instance, which discount retail type (hard or soft discounters) is more successful in
recession and non-recession periods, and why? And which traditional retail type (for example,
hypermarkets or smaller supermarkets) does suffer most in these periods, and why?
There are some limitations in this paper which also offer directions for future research.
Firstly, this study uses the HP business cycle filtering procedure to extract fluctuations in
economic time series which relate to periodicities in the business cycle. Holly and Stannett
(1995) state that different de-trending procedures may result in different findings. While the
research findings are robust for the choice of the smoothing parameter in the HP filter, no
validations exercises are performed for other more complex filters, such as the de-trending filter
of Baxter and King (1999). Secondly, the extent to which the findings are generalizable across
all countries might be a concern. Although both US and non-US discounters have enjoyed
increasing popularity for a long time (Cronin and Kelley 2015), it should be noted that retail
markets naturally differ across countries. Certain characteristics of a particular country – such
as national culture, laws or religion – may affect the success of a retail format. Thirdly, this
research uses retail sales on the level of the entire retail industry. Conclusions are thus made on
industry-level. However, it is possible that findings are different for different types of retailers
in the sector. On this point, future research can, for example, examine whether the impact of
crisis periods on department stores differs from the impact on supermarkets.
Fourthly, this paper sheds light on the link between business cycle fluctuations and
discounters’ success. However, due to limited data availability, this study does not control for
all potential drivers of their short- and long-term popularity. For instance, the intensity of rivalry
between firms in the retail market may also affect the performance of discounters. While the
severity and duration of a particular contraction period can play a role as well, this paper does
not examine whether, and to what extent, a relatively severe and long-lasting crisis period
influences the market share of retail segments. The structural shift to “online sales” is also not
taken into account. Nowadays, consumers can easily compare prices of products between
different online stores and can shop at any time of the day. Switching between different
channels and between different retailers is easier. Discounters’ success can also be affected by

31
the change in consumer behavior over the sample period (1967-2014). It is likely that current
consumers’ attitudes, preferences and buying behavior are different compared to the 1960s. For
instance, there was no market for digital music streaming services, “video on demand”, and
smartphones in that period. At this moment, these goods and services are part of consumers’
modern life.

32
References
Andersen, M. M., and F. Poulfelt. 2007. Discount Business Strategy: How The New Market
Leaders are Redefining Business Strategy. John Wiley & Sons.
Ang, S. H., S.M. Leong, and P. Kotler. 2000. The Asian apocalypse: crisis marketing for
consumers and businesses. Long Range Planning 33 (1): 97-119.
Baxter, M., and R.G. King. 1999. Measuring business cycles: approximate band-pass filters for
economic time series. Review of Economics and Statistics 81 (4): 575-593.
Bentley, K. A., T.C. Omer, and N. Y. Sharp. 2013. Business strategy, financial reporting
irregularities, and audit effort. Contemporary Accounting Research 30 (2): 780-817.
Canova, F. 1994. Detrending and turning points. European Economic Review 38 (3): 614-623.
Chou, T. J., and F.T. Chen. 2004. Retail pricing strategies in recession economies: the case of
Taiwan. Journal of International Marketing, 12 (1): 82-102.
Christiano, L. J., and T.J. Fitzgerald. 2003. The band pass filter. International Economic
Review 44 (2): 435-465.
Christiano, L. J., M. Eichenbaum, and C.L. Evans. 2005. Nominal rigidities and the dynamic
effects of a shock to monetary policy. Journal of Political Economy 113 (1): 1-45.
Colla, E. 1994. Discount development in France: the introduction of the format and the
competitive response. Journal of Marketing Management 10 (2): 91-98.
Colla, E. 2003. International expansion and strategies of discount grocery retailers: the
winning models. International Journal of Retail & Distribution Management, 31 (1):
55-66.
Cronin, J. J., and S.W. Kelley. 2015. Identifying Competitive Boundaries: An Analysis of the
Impact of Competitive Situations on Consumers’ Perceptions of Retail Stores.
In Proceedings of the 1986 Academy of Marketing Science (AMS) Annual
Conference (pp. 242-245). Springer International Publishing.
Deleersnyder, B., M.G. Dekimpe, M. Sarvary and P.M. Parker. 2004. Weathering tight
economic times: The sales evolution of consumer durables over the business
cycle. Quantitative Marketing and Economics 2 (4): 347-383.
Deleersnyder, B., M. G. Dekimpe, J. B. E. Steenkamp, and O. Koll. 2007. Win–win
strategies at discount stores. Journal of Retailing and Consumer Services 14 (5): 309-
318.
Deleersnyder, B., M. G. Dekimpe, J. B. E. Steenkamp, and P.S. Leeflang. 2009. The role of
national culture in advertising's sensitivity to business cycles: An investigation across
continents. Journal of Marketing Research 46 (5): 623-636.

33
Dent, J. F. 1990. Strategy, organization and control: some possibilities for accounting
research. Accounting, Organizations and Society 15 (1): 3-25.
Dutt, P., and V. Padmanabhan. 2011. Crisis and consumption smoothing. Marketing
Science 30 (3): 491-512.
Engle, R. F. 1974. Band spectrum regression. International Economic Review 2 (1): 1-11.
Evans, J. D., and C.L. Green. 2000. Marketing strategy, constituent influence, and resource
allocation: An application of the Miles and Snow typology to closely held firms in
Chapter 11 bankruptcy. Journal of Business Research 50 (2): 225-231.
Federal Reserve Bank of St. Louis. 2010. Economic Data--FRED®. Available at
http://research.stlouisfed.org/fred2/ (last access June 2, 2016)
Field, A. 2000. Discovering statistics using SPSS for Windows: Advanced techniques. Sage
Publications
Franses, P. H. 2001. How to deal with intercept and trend in practical cointegration
analysis? Applied Economics 33 (5): 577-579.
Fuhrer, J. C. 2000. Habit formation in consumption and its implications for monetary-policy
models. American Economic Review 90 (3): 367-390.
Gibcus, P., and R.G.M. Kemp. 2003. Strategy and small firm performance. EIM Business &
Policy Research.
Gijsbrechts, E., K. Campo, and P. Nisol. 2008. Beyond promotion-based store switching:
Antecedents and patterns of systematic multiple-store shopping. International Journal
of Research in Marketing 25 (1): 5-21.
González-Benito, Ó. 2001. Inter-format spatial competition of Spanish hypermarkets. The
International Review of Retail, Distribution and Consumer Research 11 (1): 63-81.
Goodman, C. J., and S.M. Mance. 2011. Employment loss and the 2007–09 recession: an
overview. Monthly Labor Review 134 (4): 3-12.
Hair, J.F., R.E. Anderson, R.L. Tatham and W.G. Black. 1995. Multivariate data analysis.
Englewood Cliffs, NJ, Prentice Hall
Hambrick, D. C. 1983. Some tests of the effectiveness and functional attributes of Miles and
Snow's strategic types. Academy of Management Journal 26 (1): 5-26.
Harrigan, K. R. 1985. An application of clustering for strategic group analysis. Strategic
Management Journal 6 (1): 55-73.
Harvey, A. 2006. Forecasting with unobserved components time series models. Handbook of
Economic Forecasting, 1, 327-412.

34
Harvey, A. C., and A. Jaeger. 1993. Detrending, stylized facts and the business cycle. Journal
of Applied Econometrics 8 (3): 231-247.
Heerde, H. J. V., M.J. Gijsenberg, M.G. Dekimpe, and J.B.E. Steenkamp. 2013. Price and
advertising effectiveness over the business cycle. Journal of Marketing Research,
50 (2): 177-193.
Higgins, D., T.C. Omer, and J.D. Phillips. 2014. The influence of a firm's business strategy
on its tax aggressiveness. Contemporary Accounting Research 32 (2): 674-702
Hodrick, R. J., and E.C. Prescott. 1997. Postwar US business cycles: an empirical
investigation. Journal of Money, Credit, and Banking 1 (3): 1-16.
Holly, S., and M. Stannett. 1995. Are there asymmetries in UK consumption? A time series
analysis. Applied Economics 27 (8): 767-772.
Kamakura, W. A., and R.Y. Du. 2012. How economic contractions and expansions affect
expenditure patterns. Journal of Consumer Research 39 (2): 229-247.
Kim, W. C., and R. Mauborgne. 2005. Blue ocean strategy: from theory to practice. California
Management Review 47 (3): 105-121.
King, R. G., and S.T. Rebelo. 1993. Low frequency filtering and real business cycles. Journal
of Economic Dynamics and Control 17 (1): 207-231.
Kontolemis, Z. G. 1997. Does growth vary over the business cycle? Some evidence from the
G7 countries. Economica, 441-460.
Kukar-Kinney, M., and J. R. Carlson. 2015. A fresh look at consumers' discounting of discounts
in online and bricks-and-mortar shopping contexts. International Journal of Research
in Marketing 32 (4): 442-444.
Langfield-Smith, K. 1997. Management control systems and strategy: a critical
review. Accounting, Organizations and Society 22 (2): 207-232.
Lamey, L., B. Deleersnyder, M.G. Dekimpe, and J.B.E. Steenkamp. 2007. How business
cycles contribute to private-label success: Evidence from the United States and
Europe. Journal of Marketing 71 (1): 1-15.
Lamey, L., B. Deleersnyder, J.B.E. Steenkamp, and M.G. Dekimpe. 2012. The effect of
business-cycle fluctuations on private-label share: what has marketing conduct got to
do with it? Journal of Marketing 76 (1): 1-19.
Lamey, L. 2014. Hard economic times: a dream for discounters. European Journal of
Marketing 48 (4): 641-656.

35
Lee, S., M. Singal, and K.H. Kang. 2013. The corporate social responsibility–financial
performance link in the US restaurant industry: Do economic conditions
matter?. International Journal of Hospitality Management 32 (1): 2-10.
Little, P. L., J.W. Mortimer, M.A. Keene, and L.R. Henderson. 2011. Evaluating the effect
of recession on retail firms’ strategy using DuPont method: 2006-2009. Journal of
Finance and Accountancy 7 (1): 1-7.
Little, P. L., B.L. Little, and D. Coffee. 2009. The Du Pont Model: evaluating alternative
strategies in the retail industry. Academy of Strategic Management Journal 8 (1): 71-
89.
March, J. G. 1991. Exploration and exploitation in organizational learning. Organization
science 2 (1): 71-87.
Miles, R. E., and C. C. Snow. 1978. Organizational strategy, structure and process. New York:
McGraw-Hill.
Miles, R. E., and C. C. Snow. 2003. Organizational strategy, structure, and process. Stanford,
CA: Stanford University Press.
Mills, T. C. 2001. Business cycle asymmetry and duration dependence: An international
perspective. Journal of Applied Statistics 28 (6): 713-724.
McCall, M. D. 2011. Deep drop in retail trade employment during the 2007–09
recession. Monthly Labor Review 134 (4): 1-23.
Morschett, D., B. Swoboda, and H. Schramm-Klein. 2006. Competitive strategies in
retailing: an investigation of the applicability of Porter's framework for food
retailers. Journal of Retailing and Consumer Services 13 (4): 275-287.
Nissim, D., and S.H. Penman. 2001. Ratio analysis and equity valuation: From research to
practice. Review of Accounting Studies 6 (1): 109-154.
Porter, M. E. 1980. Competitive strategy. New York: Free Press.
Rhee, H., and D.R. Bell. 2002. The inter-store mobility of supermarket shoppers. Journal of
Retailing 78 (4): 225-237.
Ravn, M. O., and H. Uhlig, H. 2001. On adjusting the HP-filter for the frequency of
observations. The Review of Economics and Statistics 84 (2): 371-376.
Salerno, J. T. 2012. A reformulation of Austrian business cycle theory in light of the financial
crisis. Quarterly Journal of Austrian Economics 15 (1): 3-44.
Singleton, K. J. 1988. Econometric issues in the analysis of equilibrium business cycle
models. Journal of Monetary Economics 21 (2): 361-386.
36
Soliman, M. T. 2008. The use of DuPont analysis by market participants. The Accounting
Review 83 (3): 823-853.
Srinivasan, S. R., and S. N. V. Sivakumar. 2011. Strategies for retailers during
recession. Journal of Business and Retail Management Research 5 (1): 94-104.
Stock, J. H., and M.W. Watson. 1999. Business cycle fluctuations in US macroeconomic time
series. Handbook of Macroeconomics, 1, 3-64.
Treacy, M., and F. Wiersema. 1995. The discipline of market leaders. Reading, MA: Addison-
Wesley.
Utrilla, P. N. C., F.A.G. Torraleja, A.M. Vázquez, and M.A. Ogáyar. 2012. How does strategic
choice affect business results? A case study of mutual guarantee societies. International
Journal of Business and Management 7 (7): 51-58.
Walmart. 2015. Walmart 2015 Annual Report.
Ward, J. H. 1963. Hierarchical grouping to optimize an objective function. Journal of the
American Statistical Association 58 (301): 236-244.
Williamson, P. J., and M. Zeng. 2009. Value-for-money strategies for recessionary
times. Harvard Business Review 87 (3): 66-74.
Zielke, S., and M. Komor. 2015. Cross-national differences in price–role orientation and their
impact on retail markets. Journal of the Academy of Marketing Science 43 (2): 159-180.
Zurawicki, L., and N. Braidot. 2005. Consumers during crisis: responses from the middle class
in Argentina. Journal of Business Research 58 (8): 1100-1109.