Retail Lamps Study 3.1 - Energy.govLED lamp efficacy, flicker, and power quality performance did not...
44
Retail Lamps Study 3.1: Dimming, Flicker, and Power Quality Characteristics of LED A Lamps December 2014 Prepared for: Solid-State Lighting Program Building Technologies Office Office of Energy Efficiency and Renewable Energy U.S. Department of Energy Prepared by: Pacific Northwest National Laboratory
Transcript of Retail Lamps Study 3.1 - Energy.govLED lamp efficacy, flicker, and power quality performance did not...
Retail Lamps Study 3.1:Dimming, Flicker, and Power Quality Characteristics of LED A Lamps
December 2014
Prepared for:
Solid-State Lighting ProgramBuilding Technologies OfficeOffice of Energy Efficiency and Renewable EnergyU.S. Department of Energy
Prepared by:
Pacific Northwest National Laboratory
PNNL-SA-23944

1
Preface The U.S. Department of Energy (DOE) CALiPER program has been purchasing and testing general illumination solid-state lighting (SSL) products since 2006. CALiPER relies on standardized photometric testing (following the Illuminating Engineering Society of North America [IES] approved method LM-79-081) conducted by accredited, independent laboratories.2 Results from CALiPER testing are available to the public via detailed reports for each product or through summary reports, which assemble data from several product tests and provide comparative analyses.3 Increasingly, CALiPER investigations also rely on new test procedures that are not industry standards; these experiments provide data that is essential for understanding the most current issues facing the SSL industry.
It is not possible for CALiPER to test every SSL product on the market, especially given the rapidly growing variety of products and changing performance characteristics. Instead, CALiPER focuses on specific groups of products that are relevant to important issues being investigated. The products are selected with the intent of capturing the current state of the market at a given point in time, representing a broad range of performance characteristics. However, the selection does not represent a statistical sample of all available products in the identified group. All selected products are shown as currently available on the manufacturer’s web page at the time of purchase.
CALiPER purchases products through standard distribution channels, acting in a similar manner to a typical specifier. CALiPER does not accept or purchase samples directly from manufacturers to ensure that all tested products are representative of a typical manufacturing run and not hand-picked for superior performance. CALiPER cannot control for the age of products in the distribution system, nor account for any differences in products that carry the same model number.
Selecting, purchasing, documenting, and testing products can take considerable time. Some products described in CALiPER reports may no longer be sold or may have been updated since the time of purchase. However, each CALiPER dataset represents a snapshot of product performance at a given time, with comparisons only between products that were available at the same time. Further, CALiPER reports seek to investigate market trends and performance relative to benchmarks, rather than as a measure of the suitability of any specific lamp model. Thus, the results should not be taken as a verdict on any product line or manufacturer. Especially given the rapid development cycle for LED products, specifiers and purchasers should always seek current information from manufacturers when evaluating products.
To provide further context, CALiPER test results may be compared to data from LED Lighting Facts,4 ENERGY STAR® performance criteria,5 technical requirements for the DesignLights Consortium® (DLC) Qualified Products
1 IES LM-79-08, Approved Method for the Electrical and Photometric Measurements of Solid-State Lighting Products, covers LED-based SSL products with control electronics and heat sinks incorporated. For more information, visit http://www.iesna.org/. 2 CALiPER only uses independent testing laboratories with LM-79-08 accreditation that includes proficiency testing, such as that available through the National Voluntary Laboratory Accreditation Program (NVLAP). 3 CALiPER summary reports are available at http://www.ssl.energy.gov/reports.html. Detailed test reports for individual products can be obtained from http://www.ssl.energy.gov/search.html. 4 LED Lighting Facts® is a program of the U.S. Department of Energy that showcases LED products for general illumination from manufacturers who commit to testing products and reporting performance results according to industry standards. The DOE LED Lighting Facts program is separate from the Lighting Facts label required by the Federal Trade Commission (FTC). For more information, see http://www.lightingfacts.com. 5 ENERGY STAR is a federal program promoting energy efficiency. For more information, visit http://www.energystar.gov.

2
List (QPL),6 or other established benchmarks. CALiPER also tries to purchase conventional (i.e., non-SSL) products for comparison, but because the primary focus is SSL, the program can only test a limited number.
It is important for buyers and specifiers to reduce risk by learning how to compare products and by considering every potential SSL purchase carefully. CALiPER test results are a valuable resource, providing photometric data for anonymously purchased products as well as objective analysis and comparative insights. However, photometric testing alone is not enough to fully characterize a product—quality, reliability, controllability, physical attributes, warranty, compatibility, and many other facets should also be considered carefully. In the end, the best product is the one that best meets the needs of the specific application.
For more information on the DOE SSL program, please visit http://www.ssl.energy.gov.
6 The DesignLights Consortium Qualified Products List is used by member utilities and energy-efficiency programs to screen SSL products for rebate program eligibility. For more information, visit http://www.designlights.org/.
3
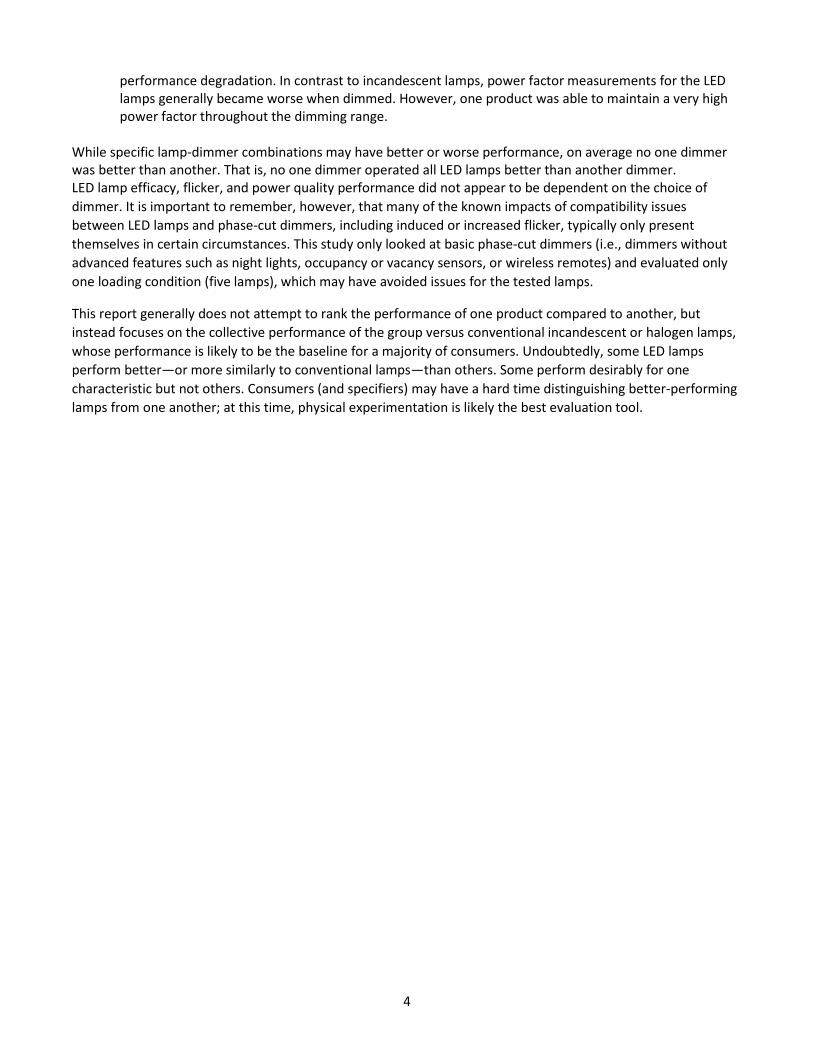
Report Summary To date, all three reports in the CALiPER retail lamps series have focused on basic performance parameters, such as lumen output, efficacy, and color quality. This report goes a step further, examining the characteristics of a subset of lamps from CALiPER Retails Lamps Study 3 in more detail. Specifically, this report focuses on the dimming, power quality, and flicker characteristics of 14 LED A lamps, as controlled by four different retail-available dimmers.
The results of this investigation clearly demonstrated three key impacts of dimming a LED lighting system with a phase-control device. First, installing a phase-cut dimmer will change the performance of any type of lighting system—even when the dimmer is set to full output. Second, the choice of dimmer can make a difference. Third, the change in performance is less predictable when dimming LED lamps than when dimming incandescent lamps—in some cases there may be almost no change, and in other cases, the change may be dramatic.
LED lamps clearly interact with and impact the performance of phase-cut dimmers in ways incandescent lamps do not. While the dimmer output (RMS voltage) at a given control setting was consistent for all the benchmark incandescent sources, the dimmer output at a given control setting varied noticeably for different LED lamps. This variation was more significant at lower control settings than at higher settings for all four evaluated dimmers. The relationship between the measured and normalized values was also fairly consistent across the four dimmers for the benchmark sources. The relationship for a given LED lamp, however, typically varied across the four dimmers. Most importantly, the minimum output light level achieved by a phase-cut dimmed LED lamp is a function of both the lamp’s capability and its impact on the dimmer being used to control it.
Key observations for specific dimming, flicker, or power quality characteristics include the following:
• LED lamps tended to have higher relative light output compared to the incandescent and halogen benchmark at the same dimmer output signal (i.e., RMS voltage). The lamps’ dimming curves (i.e., the relationship between their input control signal and relative light output) ranged from linear to very similar to the square-law curve typical of an incandescent lamp.
• LED lamps generally exhibited symmetrical behavior—the same dimming curve—when measured proceeding from maximum to minimum or minimum to maximum control signal.
• While few lamp-dimmer systems showed evidence of dimming asymmetry or dead travel, there were substantial differences in minimum dimmed level between lamps. However, averaged across the four dimmers, 11 out of 14 lamps dimmed to 10% or less of their light output when operated by a switch.
• Most LED lamps produced more relative light output at a given dimmer signal than the benchmark incandescent and halogen lamps. The dimming profiles fell on a continuum between purely linear and following a square-law curve.
• The ability of LED lamps to maintain their efficacy while dimming represents their most substantial performance advantage over incandescent lamps. The relative efficacy for all LED products was higher than for the benchmarks at any point in the dimming range, with meaningful reductions only occurring for some lamps when dimmed below approximately 20%.
• Half of the LED lamps tested produced approximately the same or less flicker (at any point over the dimming range) than the incandescent benchmarks. A few lamps demonstrated flicker performance more similar to that of a magnetically ballasted fluorescent lamp, which may be problematic for people who are sensitive to flicker. One lamp produced substantial flicker (even when switched), and would likely be objectionable to most users.
• All of the LED lamps met the ANSI C82.77-2002 PF and THD requirements when operated by a switch, and also when operated by a dimmer set to full output. The LED lamps performed somewhat worse than the incandescent benchmarks, but their reduced current draw also reduces the impact of this
4
performance degradation. In contrast to incandescent lamps, power factor measurements for the LED lamps generally became worse when dimmed. However, one product was able to maintain a very high power factor throughout the dimming range.
While specific lamp-dimmer combinations may have better or worse performance, on average no one dimmer was better than another. That is, no one dimmer operated all LED lamps better than another dimmer. LED lamp efficacy, flicker, and power quality performance did not appear to be dependent on the choice of dimmer. It is important to remember, however, that many of the known impacts of compatibility issues between LED lamps and phase-cut dimmers, including induced or increased flicker, typically only present themselves in certain circumstances. This study only looked at basic phase-cut dimmers (i.e., dimmers without advanced features such as night lights, occupancy or vacancy sensors, or wireless remotes) and evaluated only one loading condition (five lamps), which may have avoided issues for the tested lamps.
This report generally does not attempt to rank the performance of one product compared to another, but instead focuses on the collective performance of the group versus conventional incandescent or halogen lamps, whose performance is likely to be the baseline for a majority of consumers. Undoubtedly, some LED lamps perform better—or more similarly to conventional lamps—than others. Some perform desirably for one characteristic but not others. Consumers (and specifiers) may have a hard time distinguishing better-performing lamps from one another; at this time, physical experimentation is likely the best evaluation tool.

5
1 Introduction Testing results from the CALiPER retail lamps series, specifically Retail Lamps Study 3 (RRL3), showed that LED lamps have quickly improved and offer several advantages over conventional lamps. Most apparently, the LED lamps offered substantially higher efficacies than conventional lamps and usually provided sufficient light output—more than a dozen A19 lamps producing around 800 lm (roughly equivalent to a 60 W incandescent lamp) were tested. Further, most of the LED lamps had correlated color temperatures (CCTs) that were similar to the conventional lamps they were intended to replace, and CRIs that were good (80s) or excellent (90s). Nonetheless, such basic performance metrics do not always capture the entire performance of a lamp nor reveal the experience a consumer will have when using it.
This report examines the dimming, flicker, and power quality performance of the 14 LED A lamps examined in RRL3 that were listed as being dimmable,7 plus two conventional benchmarks. Flicker and dimming performance are especially important characteristics that may lead to an objectionable experience for consumers, who are often accustomed to the very smooth dimming and flicker-free performance of incandescent lamps. Before understanding the relative performance of the LED lamps, however, it is important to understand the issues themselves.
Dimming Not all LED lamps are designed to be dimmable, and those that are can exhibit different characteristics. The differences in performance are often related to the driver, which is responsible for interpreting the signal from a control device. The dimming performance of a given LED lamp can be dependent on other components in a lighting system, including the control device used and the characteristics of other light sources on the same circuit. This dependency is particularly prevalent for integral lamps controlled by phase-cut dimmers.
There is no standard definition for “dimmable,” and manufacturer claims of dimmability to date cannot be construed as guaranteeing any minimum level of performance. Besides changes in light output, other performance attributes may also change during dimming, including LED package efficacy, driver efficiency, chromaticity, flicker, and power quality.
The dimming performance of LED lamps controlled by phase-cut dimmers can be affected by the choice of dimmer. Some phase-cut dimmers interfere with the normal behavior of some LED lamps, and some LED lamps interfere with the normal behavior of some phase-cut dimmers. Such compatibility issues can result in many undesirable behaviors, including:
Lack of smoothness Dead travel (little or no change in light output, despite changes in dimmer setting) Pop-on or dropout (sudden change in light output not corresponding to the limit of the dimmer signal) Flashing or ghosting Audible noise Reduced lifetime or reliability of the dimmer Reduced lifetime or reliability of the LED product
The prevalence of these behaviors (some of which are depicted in Figure 1) in early experiences with LED products has effectively caused LED dimming performance to be highly unpredictable. More information on phase-control dimming issues and their causes, as well as suggestions for dealing with them, can be found in the
7 One LED lamp, RT13-11, was not listed as being dimmable. Some results from this lamp are also discussed, but the data is not presented in charts unless otherwise noted. A separate note on RT13-11 is provided in Appendix A. A dimmable version of the same lamp was available, but it was not purchased.

6
GATEWAY report Dimming LEDs with Phase-Cut Dimmers: The Specifier’s Process for Maximizing Success,8 and in the National Electrical Manufacturers Association (NEMA) Lighting Systems Division document LSD 49-2010, Solid State Lighting for Incandescent Replacement—Best Practices for Dimming.9
Flicker All conventional light sources—including incandescent, high-intensity discharge, and fluorescent—modulate luminous flux and intensity, whether visible or not. Many terms are used when referring to this time variation, including “flicker,” “flutter,” and “shimmer.” LED flicker characteristics are primarily a function of the LED driver. Dimming an LED source can increase or induce flicker, most notably when phase-cut controls are used and/or pulse-width modulation (PWM) is employed within the driver to reduce the average light output from the LED source.
Low-frequency flicker can induce seizures in people with photosensitive epilepsy, and the flicker in magnetically ballasted fluorescent lamps used for office lighting has been linked to headaches, fatigue, blurred vision, eyestrain, and reduced visual task performance for certain populations. Flicker can also produce hazardous phantom array effects—which may lead to distraction when driving at night, for example—or stroboscopic effects, which may result in the apparent slowing or stopping of moving machinery in an industrial setting.
The photometric flicker found in electric light sources is typically periodic, with its relative-light-output-versus- time waveform characterized by variations in amplitude, average level, periodic frequency (cycles per unit of time), shape, and, in some cases, duty cycle. The IES has defined two metrics for quantifying flicker: Flicker Index and Percent Flicker. More information on flicker can be found in a DOE Fact Sheet on the topic.10
Power Quality Electric power is delivered through a complex system of generators, transmission lines, and distribution networks to widely varying end-use circuits comprised of interconnected loads. Power quality broadly describes
8 Available at: http://apps1.eere.energy.gov/buildings/publications/pdfs/ssl/2013_gateway_dimming.pdf 9 Available at: http://apps1.eere.energy.gov/buildings/publications/pdfs/ssl/ssl_nema-lsd_july2010.pdf 10 Available at: http://apps1.eere.energy.gov/buildings/publications/pdfs/ssl/flicker_fact-sheet.pdf
Figure 1. Potential behaviors when dimming LED lamps or luminaires. The plot shows light output (from zero to maximum) versus the dimmer setting (referring to the dimmer conduction time, phase angle, mechanical position of a knob, or Vrms). Many other behaviors are not shown. Adapted from NEMA SSL 6-2010, Solid State Lighting for Incandescent Replacement – Dimming.

7
the fitness of electric power to drive electric loads in a manner that allows them to function as intended without significant reduction in performance or lifetime. Power quality is a system characteristic, not a component characteristic. The power quality of an electric system is determined by the characteristics of the system components—including generators, switching devices, transformers, and ultimately loads—and how those interconnected components interact with each other.
Electric power can be of poor quality in many ways, including (but not limited to): poor synchronization of the voltage frequency and phase across subsystems, transient increases or decreases to the root mean square (RMS) voltage that occur over time frames ranging from milliseconds to minutes (or more, in the case of outages), and harmonic distortions to voltage or current waveforms. There are many potential causes of poor-quality power, including (but not limited to): network or load switching events, currents induced by lightning strikes, and reactive (energy-storing) or non-linear loads.
Power quality is a significant potential concern for multiple stakeholder groups and may lead to higher financial costs as well as possibly degraded performance of, or damage to, electric networks and loads. Electric utilities are most affected by power quality, and as a result are most broadly concerned about new equipment deployment and other changes in electric systems. Degradation in the power quality of a utility system or subsystem can result in resonance in distribution networks, increased transmission and distribution losses, a need to install transmission and distribution infrastructure with higher power/current handling capability, and possibly even a need for increased generation capacity.
Building owners and operators need to beware of significant connected-load changes that might degrade building power quality and lead to potentially higher electricity costs resulting from a utility “power factor charge,” or to safety-related issues resulting from increased neutral wire currents. Building occupants may also be affected by degraded power quality, which can lead to increased electrical service interruptions and associated downtime—resulting from a greater occurrence of circuit breaker trips or power supply overloads and resets. Further, distorted input voltage waveforms can also lead to degraded equipment performance, or in rare cases outright failure. Concerns about power quality have led to the development of equipment specifications by various standards organizations.11 To date, the CALiPER program is not aware of any LED installations that have led to problematic reductions in the power quality of the building.
CALiPER Dimming, Flicker, and Power Quality Testing Although dimming, flicker, and power quality are important performance characteristics, the CALiPER program to date has largely focused on photometric performance of LED lamps and luminaires. However, widespread improvements in photometric performance and increasing adoption of LED products have led to heightened interest in a broader set of performance characteristics. As a result, CALiPER intends to follow up (when warranted) the reporting of photometric performance with additional analysis that takes advantage of specially developed laboratory testing capabilities. This is the second report series to include this type of analysis, following CALiPER Report 20.2, Dimming, Flicker, and Power Quality Performance of LED PAR38 Lamps.12
As is standard practice for CALiPER, the goal was not to determine the best-performing products. Instead, the test results are compared against established thresholds and benchmark conventional lamps, with additional analysis focused on identifying variation and trends in performance.
11 In North America, ANSI C82.77-2002 currently contains perhaps the most appropriate power quality performance recommendations specifically for lighting equipment. 12 Available at: http://energy.gov/eere/ssl/led-par38-lamps
8
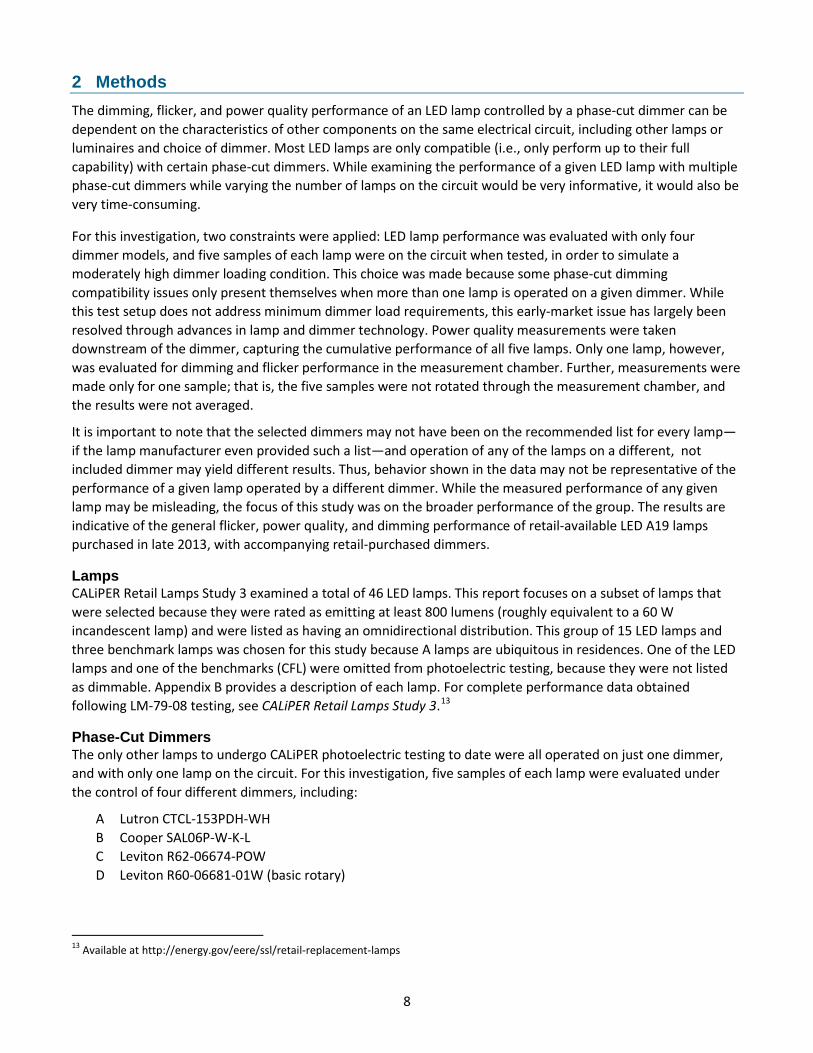
2 Methods The dimming, flicker, and power quality performance of an LED lamp controlled by a phase-cut dimmer can be dependent on the characteristics of other components on the same electrical circuit, including other lamps or luminaires and choice of dimmer. Most LED lamps are only compatible (i.e., only perform up to their full capability) with certain phase-cut dimmers. While examining the performance of a given LED lamp with multiple phase-cut dimmers while varying the number of lamps on the circuit would be very informative, it would also be very time-consuming.
For this investigation, two constraints were applied: LED lamp performance was evaluated with only four dimmer models, and five samples of each lamp were on the circuit when tested, in order to simulate a moderately high dimmer loading condition. This choice was made because some phase-cut dimming compatibility issues only present themselves when more than one lamp is operated on a given dimmer. While this test setup does not address minimum dimmer load requirements, this early-market issue has largely been resolved through advances in lamp and dimmer technology. Power quality measurements were taken downstream of the dimmer, capturing the cumulative performance of all five lamps. Only one lamp, however, was evaluated for dimming and flicker performance in the measurement chamber. Further, measurements were made only for one sample; that is, the five samples were not rotated through the measurement chamber, and the results were not averaged.
It is important to note that the selected dimmers may not have been on the recommended list for every lamp—if the lamp manufacturer even provided such a list—and operation of any of the lamps on a different, not included dimmer may yield different results. Thus, behavior shown in the data may not be representative of the performance of a given lamp operated by a different dimmer. While the measured performance of any given lamp may be misleading, the focus of this study was on the broader performance of the group. The results are indicative of the general flicker, power quality, and dimming performance of retail-available LED A19 lamps purchased in late 2013, with accompanying retail-purchased dimmers.
Lamps CALiPER Retail Lamps Study 3 examined a total of 46 LED lamps. This report focuses on a subset of lamps that were selected because they were rated as emitting at least 800 lumens (roughly equivalent to a 60 W incandescent lamp) and were listed as having an omnidirectional distribution. This group of 15 LED lamps and three benchmark lamps was chosen for this study because A lamps are ubiquitous in residences. One of the LED lamps and one of the benchmarks (CFL) were omitted from photoelectric testing, because they were not listed as dimmable. Appendix B provides a description of each lamp. For complete performance data obtained following LM-79-08 testing, see CALiPER Retail Lamps Study 3.13
Phase-Cut Dimmers The only other lamps to undergo CALiPER photoelectric testing to date were all operated on just one dimmer, and with only one lamp on the circuit. For this investigation, five samples of each lamp were evaluated under the control of four different dimmers, including:
A Lutron CTCL-153PDH-WH B Cooper SAL06P-W-K-L C Leviton R62-06674-POW D Leviton R60-06681-01W (basic rotary)
13 Available at http://energy.gov/eere/ssl/retail-replacement-lamps

9
These dimmers were chosen based on their widespread availability to consumers, specifically at national home improvement retailers. Dimmers A, B, and C were chosen because they specifically indicated suitability for LED lamps (in addition to incandescent and CFL). Dimmer D was chosen due to its low cost, which might be important to a consumer. Importantly, all four dimmers provided similar basic user functionality; none of them incorporated advanced user features such as a night light, occupancy or vacancy sensor, or wireless remote. All of the dimmers were purchased in early 2014. More information about the dimmers is available in Appendix C.
All of the LED lamps and benchmarks were also analyzed when operated by a switch, providing a baseline for the other measurements. This is an important measurement condition, because the performance of a lamp (of any type, including incandescent) when connected to a dimmer set to provide the maximum light output is not necessarily the same as the performance when connected to a switch.
Test Apparatus and Equipment A semi-automated test setup developed by PNNL was used to evaluate the dimming, flicker, and power quality performance of the lamps. The measurement system consisted of a light-impermeable box, a photosensor (UDT Model 211), a transimpedance amplifier (UDT Tramp) with a 5 V output and variable gain, a digital oscilloscope (Tektronix DPO2014), and software that was custom-developed using National Instruments LabVIEW. The system sampled and digitized 125,000 photosensor measurements to characterize the variation in luminous flux, and calculated an average output level as well as various flicker metrics. The absolute measurements of illuminance captured by the photosensor are dependent on the position of the light source in the light-impermeable box, which does not function as an integrating sphere. Test samples were not manipulated to ensure a consistent distance between their emitting surface and the photosensor or a consistent peak-output from the photosensor. As a result, the raw data digitized from the photosensor was normalized to the maximum value recorded for each waveform.
Power quality calculations were made from light source input current and voltage measurements, using a calibrated Yokogawa WT210 Digital Power Meter. The custom-developed software also controlled the WT210 and logged its measurement data.
At this time, there is no standardized test procedure for characterizing the dimming performance of LED (or other) light sources, or for measuring flicker. The test setup and procedure used to obtain this dataset generally followed the practices specified in IES LM-79-08. All test samples were operated at full light output for a minimum of 30 minutes prior to evaluation, in order to reach thermal equilibrium. Lamp temperatures and other operating characteristics (e.g., power and light output) were not monitored during this warm-up time to determine stability; rather, 30 minutes was assumed to be sufficient, based on previous experience with integral LED lamp products. In order to minimize testing time, dimmable test samples were not allowed to establish a new thermal equilibrium at each dimmed measurement point—resulting in some deviation from IES LM-79-08 specifications. Flicker and power quality measurements were made immediately after establishing each target dimmed-output level. Measurement time per sample was minimized and relatively consistent, due to the automated data acquisition.
The transimpedance amplifier gain was adjusted for each measurement, to ensure that the peak output voltage presented to the oscilloscope for digitization was between 0.5 and 5.0 V. The average value of the photosensor measurement made for each sample when operated by a switch was used to normalize all subsequent dimmed measurements of that sample, facilitating comparisons between products for relative dimmed light output and relative efficacy.
Measurement Procedure For each lamp model being evaluated, flicker and power quality characteristics were first recorded when the test circuit was operated by the switch, then at a series of measurement points when operated by one of the
10
dimmers. For this study, dimmed measurements were taken by operating the control from both its maximum-to-minimum signal (i.e., high-to-low sequence) and minimum-to-maximum signal (i.e., low-to-high sequence), in order to investigate the potential for pop-on and pop-off, dead travel at either end, and dimming asymmetry.
A test operator manually adjusted the dimmer while monitoring the RMS Voltage delivered to the lamp, with the intent of taking measurements at or near 10 predetermined targets: maximum voltage, minimum voltage, and eight equally spaced voltages in between. This method was utilized because the dimmers did not have programmable presets, and physically adjusting the devices to specific positions was not repeatable. Critically, this method controls for any non-linearity in the relationship between the dimmer position and the output signal. Thus, the resulting data is focused only on the lamp’s response to the dimming control signal.
In some cases, it was not possible to reach certain predefined target dimmer voltages—typically at the low end of the dimming range—likely due to electrical interactions between the lamps and dimmer. Because the actual measured dimmer voltages were recorded instead of the targets, and the relative or normalized dimmer output control signals were plotted, the effect of this behavior may not be apparent in the charts within this report. While the procedure was designed to capture photoelectric behavior as best as possible, this is one example of how numerical data may not perfectly correspond to a user’s experience.
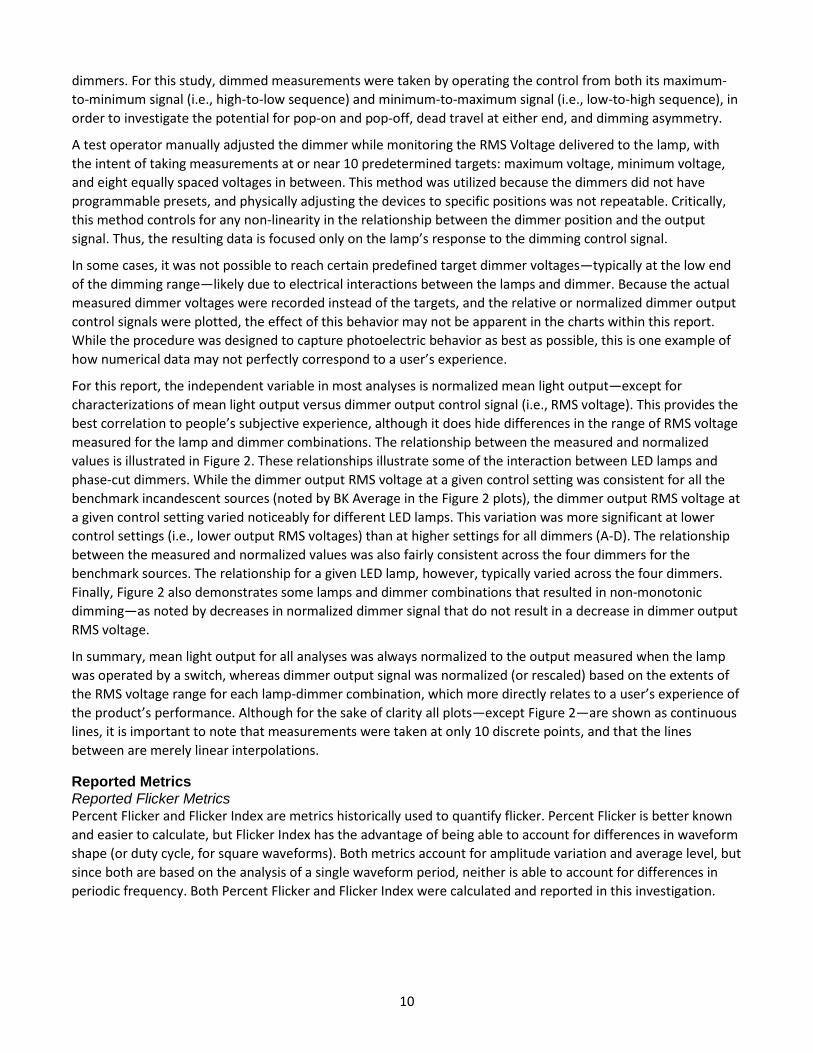
For this report, the independent variable in most analyses is normalized mean light output—except for characterizations of mean light output versus dimmer output control signal (i.e., RMS voltage). This provides the best correlation to people’s subjective experience, although it does hide differences in the range of RMS voltage measured for the lamp and dimmer combinations. The relationship between the measured and normalized values is illustrated in Figure 2. These relationships illustrate some of the interaction between LED lamps and phase-cut dimmers. While the dimmer output RMS voltage at a given control setting was consistent for all the benchmark incandescent sources (noted by BK Average in the Figure 2 plots), the dimmer output RMS voltage at a given control setting varied noticeably for different LED lamps. This variation was more significant at lower control settings (i.e., lower output RMS voltages) than at higher settings for all dimmers (A-D). The relationship between the measured and normalized values was also fairly consistent across the four dimmers for the benchmark sources. The relationship for a given LED lamp, however, typically varied across the four dimmers. Finally, Figure 2 also demonstrates some lamps and dimmer combinations that resulted in non-monotonic dimming—as noted by decreases in normalized dimmer signal that do not result in a decrease in dimmer output RMS voltage.
In summary, mean light output for all analyses was always normalized to the output measured when the lamp was operated by a switch, whereas dimmer output signal was normalized (or rescaled) based on the extents of the RMS voltage range for each lamp-dimmer combination, which more directly relates to a user’s experience of the product’s performance. Although for the sake of clarity all plots—except Figure 2—are shown as continuous lines, it is important to note that measurements were taken at only 10 discrete points, and that the lines between are merely linear interpolations.
Reported Metrics Reported Flicker Metrics Percent Flicker and Flicker Index are metrics historically used to quantify flicker. Percent Flicker is better known and easier to calculate, but Flicker Index has the advantage of being able to account for differences in waveform shape (or duty cycle, for square waveforms). Both metrics account for amplitude variation and average level, but since both are based on the analysis of a single waveform period, neither is able to account for differences in periodic frequency. Both Percent Flicker and Flicker Index were calculated and reported in this investigation.
11
Reported Power Quality Metrics Power quality is commonly associated with power factor (PF) and total harmonic distortion (THD). Power factor is the ratio between active (or real, or consumed) power (measured in watts) and apparent power (measured in volt-amps [VA]). Power factor can be fundamentally degraded by displacement between voltages and current waveforms, distortion of the voltage waveform, and/or distortion of the current waveform. The PF of a system with a purely sinusoidal voltage and current can only be degraded by displacement. The PF of a system is sometimes approximated by computing the displacement between the fundamental voltage and current waveform. This calculation is sometimes referred to as the displacement power factor, as opposed to the total (or true) power factor, which accounts for all harmonic voltages and currents that comprise the apparent power.
Total harmonic distortion is a measure of waveform distortion that can be calculated for voltage (THD-V) or current (THD-I). Since PF accounts for both waveform displacement and distortion while THD is only a measure of distortion, THD is inherently limited for a given PF. THD can be calculated in at least two different ways that deliver dramatically different results:
Figure 2. Measured dimmer signal versus normalized dimmer signal. These plots illustrate differences in voltage range that are not apparent in subsequent plots, due to the normalization procedure.

12
One method (described in ANSI C82.77-2002, IEEE 519-1992, and IEC 61000-2-2) computes the ratio of the RMS value of the 2nd- to Kth-order voltage or current harmonics (where K is typically somewhere between 40 and 50) to that of the fundamental (1st-order, or K=1) frequency component. This method is often referred to as THD (fundamental). Notably, this computation can, and often does, lead to values greater than 100%.
A second method (described in CSA C22.2) computes the ratio of the RMS value of the 2nd- to Kth-order voltage or current harmonics to the RMS value of all the voltage or current (i.e., 1st- to Kth-order) harmonics. This method is sometimes referred to as TDD, or total demand distortion, and its computation will always lead to values less than 100%.
The method that results in the calculation of THD (fundamental) is more commonly used and valued. The power quality metrics reported here include (true) power, RMS current (Irms), (true or total) power factor, and current THD relative to the fundamental frequency component (THD-I, fundamental).

13
3 Results and Analyses As previously stated, the performance of each lamp on each dimmer used in this study is not necessarily indicative of its performance on dimmers not included in this study. For example, if the lamp manufacturer provided a recommended dimmer list and the dimmer used was not on the list, less-than-ideal performance would be expected. The results provided in subsequent charts do not always explicitly identify each product; the purpose of the charts is to illustrate trends rather than the performance of a given product.
Dimmers at Full Output versus Switched Operation Summary figures displaying test results for each product when operated by a switch and a dimmer at full output are provided in Appendix D. Note that given the large number of iterations, the data is summarized based on the dimmer model or lamp model—both presentations show the same data, just grouped differently. The colored bars show the mean change from switched to dimmed operation across the dimmer or lamp type, as identified on the x-axis, with the error bars showing the maximum and minimum change. The charts grouped by dimmer model include 28 measurement points per dimmer for the LED products, because comparisons can be made for both the high-low and low-high sequences (i.e., 14 products × 2 sequences = 28). The number of measurements for the incandescent/halogen benchmarks, of which there were only two products, is fewer. The charts grouped by lamp type include eight measurements per type (i.e., 4 dimmers × 2 sequences = 8). In all cases throughout this report, the incandescent and halogen benchmark measurements have been averaged because they are very similar; they are referred to as the incandescent benchmark (BK).
As soon as a dimmer is introduced into the lighting system—replacing a switch—the performance of the system will change, regardless of the source type. With incandescent lamps, the change is very predictable; that is, the measurement range (shown as deviation bars) in the charts of Appendix D is very small for the incandescent lamps. When connected to a dimmer set to full output, on average the incandescent benchmark current dropped by approximately 0.1 A, power draw decreased by 2.6 W, efficacy decreased by about 5%, light output decreased by 9%, flicker metrics increased by less than 2%, and THD-I went from approximately 0% to 15%. The increase in THD-I did not result in a noticeable increase in PF. While the performance change for incandescent products on a given dimmer is similar from lamp to lamp, there was a substantial difference between the four dimmers, as shown in Figure D1. For all recorded values, dimmer A resulted in the greatest change, with dimmers B, C, and D each resulting in less change.14 Many times, the average change in performance for the incandescent lamps operated by dimmer A was at least three times greater than the change when operated by dimmer D. For example, when operated by dimmer A, on average the two incandescent lamps emitted about 83% of the light as when operated by the switch, but when operated by dimmer D, the basic rotary dimmer, they emitted about 97% of the light as when operated by the switch. These results reinforce the understanding that, for incandescent sources, the choice of dimmer effectively determines dimming performance.
The influence of dimmer choice on lamp performance was also evident, and for the most part consistent, for the LED products—at least for mean performance—but there was much greater variation, and less predictability, among the LED products, as shown in Figure D1. Notably, the dimmer that resulted in performance most similar to the switch was the basic rotary dimmer intended for use with incandescent lamps. Figure D2 further illustrates the variation in performance, but is averaged across all four dimmer models. The following observations can be made:
The full output signal (i.e., RMS voltage) provided by the dimmer was generally independent of lamp type (incandescent or LED) or model.
14 While the dimmer designation and performance were correlated, this was not an intended or expected outcome.

14
All but one LED lamp-dimmer combination delivered relative light output that was higher than the lowest benchmark measurement. In fact, the LED products tended to show much less change in output when operated on the dimmer than the incandescent benchmarks; some combinations even resulted in an increase in output relative to operation by the switch.
As with light output, when operated on a dimmer instead of a switch, LED lamps tended to exhibit smaller changes in efficacy than incandescent lamps, which decreased in efficacy anywhere from approximately 2% and 10%, depending on the dimmer make and model. The efficacy of one LED lamp increased on all four dimmers, and all 14 LED lamps averaged less than a 4% change across all four dimmers.
While LED lamps compared favorably with incandescent lamps in terms of change in light output and efficacy—at least if consistency from one device to another is considered favorable—they cannot compete in terms of power factor, as expected. While the power factor of the incandescent lamps essentially did not change, regardless of the choice of dimmer, the LED products exhibited a wide range of behaviors. Some products, such as 13RT-04, 13RT-06, and 13RT-12, barely changed at all, regardless of the connected dimmer. In contrast, products 13RT-08 and 13RT-10 exhibited substantial declines in power factor (-0.18 and -0.14, respectively) that were relatively consistent across the four dimmer models. Yet another product, 13RT-09, exhibited the largest decline in power factor, on average, but when operated by one type of dimmer (D), showed no decline at all.
As with power factor, the LED lamps exhibited a wide range of change in flicker characteristics when operated on a dimmer instead of a switch. Product 13RT-13, for example, saw substantial increases in flicker index (0.09, on average)—although with percent flicker already at 100% on the switch, there was no change noted for that metric. On the other hand, over half of the LED products exhibited little change in flicker, quantified by either metric. With the exception of one product, 13RT-04, on some dimmers, LED A lamp flicker characteristics were worse when operated by a dimmer at full output than when operated by a switch.
In summary, there are three key takeaways. First, installing a dimmer will change the performance of any type of lighting system—even when the dimmer is set to full output. Second, the choice of dimmer can make a difference. Third, the change in performance is less predictable when using LED lamps than when using incandescent lamps—in some cases there may be almost no change, and in other cases the change may be dramatic.
Dimmer Output Signal There was some variation in the mean minimum and mean maximum RMS voltage provided by each dimmer (averaged over the 14 lamp types). The mean maximum RMS voltages were 113.8 V, 115.2 V, 117.6 V, and 118.4 V for dimmer models A, B, C, and D, respectively. The mean minimum RMS voltages were 32.7 V, 32.4 V, 30.5 V, and 36.0 V. More importantly, some individual lamp-dimmer combinations resulted in a substantially higher minimum dimmer output signal, as seen in Figures 3 and 4. For example, the combination of lamp type 13RT-09 and dimmer D resulted in a minimum RMS voltage of 45.0 V, whereas the highest minimum RMS voltage among the other three dimmers was only 30.8 V. The difference in variation for maximum RMS voltage was much smaller, with all measurements between 110.6 and 120.1 V. While users can only relate dimmer position and light level, a difference in delivered RMS voltage usually manifests as a difference in light output; at higher minimum RMS voltages, the minimum light level is also typically higher.
Notably, Figure 3 demonstrates that the measured dimmer output signal is a function of both the lamp and dimmer, as there were differences for the mean and range of values for minimum RMS voltage across both the lamp and dimmer models. Additionally, the mean minimum RMS voltage among the four dimmers was not the same when LED lamps were connected, as opposed to the benchmark lamps.

15
Importantly, the variation in maximum or minimum dimmer output signal is not apparent in the subsequent analysis, which relies on normalized RMS voltages or normalized light output as the independent variables. This choice was necessary to provide consistency and comparability in the data. The primary reason for including this analysis was to fully characterize the performance of the lamps and dimmers, illustrate the effect that LED lamps have on phase-cut dimmer (and therefore system) performance, and perhaps most importantly note that the minimum output level achieved by a phase-cut dimmed LED lamp is both a function of the lamp’s capability and its impact on the dimmer being used to control it.
Figure 3. Mean and range of the minimum dimmer signal (Vrms), averaged across dimmer (top) and lamp (bottom). Both dimmer and lamp contributed to the variation in measured values; some lamps were more stable than the others, and some dimmers were more stable than the others. Overall, the LED-based systems exhibited much greater variability than the benchmark lamps.

16
Dimming Characteristics Incandescent lamps are considered by many to have definitive dimming characteristics: they dim smoothly to very low levels, do not noticeably flicker, and do not impair power quality (i.e., they have near-unity PF). Further, the lifetime of incandescent lamps increases when they are dimmed. One important negative to dimming incandescent lamps, however, is that their already-low efficacy decreases substantially. Another important characteristic to mention—although it is not analyzed in this report—is that incandescent lamps shift to a warmer color temperature as they are dimmed. In many cases, this has come to be seen as desirable, but such a shift may also be undesirable.
Figure 4. Mean and range of the maximum dimmer signal (Vrms), averaged across dimmer (top) and lamp (bottom). Compared to minimum dimmer signal, there was much less variation in performance, with the range of LED performance similar to that of the benchmark lamps. This level of variation has few, if any, practical implications.

17
The dimming performance of incandescent (and halogen) lamps is highly consistent; that is, there is very little variation from one make and model to the next—as shown in the data obtained during this and other CALiPER investigations. In contrast, LED lamps exhibit a wide range of dimming performance characteristics. The analyses performed in this study quantify that variation for relative light output, flicker, and power quality performance at full and at various dimmed outputs. Figure 5 is a plot of normalized15 mean light output (averaged across all four dimmer models and two measurement sequences) versus normalized mean dimmer output signal (RMS voltage) for the 14 dimmable LED products included in this investigation. Also shown is the average of the two evaluated incandescent products. Key observations include:
The LED products exhibited a variety of dimming curves; that is, for any given normalized dimmer output signal (RMS voltage), the various LED lamps produced a wide range of light output. For example, at about 50% of the maximum signal, an incandescent lamp would produce about 15% of the light output it would produce on a switch, whereas the LED products produced between approximately 14% and 55%.
None of the LED products exhibited dead travel on all dimmers—which would have resulted in dead travel appearing in the average dimming curve shown in Figure 5. Dead travel was evident with some lamp-dimmer combinations, but not consistently with the same LED lamp or the same dimmer.
Two LED products, both having similar dimming curves, did not dim below an average of about 23% on the four dimmers.
Several LED products exhibited a dimming response curve that was very similar to the benchmark
15 Light output was normalized to the value when the product was operated on a switch. Thus, not all products show a mean output of 1.0 when operated at full dimmer output in Figure 5.
Figure 5. Dimming curves for the 14 dimmable LED lamps and the average of the two halogen benchmarks (BK). Some of the LED products exhibited a linear dimming response (A), some exhibited a partially adjusted curve (B), and some exhibited a response closer to the benchmark (C).
18
incandescent lamps (group C). Other products had a nearly linear response (group A), and others fell somewhere in between (group B).
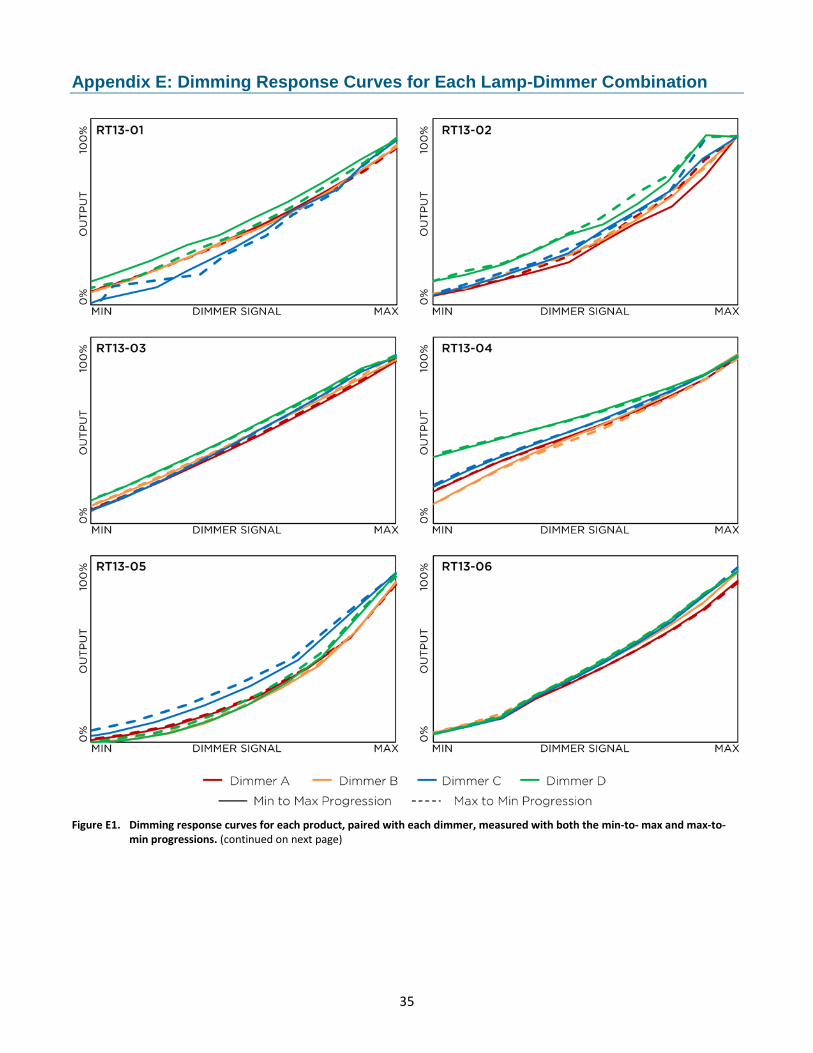
While Figure 5 is useful for broadly comparing the LED lamps, it provides little information about the effect of the different dimmers on a particular lamp’s dimming curve or about the overall effect of a dimmer across different lamps. In fact, the mean light output curves mask several dimmer-dependent characteristics. Appendix E provides a plot of dimming performance for each individual lamp. Each plot shows the lamp performance when operated by all four dimmers and for both high-low (HL) and low-high (LH) measurement sequences. While a majority of the lamps exhibited similar dimming curves regardless of the dimmer, several did not. For example, three products (RT13-02, RT13-08, and RT13-09) exhibited a small amount of high-end dead travel on at least one dimmer; all three of these lamps experienced this behavior on dimmer D, the basic rotary dimmer, and one lamp also exhibited similar behavior when operated by dimmer C. For products RT13-02 and RT13-09, the dead travel effectively offsets the dimming curve, resulting in a comparatively higher light output at a given control signal throughout the dimming range.
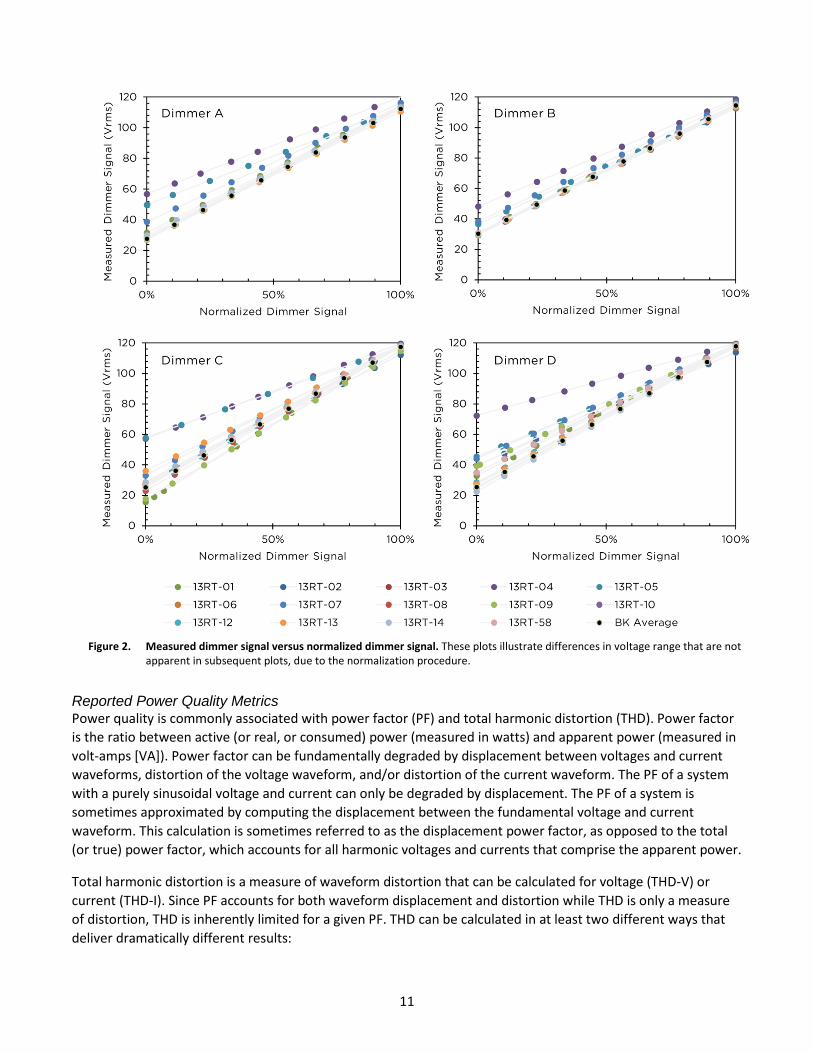
Also shown in Appendix E is the fact that some lamps-dimmer combinations (e.g., 13RT-04 operated by dimmer D and 13RT-07 operated by dimmers D and A) did not result in the same minimum light output level. Figure 6 shows the mean relative minimum output and range of minimum output across the four dimmers for each lamp. Half (seven) of the LED products dimmed below 10% light output on all four dimmers, whereas five of the lamps dimmed below 10% on two or three of the dimmers; the highest minimum output values typically (but not always) occurred with dimmer D.
Appendix F provides plots of several measured characteristics averaged across the four dimmers. These plots can be used to identify any systemic differences related to the specific dimmer, although care must be taken
Figure 6. Mean and range in minimum light output for each product paired with the four dimmers. Several of the LED products exhibited consistently low minimum light outputs, whereas two products exhibited both high average minimum light outputs and high variability from dimmer to dimmer.

19
because they represent average performance. In the plot of light output versus signal (E1), for example, dimmer D tended to lead to dimming curves that are approximately 5% higher than those for dimmers A or B at any given normalized RMS voltage. However, further analysis shows that this increase was predominantly due to one outlier, lamp 13-09,16 for which high-end dead travel resulted in considerably higher output throughout the dimming range. Dimmer C behaved similarly to dimmers A and B at the low end of the dimming range, but somewhere between dimmers D and A or B at the higher end of the range. A key takeaway is that while specific lamp-dimmer combinations may have better or worse performance, on average no one dimmer was better than another. That is, no one dimmer operated all LED lamps better than another dimmer.
Efficacy over Dimming Range Perhaps the most notable dimming-related weakness of incandescent lamps is their reduction in efficacy—all the way down to nearly zero—as they are dimmed. In contrast, the average relative (to the value when operated by the switch) efficacy, across all four dimmers, of more than a quarter of the LED products stayed above 90% throughout the entire dimming range, as shown in Figure 7.17 Further, the relative efficacy of every LED product was above 80% when the light output was above 20%. Both Figure 8 and Appendix F illustrate little variance in efficacy based on the dimmer used to control the lamps; that is, the efficacy performance is a function of the lamp alone. Further, minimum efficacy is a function of the minimum relative light output, so comparing only the minimum efficacy of lamps across the dimming range would be misleading. Those lamps that appear to have the greatest reduction in efficacy are those that dim to the lowest level. As very low light levels are approached, the
16 The data for the combination of lamp 13-09 and dimmer D were consistent for the high-low and low-high sequences, indicating that this is not a measurement anomaly. 17 For this and other subsequent figures, mean (normalized) lumen output is used as the independent variable plotted on the x-axis. This presentation was chosen because it relates most directly to the human experience. Choosing other independent variables, such as dimmer output signal, changes the shape of the curve, but not necessarily the performance of the various products relative to each other.
Figure 7. Efficacy versus lumen output for each product type, averaged over all dimmer models and measurement sequences. One substantial dimming-related advantage for LEDs is that they maintain their full-output efficacy over much of their dimming range. The red plus sign indicates the normalization point, or the performance of all products operated by the switch.

20
relative power consumption of electronic components (i.e., the driver) compared to the total power consumption increases, thus reducing the efficacy. By definition, once the lamp stops emitting light, the efficacy is zero.
Flicker over Dimming Range As illustrated in Figures 9 and 10, the LED product flicker performance ranged from better than incandescent to much worse than magnetically ballasted fluorescent—based on full-output thresholds from past CALiPER measurements. Notably, the average measured percent flicker performance for several LED lamps degraded significantly when relative light output dropped below about 15%; a similar increase was captured for flicker index, although the increase is small and difficult to distinguish in Figure 9.
Figure 8. Average efficacy (from two sequences) for each lamp and each dimmer. With a few exceptions (e.g., 13-09), the lamps tended to perform similarly across all of the dimmer types.

21
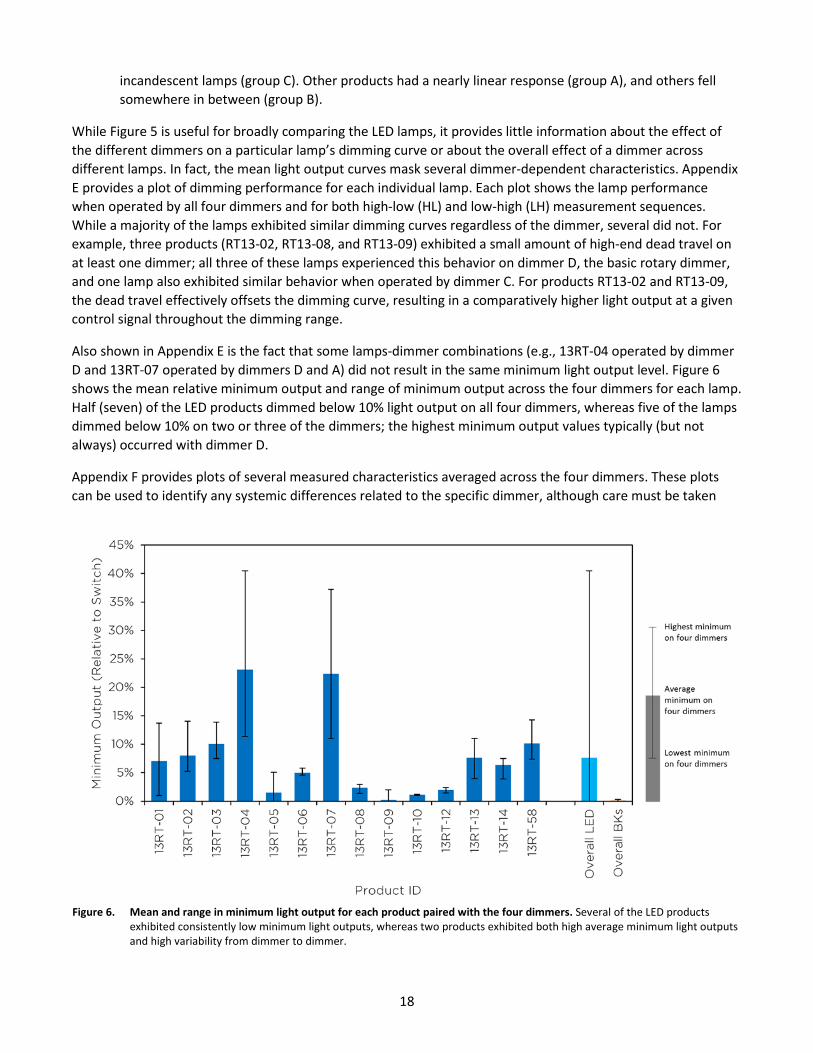
As was the case for the PAR38 lamps tested by CALiPER in Series 22, the RRL3 A lamps’ flicker performance fell into three distinct groups. One group exhibited minimum flicker at the high and low ends of the dimming range, with relatively higher flicker in the middle of the range—essentially appearing as an arc in Figures 9 and 10. Another group exhibited minimal flicker except when relative light output was below approximately 20–30%. Finally, one product (13RT-13) exhibited substantial flicker throughout the dimming range. Plots of light output over time for four different lamps representing the range of products tested in this study are shown in Figure 11.
Figure 10. Mean percent flicker (across all dimmers and sequences) versus mean light output for the RRL3 A lamps. The threshold lines are for historical benchmark products at full output.
Figure 9. Mean flicker index (across all dimmers and sequences) versus mean light output for the RRL3 A lamps. The threshold lines are for historical benchmark products at full output.
22
As with efficacy, LED lamp flicker performance was not dependent on the choice of dimmer. Representative LED lamp flicker waveforms are therefore only shown as operated by dimmer A. It is important to note, however, that the known potential sources of induced or increased flicker that can result from compatibility issues between LED lamps and phase-cut dimmers typically only come into play in certain circumstances. The lack of any observed dependency of flicker performance on the choice of dimmer noted in this study may be due to the choice of test conditions—which did not result in any problematic circumstances. For example, compatibility issues are known to result in induced or increased flicker for some lamp-dimmer combinations at certain minimum or maximum dimmer loading (i.e., number of lamps) conditions. This study evaluated only one loading condition (five lamps), which may have avoided issues for the tested lamps.
Figure 12 displays the maximum flicker index values—including the range and average across all dimmers and sequences—for the LED and incandescent products. The range bars indicate the variation in maximum flicker index observed for any lamp across the four dimmers and two sequences, thus characterizing the effect of the dimmer. Seven of the fourteen LED lamps performed similarly to the incandescent benchmarks, and another four performed worse than the incandescent threshold but better than the magnetically ballasted fluorescent
Figure 11. Light output versus time (i.e., flicker waveform) for four LED lamps. The plots illustrate how the flicker waveforms vary as the lamp is dimmed. Waveforms are shown for 3 of the 10 dimmer settings, and for 4 of the 14 evaluated LED lamps, selected to represent the variation seen in performance in this investigation..

23
lamp threshold. At least three products were measured to have more flicker at some point in the dimming range than a typical magnetically ballasted fluorescent lamp and would likely be objectionable to some consumers. The key takeaway from Figure 12, however, is that flicker is exclusively a property of the lamp; the effect of the dimmer—illustrated by the range—is likely within measurement tolerances.
Power Quality over Dimming Range ANSI C82.77–2002, Harmonic emission limits – related power quality requirements for lighting equipment, sets performance thresholds for both PF and THD, for lighting loads operating at full rated input power in the ranges shown in Table 1. Specifically, the document states: “For dimmable or multiple light level products, any applicable testing shall be at the full rated power condition only, since harmonic currents will be less under dimmed (power less than nominal full rated conditions) operation.” All the LED lamps evaluated easily fell into the lowest input power bin (less than 35 W). The standard is presently under revision, however, where the widespread deployment of general illumination LED lighting that has occurred since it was last updated is being taken into consideration, and is likely to result in new input power bins.
All of the LED-based systems—consisting of five lamps—had a PF above 0.80 when a switch was used, but only 70% of the systems maintained that level of performance when the switch was replaced with a dimmer set
Table 1. ANSI power quality requirements for integrally ballasted medium screw base products (ANSI C82.77-2002).
Input Power (P) Minimum PF Maximum Line Current THD
(fundamental) P ≤ 35 W 0.50 200% 35 W < P ≤ 60 W 0.80 80% 60 W < P ≤ 100 W 0.90 50% P > 100 W 0.90 20%
Figure 12. Mean flicker index (colored bar) for each product over the dimming range. The lines indicate performance range across different dimmers.

24
to full output. Analogous to the results for PF, all of the LED lamps had a THD of less than 80% when operated by the switch, but only about 80% of the lamp systems maintained that level of performance when the switch was replaced with a dimmer set to full output. Nevertheless, all of the LED lamps met the ANSI C82.77-2002 PF requirements when operated by a switch, and when operated by a dimmer set to full output.
Although ANSI C82.77–2002 only applies to lamps operated at full rated power, it is still somewhat instructive to examine how the power quality performance of such lamps changes as they are dimmed. It must be noted, however, that dimming reduces current draw, thus simultaneously reducing their potential impact on circuit and building power quality. Further, all of the measurements included in this report are for a single circuit containing five lamps, and do not take into consideration the power quality impact of the phase-cut dimmer (which can be significant, even when operating incandescent sources) or the potential impact on the power quality of a building or even a fully loaded branch circuit. As the lamps were dimmed, PF generally reduced, often by 20% or more. As shown in Figure 13, only one LED-based system maintained a consistent power factor throughout the dimming range. Summary results for individual lamp-dimmer combinations are shown in Figure 14.
All of the LED lamps met the ANSI C82.77-2002 THD requirements when operated by a switch, and when operated by a dimmer set to full output. Even though there was substantial performance variation among LED lamp systems, the general trend for THD was consistent: THD increased as the lamps were dimmed (Figure 15). Notably, this same behavior occurred for the benchmark lamps, and is expected for all source types under control by a phase-cut dimmer. While the THD values for LED were all generally higher (across the dimming range) than the incandescent benchmarks, the operating currents for LED products are much lower than for their halogen counterparts, and when part of a larger system, there may be no negative consequences to the higher THD values.
Figure 13. Mean power factor for each lamp type averaged over dimmer and sequence.

25
Figure 14. Power factor with a switch, with a dimmer at full output, and with the dimmer at the point of minimum power factor for the LED lamps. Each lamp-dimmer-sequence combination was considered separately (14 ×2 × 4 = 112 observations).
Figure 15. Mean THD per product type (averaged over dimmer and sequence) versus light output.

26
4 Conclusions This is the second series of CALiPER reports to include a segment focusing on photoelectric performance—namely, dimming, flicker, and power quality. As with the previous installment, the variation in performance of available LED products is different from the extreme consistency of incandescent and halogen lamps, to which consumers have become accustomed.
In reviewing each of the photoelectrical performance characteristics (i.e., dimming, flicker, power quality), at least one LED product performed similarly to, or better than, the benchmark incandescent lamps tested. Multiple LED lamps exhibited dimming curves closely mimicking the incandescent square-law behavior; the flicker performance of several LED lamps were on par with incandescent; and one lamp maintained a power factor above 0.98 for the entirety of the dimming range. Yet, at the same time, there was no single LED lamp that was comparable to the benchmark incandescent sources across all performance characteristics, likely as a result of tradeoffs in performance (and cost) made during the design process. More broadly, for specifiers who are looking to replace incandescent A lamps, LEDs generally provide a tradeoff of greatly improved efficacy—especially over the full dimming range—versus somewhat degraded performance in one or more photoelectric characteristics. In many cases, the impact of that degraded performance may be negligible or acceptable. Further, rough comparisons with the performance of LED lamps previously measured by CALiPER appear to indicate that continued improvements in LED lamp (and perhaps dimmer) technologies are lessening the observed photoelectric performance degradation.
Unlike CALiPER’s previous study of photoelectric performance (on PAR38 lamps), this study examined the effect of four different dimmers on lamp performance. Broadly, the influence of dimmer make and model—even including a basic rotary dimmer not marketed as intended for use with LEDs—on system performance was minimal compared to the influence of the lamps. While this result is laudable, it is important to remember that many of the known effects of compatibility issues between LED lamps and phase-cut dimmers typically only present themselves in certain circumstances. This study only looked at basic phase-cut dimmers (i.e., dimmers without advanced features such as night lights, occupancy or vacancy sensors, or wireless remotes), and only evaluated one loading condition (five lamps), which may have avoided issues for the tested lamps.

27
Appendix A: Performance of 13RT-11 (Non-Dimmable) One of the RRL3 A lamps was labelled as “non-dimmable”—although a dimmable version of the same product was also available. For investigative purposes, this lamp still went through the CALiPER photoelectric testing protocol. In general, the lamp performed similarly to the others when operated using dimmer A, but not when operated using the other three dimmers. In the other three cases, the light output of the lamp generally reduced in response to the dimmer output, but the dimming curve was noticeably not smooth or monotonic, as shown in Figure A1. Other measured characteristics, such as flicker and power factor, showed similar erratic behavior.
Figure A1. Dimming characteristics for lamp type 13RT-11, which was labelled as being non-dimmable. Although it did dim on all four dimmer models, light output was erratic on three of the dimmers and did not go lower than about 25% on the fourth dimmer.

28
Appendix B: Lamp Descriptions and Dimmability Claims
Table B1. Product information and dimmability claims for the lamps characterized in the CALiPER RRL3 dimming, flicker, and power quality investigation.
CALiPER ID Brand Model Dimmability 13RT-01 3M RRA19B3 Yes
13RT-02 Bulbrite LED12A19/0/30K/D Yes
13RT-03 Cree BA19-08027OMF-12DE26-1U100 Yes
13RT-04 EcoSmart ECS A19 WW 60WE 120 Yes
13RT-05 Feit Electric A19/OM800/LED Yes
13RT-06 GE Lighting LED13DA19/830, 65386 Yes; "Dimming performance may vary"
13RT-07 Insignia NS-LED60FB Yes; "Compatible with most dimmers; for best results, use Lutron C-L dimmers"
13RT-08 LEDnovation LEDH-A19-60-1-27D-IO-E Yes
13RT-09 MaxLite SKBO10DLED30 Yes (100-10%)
13RT-10 Philips Lighting BC11A19/AMB/2700 DIM120V Yes; "Dims just like an incandescent bulb and can instantly change the look and feel of a room"
13RT-11 Great Value GVRLAS11W27KND No [Note: results omitted from the body of this report; for more , see Appendix A]
13RT-12 Satco LED/9.8W/2700K/120V Yes
13RT-13 Switch Switch 60/ A22141FA1-R Yes; "Brilliant dimming: can be used with a wide variety of dimmers"
13RT-14 OSRAM Sylvania LED12A19/DIM/O/827/HVP/LW Yes; "Lamp may not be compatible with all dimmers"
13RT-58 Cree BA19-08027OMN-12DE26-1U100 Yes; "Dimmable with standard dimmers"
Benchmarks BK13RT-15 Philips 43A19/EV 120V 6/4
BK13RT-16 Philips 60A/W/TP 120V
29
Appendix C: Dimmer Information
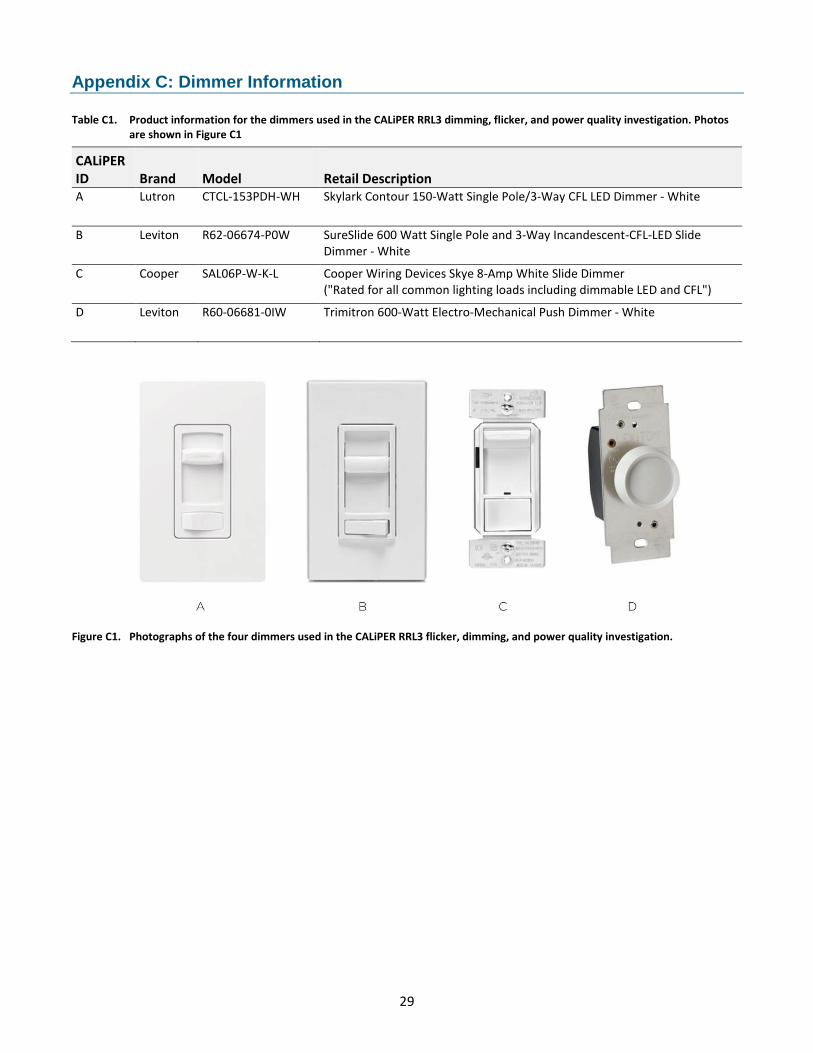
Table C1. Product information for the dimmers used in the CALiPER RRL3 dimming, flicker, and power quality investigation. Photos are shown in Figure C1
CALiPER ID Brand Model Retail Description A Lutron CTCL-153PDH-WH Skylark Contour 150-Watt Single Pole/3-Way CFL LED Dimmer - White
B Leviton R62-06674-P0W SureSlide 600 Watt Single Pole and 3-Way Incandescent-CFL-LED Slide Dimmer - White
C Cooper SAL06P-W-K-L Cooper Wiring Devices Skye 8-Amp White Slide Dimmer ("Rated for all common lighting loads including dimmable LED and CFL")
D Leviton R60-06681-0IW Trimitron 600-Watt Electro-Mechanical Push Dimmer - White
Figure C1. Photographs of the four dimmers used in the CALiPER RRL3 flicker, dimming, and power quality investigation.

30
Figure D1. Change in performance of dimmer operation at full output versus switch operation (normalized to zero), grouped by dimmer model. The variability in change was much higher for the LED products than the halogen benchmarks, although trends for dimmers were similar. (continued on next page)
Appendix D: Change in Characteristics Using Dimmers Versus Switch

31
Figure D1. (continued) Change in performance of dimmer operation at full output versus switch operation (normalized to zero), grouped by dimmer model. The variability in change was much higher for the LED products than for the halogen benchmarks, although trends for dimmers were similar.

32
Figure D2. Change in performance of dimmer operation at full output versus switch operation (normalized to zero), grouped by lamp type. The variability in change was similar for the LED products and the halogen benchmarks. Some LEDs changed more, whereas some changed less. (continued on next page)

33
Figure D2. (continued) Change in performance of dimmer operation at full output versus switch operation (normalized to zero), grouped by lamp type. The variability in change was similar for the LED products and the halogen benchmarks. Some LEDs changed more, whereas some changed less. (continued on next page)

34
Figure D2. (continued) Change in performance of dimmer operation at full output versus switch operation, grouped by lamp type. The variability in change was similar for the LED products and the halogen benchmarks. Some LEDs changed more, whereas some changed less.
35
Appendix E: Dimming Response Curves for Each Lamp-Dimmer Combination
Figure E1. Dimming response curves for each product, paired with each dimmer, measured with both the min-to- max and max-to-min progressions. (continued on next page)

36
Figure E1. (continued) Dimming response curves for each product, paired with each dimmer, measured with both the min-to- max and max-to-min progressions. (continued on next page)

37
Figure E1. (continued) Dimming response curves for each product, paired with each dimmer, measured with both the min-to- max and max-to-min progressions.

38
Appendix F: Average Performance on Each Dimmer
Figure F1. Mean light output versus dimmer signal for each dimmer model. The difference between the solid (low-to-high) and dashed (high-to-low) lines indicates strong symmetry (i.e., the same performance regardless of the sequence). The differences between the line colors (dimmers) show that when operated by dimmer D, the LED lamps tended to have higher output at any given signal level.
Figure F2. Mean flicker index versus dimmer signal for each dimmer model. The low-end deviation for dimmer B is principally due to one outlier measurement, which may be erroneous. In general, dimmer model and measurement sequence had little to no systemic effect on flicker index.

39
Figure F3. Mean percent flicker versus dimmer signal for each dimmer model. In general, dimmer model and measurement sequence had little to no systemic effect on percent flicker. The increasing variation at lower dimmer signals likely results from the sensitivity of the percent flicker metric at very low light output levels.
Figure F4. Mean efficacy versus dimmer signal for each dimmer model. In general, dimmer model and measurement sequence had little to no systemic effect on efficacy. Dimmer D had minimally higher efficacies between 20% and 80% of the maximum signal, likely due to the higher light output (Figure F1).

40
Figure F5. Mean power factor versus dimmer signal for each dimmer model. In general, dimmer model and measurement sequence had little to no systemic effect on power factor.
Figure F6. Mean THD versus dimmer signal for each dimmer model. On average, dimmer model and measurement sequence had little to no systemic effect on THD; however, analysis of individual data reveals that dimmer A in the high-to-low sequence often resulted in considerably different THD measurements throughout the dimming range. The differences are above and below the other measurements, resulting in an average value that is similar to the others, as shown in this chart.

41
DOE SSL Commercially Available LED Product Evaluation and Reporting Program NO COMMERCIAL USE POLICY
The U.S. Department of Energy (DOE) is a federal agency working in the public interest. Published information from the DOE SSL CALiPER program, including test reports, technical information, and summaries, is intended solely for the benefit of the public, in order to help buyers, specifiers of new SSL products, testing laboratories, energy experts, energy program managers, regulators, and others make informed choices and decisions about SSL products and related technologies.
Such information may not be used in advertising, to promote a company’s product or service, or to characterize a competitor’s product or service. This policy precludes any commercial use of any DOE SSL CALiPER Program published information in any form without DOE’s express written permission.