CALiPER Report 20.2: Dimming, Flicker, and Power Quality...
32
Report 20.2: Dimming, Flicker, and Power Quality Characteristics of LED PAR38 Lamps March 2014 Prepared for: Solid-State Lighting Program Building Technologies Office Office of Energy Efficiency and Renewable Energy U.S. Department of Energy Prepared by: Pacific Northwest National Laboratory
Transcript of CALiPER Report 20.2: Dimming, Flicker, and Power Quality...
Report 20.2: Dimming, Flicker, and Power Quality Characteristics of LED PAR38 Lamps
March 2014
Prepared for:
Solid-State Lighting Program
Building Technologies Offi ce Office of Energy Effi ciency and Renewable Energy U.S. Department of Energy
Prepared by:
Pacific Northwest National Laboratory

PNNL-SA-23263
Preface The U.S. Department of Energy (DOE) CALiPER program has been purchasing and testing general illumination solid-state lighting (SSL) products since 2006. CALiPER relies on standardized photometric testing (following the Illuminating Engineering Society of North America [IES] approved method LM-79-081) conducted by accredited, independent laboratories.2 Results from CALiPER testing are available to the public via detailed reports for each product or through summary reports, which assemble data from several product tests and provide comparative analyses.3
It is not possible for CALiPER to test every SSL product on the market, especially given the rapidly growing variety of products and changing performance characteristics. Starting in 2012, each CALiPER summary report focuses on a single product type or application. Products are selected with the intent of capturing the current state of the market, representing a broad range of performance characteristics. However, the selection does not represent a statistical sample of all available products.
To provide further context, CALiPER test results may be compared to data from LED Lighting Facts,4 ENERGY STAR® performance criteria,5 technical requirements for the DesignLights Consortium® (DLC) Qualified Products List (QPL),6 or other established benchmarks. CALiPER also tries to purchase conventional (i.e., non-SSL) products for comparison, but because the primary focus is SSL, the program can only test a limited number.
It is important for buyers and specifiers to reduce risk by learning how to compare products and by considering every potential SSL purchase carefully. CALiPER test results are a valuable resource, providing photometric data for anonymously purchased products as well as objective analysis and comparative insights. However, photometric testing alone is not enough to fully characterize a product—quality, reliability, controllability, physical attributes, warranty, compatibility, and many other facets should also be considered carefully. In the end, the best product is the one that best meets the needs of the specific application.
For more information on the DOE SSL program, please visit http://www.ssl.energy.gov.
1 IES LM-79-08, Approved Method for the Electrical and Photometric Measurements of Solid-State Lighting Products, covers LED-based SSL products with control electronics and heat sinks incorporated. For more information, visit http://www.iesna.org/.2 CALiPER only uses independent testing laboratories with LM-79-08 accreditation that includes proficiency testing, such as that available through the National Voluntary Laboratory Accreditation Program (NVLAP).3 CALiPER summary reports are available at http://www.ssl.energy.gov/reports.html. Detailed test reports for individual products can be obtained from http://www.ssl.energy.gov/search.html. 4 LED Lighting Facts® is a program of the U.S. Department of Energy that showcases LED products for general illumination from manufacturers who commit to testing products and reporting performance results according to industry standards. The DOE LED Lighting Facts program is separate from the Lighting Facts label required by the Federal Trade Commission (FTC). For more information, see http://www.lightingfacts.com. 5 ENERGY STAR is a federal program promoting energy efficiency. For more information, visit http://www.energystar.gov. 6 The DesignLights Consortium Qualified Products List is used by member utilities and energy-efficiency programs to screen SSL products for rebate program eligibility. For more information, visit http://www.designlights.org/.
1

Outline of CALiPER Reports on PAR38 Lamps This study is part of a series of investigations performed by the CALiPER program on LED PAR38 lamps. Each report in the series covers the performance of up to 44 LED PAR38 lamps (some tests were not performed on all of the available samples) which were purchased in 2012 or 2013. Summaries of the testing are covered in each report, as follows:
Application Summary Report 20: LED PAR38 Lamps (November 2012, addendum September 2013)7
A sample of 44 LED PAR38 lamps, as well as 8 halogen and 2 CFL benchmarks, underwent photometric testing according to IES LM-79-08. CALiPER Application Summary Report 20 focuses on the basic performance characteristics of the LED lamps compared to the benchmarks, as well as performance relative to manufacturers’ claims. This report follows numerous similar reports on different product types that have been published by the CALiPER program.
Report 20.1: Subjective Evaluation of Beam Quality, Shadow Quality, and Color Quality for LED PAR38 Lamps (October 2013)8
This report focused on human-evaluated characteristics, including beam quality, shadow quality, and color quality. Using a questionnaire that included rank-ordering, opinions on 26 of the Report 20 PAR38 lamps were gathered during a demonstration event for members of the local IES chapter. This was not a rigorous scientific experiment, and the data should not be extrapolated beyond the scope of the demonstration. The results suggest that many of the LED products compared favorably to halogen PAR38 benchmarks in all attributes considered. LED lamps using a single-emitter design were generally preferred for their beam quality and shadow quality, and the IES members’ ranking of color quality did not always match the rank-order according to the color rendering index (CRI).
Report 20.2: Dimming, Flicker, and Power Quality Characteristics of LED PAR38 Lamps This report focuses on the flicker and power quality performance of the Series 20 lamps at full output and various dimmed levels. All of the Series 20 PAR38 lamps that manufacturers claimed to be dimmable (including all halogen lamps) were evaluated individually (one lamp at a time) both on a switch and under the control of a phase-cut dimmer designed for use with “all classes of bulbs.” Measurements of luminous flux, flicker, and power quality were taken at 10 target dimmed settings and compared with operation on a switch.
The dimmed performance of many LED lamps is dependent on the phase-cut dimmer used and how many lamps are connected to the dimmed circuit. Some manufacturers recommend specific dimmers that work better (but not necessarily identically) with their product(s), as well as the minimum and maximum number of dimmers per circuit. Because only a single unit of each product was evaluated on a single dimmer that may or may not have been recommended by its manufacturer, this report focuses on the performance of the products relative to each other, rather than the best-case performance of each lamp or variation in performance delivered from each lamp. Despite these limitations, the results suggest that LED performance is improving, and performance trends are beginning to emerge, perhaps due in part to the identification of preferred LED driver strategies for lamp products.
Report 20.3: Stress Testing of LED PAR38 Lamps (pending) A small sample of each of the Series 20 PAR38 lamps is currently undergoing multi-stress testing at Pacific Northwest National Laboratory (PNNL), whereby samples are subjected to increasing levels of simultaneous
7 Available at: http://apps1.eere.energy.gov/buildings/publications/pdfs/ssl/caliper_20_summary.pdf 8 Available at: http://apps1.eere.energy.gov/buildings/publications/pdfs/ssl/caliper_20.1_par38.pdf
2
thermal, humidity, electrical, and vibrational stress. The results will not directly yield expected lifetime or reliability performance, but they can be compared with one another, as well as with benchmark conventional products, to assess the relative robustness of the product designs.
Report 20.4: Lumen and Chromaticity Maintenance of LED PAR38 Lamps (pending) The lumen depreciation and color shift of 40 lamps is currently being monitored for an extended period of time at PNNL.
3
1 Introduction
Testing results from CALiPER Application Summary Report 20 showed that the LED PAR38 lamps had much higher efficacies than conventional halogen lamps, while offering comparable lumen output and luminous intensity distributions—at least in the target range of lamps comparable in output to 75 W halogen PAR38s. Most of the LED PAR38 lamps had correlated color temperatures (CCTs) that were similar to the conventional lamps they were intended to replace and CRIs that were good (80s) or excellent (90s). Further, feedback from lighting professionals during a demonstration event indicated that a number of LED PAR38 lamps had better beam quality, shadow quality, and color quality than halogen benchmark products. Given the aforementioned results, many LED PAR38 lamps appear to be a good alternative to halogen lamps, but other performance areas also need to be considered, especially in some specific applications. Three of these characteristics are interrelated and can be evaluated in a laboratory environment: dimming, flicker, and power quality.
Dimming Not all LED lamps are designed to be dimmable, and those that are can exhibit different characteristics. The dimming performance of a given LED lamp can be dependent on other components in a lighting system, including the control device used and other light sources on the same circuit. The differences in performance are often related to the driver, which is responsible for interpreting the signal from a control device. This dependency is particularly prevalent for integral lamps controlled by phase-cut dimmers. Such systems often have compatibility issues, where phase-cut dimmer characteristics interfere with the intended operation of the LED sources, and/or LED source characteristics interfere with the intended operation of the phase-cut dimmer.
There is no standard definition for “dimmable,” and manufacturer claims of dimmability cannot be construed as guaranteeing any minimum level of performance. Besides differences in dimming range (maximum and minimum light output) and the rate of dimming, other performance attributes may also change during dimming, including LED package efficacy, driver efficiency, complete product efficacy, chromaticity, flicker, and power quality.
LED lamp dimming performance can be affected by the particular dimmer used to control the lamp, especially with phase-cut dimmers. Some phase-cut dimmers disturb the normal behavior of some LED lamps, and some LED lamps disturb the normal behavior of some phase-cut dimmers. Such compatibility issues can result in many undesirable behaviors, including:
Lack of smoothness Dead travel (little or no change in light output despite changes in dimmer setting) Pop-on or dropout (sudden change in output not corresponding to the limit of the dimmer signal) Flashing or ghosting Audible noise Reduced lifetime or reliability of the dimmer Reduced lifetime or reliability of the LED product
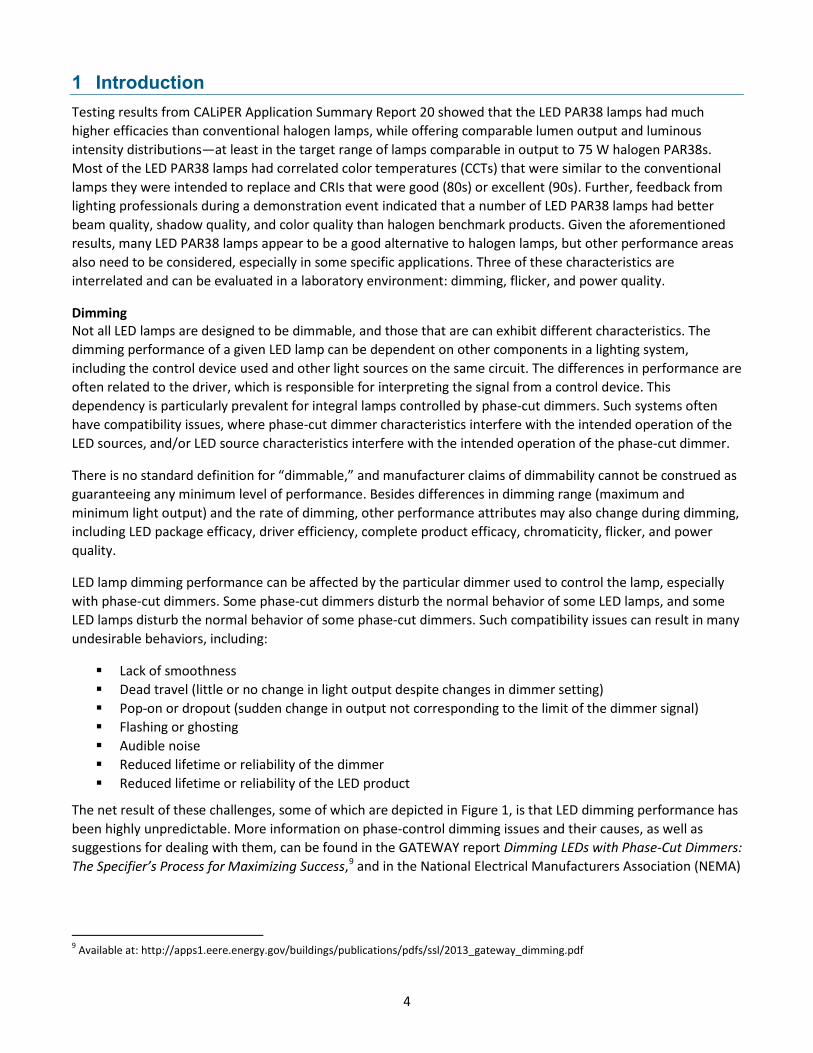
The net result of these challenges, some of which are depicted in Figure 1, is that LED dimming performance has been highly unpredictable. More information on phase-control dimming issues and their causes, as well as suggestions for dealing with them, can be found in the GATEWAY report Dimming LEDs with Phase-Cut Dimmers: The Specifier’s Process for Maximizing Success,9 and in the National Electrical Manufacturers Association (NEMA)
9 Available at: http://apps1.eere.energy.gov/buildings/publications/pdfs/ssl/2013_gateway_dimming.pdf
4
Figure 1. Potential behaviors when dimming LED lamps or luminaires. The plot shows light output (from zero to maximum) versus the dimmer setting (referring to the dimmer conduction time, phase angle, mechanical position of a knob, or Vrms). Many other behaviors are not shown. Adapted from NEMA SSL 6-2010, Solid State Lighting for Incandescent Replacement – Dimming.
Lighting Systems Division document LSD 49-2010, Solid State Lighting for Incandescent Replacement—Best Practices for Dimming.10
Flicker All conventional light sources—including incandescent, high-intensity discharge, and fluorescent—modulate luminous flux and intensity, whether visible or not. Many terms are used when referring to this time-variation, including “flicker,” “flutter,” and “shimmer.” LED flicker characteristics are primarily a function of the LED driver. Dimming an LED source can increase or induce flicker, most notably when phase-cut controls are used and/or pulse-width modulation (PWM) is employed within the driver to reduce the average light output from the LED source.
Low-frequency flicker can induce seizures in people with photosensitive epilepsy, and the flicker in magnetically ballasted fluorescent lamps used for office lighting has been linked to headaches, fatigue, blurred vision, eyestrain, and reduced visual task performance for certain populations. Flicker can also produce hazardous phantom array effects—which may lead to distraction when driving at night, for example—or stroboscopic effects, which may result in the apparent slowing or stopping of moving machinery in an industrial setting.
The photometric flicker found in electric light sources is typically periodic, with its waveforms characterized by variations in amplitude, average level, periodic frequency (cycles per unit of time), shape, and, in some cases, duty cycle. The IES has defined two metrics for quantifying flicker: Flicker Index and Percent Flicker. More information on flicker can be found in a DOE Fact Sheet on the topic.11
Power Quality Electric power is delivered through a complex system of generators, transmission lines, and distribution networks to widely varying end-use circuits comprised of interconnected loads. Power quality broadly describes the fitness of electric power to drive electric loads in a manner that allows them to function as intended without
10 Available at: http://apps1.eere.energy.gov/buildings/publications/pdfs/ssl/ssl_nema-lsd_july2010.pdf 11 Available at: http://apps1.eere.energy.gov/buildings/publications/pdfs/ssl/flicker_fact-sheet.pdf
5

significant reduction in performance or lifetime. Power quality is a system characteristic, not a component characteristic. The power quality of an electric system is determined by the characteristics of the system components – including generators, switching devices, transformers, and ultimately loads – and how those interconnected components interact with each other.
Electric power can be of poor quality in many ways, including (but not limited to): poor synchronization of the voltage frequency and phase across subsystems, transient increases or decreases to the root mean square (RMS) voltage that occur over time frames ranging from milliseconds to minutes (or more, in the case of outages), and harmonic distortions to voltage or current waveforms. There are many potential causes of poor-quality power, including (but not limited to): network or load switching events, currents induced by lightning strikes, and reactive (energy-storing) or non-linear loads.
Power quality is a significant potential concern for multiple stakeholder groups and may lead to higher financial costs as well as possibly degraded performance of, or damage to, electric networks and loads. Electric utilities are most affected by power quality, and as a result are most broadly concerned about new equipment deployment and other changes in electric systems. Degradation in the power quality of a utility system or subsystem can result in resonance in distribution networks, increased transmission and distribution losses, a need to install transmission and distribution infrastructure with higher power/current handling capability, and possibly even a need for increased generation capacity.
Building owners and operators need to beware of significant connected-load changes that might degrade building power quality and lead to potentially higher electricity costs resulting from a utility “power factor charge” or to safety-related issues resulting from increased neutral wire currents. Building occupants may also be affected by degraded power quality, which can lead to increased electrical service interruptions and associated downtime resulting from a greater occurrence of circuit breaker trips or power supply overloads and resets, or degraded performance or (in rare cases) failure of equipment resulting from distorted input voltage waveforms. Concerns about power quality have led to the development of equipment specifications by various standards organizations.12
The creation and use of power quality requirements that are more stringent than the recommendations available from standards bodies has the potential to do more harm than good. In the best case, users may pay for more equipment than necessary or delay the adoption of energy-saving technology. In the worst case, they may deploy equipment that has achieved the more stringent requirements at the expense of degraded performance in some other area.
CALiPER Dimming, Flicker, and Power Quality Testing Although dimming, flicker, and power quality are important performance characteristics, the CALiPER program to date has largely focused on photometric performance of LED lamps and luminaires. However, widespread improvements in photometric performance and increasing adoption of LED products have led to heightened interest in a broader set of performance characteristics. As a result, CALiPER intends when warranted to follow up the reporting of photometric performance with additional analysis that takes advantage of existing laboratory testing capabilities. In this report, the dimming, flicker, and power quality performance of the previously photometered Series 20 PAR38 lamps is investigated. As is standard practice for CALiPER, the goal was not to determine the best-performing products. Instead, the test results are compared against established thresholds and benchmark conventional lamps, with additional analysis focused on identifying variation and trends in performance.
12 In North America, ANSI C82.77-2002 currently contains perhaps the most appropriate power quality performance recommendations specifically for lighting equipment.
6
2 Methods
The dimming, flicker, and power quality performance of an LED source can be dependent on the characteristics of other components on the same electrical circuit, including other lamps or luminaires and phase-control devices. Most LED lamps are only compatible (i.e., only perform up to their full capability) with certain phase-control dimmers. Examining the performance of each lamp type with multiple phase-control dimmers while varying the number of lamps on the circuit would be very informative, but also very time-consuming.
For this investigation, two constraints were applied: LED lamp performance was evaluated with only one dimmer model, and only one sample of each lamp was on the circuit when tested. It is important to note that the selected dimmer may not have been on the recommended list for every lamp—if the lamp manufacturer even provided such a list—and operation of any of the lamps on a different dimmer may yield different results. Thus, odd behavior shown in the data may not be representative of the performance of a given lamp. While the measured performance of any given lamp may be misleading, the focus of this study was on the broader performance of the group. The results are indicative of the general flicker, power quality, and dimming performance of LED PAR38 lamps purchased in early 2013.
Lamps Series 20 is comprised of 44 LED lamps, 33 of which were claimed by their manufacturers to be dimmable. In a few cases, dimmable versions of the lamps were available but were not purchased by the CALiPER program during the initial procurement process. One product did not make a claim as to whether or not it was dimmable, so it was treated as a non-dimmable lamp. Appendix A provides a description of each lamp, as well as information on dimmability that was found on the product specification sheet, manufacturer webpage, or product packaging. Five halogen lamps and two non-dimmable CFL benchmark products were also tested with the Series 20 LED lamps. For both LED and benchmark products, dimming performance was only measured for those lamps that claimed dimmability.
For complete performance data obtained following the LM-79-08 test procedure, see CALiPER Application Summary Report 20: LED PAR38 Lamps.
Control Devices All of the Series 20 LED lamps and benchmarks were analyzed when operated by a Leviton 15 A single-pole switch, providing a baseline for future measurements. This is an important distinction, because the performance of a lamp when connected to a dimmer set to provide the maximum output is effectively never the same as the performance when connected to a switch. The dimmable Series 20 LED lamps and halogen benchmarks were further analyzed when operated by a phase-cut dimmer, a Leviton SureSlide Decora 6674. The dimmer was purchased in 2012 and chosen as representative of a typical and commonly available product marketed as providing “full-range dimming for incandescent and (dimmable) LED and CFL lamps.” It was rated for a maximum load of 600 W for incandescent products and 150 W for LEDs and CFLs. Note that the design of this dimmer model appears to have since been updated by the manufacturer, although the exact changes have not been verified. The performance of the tested lamps with the new version of the dimmer—or with any other dimmer— may be different.
Test Apparatus and Equipment A semi-automated test setup at PNNL was used to evaluate the dimming, flicker, and power quality performance of the Series 20 PAR38 lamps. The measurement system consisted of a light-impermeable box, a photosensor (UDT Model 211), a transimpedance amplifier (UDT Tramp) with a 5 V output and variable gain, a digital oscilloscope (Tektronix DPO2014), and custom-developed software (using National Instruments LabVIEW). The system sampled and digitized 125,000 photosensor measurements to characterize the variation in luminous flux,
7

and calculated an average output level as well as various flicker metrics. The absolute measurements of illuminance captured by the photosensor are dependent on the position of the light source in the light-impermeable box, which does not function as an integrating sphere. Test samples were not manipulated to ensure a consistent distance between their emitting surface and the photosensor. As a result, the raw data digitized from the photosensor was normalized to the maximum value recorded for each waveform.
Power quality calculations were made from light source input current and voltage measurements using a calibrated Yokogawa WT210 Digital Power Meter. The custom software developed using National Instruments LabVIEW also controlled the WT210 and logged its measurement data.
At this time, there is no standardized test procedure for characterizing the dimming performance of LED (or other) light sources, or for measuring flicker. The test setup and procedure used to obtain this dataset generally followed the practices specified in IES LM-79-08. All test samples were operated at full output for a minimum of 30 minutes prior to evaluation, in order to reach thermal equilibrium. Lamp temperatures and other operating characteristics (e.g., power and light output) were not evaluated during this warm-up time, to ensure stability; 30 minutes was assumed to be sufficient, based on experience with integral lamp products. In order to minimize testing time, dimmable test samples were not allowed to establish a new thermal equilibrium at each measurement point—resulting in some deviation from IES LM-79-08 specifications. Flicker and power quality measurements were made immediately after establishing each target dimmed-output level. Measurement time per sample was minimized and relatively consistent due to the automated data acquisition.
The transimpedance amplifier gain was adjusted for each measurement, to ensure that the output voltage presented to the oscilloscope for digitization was between 0.5 and 5.0 V. The average value of the photosensor measurement made for each sample when operated by a switch was used to normalize all subsequent dimmed measurements of that sample, facilitating comparisons between products for relative dimmed output and relative efficacy.
Measurement Procedure For this investigation, only one sample of each lamp was evaluated at a time, with no other loads on the circuit. Flicker and power quality characteristics were first recorded for each test sample as operated by the switch, then at a series of dimmed levels as operated by the dimmer. For the dimming characterization, a test operator manually adjusted the dimmer while monitoring the RMS Voltage delivered to the lamp, with the intent of taking measurements at or near 10 predetermined targets: maximum voltage, 105 V, 95 V, 85 V, 75 V, 65 V, 55 V, 45 V, 35 V, and minimum voltage. This method was utilized because the dimmer did not have programmable presets, and physically adjusting the device to specific positions was not repeatable. The progression through the voltage targets always occurred in descending order (i.e., from maximum output to minimum output). As a result, dimming behaviors such as pop-on, low-end dead travel, and dimming asymmetry could not be detected.
The mean measured RMS voltage at each dimmed level for the dimmable LED lamps is shown in Table 1. More importantly, all plots show the actual measured RMS voltage for the specific sample, rather than the target RMS voltage or mean measured RMS voltage. Although for the sake of clarity all plots are shown as continuous lines, it is important to note that measurements were taken at only 10 discrete points, and that the lines between are merely linear interpolations.
Reported Metrics Reported Flicker Metrics Percent Flicker and Flicker Index are metrics historically used to quantify flicker. Percent Flicker is better known and easier to calculate, but Flicker Index has the advantage of being able to account for differences in waveform
8
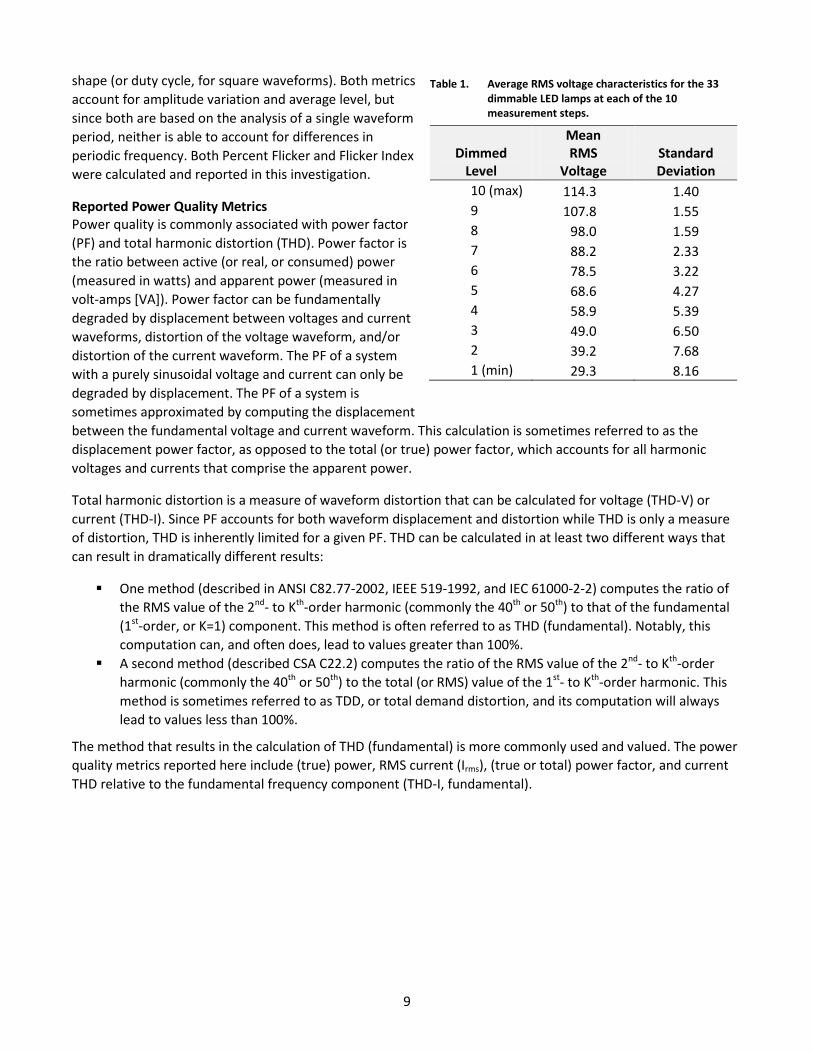
shape (or duty cycle, for square waveforms). Both metrics Table 1. Average RMS voltage characteristics for the 33 account for amplitude variation and average level, but dimmable LED lamps at each of the 10
measurement steps. since both are based on the analysis of a single waveform period, neither is able to account for differences in Mean
Dimmed RMS Standard Level
periodic frequency. Both Percent Flicker and Flicker Index Voltage Deviation were calculated and reported in this investigation.
10 (max) 114.3 1.40 Reported Power Quality Metrics 9 107.8 1.55 Power quality is commonly associated with power factor 8 98.0 1.59 (PF) and total harmonic distortion (THD). Power factor is 7 88.2 2.33 the ratio between active (or real, or consumed) power 6 78.5 3.22 (measured in watts) and apparent power (measured in
5 68.6 4.27 volt-amps [VA]). Power factor can be fundamentally 4 58.9 5.39 degraded by displacement between voltages and current 3 49.0 6.50 waveforms, distortion of the voltage waveform, and/or 2 39.2 7.68 distortion of the current waveform. The PF of a system
with a purely sinusoidal voltage and current can only be 1 (min) 29.3 8.16 degraded by displacement. The PF of a system is sometimes approximated by computing the displacement between the fundamental voltage and current waveform. This calculation is sometimes referred to as the displacement power factor, as opposed to the total (or true) power factor, which accounts for all harmonic voltages and currents that comprise the apparent power.
Total harmonic distortion is a measure of waveform distortion that can be calculated for voltage (THD-V) or current (THD-I). Since PF accounts for both waveform displacement and distortion while THD is only a measure of distortion, THD is inherently limited for a given PF. THD can be calculated in at least two different ways that can result in dramatically different results:
One method (described in ANSI C82.77-2002, IEEE 519-1992, and IEC 61000-2-2) computes the ratio of the RMS value of the 2nd- to Kth-order harmonic (commonly the 40th or 50th) to that of the fundamental (1st-order, or K=1) component. This method is often referred to as THD (fundamental). Notably, this computation can, and often does, lead to values greater than 100%.
A second method (described CSA C22.2) computes the ratio of the RMS value of the 2nd- to Kth-order harmonic (commonly the 40th or 50th) to the total (or RMS) value of the 1st- to Kth-order harmonic. This method is sometimes referred to as TDD, or total demand distortion, and its computation will always lead to values less than 100%.
The method that results in the calculation of THD (fundamental) is more commonly used and valued. The power quality metrics reported here include (true) power, RMS current (Irms), (true or total) power factor, and current THD relative to the fundamental frequency component (THD-I, fundamental).
9

3 Results
Dimmer at Full Output versus Switched Operation Test results for each product operated by the switch and—if applicable—the dimmer at full output are provided in Appendix B. As previously stated, the performance of each lamp on the specific dimmer used in this study is not necessarily indicative of its performance on another dimmer. For example, if the lamp manufacturer provided a recommended dimmer list and the dimmer used was not on the list, less-than-ideal performance would be expected. The results provided in subsequent charts do not explicitly identify each product; the purpose of the charts is to illustrate trends rather than the performance of a given product.
As soon as a dimmer is introduced into the lighting system—replacing a switch—the performance of the system will change, regardless of the source type. With halogen lamps, the change is very predictable; all six halogen benchmarks tested by CALiPER performed similarly. When connected to the dimmer set to full output, current dropped by approximately 0.01 A, power draw decreased by approximately 4 W, efficacy was reduced by about 12%, output decreased by 7%, the value for flicker metrics increased by about 1%, and THD-I went from 0% to approximately 21%. The PF did not change. RMS current and power at full output on the dimmer was always lower than when operated by the switch.
In contrast, the performance of the LED products was much more varied, with some values increasing and others decreasing. In Appendix B, the relative performance for each product is illustrated with color coding; Table 2 provides a summary of the results, indicating the percentage of the 33 dimmable products for which each metric increased, stayed within ±1%, or decreased, as well as the maximum, minimum, and average change. Note that the non-dimmable LED lamps were not tested on a dimmer, even at full output.
The measured RMS current for the LED products at full output on the dimmer was higher than when operated by the switch for 76% of the lamps measured, although the power draw was only higher for 42% of the products. Mean output and efficacy decreased for 39% and 42% of the LED products tested, respectively, but on average the mean output decreased by only 6%, while efficacy remained unchanged. This is in line with halogen performance, with slightly less reduction in output. However, the variation in performance was much greater: one LED lamp actually drew 9.7 W less when operated by the dimmer set to full output versus the switch, and several drew up to 0.7 W more. Notably, mean lumen output dropped by more than 15% for 7 of the 33 LED lamps measured.
Table 2. Performance changes for the dimmable Series 20 LED PAR38 lamps when connected to the Leviton 6674 dimmer. The attributes did not change for some products and some metrics, so the percentages above and below the switched value do not necessarily add up to 100%.
Norm. Mean Norm. Flicker Percent Power
Voltage Current Power Output Efficacy Index Flicker Factor (Vrms) (A) (W)
Above Switched 0% 76% 42% 3% 18% 73% 48% 6% Within Tolerance (±1%) 0% 3% 18% 58% 39% 3% 42% 3% Below Switched 100% 21% 39% 39% 42% 24% 9% 91% Minimum Difference -12.61 -0.05 -9.65 -37% -5% 0.00 -3% -0.40 Average Difference -5.88 0.02 -0.90 -6% 0% 0.02 2% -0.09 Maximum Difference -4.34 0.12 0.67 1% 18% 0.15 12% 0.13
10
By a ratio of at least 3:1, LED products for which the flicker metrics changed became worse (higher). Flicker Index values increased by as much as 0.15, with Percent Flicker increasing by as much as 12%. The measured PF dropped for all but three LED lamps, by an average of 0.09
In summary, there are two key takeaways. First, installing a dimmer will change the performance of any type of lighting system—even when the dimmer is set to full output. Second, the change in performance is less predictable when using LED lamps than when using halogen lamps—in some cases there may be almost no change, and in other cases, the change may be dramatic.
Dimming Characteristics Incandescent lamps are considered by many to have definitive dimming characteristics: they dim smoothly to very low levels, do not product noticeable flicker, and do not impair power quality (i.e., they have near-unity PF). One important negative to dimming incandescent/halogen lamps is that their already-low efficacy decreases substantially. Another important characteristic to mention—although it is not analyzed in this report—is that incandescent lamps shift to a warmer color temperature as they are dimmed. In many cases this has come to be seen as desirable, but such a shift also has the potential to be problematic. Further, the lifetime of incandescent lamps increases when they are dimmed.
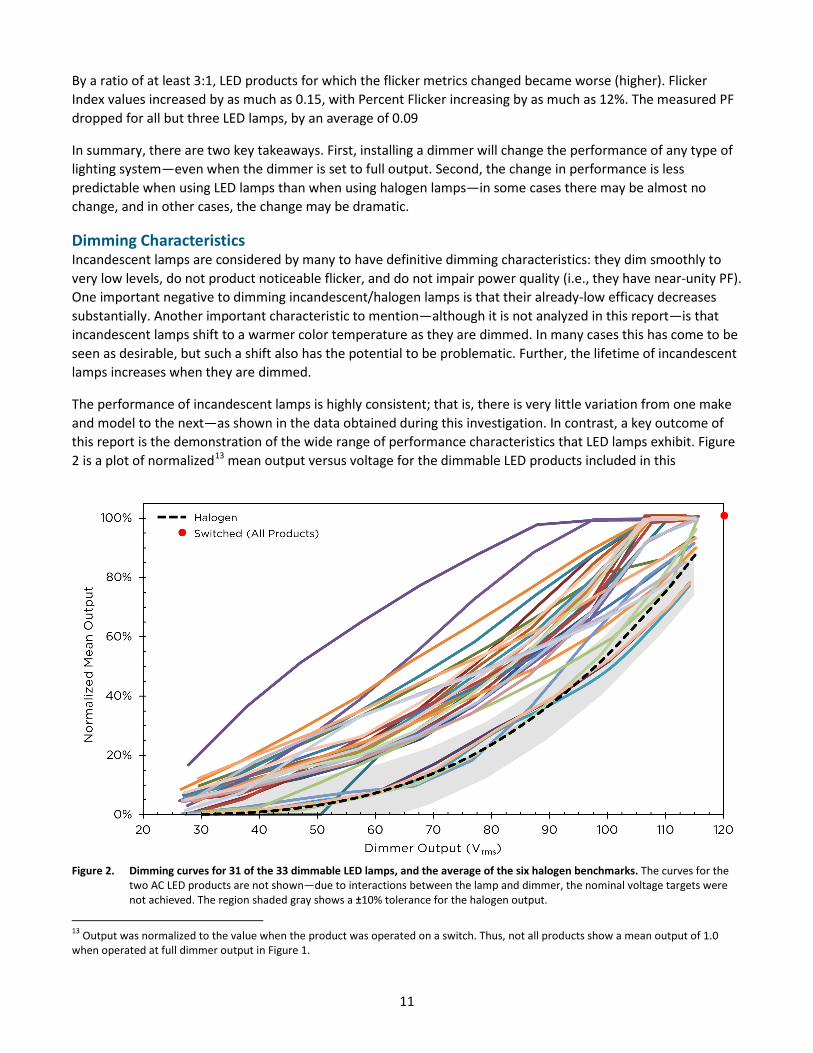
The performance of incandescent lamps is highly consistent; that is, there is very little variation from one make and model to the next—as shown in the data obtained during this investigation. In contrast, a key outcome of this report is the demonstration of the wide range of performance characteristics that LED lamps exhibit. Figure 2 is a plot of normalized13 mean output versus voltage for the dimmable LED products included in this
Figure 2. Dimming curves for 31 of the 33 dimmable LED lamps, and the average of the six halogen benchmarks. The curves for the two AC LED products are not shown—due to interactions between the lamp and dimmer, the nominal voltage targets were not achieved. The region shaded gray shows a ±10% tolerance for the halogen output.
13 Output was normalized to the value when the product was operated on a switch. Thus, not all products show a mean output of 1.0 when operated at full dimmer output in Figure 1.
11
investigation. Also shown is the average of the six evaluated halogen products, as well as a ±10% range (shaded gray) around the curve. Key observations include that:
The LED products exhibited a wide variety of dimming curves; that is, for any given dimming control signal (RMS output voltage), the various LED lamps produced a wide range of light output. For example, at RMS 70 V—approximately the midpoint of the dimmer’s output range—a halogen lamp would produce about 13% of the output it would produce on a switch, whereas the LED products produced between approximately 11% and 78%.
Two products exhibited substantial dead travel (i.e., little or no change over 3 or more voltage steps) at the top end of the dimming range. Another 13 products exhibited little or no change in output between the two highest voltage steps.
Two products—including one that also exhibited high-end dead travel—did not dim below 10% of the light output generated when operated by the switch.
One product demonstrated clear pop-off behavior; it did not dim below 20% and produced no output at the last three dimmed levels.
The output of four LED products was within 10% of the average output of the halogen lamps at each dimmed level. Another five products would meet the same criteria if the output of the halogen lamps were normalized to the maximum output on the dimmer, rather than to the output on the switch.
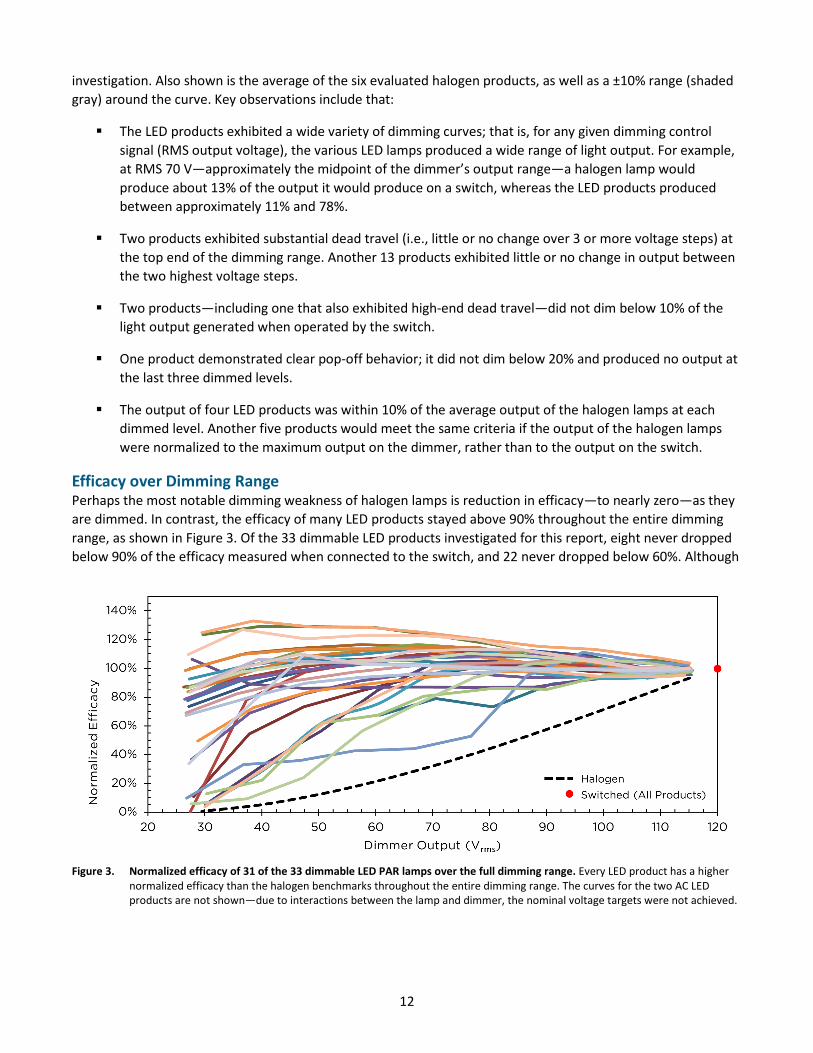
Efficacy over Dimming Range Perhaps the most notable dimming weakness of halogen lamps is reduction in efficacy—to nearly zero—as they are dimmed. In contrast, the efficacy of many LED products stayed above 90% throughout the entire dimming range, as shown in Figure 3. Of the 33 dimmable LED products investigated for this report, eight never dropped below 90% of the efficacy measured when connected to the switch, and 22 never dropped below 60%. Although
Figure 3. Normalized efficacy of 31 of the 33 dimmable LED PAR lamps over the full dimming range. Every LED product has a higher normalized efficacy than the halogen benchmarks throughout the entire dimming range. The curves for the two AC LED products are not shown—due to interactions between the lamp and dimmer, the nominal voltage targets were not achieved.
12

every product could best the performance of halogen lamps, several products had very low efficacies at the low end of the dimming range.
Flicker over Dimming Range As illustrated in Appendix C, the LED products had a wide range of flicker performance, ranging from as good as or better than incandescent, to worse than magnetically ballasted fluorescent. For both Flicker Index and Percent Flicker, three classification bins were established, based on the typical performance of traditional lighting systems. For Flicker Index, the threshold values were 0.03 (similar to incandescent) and 0.13 (similar to magnetically ballasted fluorescent). For Percent Flicker, analogous thresholds were established at 10% and 40%. Figure 4 shows a histogram of the number of products in each of these bins.
As is the case with almost all performance attributes, this investigation demonstrated that there remains substantial variation in the flicker performance of dimmable LED PAR38 lamps. Also important, however, is the fact that flicker usually became worse when a lamp was dimmed. That is, few products could maintain low levels of flicker over the entire dimming range. While reducing flicker to levels comparable to incandescent sources may by possible, it may require tradeoffs with power quality or result in increased cost, for example.
Figure 4. Histograms of Flicker Index (left) and Percent Flicker (right) for the 33 dimmable LED products tested. The values for the dimmer are the highest recorded over the dimming range. Comparing the dimmer values to the switch values shows that flicker becomes more prevalent when an LED lamp is dimmed.
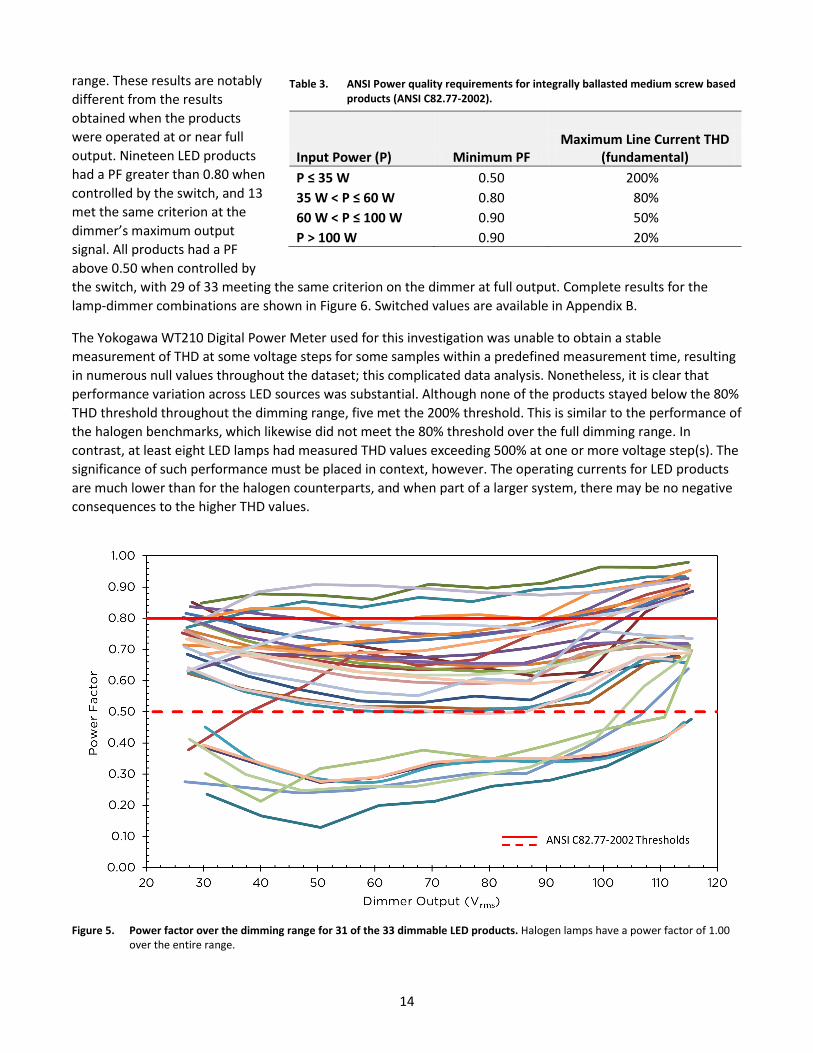
Power Quality over Dimming Range ANSI C82.77–2002, Harmonic emission limits – related power quality requirements for lighting equipment, sets performance thresholds for both PF and THD, based on load power, as shown in Table 3. While all the LED lamps evaluated fell into the lowest power group (less than 35 W), the two ANSI-defined groups with the lowest input power (i.e., PF thresholds of 0.80 and 0.50 and THD-I thresholds of 80% and 200%) are used in this report as performance thresholds. The current version of ANSI C82.77 was released prior to the widespread deployment of general illumination LED lighting; input power bins may be adjusted in the future.
As shown in Figure 5, only one LED-based system remained above the ANSI PF threshold of 0.80 for the entire dimming range. In contrast, 23 systems remained above the 0.50 threshold for the entirety of the dimming
13
range. These results are notably Table 3. ANSI Power quality requirements for integrally ballasted medium screw based different from the results products (ANSI C82.77-2002).
obtained when the products were operated at or near full Maximum Line Current THD output. Nineteen LED products Input Power (P) Minimum PF (fundamental) had a PF greater than 0.80 when P ≤ 35 W 0.50 200% controlled by the switch, and 13 35 W < P ≤ 60 W 0.80 80% met the same criterion at the 60 W < P ≤ 100 W 0.90 50% dimmer’s maximum output P > 100 W 0.90 20% signal. All products had a PF above 0.50 when controlled by the switch, with 29 of 33 meeting the same criterion on the dimmer at full output. Complete results for the lamp-dimmer combinations are shown in Figure 6. Switched values are available in Appendix B.
The Yokogawa WT210 Digital Power Meter used for this investigation was unable to obtain a stable measurement of THD at some voltage steps for some samples within a predefined measurement time, resulting in numerous null values throughout the dataset; this complicated data analysis. Nonetheless, it is clear that performance variation across LED sources was substantial. Although none of the products stayed below the 80% THD threshold throughout the dimming range, five met the 200% threshold. This is similar to the performance of the halogen benchmarks, which likewise did not meet the 80% threshold over the full dimming range. In contrast, at least eight LED lamps had measured THD values exceeding 500% at one or more voltage step(s). The significance of such performance must be placed in context, however. The operating currents for LED products are much lower than for the halogen counterparts, and when part of a larger system, there may be no negative consequences to the higher THD values.
Figure 5. Power factor over the dimming range for 31 of the 33 dimmable LED products. Halogen lamps have a power factor of 1.00 over the entire range.
14
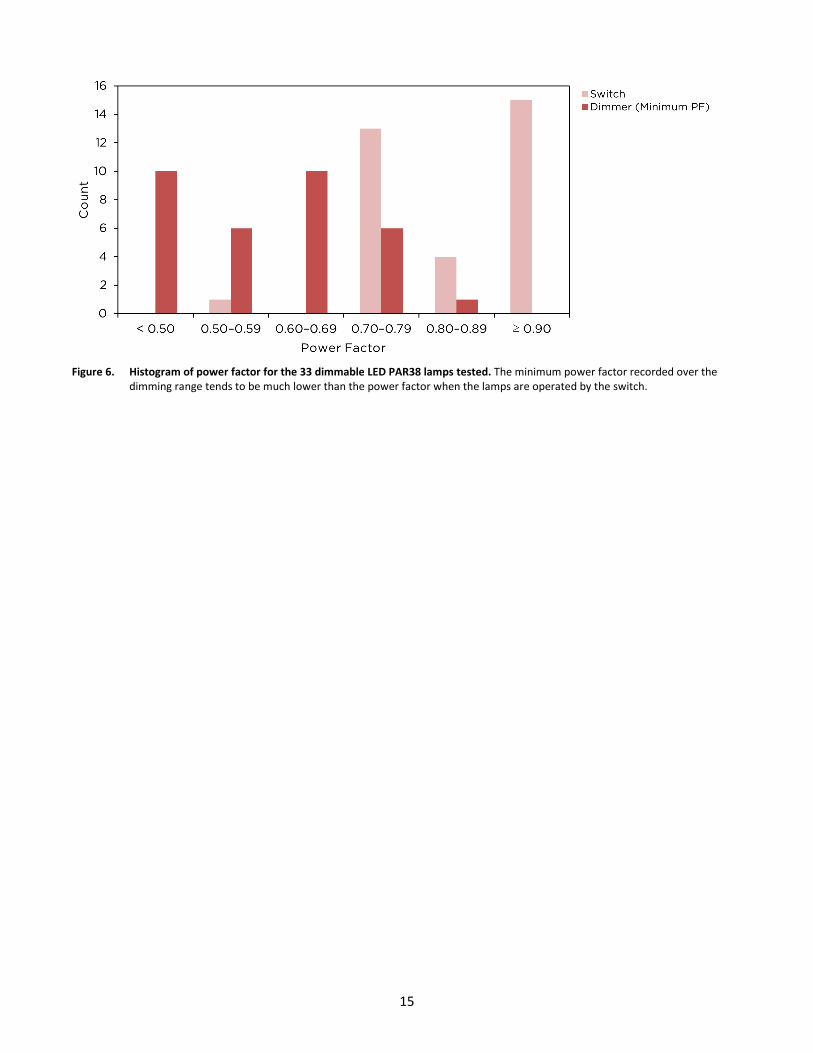
Figure 6. Histogram of power factor for the 33 dimmable LED PAR38 lamps tested. The minimum power factor recorded over the dimming range tends to be much lower than the power factor when the lamps are operated by the switch.
15

4 Analysis The results of this CALiPER investigation indicate greater variability in the dimming, flicker, and power quality performance of LED PAR38 lamps. Nonetheless, careful analysis of the results also indicates that LED lamp performance may be converging. Through visual analysis of each product’s behavior over the dimming range— including output, flicker waveforms, flicker metrics, and PF—many of the lamps were placed into one of four distinct groups (A, B, C, and D); only seven products that did not seem to fit elsewhere were left uncategorized. The four groups consisted of 15, 6, 3, and 2 products, respectively.
The groupings were determined based on the entirety of a product’s performance, rather than the performance according to any one metric. Therefore, it is possible for the average performance of more than one group to be similar or indistinguishable for a given metric. Importantly, the groupings were not based on physical analysis of the components within each lamp—in other words, the lamps were not deconstructed in order to identify individual components. A graphical summary of each group is provided in Figure 7; individual attributes are explored in subsequent sections of this report. The axes of the chart icons in Figure 7 correspond to those of the charts presented in the results section.
Seven of the 33 dimmable LED products evaluated in this investigation were left uncategorized, because their characteristics were not entirely consistent with any one group, or in some cases not with any other lamps at all. For example, while in most cases one of two distinctive methods appeared to be used to implement dimming
Figure 7. Performance of individual products arranged by group. Uncategorized products are not shown.
16

(i.e., pulse-width modulation [PMW] or constant current reduction [CCR]), at least one of the uncategorized products seemed to use a hybrid dimming approach across the dimming range, falling in to Group B at the high end of the range, then transitioning to Group C. Thus, it was not a good fit in either group. Two other uncategorized products demonstrated so-called AC-LED, or “driverless,” behavior. The other uncategorized products exhibited a wide variety of behavior, so averaging the performance values for these products would be misleading. Importantly, these products should only be considered outliers for this sample; it is possible that there are other similar-performing products on the market that were not tested by CALiPER.
Product Group Characteristics Dimming Performance Variation Figure 8 shows the average dimming output performance for the lamps in each of the four previously listed groups. The lamps in Group A exhibited dimming curves similar to halogen lamps, but when connected to the dimmer they exhibited little or no initial reduction in output; rather, the output did not decline substantially until the third voltage step. Although the chart shows approximately steady output between the first and second voltage steps, measurements were only taken at each point; the output between those points may have gone up and then back down, for example. The products in Group B demonstrated an approximately linear dimming curve, whereas the dimming curve for the Group C products closely resembled that of the halogen lamps. The dimming curve of the two lamps in Group D was also nearly linear, but started lower and declined at a slower rate.
Efficacy Especially for Groups A and B, there was notable variation in the measured efficacy over the dimming range. For both groups, products tended to increase in efficacy as they were dimmed through the middle of the range, with efficacy then decreasing toward the low end of the dimming range. For a majority of products in those two
Figure 8. Average dimming curves for each group identified by the CALiPER team. Because the groups were identified using all measured attributes, the performance between groups may not be very different for any single metric. The groups do not include every product tested for this investigation.
17
groups, the efficacy at the lowest dimmed step was less than the efficacy when the lamp was controlled with the switch or at the highest dimmer step. The smaller number of products in Groups C and D resulted in more uniform performance characteristics. For Group C, all three products maintained a near-constant efficacy from the high end to the midpoint of the dimming range, at which point the efficacy declined in a linear fashion to near zero at the lowest dimmer step. The two products in Group D exhibited similar consistency of efficacy, but for a greater portion of the dimming range; those products only declined in efficacy over the lowest step or two of the dimming range.
Importantly, efficacy performance over the dimming range is partially a function of the LED packages themselves, rather than only the driver. For example, the rise in efficacy seen for many products through the middle of the dimming range is potentially due to the packages coming out of the droop regime.14
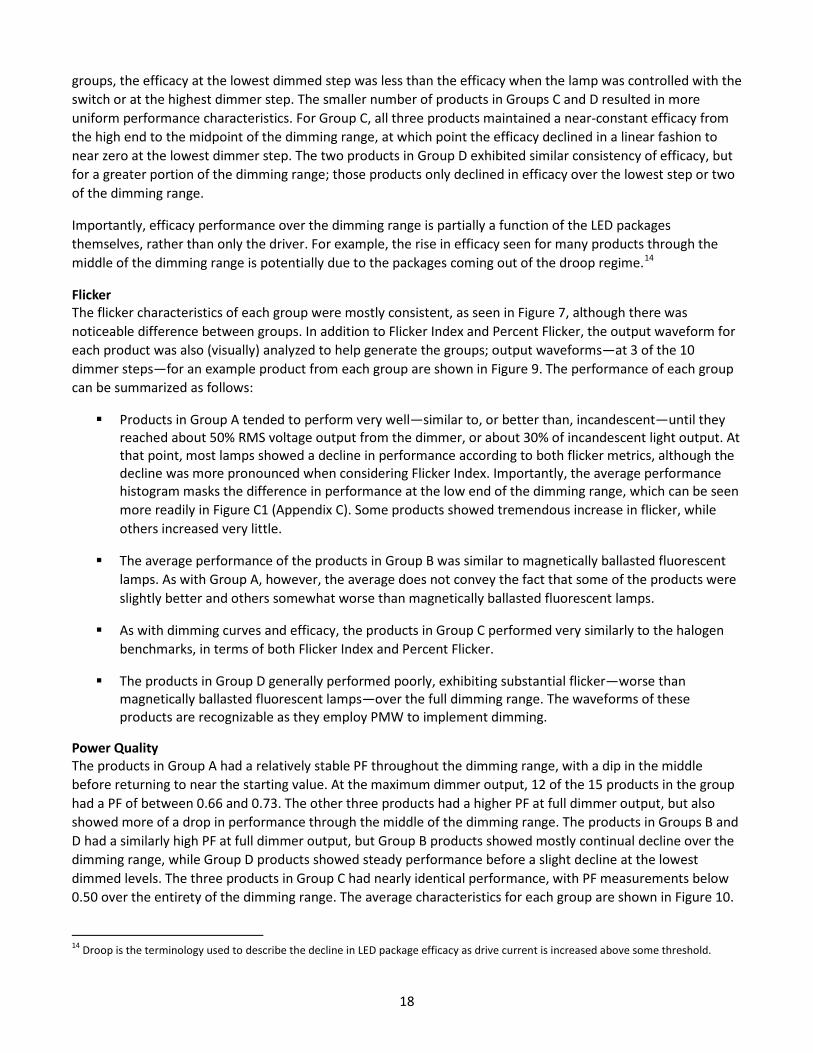
Flicker The flicker characteristics of each group were mostly consistent, as seen in Figure 7, although there was noticeable difference between groups. In addition to Flicker Index and Percent Flicker, the output waveform for each product was also (visually) analyzed to help generate the groups; output waveforms—at 3 of the 10 dimmer steps—for an example product from each group are shown in Figure 9. The performance of each group can be summarized as follows:
Products in Group A tended to perform very well—similar to, or better than, incandescent—until they reached about 50% RMS voltage output from the dimmer, or about 30% of incandescent light output. At that point, most lamps showed a decline in performance according to both flicker metrics, although the decline was more pronounced when considering Flicker Index. Importantly, the average performance histogram masks the difference in performance at the low end of the dimming range, which can be seen more readily in Figure C1 (Appendix C). Some products showed tremendous increase in flicker, while others increased very little.
The average performance of the products in Group B was similar to magnetically ballasted fluorescent lamps. As with Group A, however, the average does not convey the fact that some of the products were slightly better and others somewhat worse than magnetically ballasted fluorescent lamps.
As with dimming curves and efficacy, the products in Group C performed very similarly to the halogen benchmarks, in terms of both Flicker Index and Percent Flicker.
The products in Group D generally performed poorly, exhibiting substantial flicker—worse than magnetically ballasted fluorescent lamps—over the full dimming range. The waveforms of these products are recognizable as they employ PMW to implement dimming.
Power Quality The products in Group A had a relatively stable PF throughout the dimming range, with a dip in the middle before returning to near the starting value. At the maximum dimmer output, 12 of the 15 products in the group had a PF of between 0.66 and 0.73. The other three products had a higher PF at full dimmer output, but also showed more of a drop in performance through the middle of the dimming range. The products in Groups B and D had a similarly high PF at full dimmer output, but Group B products showed mostly continual decline over the dimming range, while Group D products showed steady performance before a slight decline at the lowest dimmed levels. The three products in Group C had nearly identical performance, with PF measurements below 0.50 over the entirety of the dimming range. The average characteristics for each group are shown in Figure 10.
14 Droop is the terminology used to describe the decline in LED package efficacy as drive current is increased above some threshold.
18
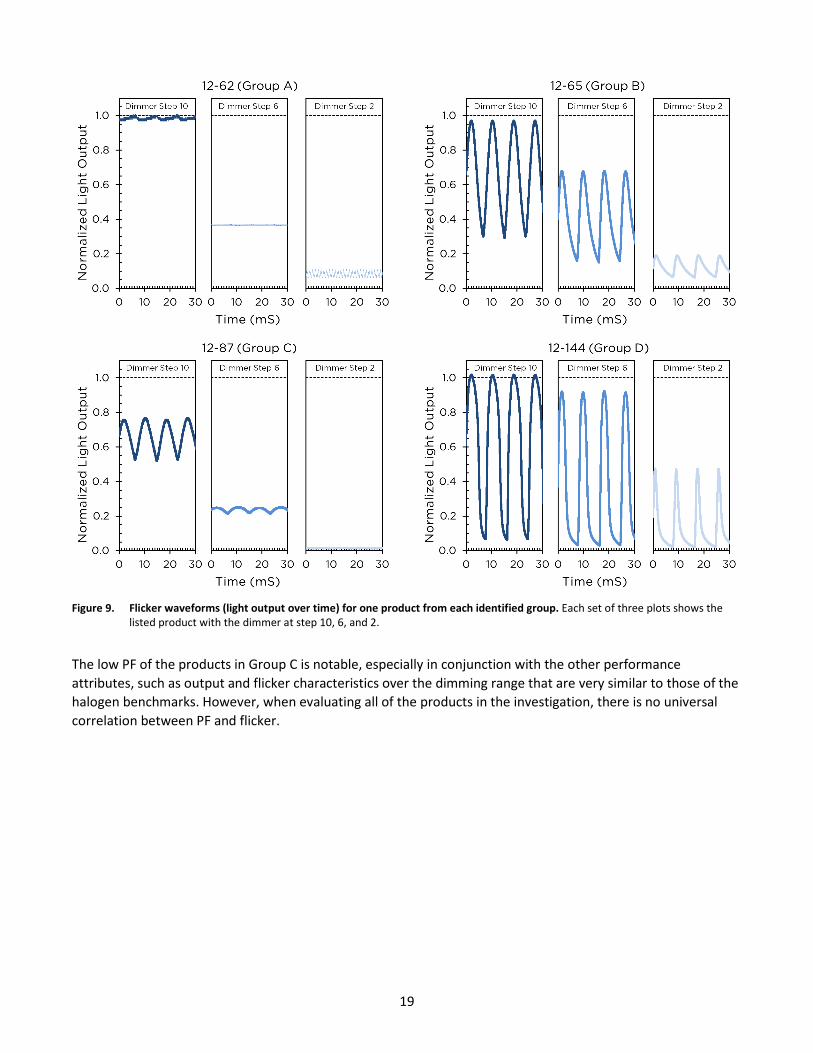
Figure 9. Flicker waveforms (light output over time) for one product from each identified group. Each set of three plots shows the listed product with the dimmer at step 10, 6, and 2.
The low PF of the products in Group C is notable, especially in conjunction with the other performance attributes, such as output and flicker characteristics over the dimming range that are very similar to those of the halogen benchmarks. However, when evaluating all of the products in the investigation, there is no universal correlation between PF and flicker.
19
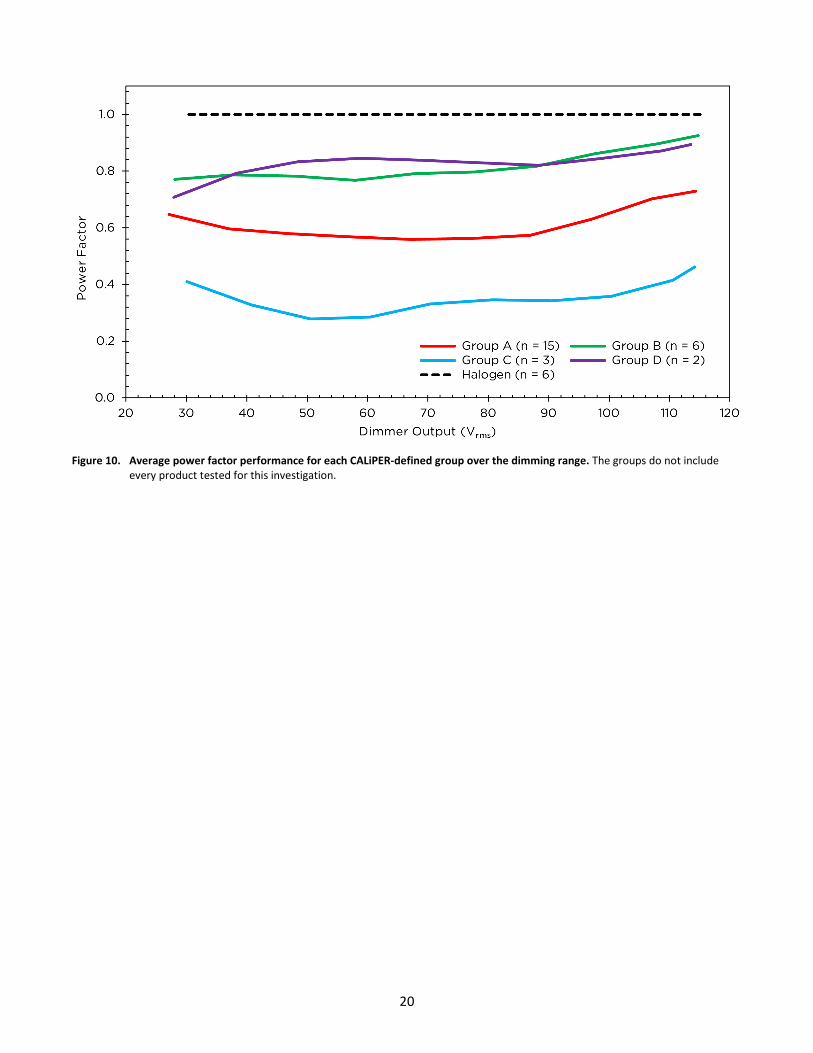
Figure 10. Average power factor performance for each CALiPER-defined group over the dimming range. The groups do not include every product tested for this investigation.
20

5 Conclusions
While the dimming, flicker, and power quality behaviors of halogen PAR38 lamps are very consistent—and therefore predictable—the behavior of LED lamps evaluated in this study with a single dimmer was less consistent. It is also important for users to recognize that not all LED lamps are intended to be dimmed, as was the case for more than a quarter of the Series 20 LED PAR38 lamps purchased and tested by CALiPER.
The performance of some of the 33 LED products listed as dimmable was similar across numerous metrics, likely indicating similar control circuitry. However, there were also many products that were not in any identifiable group, and two of the groups included only a few products. At present, it is difficult to predict dimming, flicker, and power quality performance for LED lamps when purchasing, but here are some important trends:
• Most LED lamps produced more relative light output at a given dimmer level than the benchmark halogen PAR38 lamps.
• The most frequent dimming characteristic that is not present for halogen lamps was high-end dead travel, although this typically occurred over only a small range. Additional testing with finer voltage steps may be warranted.
• When operated by a switch, almost all of the LED PAR38 lamps tested exhibited less flicker than a magnetically ballasted fluorescent lamp, and more than two-thirds exhibited less than or comparable flicker to a halogen lamp. However, when dimmed, both Flicker Index and Percent Flicker indicate that about half of the lamps exhibited more flicker than a magnetically ballasted fluorescent lamp, and almost all of the LED products exhibited more flicker than a typical halogen lamp.
• While all of the LED lamps tested met the current ANSI-defined thresholds for power factor (power less than 35 W) when operated by the switch, nearly one-third had a power factor of less than 0.5 at some point over the dimming range, which would not meet the standard.
21

Appendix A: Lamp Descriptions and Dimmability Claims
Table A1. Identifying information and dimmability claims for the lamps included in the CALiPER PAR38 dimming, flicker, and power quality investigation.
ID Brand Model Dimmability Claim
12-62 Ecosmart ECS 38 WW FL 120 (866-194)
Yes; "Compatible with most dimmer switches."
12-64
12-65
TCP
Lighting Science Group Definity
LED17E26P3830KNFL
DFN 38 W27 V2 NFL 120
Yes; "Smooth, uniform dimming from 100% to 0.5%" "Uniform dimming from 100% to 0%" Yes; "Dimmable to 5% of light on most dimmers."
12-66 Eiko LEDP-11WPAR38/SP/830-DIM Yes; "Use only dimmers rated 600W or lower, made after 1995."
12-67 Cree LED Lighting LRP38-10L-30K-12D Yes; "Dimmable to 20% with ELV dimmers"
12-72 Sylvania LED21PAR38/DIM/P/930/FL30 (78745)
Yes
12-73 Feit Electric PAR38/HP/LED No
12-74 Satco Products, KolourOne
S8853 Yes; "When dimming, see recommended dimmer on the bottom panel."
12-75 GE Lighting LED17P38S830/17 (64035)
No
12-76 Satco Products S8752 No
12-77
12-78
Philips
Toshiba E-CORE
18E26PAR38-4 (18PAR38/END/F25 3000-1200 DIM)
19P38/835SP8 (LDRB2035NE6USD)
Yes; "Smooth dimming to 10% of full light levels" "Dimmable when using leading edge dimmers" Yes; "Lamp not compatible with all dimmers."
12-79 Westinghouse 18PAR38/LED/DIM/30 (03434)
Yes
12-80
12-81
MaxLite MaxLED
Halco Lighting ProLED
SKR3817SPDLED30
PAR38/16WW/NFL/LED (80034)
Yes; "Dimmable down to 5%" "Can only be dimmed. Do not use with timers or other control devices." Yes; "Dimmable to 5% for design flexibility"
12-82 Litetronics LP15566FL4D (64350)
Yes
12-85 LEDnovation LED-PAR38-90-1WD-1WF Yes; "100-10%"
12-86 Solais Lighting LR38/10/30K/18W/1025/GY Yes
Continued on next page.
22
Table A1 (Continued)
ID Brand Model Dimmability Claim
12-87 Honeywell HWL1FP3811301BDIM Yes; "Dimming from 100% to 1% of full light (HWL1FP3811D) output"
12-88 Lumena MS-PAR38-120V60-27 Yes; "Dims to 5%
12-89 NuVue NV-PAR38I20W26C No (NV/PAR38/9.2 WW NFL 26 CR)
12-90 Acculamp ALSP38 900L R9 No (dimmable version available)
12-91 Verbatim P38ES-L1000-C30-B25 (97848) Yes; "10%-100% dimming performance"
12-92 Samsung SI-P8V181DB0US Yes (SLA0-PAR38-75-AYD-830-25R)
12-93 Sharp DL-L 16P3830A Yes; "10-100% - Not suitable for all dimmers"
12-94 Zenaro SL-PAR38/B/P17/50/E30/ND/26/UNI/US No (dimmable version available)
12-95 MSI Solid State IPAR3830101D Yes Lighting
12-96 Array Lighting AE26PAR38183010 Yes; "100% to 10% on most incandescent commercial dimmers"
12-97 Havells 16W/LED/PAR38/FL No claim (48541)
12-98 Firefly FFP38/28/120/S/3K/25 Yes; "Dimmable to 10%"
12-99 LEDirect NaturaLED LED17PAR38/DIM/NFL/30K Yes; "Compatible with most TRIAC dimmers"
12-100 aleddra PAR38-S-D-45-30 Yes; "TRIAC dimmer 10%-100% (110V)"
12-101 Seesmart 15W Day White 45° LED PAR 38 No (180026)
Note: This product was not investigated because it was replaced with a version with a different CCT.
12-102 LED Waves LW10-5001-C18-CXX-W3K (Pella) No
12-103 Kleen Lighting KL2-PAR3820W13 No (dimmable version available)
12-104 AIBC LED Lighting AL-ES-11P38DIM-3000-610-110 Yes; "Full range dimming" (ALES11P38DIM40)
12-134 Duracell DL-P38F-60-30K-WH Yes; "Dimming range 20-100%"
Continued on next page.
23

Table A1 (Continued)
ID Brand Model Dimmability Claim
12-135 Axiom AP10W27V120 Yes; "fully dimmable and can be used with the Lutron line of electronic low voltage dimmers"
12-140 Philips BC19.5PAR38/AMB/3000K/ FL25 DIM Yes 120V
12-144 Solais Lighting LRP38/25/30 Yes
12-145 Seesmart 15W Warm White 45° LED PAR 38 No (180025)
12-146 Zenaro SL-PAR38C/H/P16/50/E30/TD/26/LAC Yes
12-147 Lights of America 2213DLEDNP38 - LF3-8 Yes
12-148 LEDWaves LW10-NYC-008-WW-DM Yes
Benchmarks BK12-631 Philips EL/A PAR38 23W 2PC (9292689721102) No
BK12-682 GE 60PAR/HIR/FL30 (18626) Yes (Halogen)
BK12-692 Sylvania 75PAR/CAP/SPL/WSP12 120V Yes (Halogen)
BK12-702 Philips 75PAR38/HAL/FL25 Yes
BK12-712 Philips 75PAR38/HAL/SP10 Yes
BK12-1411 Feit Electric ESL23PAR/ECO No
BK12-1422 Eiko 75PAR38/H/WFL-120V (49547) Yes (Halogen)
BK12-1432 OSRAM SYLVANIA 75PAR/CAP/SPL/SP9 130V (14516) Yes (Halogen)
1. CFL 2. Halogen or halogen infrared (HIR)
24
Appendix B: Switched versus Dimmed Operation
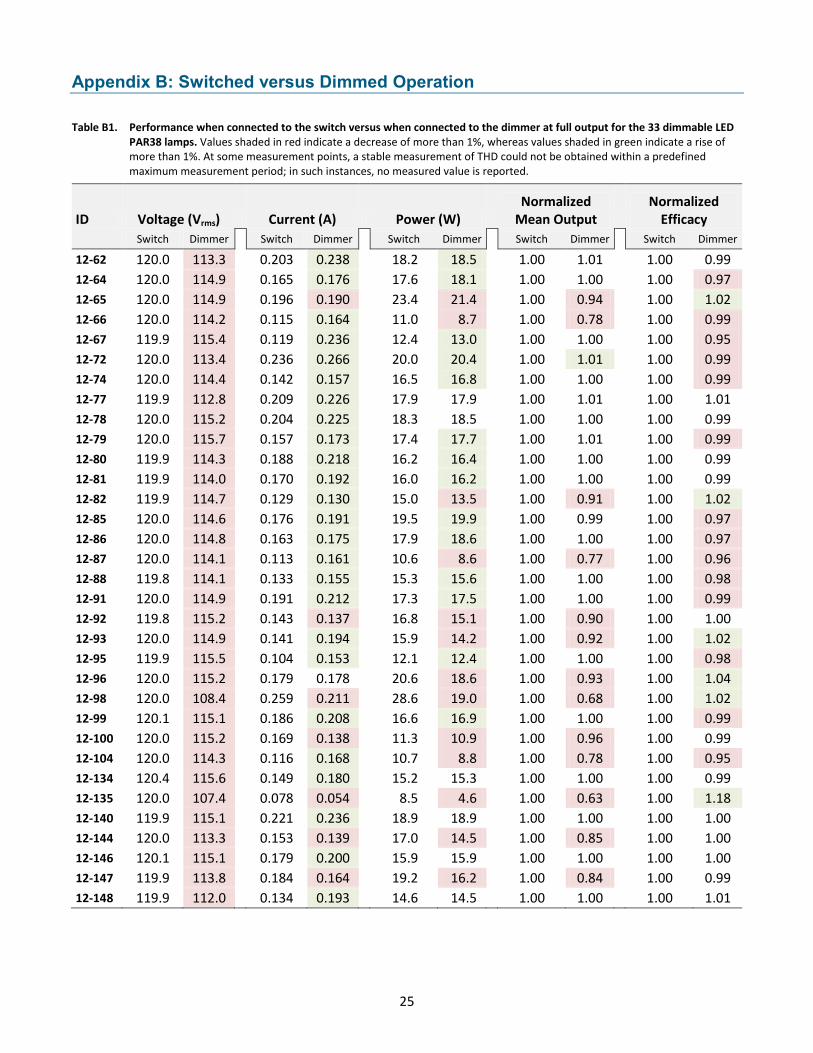
Table B1. Performance when connected to the switch versus when connected to the dimmer at full output for the 33 dimmable LED PAR38 lamps. Values shaded in red indicate a decrease of more than 1%, whereas values shaded in green indicate a rise of more than 1%. At some measurement points, a stable measurement of THD could not be obtained within a predefined maximum measurement period; in such instances, no measured value is reported.
Normalized Normalized ID Voltage (Vrms) Current (A) Power (W) Mean Output Efficacy
Switch Dimmer Switch Dimmer Switch Dimmer Switch Dimmer Switch Dimmer
12-62 120.0 113.3 114.9 114.9 114.2 115.4 113.4 114.4 112.8 115.2 115.7 114.3 114.0 114.7 114.6 114.8 114.1 114.1 114.9 115.2 114.9 115.5 115.2 108.4 115.1 115.2 114.3 115.6 107.4 115.1 113.3 115.1 113.8 112.0
0.203 0.238 0.176 0.190 0.164 0.236 0.266 0.157 0.226 0.225 0.173 0.218 0.192 0.130 0.191 0.175 0.161 0.155 0.212 0.137 0.194 0.153
18.2 18.5 18.1 21.4
8.7 13.0 20.4 16.8
1.00 1.01 1.00 0.99 12-64 120.0 0.165 17.6 1.00 1.00 1.00 12-65 120.0 0.196 23.4 1.00 0.94
0.78 1.00
12-66 120.0 0.115 11.0 1.00 1.00 12-67 119.9 0.119 12.4 1.00 1.00 1.00 12-72 120.0 0.236 20.0 1.00 1.01 1.00 12-74 120.0 0.142 16.5 1.00 1.00 1.00
0.97 1.02 0.99 0.95 0.99 0.99
12-77 119.9 0.209 17.9 17.9 1.00 1.01 1.00 1.01 12-78 120.0 0.204 18.3 18.5 1.00 1.00 1.00 0.99 12-79 120.0 0.157 17.4
0.211 0.208 0.138 0.168 0.180 0.054 0.236 0.139 0.200 0.164 0.193
17.7 16.4 16.2 13.5 19.9 18.6
8.6 15.6 17.5 15.1 14.2 12.4 18.6 19.0 16.9 10.9
8.8
1.00 1.01 1.00 0.99 12-80 119.9 0.188 16.2 1.00 1.00 1.00 0.99 12-81 119.9 0.170 16.0 1.00 1.00 1.00 0.99 12-82 119.9 0.129 15.0 1.00 0.91 1.00 12-85 120.0 0.176 19.5 1.00 0.99 1.00 12-86 120.0 0.163 17.9 1.00 1.00 1.00 12-87 120.0 0.113 10.6 1.00 0.77 1.00 12-88 119.8 0.133 15.3 1.00 1.00 1.00 12-91 120.0 0.191 17.3 1.00 1.00 1.00
0.95 0.96 0.78
1.02 0.98 1.04 1.02 0.99
0.90 0.92
1.02 0.97 0.97 0.96 0.98 0.99
12-92 119.8 0.143 16.8 1.00 1.00 1.00 12-93 120.0 0.141 15.9 1.00 1.00 12-95 119.9 0.104 12.1 1.00 1.00 1.00 12-96 120.0 0.179 0.178 20.6 1.00 0.93
0.68 1.00
12-98 120.0 0.259 28.6 1.00 1.00 12-99 120.1 0.186 16.6 1.00 1.00 1.00 12-100 120.0 0.169 11.3 1.00 1.00 0.99 12-104 120.0 0.116 10.7 1.00 1.00 12-134 120.4 0.149 15.2 15.3 1.00 1.00 1.00 0.99 12-135 120.0 0.078 8.5 4.6 1.00 0.63 1.00 1.18 12-140 119.9 0.221 18.9 18.9 1.00 1.00 1.00 1.00 12-144 120.0 0.153 17.0 14.5 1.00 0.85 1.00 1.00 12-146 120.1 0.179 15.9 15.9 1.00 1.00 1.00 1.00 12-147 119.9 0.184 19.2 16.2 1.00 0.84 1.00 0.99 12-148 119.9 0.134 14.6 14.5 1.00 1.00 1.00 1.01
25
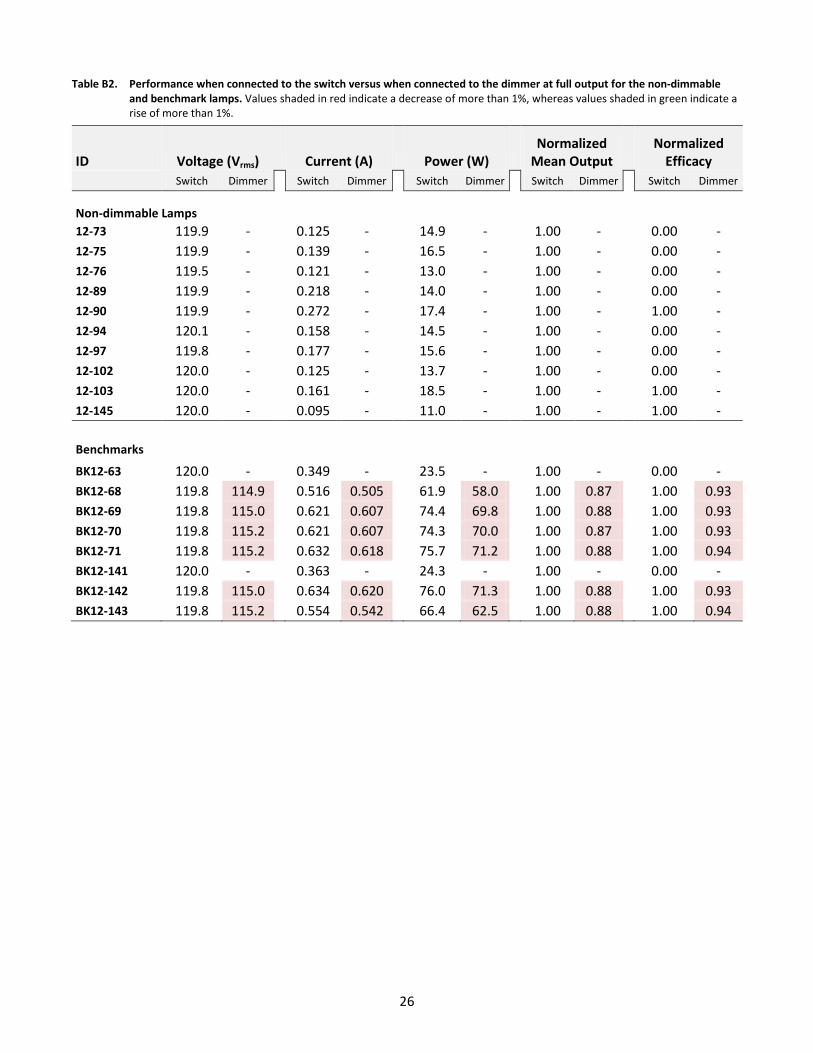
Table B2. Performance when connected to the switch versus when connected to the dimmer at full output for the non-dimmable and benchmark lamps. Values shaded in red indicate a decrease of more than 1%, whereas values shaded in green indicate a rise of more than 1%.
Normalized Normalized ID Voltage (Vrms) Current (A) Power (W) Mean Output Efficacy
Switch Dimmer Switch Dimmer Switch Dimmer Switch Dimmer Switch Dimmer
Non-dimmable Lamps 12-73 119.9 - 0.125 - 14.9 - 1.00 - 0.00 12-75 119.9 - 0.139 - 16.5 - 1.00 - 0.00 12-76 119.5 - 0.121 - 13.0 - 1.00 - 0.00 12-89 119.9 - 0.218 - 14.0 - 1.00 - 0.00 12-90 119.9 - 0.272 - 17.4 - 1.00 - 1.00 12-94 120.1 - 0.158 - 14.5 - 1.00 - 0.00 12-97 119.8 - 0.177 - 15.6 - 1.00 - 0.00 12-102 120.0 - 0.125 - 13.7 - 1.00 - 0.00 12-103 120.0 - 0.161 - 18.5 - 1.00 - 1.00 12-145 120.0 - 0.095 - 11.0 - 1.00 - 1.00
Benchmarks
BK12-63 120.0 - 0.349 - 23.5 - 1.00 - 0.00 BK12-68 119.8 114.9
115.0 115.2 115.2
0.516 0.505 0.607 0.607 0.618
61.9 58.0 69.8 70.0 71.2
1.00 0.87 0.88 0.87 0.88
1.00 BK12-69 119.8 0.621 74.4 1.00 1.00 BK12-70 119.8 0.621 74.3 1.00 1.00 BK12-71 119.8 0.632 75.7 1.00 1.00 BK12-141 120.0 - 0.363 - 24.3 - 1.00 - 0.00 BK12-142 119.8
0.93 0.93 0.93 0.94
115.0 115.2
0.634 0.620 0.542
76.0 71.3 62.5
1.00 0.88 0.88
1.00 BK12-143 119.8 0.554 66.4 1.00 1.00
0.93 0.94
26

Table B3. Flicker and power quality performance when connected to the switch versus when connected to the dimmer at full output for the 33 dimmable LED PAR38 lamps. Values shaded in red indicate a decrease of more than 1%, whereas values shaded in green indicate a rise of more than 1%.
ID Flicker Index Percent Flicker THD-I Power Factor Switch Dimmer Switch Dimmer Switch Dimmer Switch Dimmer
12-62 0.0028 0.0028 0.0156 0.1561
2% 2% 85%
0.0027 0.0052 0.0932 0.0050 0.0146 0.0059 0.0025 0.0016 0.1264 0.0046 0.0062 0.0514 0.0815 0.0032 0.1803 0.0849 0.0014 0.1174 0.5693 0.0033 0.0133 0.0572 0.0029 0.5785 0.0030 0.2819 0.0027 0.3063
54% 15%
98% 54%
0.75 0.68 12-64 0.0148 9% 9% 47% 0.89 0.90 12-65 0.1367 43% 1% - 1.00 12-66 0.0372 0.0370 13% 40% 141% 0.79 12-67 0.0026 2% 2% - - 0.87 12-72 0.0083 10% 8%
33% 3%
95%
2% 45%
4%
104% 36%
106% 96% 53%
111% 90% 35%
0.71 12-74 0.0793 26% 15% 0.97 12-77 0.0044 2% 96% 0.72 12-78 0.0148 6% 6% 87% 0.75 12-79 0.0052 3% 4% 41% 0.92 12-80 0.0021 1% 1% 94% 0.72 12-81 0.0012 2% 77% 0.79 12-82 0.1071 34% 20% 0.98 12-85 0.0048 4% 33% - 0.92 12-86 0.0059 4% 4% 43%
19% 29%
46% 155%
0.92 12-87 0.0496 18% 42% 0.78 12-88 0.0668 22% 14% - 0.96 12-91 0.0029 2% 2% 86%
60% 32%
96% 0.75 12-92 0.1560 50% 16% - 0.99 12-93 0.0670 23% - 85% 0.94 12-95 0.0016 2% 2% - 918% 0.97 12-96 0.0949 31% 43% - 799% 0.96 12-98 0.4255 99% 98% 43%
8% 20%
80% 98%
0.92 12-99 0.0035 3% 3% 88% 0.74 12-100 0.0135 7% - - 0.55 12-104 0.0556 19% 42%
88%
153% 86% 91%
103%
0.77 12-134 0.0028 3% 3% 61% 0.85 12-135 0.4677 100% 100% 47% 0.90 12-140 0.0031 2% 2% 96% 0.72 12-144 0.1859 80% 38% - 0.93 12-146 0.0027 2% 2% 90% 102%
45% 0.74
12-147 0.1549 100% 100% 55% 0.87 0.87
0.98 0.46 0.48 0.68 0.93 0.70 0.71 0.89 0.66 0.74 0.90 0.91 0.93 0.47 0.88 0.72 0.95 0.64 0.70 0.91 0.83 0.70 0.69 0.46 0.73 0.78 0.70 0.92 0.69
27
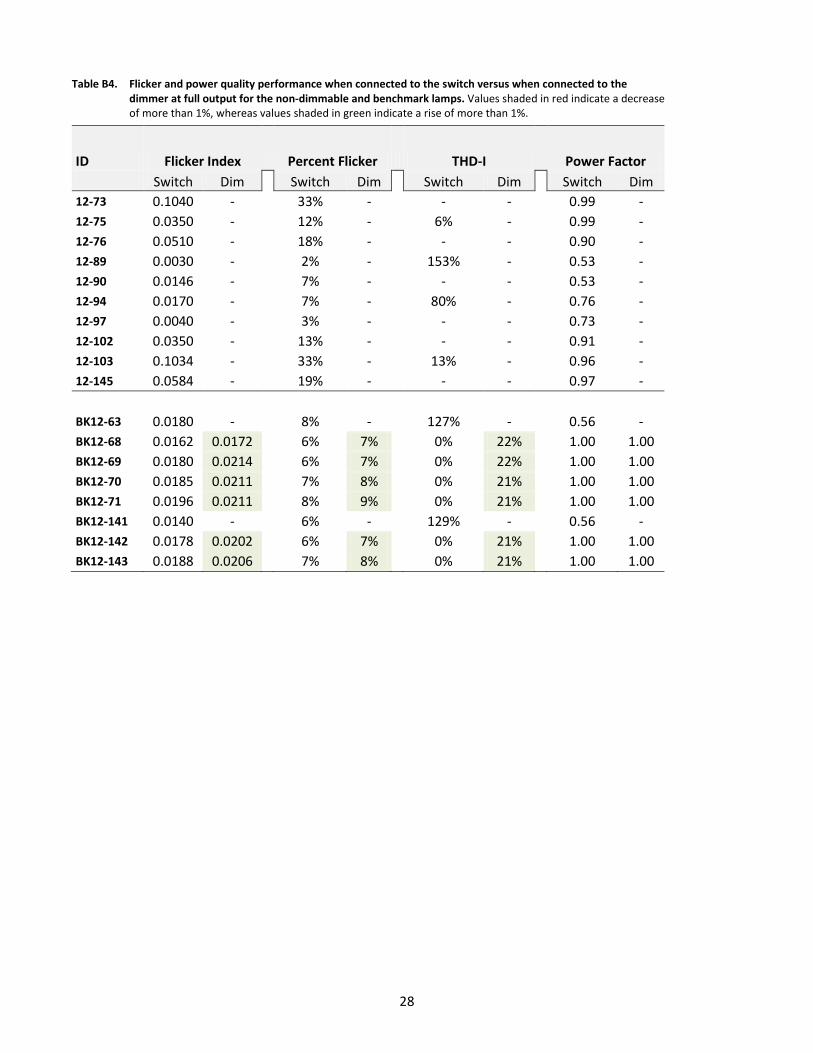
Table B4. Flicker and power quality performance when connected to the switch versus when connected to the dimmer at full output for the non-dimmable and benchmark lamps. Values shaded in red indicate a decrease of more than 1%, whereas values shaded in green indicate a rise of more than 1%.
ID Flicker Index Percent Flicker THD-I Power Factor
12-73 0.1040 - 33% - - - 0.99 -12-75 0.0350 - 12% - 6% - 0.99 -12-76 0.0510 - 18% - - - 0.90 -12-89 0.0030 - 2% - 153% - 0.53 -12-90 0.0146 - 7% - - - 0.53 -12-94 0.0170 - 7% - 80% - 0.76 -12-97 0.0040 - 3% - - - 0.73 -12-102 0.0350 - 13% - - - 0.91 -12-103 0.1034 - 33% - 13% - 0.96 -12-145 0.0584 - 19% - - - 0.97 -
Switch Dim Switch Dim Switch Dim Switch Dim
BK12-63 0.0180 - 8% - 127% - 0.56 BK12-68 0.0162 0.0172
0.0214 0.0211 0.0211
6% 7% 7% 8% 9%
0% 22% 22% 21% 21%
1.00 1.00 BK12-69 0.0180 6% 0% 1.00 1.00 BK12-70 0.0185 7% 0% 1.00 1.00 BK12-71 0.0196 8% 0% 1.00 1.00 BK12-141 0.0140 - 6% - 129% - 0.56 BK12-142 0.0178 0.0202
0.0206 6% 7%
8% 0% 21%
21% 1.00 1.00
BK12-143 0.0188 7% 0% 1.00 1.00
28

Appendix C: Flicker over Dimming Range
Figure C1. Flicker Index (top) and Percent Flicker (bottom) over the dimming range. The performance thresholds shown are based on CALiPER test data.
29