Strategy for Increasing Traditional Market Competitiveness ...

RETAIL BANK SERVICES STRATEGY 129
Journal of Management Information Systems / Fall 2001, Vol. 18, No. 2, pp. 129–152.
© 2001 M.E. Sharpe, Inc.
0742–1222 / 2001 $9.50 + 0.00.
Retail Bank Services Strategy: A Model ofTraditional, Electronic, andMixed Distribution Choices
REYNOLD E. BYERS AND PHILLIP J. LEDERER
REYNOLD BYERS is an Assistant Professor at the Graduate School of Management atthe University of California, Irvine. He received his Ph.D. in Operations Manage-ment from the University of Rochester’s Simon School of Business. He also has aBachelor’s and Master’s degree in Mathematics from Brigham Young University. Hisresearch interests cover issues in service industries, including structuring service de-livery systems, performance measurement, and competition.
PHILLIP J. LEDERER is Associate Professor of Operations Management at the WilliamE. Simon Graduate School of Business Administration. His teaching and researchinterests are in operations management strategy. His work has appeared in journalssuch as Econometrica, Operations Research, Transportation Science, Operations Re-search Letters, Journal of Operations Management, and Regional Science and UrbanEconomics.
ABSTRACT: Design of a retail banking distribution strategy is an important issue inthat industry. This paper shows the effect of new electronic distribution technologiessuch as PC banking on the choice of a bank’s distribution strategy. We present acompetitive model of distribution strategy choice, including heterogeneous consum-ers and banks, that allows a rich variety of customer preference and technology costparameters. Sensitivity analysis shows how several parameters affect the competitiveoutcome. This analysis suggests that changing consumer behavior and attitudes, in-stead of banks’ cost structure with new technologies significantly affects the bank’sdistribution strategy choice. If the segment of consumers that prefers PC bankingremains small relative to the segment that prefers branches, then there will still be amarket for specialized branch banks. Branch banking without PC banking serviceswill be a viable strategy until the segment that prefers PC banking grows larger (amount-ing to about 40 percent of all transactions). Banks offering both branch and PC bank-ing services can prevent successful and profitable entry by virtual banks (Internetbanks offering only PC banking services) as long as the segment of customers thatprefer PC banking remains relatively small (less than two-thirds of all transactions).Beyond this fraction, virtual banks will be profitable. This analysis suggests that itmay be a long time (if ever) before virtual banks turn a profit.
KEY WORDS AND PHRASES: automated teller machines, ATM, banking industry, branchbanking, channel selection, distribution channels, electronic banking, financial ser-vices, PC banking, retail banking
08 byers.p65 08/01/2001, 10:49 PM129

130 BYERS AND LEDERER
Technology and Competition in Retail Banking
OVER THE PAST TWENTY YEARS the retail banking industry has experienced majorchanges. These changes include increased competition among banks and nonbanks,evolution in customer preferences, and technological advances in bank distributionsystems [3]. With deregulation of the financial services sector, nonbanks can nowcompete with banks, and banks can provide services in formerly prohibited geographi-cal areas. The rise of PCs has created a group of customers with the ability and desireto conduct remote transactions. Technological advances have shifted retail banking’shistorical reliance on branches. Many banks have expressed a desire to reduce thenumber of bank branches and shift transactions to lower-cost electronic channels [12,15]. Further, the advent of “pure” virtual banks—banks with no branches or ATMs—has called into question the importance of bank branches, even driving some to pre-dict that branches will one day be virtually eliminated from retail banking distribution[7]. Others have suggested that banks will have to offer the full range of technologychoices, including branches, to customers, or be forced out of the market [3].
This paper examines a retail bank’s choice of distribution strategy in light of themajor competitive and consumer changes in the marketplace. The paper applies aneconomic model of a competitive market for retail banking services to generate in-sights into the following relevant questions: Is the cost structure of electronic distri-bution systems sufficient to justify “pure” virtual banks? What is the effect of changingcustomer preferences and other market parameters on the equilibrium mix of banks?Does technology choice affect a retail bank’s ability to compete? In short, our an-swers are: probably not, virtual banks will not be successful until a large fraction ofconsumers prefers PC banking over branches; changing customer preference willresult in fewer branch banks and more banks offering branch and PC banking ser-vices; and yes, technology will be increasingly important for banks to compete. Asour purpose is to model competition between retail banks, any reference to a bank ismeant to be a retail bank, not a commercial or investment bank.
Our goal is to model competition between banks and nonbank financial servicesfirms in order to predict the probable “winners and losers” in the market. The modelemployed captures a rich variety of influential market parameters, both from the con-sumer side and the producer side. For simplicity we assume two different customersegments, each with preferences for technologies and the price and convenience ofservices. Consumers differ in their attitudes toward transaction technology. In prac-tice, many customers may be averse to dealing with tellers and prefer the efficiency ofan ATM or PC banking system, but other customers are wary of remote technologyand prefer the secure feeling of interacting with a teller. In this study we allow twocustomer segments corresponding to those consumers preferring branches and thoseconsumers preferring electronic distribution. On the producer side, retail banks canchoose between various distribution technologies to capture transactions, includingbranches, ATMs, and PC banking systems. Further, the model incorporates both fixedand variable costs of providing banking service. The model is developed under suffi-cient conditions to guarantee the existence of a competitive entry equilibrium. A com-
08 byers.p65 08/01/2001, 10:49 PM130
RETAIL BANK SERVICES STRATEGY 131
petitive entry equilibrium requires customers to maximize their utility, banks to maxi-mize their profits, total supply to equal demand, and potential bank entrants to earnzero profit once entry occurs.
We found major results that we describe next. Depending on the mix of customersegments, there are three separate strategies that can competitively dominate all oth-ers. These strategies are the only ones observed in equilibrium: (1) a branch bankingstrategy serving only the segment of customers that prefer branch transactions, (2) aPC banking strategy serving only the segment that prefers electronic transactions,and (3) a combined strategy using branches and PC banking that serves each segmentusing its preferred channel. These strategies dominate systems using only branches toserve both segments, and systems using ATM systems without branches (either abank’s own or ones from another bank). Thus a bank that wishes to serve both seg-ments needs a branch system as well a PC banking system. A bank that wishes toserve the branch banking preferring segment must have branches, and a bank thatwishes to serve the segment preferring electronic distribution must have a PC bank-ing system.
Currently, the electronic channel segment is very small—fewer than seven percentof households with PCs have PC banking accounts. If the segment of consumers thatprefers PC banking remains small relative to the segment that prefers branches, thenthere will still be a market for specialized branch banks. If this segment is small,banks offering both branches and PC banking services can prohibit successful entryby virtual banks (banks that do not have their own branches). However, if the custom-ers who prefer electronic transactions grow at the expense of the other segment, assome have suggested, the model predicts that branch banks, and some banks offeringboth branches and PC banking services, will exit the market in favor of virtual banks.Before a virtual bank profitably survives, however, this segment must generate abouttwo-thirds of market transactions.
Further analysis shows that the equilibrium results are relatively insensitive to thefixed and variable costs of technology. The results generally suggest that changingconsumer behavior, rather than bank cost structure, drives changes in retail bank com-petitive strategies at equilibrium, and that virtual banking strategies are unlikely tosucceed.
While there are other papers in the literature with related modeling approaches, noother papers address the banking distribution strategy question. The closest paper [2]models competition between retailers and a direct marketer. The retailers have a physi-cal outlet, and the direct marketer uses catalogs. That paper identifies the prices andmarket shares that result and demonstrates the conditions under which a direct mar-keter can successfully compete against the retailers. However it considers only asingle customer segment with inelastic demand, and the firms are either of one typeor another.
Lederer and Li [11] model time-based competition with heterogeneous firms andcustomer segments. Their paper is relevant to our current effort in that it modelscompetition when customer tastes can be described with a hedonic pricing model inwhich the costs and benefits of attributes add to the customer’s cost. Also related is
08 byers.p65 08/01/2001, 10:49 PM131
132 BYERS AND LEDERER
De Vany and Saving [6], who address the determination of quality in an equilibriummodel and consider the relationship of social welfare and market equilibrium. How-ever, their approach considers only a single product and firm type. Hence, they do notaddress a changing mix of firms in equilibrium.
Prasad and Harker [14] address the question of pricing PC banking services consid-ering the existence of network externalities. However, they do not address the issue ofstrategic choice of distribution technology or equilibrium. Several articles in the in-dustry literature discuss the nature of branches and locations in a marketing frame-work. Other articles discuss strategic branch location focusing on qualitative aspects,such as sharing facilities with supermarkets or warehouse stores [1, 9, 16, 17]. Al-though others discuss the trade-offs and strategies involved in choosing a distributionstrategy, none applies an analytical approach [3, 15]. Finally, there are some math-ematical models of locating bank branches in a market. Most of these models addressthe optimal location of branches based on demographic information, but do not ad-dress the trade-off between alternative service delivery systems [5, 8, 10, 13].
Model of Retail Banking Market
NEXT, WE PRESENT A MODEL OF THE MARKET for retail banking services with hetero-geneous consumers and banks. The purpose of the model is to study competitionbetween competing banks who choose prices for services, distribution technologies,and volumes of customers served. Our model captures many aspects of competition.Banks compete by providing retail banking transactions to spatially dispersed con-sumers for a fee, and these transactions can be provided through different distributiontechnologies, for example, branches and PC banking. Banks may differ in their choiceof distribution strategy. Consumers differ in their sensitivity to price, preference fordistribution technology, and average distance from a retail bank. Market demand fortransactions is a decreasing function of consumer costs, including price and conve-nience costs. Banks differ in cost structure and distribution technology choices. Toassist the reader, Table 1 lists and describes the major variables and parameters de-fined in this paper.
Competition between banks is modeled following a variation of the “perfect compe-tition” model. That is, banks are “price takers.” But our model differs in several impor-tant ways: we consider the fixed costs of entry to a market and allow banks to enterand exit. Also, customers evaluate purchases on the total cost of goods, where totalcost includes the price and convenience or quality of the item. How we model compe-tition is deferred to in the next section. We begin by considering banks’ decisions.
We allow banks to choose one or several ways to collect and distribute transactions.Formally, the set of distribution technologies are in the set K = {B (branch banking),PC (home PC banking), ATM (owned ATMs), OATM (other banks’ ATMs)}.
For ease of analysis we assume that the technologies are generally standardized sothat any banks choosing a particular technology have the same cost structure for thattechnology. Branches represent the “classical” bank outlet, either the usual indepen-
08 byers.p65 08/01/2001, 10:49 PM132

RE
TA
IL BA
NK
SE
RV
ICE
S S
TR
AT
EG
Y 133
Table 1. Summary of Notation
Variable Remarks Meaning of Notation
IndicesK = {B, PC, Indices to indicate Set of distribution technologies: branches, PC banking, a banks own ATM, using other banks’ATM, OATM} technology ATMs, respectively.k Generic index for
technologyJ = {b,e} Indices used to Set of consumer segments: branch preferring customers and electronic distribution-preferring
indicate segment customers, respectively.j Generic index for
segmentI Set of firm strategies: what subset of distribution technologies a bank has (a subset of JxK).i Generic index for
strategy
Cost parametershjk Disutility imposed on customer segment j by a transaction through technology k ($/transaction)βj Coefficient of segment j’s disutility due to distance ($/mile)Fk Yearly fixed cost of placing an outlet using technology k in the market region, k = {B,ATM} ($/year)Gi Yearly fixed cost of maintaining a network of strategy i ($/year)ck Coefficient of variable cost per transaction’s linear term ($/transaction)djk Coefficient of the variable cost per transaction’s quadratic term ($/transaction2)
(continued)
08 byers.p6508/01/2001, 10:49 P
M133

134 BY
ER
S A
ND
LED
ER
ER
Table 1. Summary of Notation (continued)
Variable Remarks Meaning of Notation
Banks decisionsnk This is exogenously Number of outlets of distribution technology k
held fixed in this paperrjp ; p Price per transaction charged to segment j ($), vector of these prices for all segments ($)
jP P;r
Full price includes Full price per transaction charged to segment j, vector of these prices for all segments ($)price, travel costs,and disutility due totechnology typer
im ; m Number of firms using strategy i. The vector of firms’ strategy choices.τ τ
rijk i; Number of transactions supplied by a bank using strategy i, serving customer segment j with
distribution technology k. The vector of transactions by strategy for strategy i.
Demand function( ) ( )r rv
jd P ; d P Demand by segment j given full price vector rP . Vector of demand for each customer segment
given price vector rP .
08 byers.p6508/01/2001, 10:49 P
M134

RETAIL BANK SERVICES STRATEGY 135
dent facility or the smaller facility placed in grocery stores. We assume that a branchhas an attached ATM to reduce congestion and offer longer service hours. In eithercase, the primary forms of customer contact in a branch are tellers, account represen-tatives, or ATMs. This is what we mean by the “B” technology. Banks can also try touse ATMs (or highly automated kiosks) to serve customers as a substitute for branches.The “ATM” technology is an automated distribution system that completely replacesbranches. “OATM” is a distribution technology where other banks’ ATMs similarlysubstitute for a branch system. Finally, PC banking systems offer the convenience ofconducting basic bill-paying and account-management transactions from home, aswell as other transactions, such as trading stocks, purchasing insurance, ordering post-age stamps, and applying for loans. Each technology affects customers and banks indifferent ways, through disutility and cost.
Each retail bank competes in the market by choosing a distribution strategy, de-fined by technology choice, transaction volumes, and prices for services.
The next subsections study modeling details about customers and banks, respec-tively.
Customers
Customers demand retail bank transactions whose volume depends on the full cost ofconducting a transaction. Full costs are imposed on customers in three ways: price,technology preferences, and distance traveled to conduct a transaction. In practice,retail banks charge prices in different ways, many of them indirect. Examples of theways that retail banks charge prices include fees for a specific service, minimumaccount balances, periodic fees, and deals for packages of services. The model em-ployed in this paper approximates the multiple pricing methods used in practice by aper-transaction pricing approach to avoid additional complexity.
Consumers differ in their attitudes toward transaction technology. This is a majorsource of segmentation of customers. We denote two respective customer segmentsby J = {e,b}, where b is a branch-preferring segment, and e is an electronic channel-preferring segment. (Sometimes we refer to the respective segments as e’s and b’s ).These preferences are modeled as an additional cost per transaction, due to disutility,imposed on the customer. Denote the disutility imposed on customer segment j by atransaction through technology k as hjk. Assume that each customer segment has a“preferred” distribution technology. For the preferred technology hjk = 0, and for allother technologies hjk ≥ 0.
Consumers are sensitive to the distance they must travel to conduct a transaction.Since banks place multiple locations throughout a region, and consumers travel ran-domly within the region, it is reasonable to assume that customers do not measure theirdistance to a single retail bank outlet in evaluating their banking relationship. Themodel assumes that customers are sensitive to a measure of distance related to theiraverage distance to a bank outlet. Assume that the bank uses technology k to servesegment j, and that the bank places nk outlets using technology k in the market (k =branches, own ATMS or other’s ATMs). For segment j served by technology k, assume
08 byers.p65 08/01/2001, 10:49 PM135
136 BYERS AND LEDERER
that customer disutility for a single transaction due to travel is in the form βj/nk, whereβj is a scaling parameter for customer segment j using distribution channel k.
Customer demand depends on the total cost and value of the banking relationship.The total cost to the consumer of a banking relationship is a function of price, disutility,and convenience costs of transactions. Let pj denote the price per transaction a retailbank using technology k charges customer segment j. Under these conditions, cus-tomer segment j incurs a full price given by Equation (1)
jj j jk
kj JP p h
n.
∈
β = + +
∑ (1)
We assume that customers buy service from the bank offering the lowest averagefull price per transaction and that the volume of transactions depends on the fullprice. The number of transactions demanded by each customer segment is given by adifferentiable, strictly decreasing function of full price, We write the function thatmaps the least full prices for each segment to the volume demanded by that segmentby the vector valued function
( ) ( ){ }jj J
d P d P .∈
=r rv
We assume that a bank can set a price to each segment it serves, and that a bankuses, at most, one channel to serve each segment. Although this implies that bankscan price discriminate among customer segments, it can be shown that in a competi-tive entry equilibrium, customer self-selection can be assured. Although it appearsthat a bank can choose different prices for each segment and can force customers ineach segment to use the channel the bank has selected, customers will in fact will-ingly choose the channel the bank picks in equilibrium. This is shown in Lederer andLi [11] and Byers and Lederer [4].
Banks
The defining characteristic of a retail bank in our model is its distribution “strategy.”A strategy is defined as a function that maps each customer segment in J into a tech-nology chosen from the set of available distribution technologies K that will be usedto serve that segment. Consider the set of all ordered pairs of elements in J and K:
( ){ }I j k j J k K, | , ,= ∈ ∈ ∪ φ
where φ is the null net. A strategy, i, is a subset of the set of all pairs of segments-technologies I, (i ⊂ I), that maps a single j into at most one k.
We use the following notation for a bank’s distribution “strategy,” which are simplysets of pairs of segments and technologies. In strategy ((b,B)), the branch segment isserved with branches. Strategy ((e,PC)) is a strategy in which the e segment is servedby PC banking, and the bank does not have any physical outlets. Strategy ((b,B)(e,B))
08 byers.p65 08/01/2001, 10:49 PM136
RETAIL BANK SERVICES STRATEGY 137
is a hybrid strategy in which both segments are served by branches. Strategy((b,B)(e,PC)) is one in which the b segment is served by branches, and the e segmentis served by PC banking. In a real sense, ((b,ATM)(e,E)) is an “electronic distributionstrategy,” where ATMs substitute for branches. Strategy ((b,OATM)(e,PC)) is one inwhich a bank does not even own the ATMs with which it serves b customers with.Strategies ((e,PC)) and ((b,OATM)(e,PC)) are “virtual strategies” in which banks pro-vide banking services without any owned branches or ATMs. Although other strate-gies are technically possible, they seem to be less realistic alternatives. We allowthese other combinations to arise in our analysis, though.
In defining set I, we allow a customer segment to be mapped into the null set,meaning that this segment is not served. By definition, a retail bank that offers abranch network with ATMs attached serving e and b customers employs a differentstrategy than one offering branches serving b’s and ATMs serving e’s. Each bankusing strategy i provides a transaction volume for each technology-customer pair,(j,k). Denote the volume decision variable by τijk. Let
( )i ijk j J k K,∈ ∈τ = τv
denote the vector of production volumes for banks using strategy i.Banks can enter this market, so that the number and strategy choices of banks in the
market are endogenously determined. We refer to mr
as the vector of “strategy typesin the market.” Understand that m
r is a vector in R+
|I| and the ith entry of mr
, mi, is thenumber of banks using strategy i in the market. To avoid problems associated with theconstraint of an integer number of firms, we allow m
r to be any nonnegative real-
valued vector. This is clearly an approximation that will not be serious when manyfirms compete for customers. Further, assume that all banks using strategy i are iden-tical, that is, they have the same cost structure and attractiveness to customers.
To complete the specification, the cost structure of the distribution technologiesmust be described. Each distribution technology involves fixed and variable costs andexhibits diseconomies of scale in variable costs because it becomes inefficient if thevolume of transactions processed is too large. Each technology has a fixed cost Gk, avariable technology cost of serving τ transactions through technology k, ckτ, and avariable customer cost of serving τ customers of type j through technology k, djkτ2.This fixed cost also includes the cost of entering a market. The linear variable costreflects the purely operational cost of processing a transaction through technology k.The quadratic term represents the cost incurred by the retail bank for providing in-centives and support to induce customer segment j to transact using technology k.This quadratic form reflects diseconomies of scale in attracting and maintaining cus-tomers, both in terms of support capacity and providing incentives to customers tobring more transaction volume to the retail bank. Further, the diseconomy is a techni-cal necessity of the model since without it there would be no competition in the mar-ket. The only equilibrium result would be monopoly, which is not observed in practice.Despite consolidation, there are nevertheless many competitors in banking markets.Although any strictly increasing, strictly convex function would reflect the diseconomy
08 byers.p65 08/01/2001, 10:49 PM137

138 BYERS AND LEDERER
of scale, the model assumes a quadratic function for simplicity. If a retail bank choosesa strategy with branches, then it is assumed that ATMs are offered at the branchesonly. Each bank employing strategy k chooses a number of locations, nk, at a cost ofFk dollars per outlet. Write the vector of the number of outlets as n
r, where n
r ∈ R+K.
The number of branches and ATMs for each strategy is fixed: the number of outlets forstrategy k is exogenously specified by nk. This is done for simplicity and tractability.1
Each bank using strategy i, maximizes its profit by choosing a transaction volumefor each customer segment and technology, τijk, subject to its full price being fixed.Profit is denoted πi and is given in Equation (2).
( )i j ijk k ijk jk ijk k k kj J k K k K j J j J k K k K
p c d n F G2 .∈ ∈ ∈ ∈ ∈ ∈ ∈
π = τ − τ − τ − +
∑ ∑ ∑ ∑ ∑ ∑ ∑ (2)
Here the profit associated with strategy i for a bank is computed by finding the entirerevenue, and reducing it by the sum of all variable costs and fixed costs. It followsthat, given a market full price Pj, the price a bank using strategy type i can charge fora transaction is given in Equation (1). Substituting Equation (1) into Equation (2)yields the profit function for a bank using strategy type i, given in Equation (3),
( )( )
j ijki j ijk ijk ijk k ijk
kj J k K j J k K j J k K j J k K
jk ijk k k kj J k K k K
P n P h cn
d n F G2
, ,
.
∈ ∈ ∈ ∈ ∈ ∈ ∈ ∈
∈ ∈ ∈
β τπ τ = τ − − τ − τ
− τ − +
∑ ∑ ∑ ∑ ∑ ∑ ∑ ∑
∑ ∑ ∑
ur rr
(3)
Here the profit is the sum of the product of full price and production for all segmentsusing all channels less the sum of total customers disutility of travel plus inconve-nience costs related to non-preferred channels plus total variable and fixed costs.
A bank’s profit optimization problem as a function of the τ variables is given inEquation (4),
( ) ( )
( )
ii i i
j ijkj ijk jk ijk
kj J k K j J k K j J k K
k ijk jk ijk k kj J k K j J k K k K
ijk
P P
P hn
c d G n F
j J k K
* *
2
max ,
,
such that 0, , .
τ
∈ ∈ ∈ ∈ ∈ ∈
∈ ∈ ∈ ∈ ∈
π = π τ
β τ= τ − − τ −
τ − τ − +
τ ≥ ∀ ∈ ∈
∑ ∑ ∑ ∑ ∑ ∑
∑ ∑ ∑ ∑ ∑
rv v r
(4)
The objective function in the bank’s optimization problem is concave. For conve-nience, call function Ci,
08 byers.p65 08/01/2001, 10:49 PM138
RETAIL BANK SERVICES STRATEGY 139
( )
j ijki jk ijk k ijk
kj J k K j J k K j J k K
jk ijk k kj J k K k K
C + h cn
d G n F2 ,
∈ ∈ ∈ ∈ ∈ ∈
∈ ∈ ∈
β τ= τ + τ
+ τ + +
∑ ∑ ∑ ∑ ∑ ∑
∑ ∑ ∑ (5)
strategy i’ s “full cost.” The full cost of strategy i is the sum of the total cost of a firmusing strategy i and this firm’s customers’ total “hedonic costs” (preference relatedcosts). Equation (4) says that strategy i’s profit is its total full revenue (which is thefull price times volume for all production), minus its full cost.
Given market full prices, Pr
, each bank using strategy i seeks to provide the quan-tity and mix of transactions to maximize its profits. The supply function for a bankusing strategy i is the vector,
JxKis P R( ) ,+∈
vr
which maximizes strategy i’s profit. (The supply function is a vector that potentiallyallows a distribution channel to serve multiple customer segments.) Specifically, for abank using strategy i we can write this mathematically as
( ) ( )( )i
i i
j J
s P Pi0
argmax , .τ ≥ ∈
= π τ
r
v vrr(6)
Denote the aggregate supply function for mix of strategy types mr
, mr
• 0, as
JS P m R| |( , ) +∈r r
by
( ) ( )j i ijki I k K
S P m m s P j J,
, for all .∈ ∈
= ∈
∑
v v vr(7)
This vector is the total supply by all firms to each segment. Now that the consumersand the banks have been defined, it remains to discuss how those two interact in themarket setting. In the next section, we discuss their interaction by examining thenotion of competition and equilibrium in the markets.
Competition in the Retail Banking Market
WE ANALYZE COMPETITION BETWEEN RETAIL BANKS as a perfectly competitive mar-ket. This assumption may be justified as follows. There are many consumers in themarket and an individual household has no power to affect market prices offered bybanks. Similarly, we assume that the market will support many competing banks, and
08 byers.p65 08/01/2001, 10:49 PM139

140 BYERS AND LEDERER
that none of which views itself as having the power to affect market prices. This isclearly an approximation, but one that fits the empirical facts of the banking indus-try—it is highly competitive. Also, we assume that there are fixed costs to enteringthe market, thus banks must consider whether entry into a new market will be profit-able. This set of assumptions follows the classical analysis of “perfect competition,”except that customers are concerned with “full prices,” not just the real price paid.The fact that customers are concerned about full prices does not affect the analysis ofa competitive equilibrium as is shown in De Vany and Saving [6].
Given a vector of strategy types in the market, mr
, a competitive entry equilibriumis defined as a vector of full prices and a vector of transaction-volume decisions, suchthat each bank maximizes its profit earning at least zero profits, aggregate supplyequals demand, and profitable entry into the market is not possible.
Definition . A competitive entry equilibrium is defined to be a vector of full pricesP*v
, a vector of transaction volume decisions by strategy type, i i*
1( ) ∈τr
, and a vectorof strategy types, m*
r, such that i is P* ( *)τ =
vr for all strategies i∈I and
( ) ( ) ( )i ijk i ii I k K j J
S P m m d P ,
, and 0∗
∈ ∈ ∈
= τ = π τ =
∑
r rv v rr
for all strategies i ∈ I.Under the assumptions presented, a unique competitive entry equilibrium exists.
Proof of the existence and uniqueness is found in Byers and Lederer [4]. A majorresult of equilibrium analysis is that in equilibrium, the market’s full prices must beequal to the active strategy’s marginal full costs (that is, the derivative of Equation (5)with respect to output). This is shown in De Vany and Saving [6], and is an analog ofthe traditional perfect competition model where prices equal marginal costs. Whythis is so is clear by a simple argument. If the full price for some segment is above(below) marginal full cost, then profitable entry (exit) by some banks is possible. Wecannot be in a competitive entry equilibrium without this condition.
By a similar argument, an active strategy’s marginal full cost must be least amongall firms to serve all segments that it actually serves. We also conclude that all activefirms earn zero profits in equilibrium, else profitable entry is possible. These areimportant efficiency properties that we will exploit when computing and characteriz-ing equilibrium outcomes.
Using the competitive entry equilibrium, the next section will address the behaviorof specific bank strategies, patterned after strategies employed by banks in the U.S.market, in equilibrium by conducting sensitivity analysis.
Analysis of the Equilibrium
THIS SECTION PRESENTS AN ANALYSIS of the market equilibrium for realistic values ofparameters and a sensitivity analysis of several parameters. The sensitivity analysiswill examine the effect on equilibrium of changing customer demands, variable costs,
08 byers.p65 08/01/2001, 10:49 PM140

RETAIL BANK SERVICES STRATEGY 141
and fixed costs of PC banking systems. The analysis suggests that the relative size ofcustomer segments, as opposed to cost structure or total demand, induces the mostsignificant strategy shifts of competing banks.
Our method of analysis is to first characterize the output of firms earning zeroprofits in equilibrium, and then find the mix of these firms that will equate supply anddemand when full prices are set to marginal full cost. Note the following condition ona firm’s production decisions in equilibrium: each firm earns zero profits. Supposestrategy type i uses technology k(j) to serve market segment j. Thus the equilibriumproduction decisions must obey the following:
( ) ( )( )
( ) ( ) ( ) ( )
( ) ( ) ( ) ( ) ( )( )
j ijk ji i j ijk j ijk j ijk j k j ijk j
kj J j J k K j J j J
jk j k j k j k jijk jj J j J
P n P h cn
d n F G2
, ,
0,
∈ ∈ ∈ ∈ ∈
∈ ∈
β τπ τ = τ − − τ − τ
− τ − + =
∑ ∑ ∑ ∑ ∑
∑ ∑
r r
(8)
where
( ) ( )i j i j
P C,1, (1) ,2, (2),τ τ= ∇ τv v
rr v
and
( )i j i j,1, (1) ,2, (2),τ τv v
is the vector of production that i supplies to the two segments. Equation (8) simplifiesto:
( )k k jk ijkk K j J k K
n F G d 2 0.∈ ∈ ∈
+ − τ =∑ ∑ ∑ (9)
Production satisfying Equation (9) can be mapped into marginal full costs for e andb, by
( ) ( )i ij i
ijkk K
dCMC j J.
dfor
∈
ττ = ∈
τ∑
vv
(10)
To complete the analysis we must specify a demand function for the segments as afunction of full prices. For simplicity we choose a linear separable demand function:
( ) { }j j j j jD P A B P j e bfor , .= − ∈ (11)
Parameters Aj and Bj are the intercept and slope of segment j’s demand function. Table2 reports parameters used for an example we will study.
The entries in Table 2 are estimates taken from industry publications. Retail banksare generally unwilling to provide detailed cost information, so we created the previ-ous data using industry averages from publications such as American Banker. The
08 byers.p65 08/01/2001, 10:49 PM141

142 BY
ER
S A
ND
LED
ER
ER
Table 2. Parameter Values Used in Sensitivity Analysis
Point Estimate Point EstimateParameter (Base Value) Parameter (Base Value)
Variable Costs: linear termscB: Branch $0.75 per transaction cPC: PC $0.3 per transactioncATM: ATM $0.50 per transaction cOATM: ATM for virtual Bank $0.8 per transaction
Variable Costs: quadratic termsddB: b customer at Branch $6 × 10⁻⁷ dbATM: b customer at ATM $9 × 10⁻⁷
deB: e customer at Branch $8 × 10⁻⁷ deATM: e customer at ATM $7 × 10⁻⁷
dePC: e customer at PC $6 × 10⁻⁷
Customer travel costsβb: B customer sensitivity $1.5 per mile βe: E customer sensitivity $2.25 per mile to traveling to a branch/ATM to traveling to a branch/ATM
Customer DisutilityhbB: b customer at Branch 0 hbATM: b customer at ATM $3.20heB: e customer at Branch $1.75 heATM: e customer at ATM $0.60hePC: e customer at PC 0
Yearly Fixed Costs of Strategies (amortized over 10 years)FB: Branch Placement (with ATMs) $50,000 per branch GB: Branch Network (with ATMs) $2,110,000FATM: stand along ATM placement $10,000 per kiosk GATM: stand along ATM Network $1,800,000GPC: PC banking system $1,550,000 GPCB: Branch Network with $2,160,000
PC banking
Assumptions on nk
Number of branches (k=B) 10 Total number of OATMs in 100 market (k=OATM)
Demand ParametersAb 25,000,000 Bb 1Ae 3,000,000 Be 3
08 byers.p6508/01/2001, 10:49 P
M142

RETAIL BANK SERVICES STRATEGY 143
quadratic coefficients were chosen empirically to generate solutions that approxi-mate observed total transaction volume and number of competing banks for an aver-age market of an approximate spatial radius of 15 miles. It is assumed that customersincur travel costs at a rate of $0.65 and $0.95 per mile for e and b customer segments,respectively. Figure 1 reports the marginal full costs corresponding to solutions toEquation (9) for the values of Table 2 for a selection of relevant strategies. The strat-egies are denoted in the form ((e,k)(b,k)), with k belonging to set K ∪ φ. When thenull technology is selected, we omit the segment.
In equilibrium, only a firm on the frontier of lowest marginal full costs will survive.In Figure 1, the efficient frontier is given by the heavy line that indicates the strategytype and the marginal full costs of output to both segments. Each point on this frontiercorresponds to a zero profit firm producing output at a mix given by the correspond-ing solution to Equation (9). This trade-off considers the variable and fixed cost ofeach strategy, as well as the diseconomies of scale of operations.
Figure 1 provides much insight as to the strategies that arise in equilibrium. Strat-egy ((e,PC)(b,ATM)) is dominated by strategy ((e,PC)(b,OATM)), that is, an elec-tronic distribution strategy where b’s are served by ATMs (and e’s are served by PCbanking) is dominated by one where b’s are served by others’ ATMs (and e’s areserved by PC banking). We can call this type of strategy a “virtual bank,” since it hasb customers but no branches of its own. This observation suggests that ATMs alonewill not be a viable strategy to serve either segment. It is important to note that thetraditional branch strategy ((e,B)(b,B)) is dominated by a split strategy where e’s are
Figure 1. Marginal full costs for the different strategies. The heavy line is the efficientfrontier. Point P and P′ are points on this frontier. P is an interior point and P′, P″ areextreme points of the boundary of the efficient frontier.
08 byers.p65 08/01/2001, 10:49 PM143

144 BYERS AND LEDERER
served by PC banking and b’s are served by a branch system, ((e,PC)(b,B)). Strategy((e,PC)(b,OATM)) is itself dominated by ((e,PC)(b,B)). Thus, the only strategy thatserves both markets that can arise in equilibrium is ((e,PC)(b,B)). Also observe thatthe highest marginal full cost for serving b’s is constrained by the marginal full costof the strategy ((b,B)). This marginal full cost is b mc . The highest marginal full costfor serving e’s is constrained by strategy ((e,PC)), and this marginal full cost is emc .Point P in the figure corresponds to production by a firm using the strategy((e,PC)(b,B)). Point P′ is at the intersection of two strategies: ((e,PC)(b,B)) and((e,PC)). The mixes of transactions produced for the two strategies are different:((e,PC)(b,B)) serves both, while at ((e,PC)) serves only e’s. For any equilibrium,there are at most two different strategies observable in the market: either ((b,B)) and((e,PC)(b,B)), or ((e,PC)) and ((e,PC)(b,B)). Thus, this model shows that there won’tbe a proliferation of strategies. In fact, at any time, at most two profitable strategieswill be observed.
Points P′ and P″ are defined by the parameters of the example. At P′, the marginalfull cost for producing service to e must be the same for strategies ((e,PC)) and((e,PC)(b,B)) and is emc . The production rate of any firm using strategy ((e,PC)) willsolve Equation (9), yielding
eE
o PC
ePC
G
d,τ =
thus,
ePC
oe E ePC ePC E ePC ePC PCmc c h d c h d G2 2= + + τ = + +
and the output rates for e are the same for both strategies that coincide at P′. (Forsimplicity we omit the “i” subscript on variables τ in this section and include designa-tion of the bank’s method for serving the appropriate segment instead.) Since Equa-tion (9) holds at ((e,PC)(b,B)), it follows that
B B PCB ePC ePC bB bBn F G d d2 2 ,+ = τ + τ
thus,
oo B B PCB ePC ePC B B PCB PCbB
bB bB
n F G d n F G G
d d
2,
+ − τ + −τ = =
and
( )bB
ob B bB bB B bB bB B B PCB PCmc c h d c h d n F G G2 2 .= + + τ = + + + −
We adopt the superscript “o” because these production volumes result in zero profit.
08 byers.p65 08/01/2001, 10:49 PM144
RETAIL BANK SERVICES STRATEGY 145
The important conclusion is that for strategy ((e,E)(b,B)), the ratio of production ofb to total production at P′ is just
bB
PCBbB ePC
B B e E b B e Eo
o oB B PC
B ePC
n F G G
n F G G GPC
d d
(( , ),( , )) (( , ))
Bd.
+ −τ
=+ −τ + τ
+(12)
Similarly, at point P″ for strategy ((e,E)(b,B)), the ratio of production of b to totalproduction is
bB
PCBbB ePC
B B BoB
o oBB B B
b ePCB
n F G
d
G Gn F G
d d
.
+τ
=−τ + τ + +
(13)
We have shown that at point P′ (P″), strategy ((e,PC)(b,B)) serves both segments inthe ratio of b’s to total supply of Equations (12) and (13). Thus at point P′ a range ofratios of segment b supply to total supply from zero percent to the fraction Equation(12) are feasible because there can be any arbitrary mix of strategies (e, PC) and((e,PC)(b,B)), which share the same marginal full cost. Thus, by adjusting the num-ber of banks of each of those types, any ratio from zero percent to the value of Equa-tion (12) can be produced. Using similar arguments, at point P″, any ratio from Equation(13) to 100 percent can be produced. Figure 2 describes the ratio of total productionof b to total production of all as a function of MCb. Demand generated by the marginalfull costs found on the efficient frontier of Figure 1 is computed as a function of themarginal full costs on the efficient frontier. The ratio of demand by segment b to totaldemand as a function of MCb is found in Figure 2. The competitive entry equilibriumwill use a combination of strategy types of sufficient number to provide the marketwith its demanded services at the corresponding marginal full costs. The equilibriummarket prices are the marginal full costs for e and b that equate the production mixand the demand mix.
To find the equilibrium production rates and mix of firms, we need only find thepoint on the efficient frontier, where the ratio of demands for the two segments equalsthe ratio of production. At this point, supply can be made equal to demand, firms earnzero profits, and price equals marginal full cost for both segments. This will be theunique competitive equilibrium.
Sensitivity Analysis: Changing Segment Sizes
Next, we study the effect of changing segment size on the equilibrium. The previousanalysis leads to the following insights: The mix of bank strategies used is a function
08 byers.p65 08/01/2001, 10:49 PM145

146 BYERS AND LEDERER
of the relative size of the two segments, and not its absolute size. Scaling up demandin the two segments in a way that preserves the demand ratios leaves the equilibriumchoices of strategies and the production decision for individual banks unchanged. Wewill conclude that when demand for the e segment rises relative to the b segment,some pure branch banks will be forced from the market, and some will adopt PCbanking in addition to branches.
If the size of the segment that prefers e-banking rises, this will cause a shift in thedemand ratio function downward. For example, Figure 2 shows a shift in the demandratio with a corresponding shift in equilibrium full prices from Pb
1 to Pb2. Clearly the
full market price for b-segment falls, with the full market price for the e-segmentrising to emc from some lower value. The actual market prices for b rises, and for efalls. This is direct from Equation (1). The optimum mix of bank strategies shifts aswell. For the downward shift in the demand of b ratio to total demand shown in
Figure 2. Finding the competitive entry equilibrium by tracing the marginal cost of servingbranch-preferring customers from the efficient frontier. The increasing curve is the ratio oftotal production of branch transactions to total production, and the decreasing curve is theratio of total demand for branch transactions to total demand as a function of the marginalfull cost of serving the branch-preferring segment. Note that two examples of the demandratio are indicated. The competitive entry equilibrium corresponds to the point of intersec-tion of the respective demand curve with the supply ratio curve. Also, the figure illustratesthe change in equilibrium when the variable cost of PC banking transactions falls. The solidlines represent the initial demand ratio and the dashed demand ratio curve corresponds tolower variable cost of PC banking. Note that as the equilibrium marginal full cost for branchtransactions shifts, then the market full price falls, from Pb
1 to Pb2, but the equilibrium ratio
of demand from the branch-preferring segment (and production for this segment) to totaldemand (and total production) does not change very much.
08 byers.p65 08/01/2001, 10:49 PM146
RETAIL BANK SERVICES STRATEGY 147
Figure 2, there is entry of banks using the strategy (e,PC). The market now supportsthese banks, as well as some using strategy ((e,PC)(b,B)). We note that as the relativesize of the e market rises, there will be some banks serving just the e segment, andsome banks providing service to both segments using strategy ((e,PC)(b,B)). Thus,two types of banks have PC banking: ones with branches and ones without branchesthat serve just the e segment. Note that as long as there are some b customers, themodel shows that a bank using the two-channel strategy will exist in equilibrium.
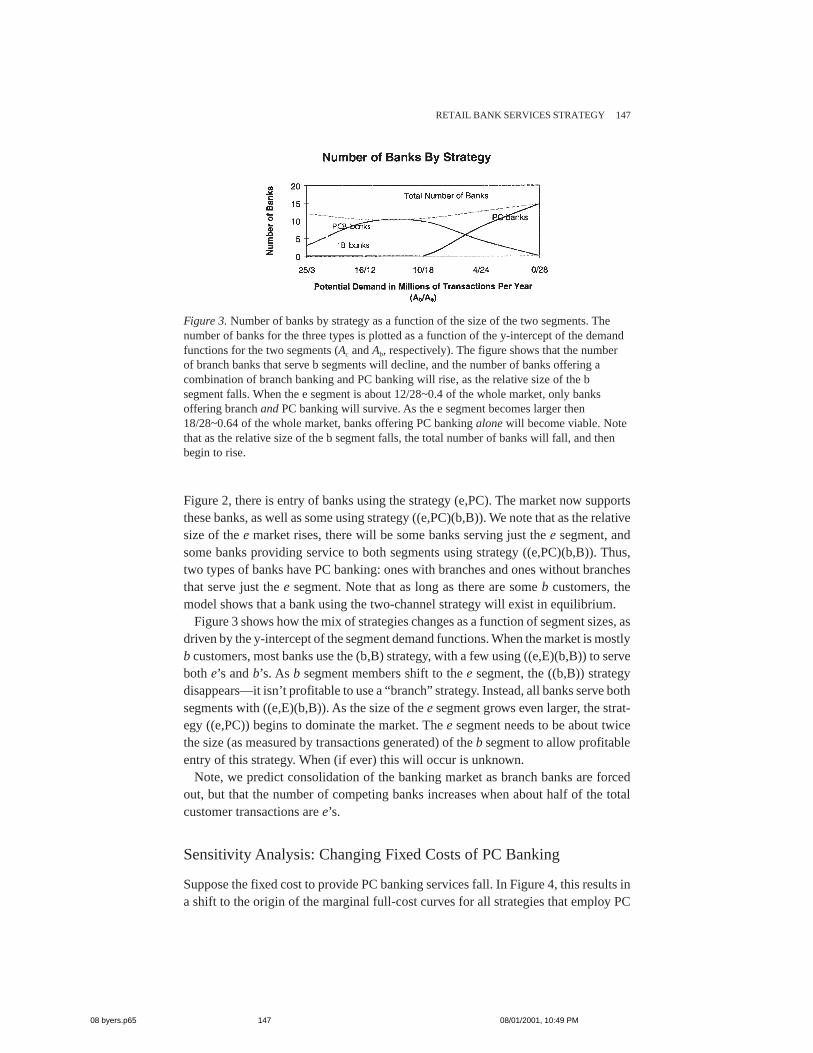
Figure 3 shows how the mix of strategies changes as a function of segment sizes, asdriven by the y-intercept of the segment demand functions. When the market is mostlyb customers, most banks use the (b,B) strategy, with a few using ((e,E)(b,B)) to serveboth e’s and b’s. As b segment members shift to the e segment, the ((b,B)) strategydisappears—it isn’t profitable to use a “branch” strategy. Instead, all banks serve bothsegments with ((e,E)(b,B)). As the size of the e segment grows even larger, the strat-egy ((e,PC)) begins to dominate the market. The e segment needs to be about twicethe size (as measured by transactions generated) of the b segment to allow profitableentry of this strategy. When (if ever) this will occur is unknown.
Note, we predict consolidation of the banking market as branch banks are forcedout, but that the number of competing banks increases when about half of the totalcustomer transactions are e’s.
Sensitivity Analysis: Changing Fixed Costs of PC Banking
Suppose the fixed cost to provide PC banking services fall. In Figure 4, this results ina shift to the origin of the marginal full-cost curves for all strategies that employ PC
Figure 3. Number of banks by strategy as a function of the size of the two segments. Thenumber of banks for the three types is plotted as a function of the y-intercept of the demandfunctions for the two segments (Ac and Ab, respectively). The figure shows that the numberof branch banks that serve b segments will decline, and the number of banks offering acombination of branch banking and PC banking will rise, as the relative size of the bsegment falls. When the e segment is about 12/28~0.4 of the whole market, only banksoffering branch and PC banking will survive. As the e segment becomes larger then18/28~0.64 of the whole market, banks offering PC banking alone will become viable. Notethat as the relative size of the b segment falls, the total number of banks will fall, and thenbegin to rise.
08 byers.p65 08/01/2001, 10:49 PM147

148 BYERS AND LEDERER
banking. For example, Figure 4 shows the effect of reducing PC banking fixed costby $1 million. We show that such a change results in some branch banks adopting PCbanking in addition to branches.
The strategies that arise in equilibrium change—now only strategies ((e,PC)) and((e,E)(b,B)) arise. Even when the relative size of the e segment is small comparedwith the b segment, “branch” banks cannot compete with banks offering branchesand PC banking. When the e segment is relatively large, a PC bank serving e’s cancompete with a ((e,E)(b,B)) bank. For strategy ((e,E)(b,B)), and any value of mcb, theratio of b transactions to total transactions can be shown to be:
( )bB
bB ePC
b B bBobB
o ob B bBb B bB
B B PCBbB ePC bBE
mc c h
d
mc c hmc c hn F G
d d d
2
2.
1
2 4
− −τ
=τ + τ − −− −
+ + −
If the fixed cost of PC banking declines, then for any value of mcb, the full price ofe transactions falls, and the ratio of b transactions to total transactions declines. Thiscauses the equilibrium value of mcb to increase, thus the real price for transactions of
Figure 4. Marginal full cost curves for the strategies when the fixed cost of PC bankingsystems is low. The efficient frontier is marked by the heavy line from P′ to P″. Note that apure branch banking strategy is now not optimal in equilibrium, as ((b,B)) is not on thefrontier. Again, strategies ((e,B)(b,B)), ((e,PC)(b,ATM)), ((e,PC)(b,OATM)) are dominatedby others and, likewise, do not arise in equilibrium.
08 byers.p65 08/01/2001, 10:49 PM148
RETAIL BANK SERVICES STRATEGY 149
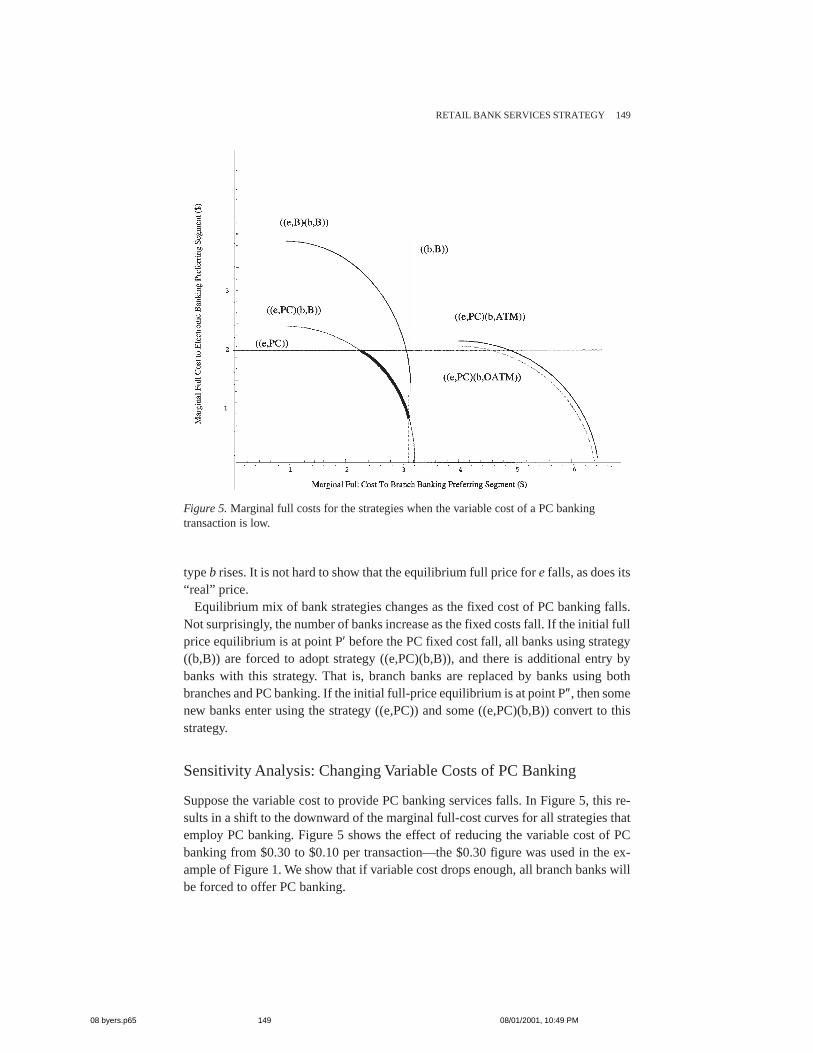
type b rises. It is not hard to show that the equilibrium full price for e falls, as does its“real” price.
Equilibrium mix of bank strategies changes as the fixed cost of PC banking falls.Not surprisingly, the number of banks increase as the fixed costs fall. If the initial fullprice equilibrium is at point P′ before the PC fixed cost fall, all banks using strategy((b,B)) are forced to adopt strategy ((e,PC)(b,B)), and there is additional entry bybanks with this strategy. That is, branch banks are replaced by banks using bothbranches and PC banking. If the initial full-price equilibrium is at point P″, then somenew banks enter using the strategy ((e,PC)) and some ((e,PC)(b,B)) convert to thisstrategy.
Sensitivity Analysis: Changing Variable Costs of PC Banking
Suppose the variable cost to provide PC banking services falls. In Figure 5, this re-sults in a shift to the downward of the marginal full-cost curves for all strategies thatemploy PC banking. Figure 5 shows the effect of reducing the variable cost of PCbanking from $0.30 to $0.10 per transaction—the $0.30 figure was used in the ex-ample of Figure 1. We show that if variable cost drops enough, all branch banks willbe forced to offer PC banking.
Figure 5. Marginal full costs for the strategies when the variable cost of a PC bankingtransaction is low.
08 byers.p65 08/01/2001, 10:49 PM149
150 BYERS AND LEDERER
The equilibrium will change because the ratio of b demand to total demand curvewill shift to the left. Figure 2 shows how the equilibrium shifts. Although the marketprice for b transactions falls (as does the price for e transactions), the actual equilib-rium demand/production mix does not change much, and, for this example, the strat-egies chosen do not change at all. Clearly, the strategies can change when variablecost of PC banking falls. If the initial equilibrium was point P″ with some firms adoptingboth strategies found here, ((b,B)) and ((e,PC)(eB)), a slight reduction of variablecost will force some banks using only branch banking to exit the market. A largerchange causes all branch banks to abandon their strategy.
This section has shown how to analyze the effect of parameter changes on the equi-librium. We demonstrated that a very important driver of technology choice and trans-actions mix is the relative size of the e and b segments. When the fixed cost of PCbanking systems falls (such as by outsourcing this system), or when the variable costof PC banking falls, “pure” branch banks will be forced out of the market. Thesebranch banks will either adopt a PC banking strategy or exit the market. We showed,however, that the change in relative size of the e and b segments is a much moreimportant driver of transactions mix than changes in technology cost. Unless the rela-tive market size of the e segment rises to be the dominant segment, virtual banks willfail.
Conclusion
RETAIL BANKING DISTRIBUTION STRATEGY is an important issue in the banking indus-try, and this paper shows the effect of key banking parameters on the equilibriumchoice of that strategy. The model is very useful in that it admits a rich mix of real-world features such as heterogeneous consumers and banks. Sensitivity analysis showshow several parameters affect the equilibrium outcome and illustrates that the relativesize of the customer segments drives the choice of distribution strategy. For example,we show that unless the segment, which prefers electronic transactions becomes muchlarger than it is today, pure virtual Internet banks will not succeed.
These results suggest that changing consumer behavior and attitudes, instead ofbanks’ cost structure, affects significant changes in distribution strategy. If the seg-ment of consumers that prefer PC banking remains small relative to the segment thatprefers branches, then there will still be a market for specialized branch banks, andbanks offering both branches and PC banking services can prohibit successful entryby virtual banks (banks that do not have their own branches). However, if the segmentthat prefers electronic distribution over branches grows at the expense of the branchpreferring segment, as some have predicted, the model shows that branch banks andsome banks offering both branches and PC banking services will exit the market infavor of virtual banks. Virtual banks will be profitable only when the electronic-pre-ferring segment is approximately twice the size of the branch-preferring segment.
The current analysis is illuminating, but leaves room for further work. Endogenouschoice of the number of branches has been ignored here, but has been considered in
08 byers.p65 08/01/2001, 10:49 PM150

RETAIL BANK SERVICES STRATEGY 151
Byers and Lederer [4]. One promising addition to the model would be to create classesof transactions. For example, it is currently not possible to withdraw cash from a PCbanking system, and, despite technological advances, it may never be a viable possi-bility. It would make sense then to create a class of transactions that must be con-ducted through an ATM or branch. This change may increase the persistence ofstrategies that include branches and may provide additional importance to the ATM/PC strategy. A finer segmentation of the consumers in the market may also provideadditional insights into the equilibrium. Finally, other work has established the exist-ence of network effects on consumer acceptance of retail banking technology [14],incorporating those effects into an equilibrium model may provide additional insight.
Acknowledgment: The authors acknowledge the helpful comments of Associate Editor RobertKauffman and the anonymous referees.
NOTE
1. In analysis of the problem where branch and ATM numbers are chosen endogenouslyand competitively, similar results are obtained. The interested reader is directed to Byers andLederer [4] for an analysis of this problem.
REFERENCES
1. Aractingi, E. The next great downsizing initiative. Journal of Retail Banking, 16, 2,(Summer 1994), 19–22.
2. Balasubramanian, S. Mail versus mall: A strategic analysis of competition between di-rect marketers and conventional retailers. Marketing Science, 17, 3 (1998), 181–196.
3. Bauer, J.L. Distribution 2000: Developing and Implementing Strategies for Retail Fi-nancial Institutions. London: Lafferty Publications, 1995.
4. Byers, R., and Lederer, P.J. Competition between banks. Working paper, William E.Simon Graduate School, University of Rochester, Rochester, New York, May, 2000.
5. Chelst, K.; Schultz, J.; and Sanghvi, N. Issues and decision aids for designing branchnetworks. Journal of Retail Banking, 10, 2 (Summer 1988), 5–17.
6. De Vany, A., and Saving, T. The economics of quality. The Journal of Political Economy,91, 6 (December 1983), 979–1000.
7. Electronic dealings will slash bank jobs, branches, study finds. Wall Street Journal,August 14, 1995.
8. Eliopoulis, G., and Kouzelis, A. Branch planning through decentralized marketing andregional analysis studies. European Journal of Operational Research, 30, 1 (June 1987), 48–54.
9. Hawk, K. The new branch. Bank Marketing, 22, 5 (May 1990), 26–30.10. Hopmans, A. A spatial interaction model for branch bank accounts. European Journal of
Operational Research, 27, 2 (November 1986), 242–250.11. Lederer, P., and Li, L. Pricing, production, scheduling, and delivery-time competition.
Operations Research, 45, 3 (May–June 1997), 407–420.12. Mead, W. Banks: The right mix of branches, alternative delivery is nearer. American
Banker, March 12, 1997, p. 1.13. Mendelson, H., and Whang, S. Optimal incentive-compatible priority pricing for the
m/m/1 queue. Operations Research, 38, 5 (1990), 870–883.
08 byers.p65 08/01/2001, 10:49 PM151
152 BYERS AND LEDERER
14. Prasad, B., and Harker, P. Pricing online banking services amid network externalities.Proceedings of the 33rd Annual Hawaii International Conference on System Sciences. LosAlamitos, CA: IEEE, 2000, pp. 86–103.
15. Salomon Brothers Inc. report. On-demand banking: Power to the people. New York,September 1995.
16. Stahl, D. Re-engineering the branch network. Savings and Community Banker, 4, 1 (Janu-ary 1995), 26–32.
17. Tandy, G., and Stovel, R. Are your branches out on a limb? Bank Marketing, 21, 11(November 1989), 26–29.
08 byers.p65 08/01/2001, 10:49 PM152