Results Presentation Q2 2016 Results - ISOLUX · PDF fileare not entirely comparable to those...
21
Results Presentation Q2 2016 Results September 29, 2016
Transcript of Results Presentation Q2 2016 Results - ISOLUX · PDF fileare not entirely comparable to those...

Results Presentation
Q2 2016 Results September 29, 2016

196 48 48
129 0 0
225 131 131
235 138 27
246 203
0
89 89 89
178 178 178
234 234 234
September 29, 2016 | 2
Disclaimer
This presentation has been prepared by Grupo Isolux Corsán, S.A.; therefore no part of it may be published, disclosed or distributed in any form or by any means, nor used by any other person or entity, without the prior written consent of Grupo Isolux Corsán, S.A. For the purposes of this presentation and as the context requires, presentation means this document, its content or any part of it, any oral presentation, and any question and answer session during or in connection with this presentation. This presentation contains statements related to our future business and financial performance and future events or developments involving us that may constitute forward-looking statements. These statements may be identified by words such as “expects,” “looks forward to,” “anticipates,” “intends,” “plans,” “believes,” “seeks,” “estimates,” “will,” “project” or words of similar meaning. We may also make forward-looking statements in other reports, in presentations, in material delivered to shareholders and in press releases. In addition, our representatives may from time to time make oral forward-looking statements. Such forward-looking statements and information are based on the current expectations and assumptions, and are, therefore, subject to certain known or unknown risks and uncertainties. A variety of factors, which are beyond our control or may be difficult to predict, affect our operations, performance, business strategy and results and could cause our actual results, performance or achievements to be materially different from any future results, performance or achievements that may be expressed or implied by such forward-looking statements or anticipated on the basis of historical trends. No representation or warranty is made than any forward-looking statement will come to pass. Should one or more risks or uncertainties materialize, or should underlying assumptions prove incorrect, our actual results, performance or achievements may vary materially from those described in the relevant forward-looking statement as being expected, anticipated, intended, planned, believed, sought, estimated or projected. We neither intend, nor assume any obligation, to publicly update or revise these forward-looking statements in light of developments which differ from those anticipated. The information contained in this presentation has not been verified or revised by the auditors of Grupo Isolux Corsán, S.A. and does not purport to be comprehensive. Certain data included in this presentation has been subject to rounding adjustments. Accordingly, in certain instances, the sum of the numbers in a column or a row in tables may not conform exactly to the total figure given for that column or row. This presentation does not constitute an offer to sale or a solicitation offer to buy or subscribe for any securities in any jurisdiction, including in the United States, form the basis for any investment decision and no specific recommendations are intended. Specifically, this presentation does not constitute a “prospectus” within the meaning of the U.S. Securities Act of 1933. This presentation is not, and shall not be deemed, an offer with respect to any securities, a solicitation to tender or exchange of any of the existing notes or existing shareholders equity or a solicitation of votes with respect to a plan filed under Chapter 11 of the U.S. Bankruptcy Code or any other type of reorganization. Any such offer or solicitation will comply with all applicable securities laws and/or, as applicable, provisions of the U.S. Bankruptcy Code and any other applicable law subject to U.S. Federal Rules of Evidence Rule 408 and its equivalents.

196 48 48
129 0 0
225 131 131
235 138 27
246 203
0
89 89 89
178 178 178
234 234 234
September 29, 2016 | 3
Results Presentation Q2 2016 | Table of Contents
Table of Contents 1. Main highlights
2. Q2 2016 Business and Financial Highlights
i. EPC
ii. Concessions
3. Appendix

196 48 48
129 0 0
225 131 131
235 138 27
246 203
0
89 89 89
178 178 178
234 234 234
September 29, 2016 | 4
1. Main Highlights

196 48 48
129 0 0
225 131 131
235 138 27
246 203
0
89 89 89
178 178 178
234 234 234
September 29, 2016 | 5
Results Presentation Q2 2016 | Main highlights
Spanish Group
Restructuring
Process
Corporate
Asset sales
Several processes in progress : T Solar, Transmission lines, Loma Blanca, Infinita and Tecna.
The Group is currently analyzing options for other non-core assets that could potentially be sold, in order to focus on EPC business
During the second half of July the financial creditors of the key Spanish entities of the Group voted the terms of the Restructuring Agreement
Financial creditors holding approx. 92%+ of the debt of each entity subject to the Restructuring Agreement supported. Thanks to this overwhelming support, the Group filed a petition in the Court of Madrid to request the “homologación judicial” on July 28, 2016.
At the beginning of September a judge was assigned to the file.
The judge has acknowledged the submission of the homologación petition and granted relief by suspending any foreclosures against the companies affected by the homologation
We are confident on the restructuring process success and homologation process is expected to be finalized ahead of the agreed deadline of 31 December 2016
In early September the Group announced a significant layoff program that will be carried out through a collective negotiation process with the employees’ representatives. Spanish labor law establishes a 1-month negotiation period, that starts on September 29th. The expected headcount reduction is over 500 people, nearly 30% of the staff in Spain.
Negotiations with our suppliers to agree modified payment terms are ongoing. We are already reaching agreements with a relevant number of them, that entail either a 3-year payment plan or an upfront payment with a haircut in the outstanding amounts.
196 48 48
129 0 0
225 131 131
235 138 27
246 203
0
89 89 89
178 178 178
234 234 234
September 29, 2016 | 6
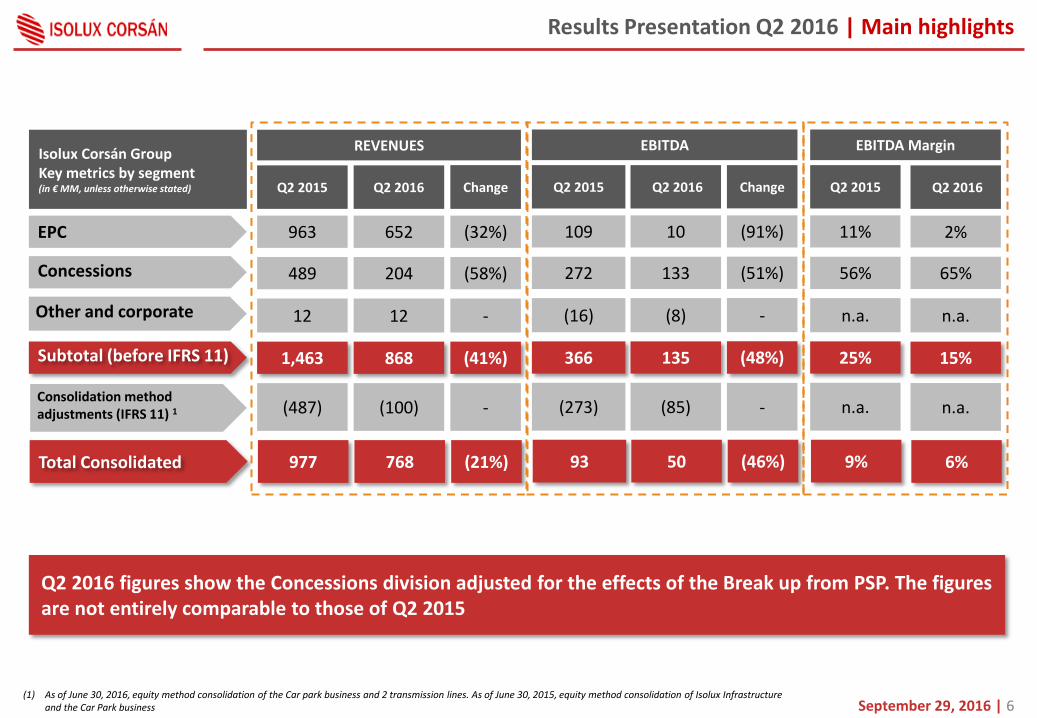
Isolux Corsán Group Key metrics by segment (in € MM, unless otherwise stated) Q2 2015 Q2 2016 Change
EPC 963 652 (32%)
Subtotal (before IFRS 11) 1,463 868 (41%)
Concessions 489 204 (58%)
Other and corporate 12 12 -
Consolidation method adjustments (IFRS 11) 1 (487) (100) -
REVENUES
Total Consolidated 977 768 (21%)
Q2 2015 Q2 2016 Change
109 10 (91%)
366 135 (48%)
272 133 (51%)
(16) (8) -
(273) (85) -
EBITDA
93 50 (46%)
Q2 2015
11%
25%
56%
n.a.
n.a.
EBITDA Margin
9%
Q2 2016
2%
15%
65%
n.a.
n.a.
6%
(1) As of June 30, 2016, equity method consolidation of the Car park business and 2 transmission lines. As of June 30, 2015, equity method consolidation of Isolux Infrastructure and the Car Park business
Q2 2016 figures show the Concessions division adjusted for the effects of the Break up from PSP. The figures are not entirely comparable to those of Q2 2015
Results Presentation Q2 2016 | Main highlights

196 48 48
129 0 0
225 131 131
235 138 27
246 203
0
89 89 89
178 178 178
234 234 234
September 29, 2016 | 7
170 (385)
379
(2)
172
6
Cash and cashequivalents Sep 2014
Cash and cashequivalents Dec 2015
Operating Cash Flow Q22016
Cash Flow from Investingactivities Q2 2016
Cash Flow from FinancingActivities Q2 2016
FX Cash and cashequivalents Jun 2016
Consolidated Cash Flow Bridge December 2015 to June 2016 (in € MM)
Cash Flow Bridge
STFI €13M
STFI €12M
Results Presentation Q2 2016 | Main highlights

196 48 48
129 0 0
225 131 131
235 138 27
246 203
0
89 89 89
178 178 178
234 234 234
September 29, 2016 | 8
2. Q2 2016 Business Highlights
i. EPC
196 48 48
129 0 0
225 131 131
235 138 27
246 203
0
89 89 89
178 178 178
234 234 234
September 29, 2016 | 9
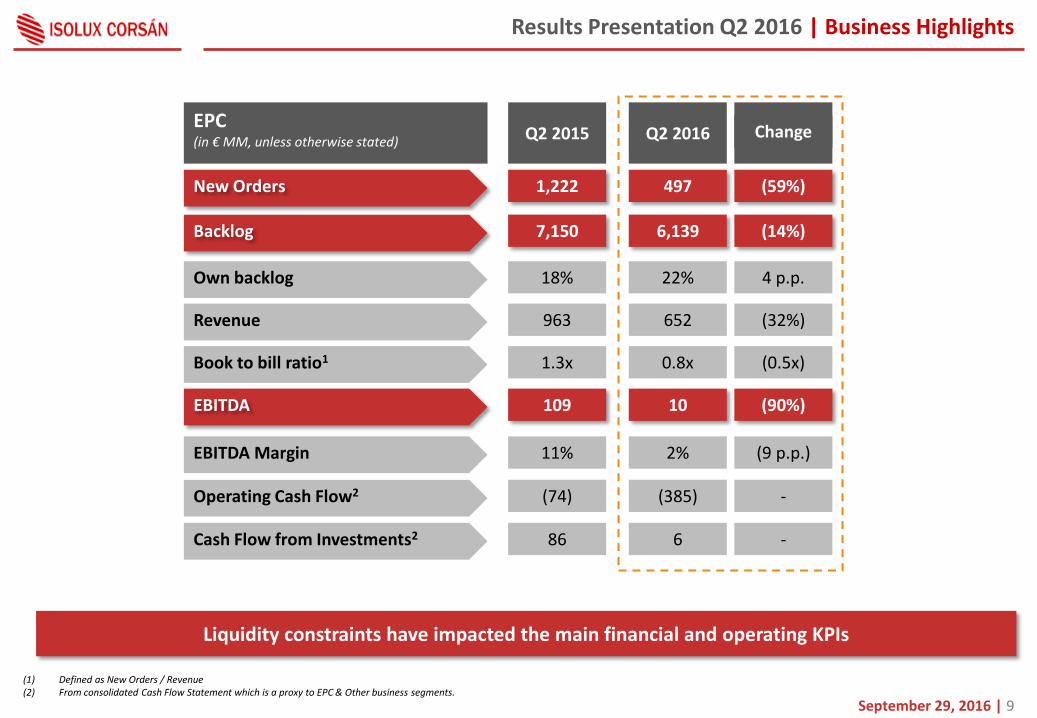
(1) Defined as New Orders / Revenue (2) From consolidated Cash Flow Statement which is a proxy to EPC & Other business segments.
EPC (in € MM, unless otherwise stated) Q2 2015 Q2 2016 Change
New Orders
Backlog
Own backlog
1,222 497 (59%)
7,150 6,139 (14%)
18% 22% 4 p.p.
Revenue 963 652 (32%)
Book to bill ratio1 1.3x 0.8x (0.5x)
EBITDA 109 10 (90%)
EBITDA Margin 11% 2% (9 p.p.)
Operating Cash Flow2 (74) (385) -
Cash Flow from Investments2 86 6 -
Liquidity constraints have impacted the main financial and operating KPIs
Results Presentation Q2 2016 | Business Highlights

196 48 48
129 0 0
225 131 131
235 138 27
246 203
0
89 89 89
178 178 178
234 234 234
September 29, 2016 | 10
12.550
18.165
7.946
6m 2014 6m 2015 6m 2016
EPC - Key Financial Highlights
Offers presented and under analysis Comments
Offers presented by Isolux (€m) Projects under analysis (€m)
22.940
20.029
18.249
FY2014 FY2015 6m2016
Lower contracting figures are driven by the numbers of offers in which Isolux has participated. In the first 6months of 2016 the amount of offers presented is down by 56% compared to the same period last year.
There are €1bn of offers that the Group has analyzed and worked on, but that could not be tendered for due to lack of bonding lines.
The amount of total projects under analysis has not declined in the same proportion. This means that infrastructure projects are out there, but that the liquidity situation prior to the injection of new funds at the end the of July, constrained the Group’s capacity to tender for these projects. The Group expects to become able to present offers to these projects as a result of the implementation of the refinancing.
Results Presentation Q2 2016 | Business Highlights
196 48 48
129 0 0
225 131 131
235 138 27
246 203
0
89 89 89
178 178 178
234 234 234
September 29, 2016 | 11
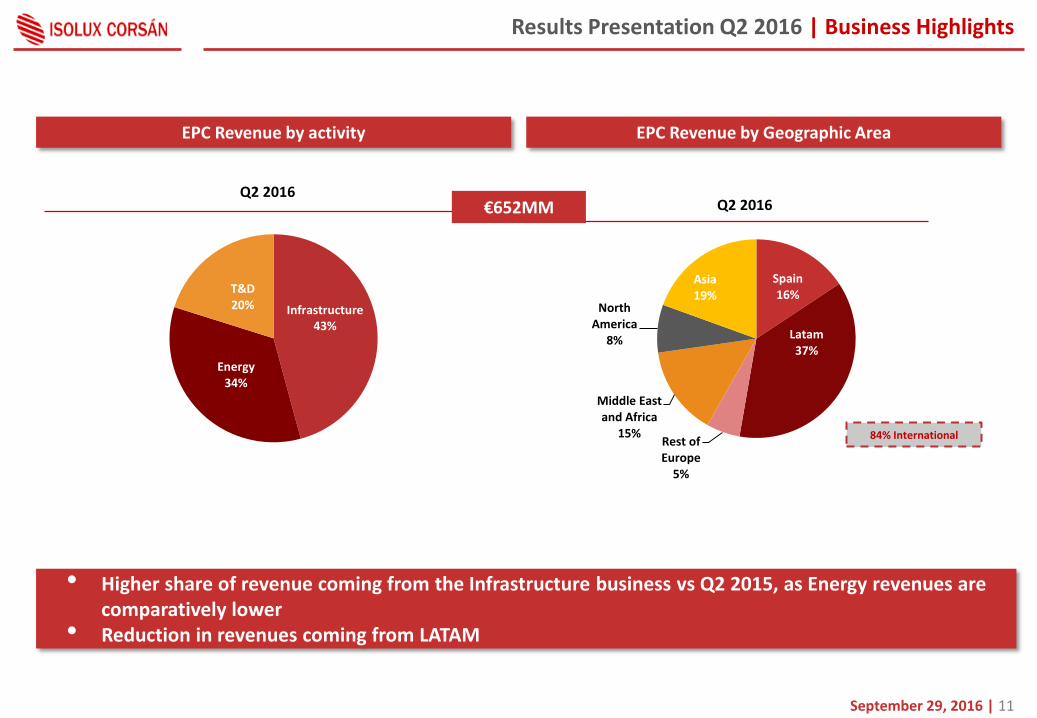
Spain 16%
Latam 37%
Rest of Europe
5%
Middle East and Africa
15%
North America
8%
Asia 19%
Energy 34%
T&D 20% Infrastructure
43%
EPC Revenue by activity
Q2 2016
EPC Revenue by Geographic Area
Q2 2016
84% International
€652MM
• Higher share of revenue coming from the Infrastructure business vs Q2 2015, as Energy revenues are comparatively lower
• Reduction in revenues coming from LATAM
Results Presentation Q2 2016 | Business Highlights

196 48 48
129 0 0
225 131 131
235 138 27
246 203
0
89 89 89
178 178 178
234 234 234
September 29, 2016 | 12
>250M 17%
100M-250M 35%
50M-100M 21%
10M-50M 20%
<10M 7% Middle
East and Africa 13%
Asia 19%
LATAM 48%
Rest of Europe
4%
Spain 10%
North America
6%
Energy 19%
T&D 33%
Infrastructure 48%
Q2 2016
EPC Backlog by Segment EPC Backlog by Geographic Area
Q2 2016
EPC Backlog Concentration
Q2 2016
90% International
• EPC backlog at the end of June stood at €6.1 bn • Concentration in mid size projects remains fairly stable • Exposure to Spain keeps decreasing with growth in ME&Africa as well as Asia
Results Presentation Q2 2016 | Business Highlights

196 48 48
129 0 0
225 131 131
235 138 27
246 203
0
89 89 89
178 178 178
234 234 234
September 29, 2016 | 13
2. Q2 2016 Business Highlights
ii. Concessions
196 48 48
129 0 0
225 131 131
235 138 27
246 203
0
89 89 89
178 178 178
234 234 234
September 29, 2016 | 14
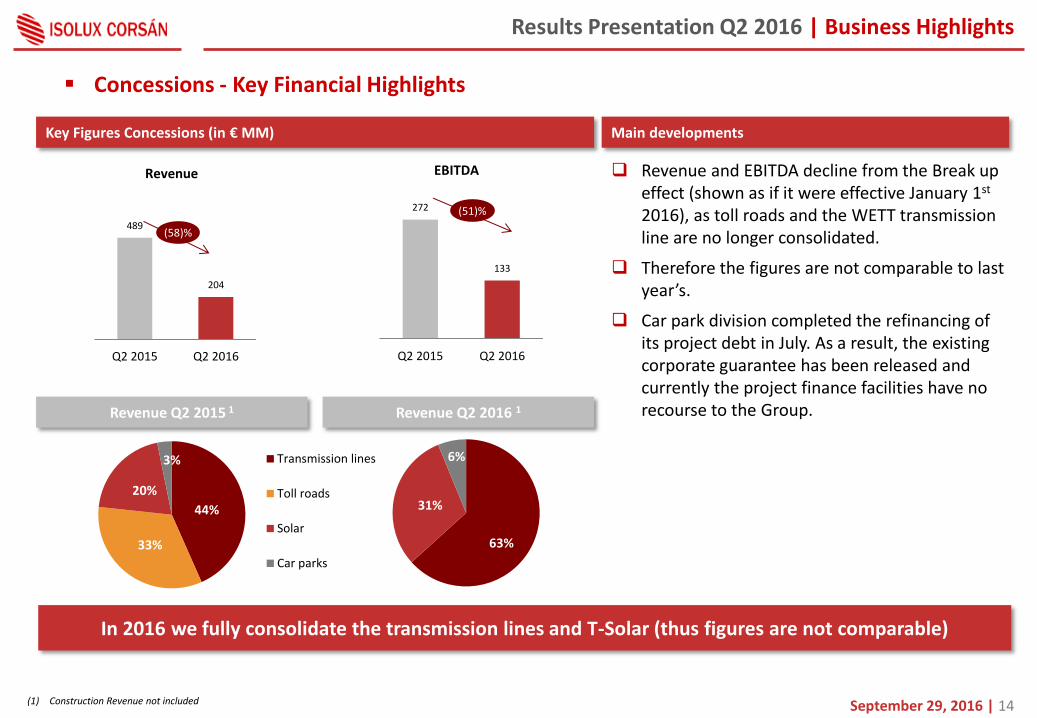
489
204
Q2 2015 Q2 2016
Concessions - Key Financial Highlights
Key Figures Concessions (in € MM) Main developments
Revenue and EBITDA decline from the Break up effect (shown as if it were effective January 1st 2016), as toll roads and the WETT transmission line are no longer consolidated.
Therefore the figures are not comparable to last year’s.
Car park division completed the refinancing of its project debt in July. As a result, the existing corporate guarantee has been released and currently the project finance facilities have no recourse to the Group.
In 2016 we fully consolidate the transmission lines and T-Solar (thus figures are not comparable)
(1) Construction Revenue not included
Revenue Q2 2016 1 Revenue Q2 2015 1
Revenue EBITDA
272
133
Q2 2015 Q2 2016
44%
33%
20%
3% Transmission lines
Toll roads
Solar
Car parks
(58)%
(51)%
63%
31%
6%
Results Presentation Q2 2016 | Business Highlights
196 48 48
129 0 0
225 131 131
235 138 27
246 203
0
89 89 89
178 178 178
234 234 234
September 29, 2016 | 15
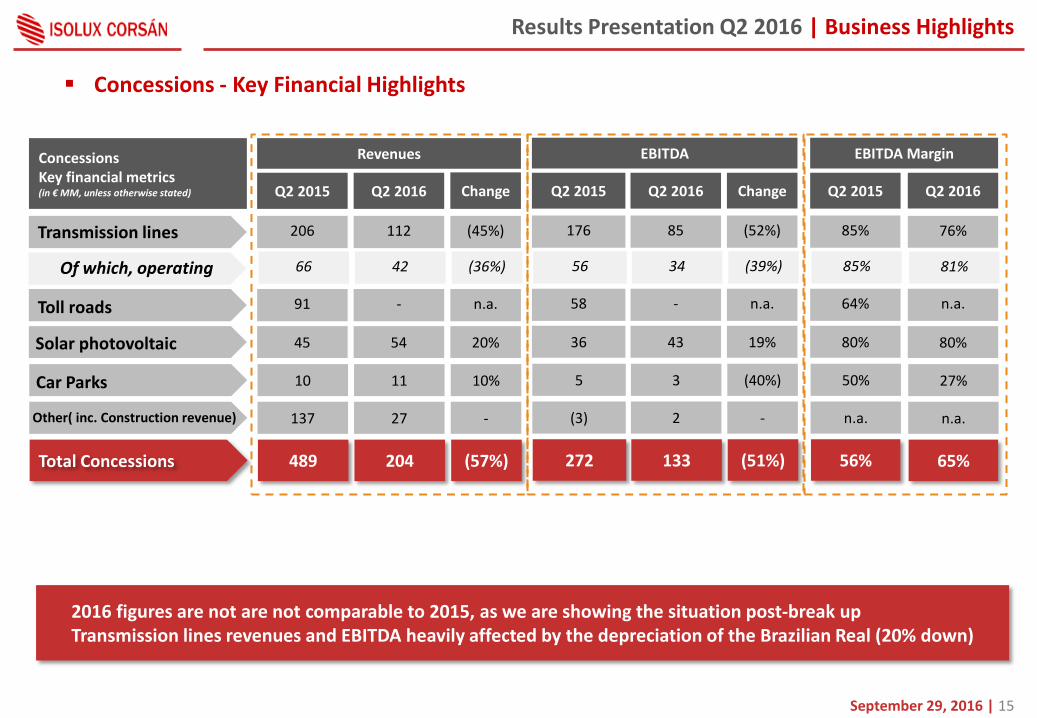
Concessions Key financial metrics (in € MM, unless otherwise stated) Q2 2015 Q2 2016 Change
Transmission lines 206 112 (45%)
Toll roads 91 - n.a.
Solar photovoltaic 45 54 20%
Revenues
Total Concessions 489 204 (57%)
Q2 2015 Q2 2016 Change
176 85 (52%)
58 - n.a.
36 43 19%
EBITDA
272 133 (51%)
Q2 2015
85%
64%
80%
EBITDA Margin
56%
Q2 2016
76%
n.a.
80%
65%
Car Parks 10 11 10% 5 3 (40%) 50% 27%
Other( inc. Construction revenue) 137 27 - (3) 2 - n.a. n.a.
Of which, operating 66 42 (36%) 56 34 (39%) 85% 81%
Concessions - Key Financial Highlights
2016 figures are not are not comparable to 2015, as we are showing the situation post-break up Transmission lines revenues and EBITDA heavily affected by the depreciation of the Brazilian Real (20% down)
Results Presentation Q2 2016 | Business Highlights
196 48 48
129 0 0
225 131 131
235 138 27
246 203
0
89 89 89
178 178 178
234 234 234
September 29, 2016 | 16
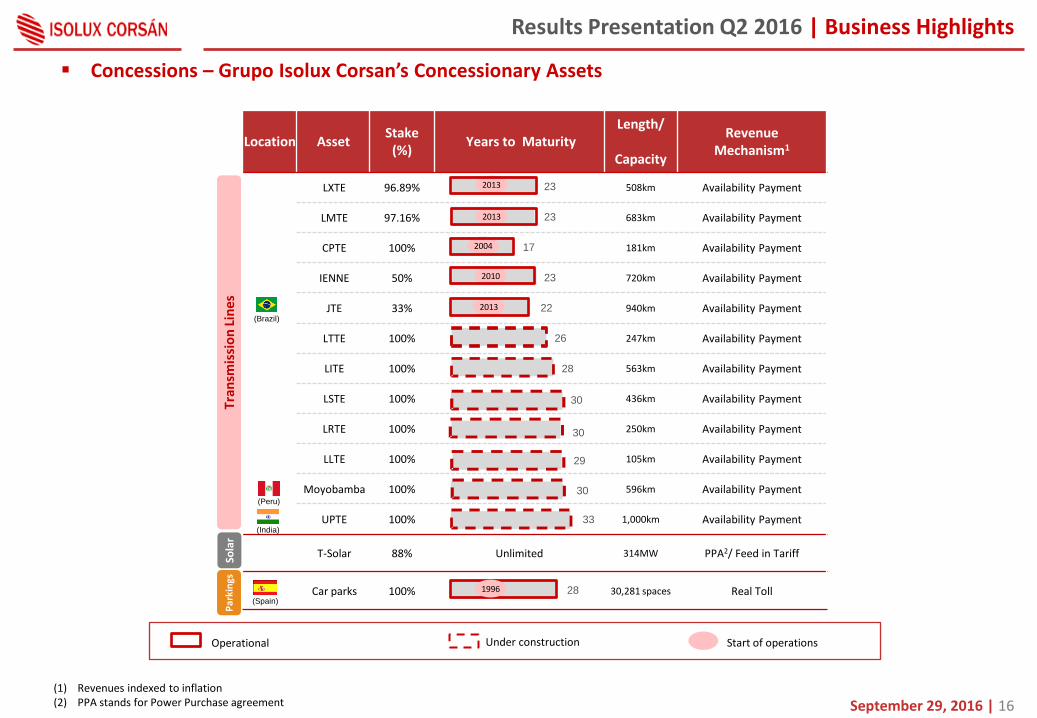
Location Asset Stake
(%) Years to Maturity
Length/
Capacity
Revenue Mechanism1
LXTE 96.89% 508km Availability Payment
LMTE 97.16% 683km Availability Payment
CPTE 100% 181km Availability Payment
IENNE 50% 720km Availability Payment
JTE 33% 940km Availability Payment
LTTE 100% 247km Availability Payment
LITE 100% 563km Availability Payment
LSTE 100% 436km Availability Payment
LRTE 100% 250km Availability Payment
LLTE 100% 105km Availability Payment
Moyobamba 100% 596km Availability Payment
UPTE 100% 1,000km Availability Payment
T-Solar 88% Unlimited 314MW PPA2/ Feed in Tariff
Car parks 100% 30,281 spaces Real Toll
Concessions – Grupo Isolux Corsan’s Concessionary Assets
Tran
smis
sio
n L
ine
s
(1) Revenues indexed to inflation (2) PPA stands for Power Purchase agreement
Sola
r
(Brazil)
(India)
2013
2004
2013
2013
2010
23
23
17
23
22
26
28
33
Operational Under construction Start of operations
(Peru)
30
30
29
30
(Spain)
Par
kin
gs
1996 28
Results Presentation Q2 2016 | Business Highlights

196 48 48
129 0 0
225 131 131
235 138 27
246 203
0
89 89 89
178 178 178
234 234 234
September 29, 2016 | 17
3. Appendix
196 48 48
129 0 0
225 131 131
235 138 27
246 203
0
89 89 89
178 178 178
234 234 234
September 29, 2016 | 18
Results Presentation Q2 2016 | Appendix
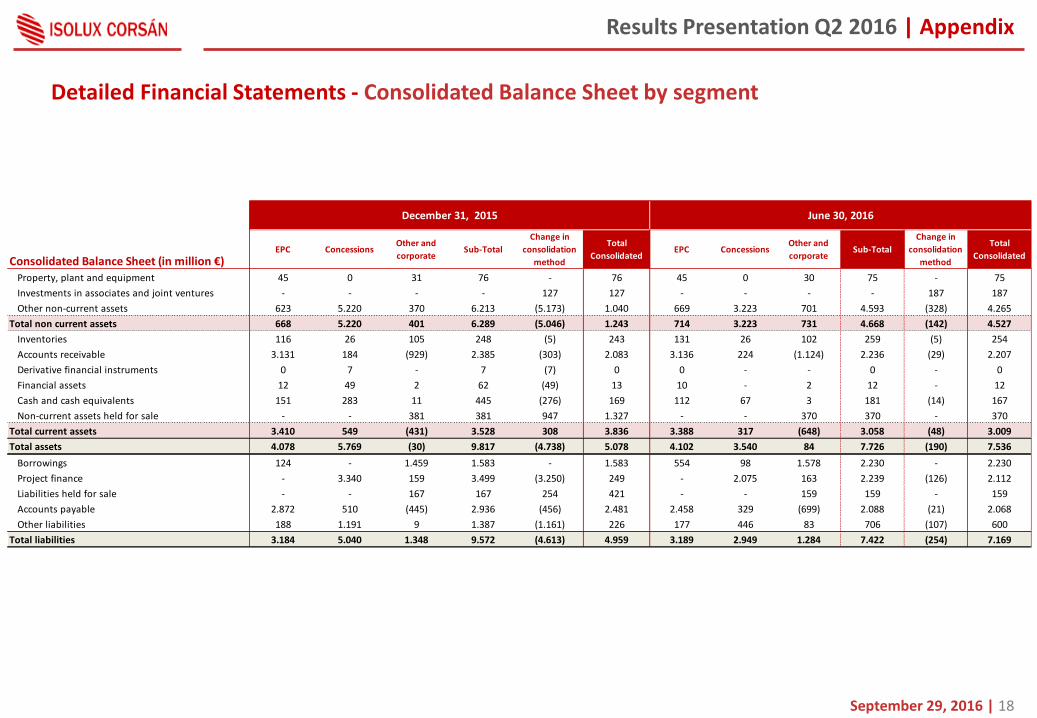
Detailed Financial Statements - Consolidated Balance Sheet by segment
Consolidated Balance Sheet (in million €)Property, plant and equipment 45 0 31 76 - 76 45 0 30 75 - 75
Investments in associates and joint ventures - - - - 127 127 - - - - 187 187
Other non-current assets 623 5.220 370 6.213 (5.173) 1.040 669 3.223 701 4.593 (328) 4.265
Total non current assets 668 5.220 401 6.289 (5.046) 1.243 714 3.223 731 4.668 (142) 4.527
Inventories 116 26 105 248 (5) 243 131 26 102 259 (5) 254
Accounts receivable 3.131 184 (929) 2.385 (303) 2.083 3.136 224 (1.124) 2.236 (29) 2.207
Derivative financial instruments 0 7 - 7 (7) 0 0 - - 0 - 0
Financial assets 12 49 2 62 (49) 13 10 - 2 12 - 12
Cash and cash equivalents 151 283 11 445 (276) 169 112 67 3 181 (14) 167
Non-current assets held for sale - - 381 381 947 1.327 - - 370 370 - 370
Total current assets 3.410 549 (431) 3.528 308 3.836 3.388 317 (648) 3.058 (48) 3.009
Total assets 4.078 5.769 (30) 9.817 (4.738) 5.078 4.102 3.540 84 7.726 (190) 7.536
Borrowings 124 - 1.459 1.583 - 1.583 554 98 1.578 2.230 - 2.230
Project finance - 3.340 159 3.499 (3.250) 249 - 2.075 163 2.239 (126) 2.112
Liabilities held for sale - - 167 167 254 421 - - 159 159 - 159
Accounts payable 2.872 510 (445) 2.936 (456) 2.481 2.458 329 (699) 2.088 (21) 2.068
Other liabilities 188 1.191 9 1.387 (1.161) 226 177 446 83 706 (107) 600
Total liabilities 3.184 5.040 1.348 9.572 (4.613) 4.959 3.189 2.949 1.284 7.422 (254) 7.169
June 30, 2016
EPC ConcessionsOther and
corporateSub-Total
Change in
consolidation
method
Total
ConsolidatedSub-Total
Change in
consolidation
method
Total
ConsolidatedEPC Concessions
Other and
corporate
December 31, 2015
196 48 48
129 0 0
225 131 131
235 138 27
246 203
0
89 89 89
178 178 178
234 234 234
September 29, 2016 | 19
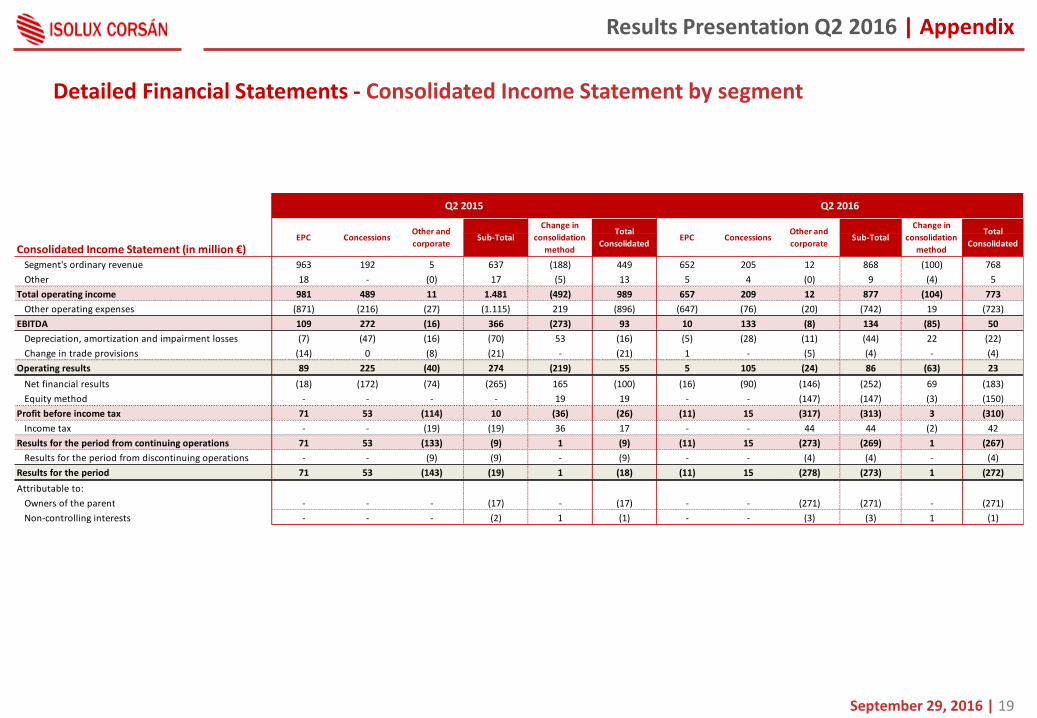
Detailed Financial Statements - Consolidated Income Statement by segment
Results Presentation Q2 2016 | Appendix
Consolidated Income Statement (in million €)Segment's ordinary revenue 963 192 5 637 (188) 449 652 205 12 868 (100) 768
Other 18 - (0) 17 (5) 13 5 4 (0) 9 (4) 5
Total operating income 981 489 11 1.481 (492) 989 657 209 12 877 (104) 773
Other operating expenses (871) (216) (27) (1.115) 219 (896) (647) (76) (20) (742) 19 (723)
EBITDA 109 272 (16) 366 (273) 93 10 133 (8) 134 (85) 50
Depreciation, amortization and impairment losses (7) (47) (16) (70) 53 (16) (5) (28) (11) (44) 22 (22)
Change in trade provisions (14) 0 (8) (21) - (21) 1 - (5) (4) - (4)
Operating results 89 225 (40) 274 (219) 55 5 105 (24) 86 (63) 23
Net financial results (18) (172) (74) (265) 165 (100) (16) (90) (146) (252) 69 (183)
Equity method - - - - 19 19 - - (147) (147) (3) (150)
Profit before income tax 71 53 (114) 10 (36) (26) (11) 15 (317) (313) 3 (310)
Income tax - - (19) (19) 36 17 - - 44 44 (2) 42
Results for the period from continuing operations 71 53 (133) (9) 1 (9) (11) 15 (273) (269) 1 (267)
Results for the period from discontinuing operations - - (9) (9) - (9) - - (4) (4) - (4)
Results for the period 71 53 (143) (19) 1 (18) (11) 15 (278) (273) 1 (272)
Attributable to:
Owners of the parent - - - (17) - (17) - - (271) (271) - (271)
Non-controlling interests - - - (2) 1 (1) - - (3) (3) 1 (1)
Q2 2015 Q2 2016
EPC ConcessionsOther and
corporateSub-Total
Change in
consolidation
method
Total
ConsolidatedEPC Concessions
Other and
corporateSub-Total
Change in
consolidation
method
Total
Consolidated

196 48 48
129 0 0
225 131 131
235 138 27
246 203
0
89 89 89
178 178 178
234 234 234
September 29, 2016 | 20
Detailed Financial Statements – Consolidated Cash Flow Statement
Results Presentation Q2 2016 | Appendix
Consolidated Cash Flow (in million €) Jan-Jun 2015 Jan-Jun 2016
Profit/(loss) for the period before taxes (38) (314)
Adjustments for non-cash items 128 319
Changes in working capital (157) (381)
Taxes paid (7) (9)
Net cash generated from /(used in) operating activities (74) (385)
Net change due to consolidation perimeter - 75
Purchase of PP&E and intangible assets (6) (6)
Sale of fixed and intangible assets - 1
Acquisition of concessionary assets and non-current assets assigned to projects (6) (65)
Net change in investments in associates and financial investments 96 1
Interests received and other financial income 1 1
Net cash used in investing activities 86 6
Proceeds /(Reimbursement) of Corporate debt, net (6) 505
Proceeds /(Reimbursement) of Project finance, net (7) (11)
Interest paid (102) (114)
Net cash flows generated from /(used in) financing activities (114) 379

March 5th 2015 | 21
225
131
131
196
48
48
178
178
178
234
234
234
243
203
0
235
138
27
129
5
5
Thank you
© Isolux Corsán 2016
Isolux Corsán Investor Relations [email protected]