Results of Student Evaluation of Instruction (SEOI) · Results of Student Evaluation of Instruction...
68
Results of Student Evaluation of Instruction (SEOI) Spring 2008 Prepared by: Office of Institutional Research July 11, 2008
Transcript of Results of Student Evaluation of Instruction (SEOI) · Results of Student Evaluation of Instruction...

Results of Student Evaluation of Instruction
(SEOI)
Spring 2008
Prepared by: Office of Institutional Research July 11, 2008

Houston Community College Office of Institutional Research
Spring 2008
Results of Student Evaluation of Instruction
Table of Contents Executive Summary Overview Analysis of SEOI Questions Full-Time/Part-Time Academic Instructors ……………… Tab 1 Full-Time/Part-Time Workforce Instructors ……………... Tab 2 Learning Resources Results………………………………………... Tab 3 Means Reports Academic ………………………………………………………. Tab 4 Workforce ……………………………………………………… Tab 5 Appendices ……………………………………………………………. Tab 6 Instructor and Student Proctor Directions SEOI Survey How to Read the Individual Instructor Report Please assist us by sharing all or parts of this document with colleagues who might find it useful. You may contact Dr. Linda Gibbs, Director (713) 718-8627, or Ali Tipu (713) 718-8635, if you have any questions or comments on this material.
GB: ToC.doc Prepared 7/11/08

Houston Community College System Office of Institutional Research
Executive Summary Spring 2008 Administration: The Student Evaluation of Instruction (SEOI) was administered to all full-time and part-time faculty. Approximately 82,806 surveys were sent out in 4,830 envelopes; 52,464 surveys were returned to the Office of Institutional Research. The return rate for the paper surveys was 63% including late submissions. Instructors’ reports were provided to academic, workforce deans and to the respective executive secretaries on July 10, 2008 on a CD. Methods Used: The optical-scan survey instrument was created using ScanTools for Windows, by National Computer Systems. The scanned data were analyzed by OIR using SPSS 16.0, and individual instructor reports were prepared. Also provided to students with the questionnaires were student comment sheets, which were later returned in their original hand-written form to the instructors via their respective deans’ offices. Library data were analyzed by subject and location and provided to library chairs for their use.

Houston Community College Office of Institutional Research
Overview of SEOI Responses, Spring 2008
In the responses discussed below, respondents who neither agreed nor disagreed, indicated that they were ‘neutral’, ‘had no basis for judgment’ or simply did not respond to the question. In Part I, Evaluation of Instruction:
• The course requirements in the syllabus were clearly stated; 91.3% of students agreed and 1.4% disagreed.
• The textbook used for this course is suitable; 85.7% of respondents agreed while 2.6% disagreed.
• Other instructional materials (tapes, handouts, web sites, etc.) used in this course enhanced my learning of the subject matter; 81.2% of respondents agreed, and 3.5% disagreed.
In Part II, Evaluation of Instructor:
• The instructor asks test questions that deal with material that is covered in the course; 92.6% agreed or strongly agreed, and 2.1% disagreed or strongly disagreed.
• The instructor communicates clearly; 89.3% agreed or strongly agreed, and 3.5% disagreed or strongly disagreed.
• The assignments were relevant to the course; 93.2% agreed or strongly agreed, and 1.3% disagreed or strongly disagreed.
• My grades are an indication of learning; 86.0% agreed or strongly agreed, and 3.9% disagreed or strongly disagreed.
• The instructor treats students with respect; 93.0% agreed or strongly agreed, and 1.9% disagreed or strongly disagreed.
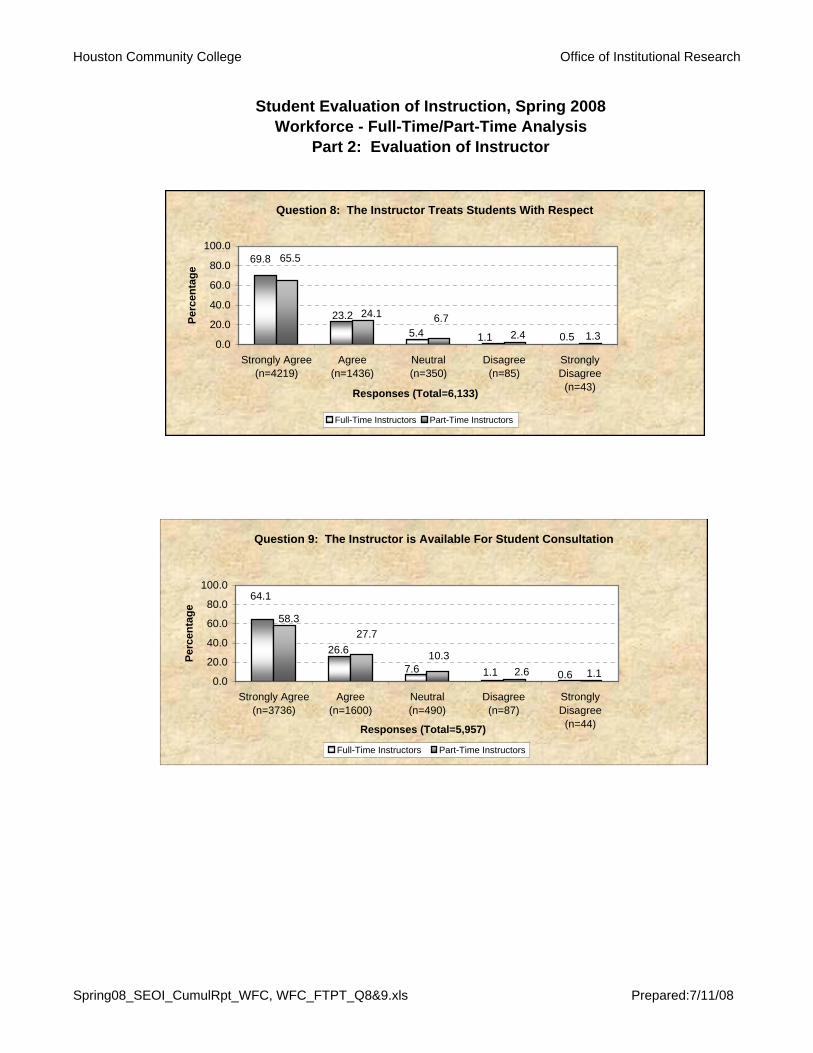
• The instructor is available for student consultation; 89.1% agreed or strongly agreed, and 2.0% disagreed or strongly disagreed.
• The instructor grades impartially; 81.0% agreed or strongly agreed, and 7.3% disagreed or strongly disagreed.
• The instructor gives me timely feedback on graded work; 87.2% agreed or strongly agreed, and 3.6% disagreed or strongly disagreed.
In Part III, Lab Evaluation: In the section below, students who indicated an opinion are calculated in the agreement/disagreement percentages; those who indicated ‘no basis for judgment’ or did not respond were assumed not to be enrolled in laboratory or clinical courses.
• The instructor explains appropriate safety procedures for this laboratory/clinical; 86.8% agreed or strongly agreed, and 1.9% disagreed or strongly disagreed.
• The instructor links the laboratory exercises to lecture; 85.2% agreed or strongly agreed, and 2.4% disagreed or strongly disagreed.
In Part IV, Overall Evaluation:
• The instructor encourages me to become actively engaged in the learning process; 89.0% agreed or strongly agreed, and 2.6% disagreed or strongly disagreed.
• I would recommend this instructor to other students; 86.7% agreed or strongly agreed, and 4.6% disagreed or strongly disagreed.

Houston Community College Office of Institutional Research
Student Evaluation of Instruction, Spring 2008Academic - Full-Time/Part-Time Analysis
Part I: Evaluation of Instruction
Question 1: The Course Requirements in the Syllabus Were Clearly Stated
1.37.1
91.6
1.47.5
91.1
0.0
20.0
40.0
60.0
80.0
100.0
120.0
Yes (n=24226) Neutral (n=1923) No (n=348)
Responses (Total=26,497)
Perc
enta
ge
Full-Time Instructors Part-Time Instructors
Question 2: The Textbook Used For This Course is Suitable
85.8
2.6
11.6
2.411.3
86.3
0.0
20.0
40.0
60.0
80.0
100.0
Yes (n=22041) Neutral (n=2949) No (n=646)
Responses (Total=25,636)
Perc
enta
ge
Full-Time Instructors Part-Time Instructors
Spring 08_SEOI_CumulRpt_Acad, Acad_FTPT_Q1&2.xls Prepared:7/11/08

Houston Community College Office of Institutional Research
Student Evaluation of Instruction, Spring 2008Academic - Full-Time/Part-Time Analysis
Part I: Evaluation of Instruction
Question 3: Other Instructional Materials (Tapes, Handouts, Web Sites, etc.) Used in This Course Enhanced My Learning of the Subject Matter
81.3
15.2
3.5
16.4
3.8
79.9
0.0
20.0
40.0
60.0
80.0
100.0
Yes (n=20027) Neutral (n=3858) No (n=885)Responses (Total=24,770)
Perc
enta
ge
Full-Time Instructors Part-Time Instructors
Spring 08_SEOI_CumulRpt_Acad, Acad_FTPT_Q3.xls Prepared: 7/11/08

Houston Community College Office of Institutional Research
Student Evaluation of Instruction, Spring 2008Academic - Full-Time/Part-Time Analysis
Part 2: Evaluation of Instructor
Question 4: The Instructor Asks Test Questions That Deal With Material That is Covered in the Course
1.3
65.9
27.0
5.4 0.5
66.7
25.8
5.1 1.6 0.70.0
20.0
40.0
60.0
80.0
100.0
Strongly Agree(n=17323)
Agree (n=6961) Neutral(n=1388)
Disagree(n=366)
StronglyDisagree(n=146)Responses (Total=26,184)
Perc
enta
ge
Full-Time Instructors Part-Time Instructors
Question 5: The Instructor Communicates Clearly
2.17.0
25.0
65.0
0.9 1.52.67.5
24.6
63.9
0.0
20.0
40.0
60.0
80.0
100.0
Strongly Agree(n=17084)
Agree (n=6581) Neutral(n=1889)
Disagree(n=593)
StronglyDisagree(n=293)Responses (Total=26,440)
Perc
enta
ge
Full-Time Instructors Part-Time Instructors
Spring 08_SEOI_CumulRpt_Acad, Acad_FTPT_Q4&5.xls Prepared: 7/11/08

Houston Community College Office of Institutional Research
Student Evaluation of Instruction, Spring 2008Academic - Full-Time/Part-Time Analysis
Part 2: Evaluation of Instructor
Question 6: The Assignments Were Relevant to the Course
5.2
27.0
66.6
0.30.9 0.60.85.7
26.6
66.3
0.0
20.0
40.0
60.0
80.0
100.0
Strongly Agree(n=17462)
Agree (n=7050) Neutral(n=1415)
Disagree(n=226)
StronglyDisagree(n=103)
Responses (Total=26,256)
Perc
enta
ge
Full-Time Instructors Part-Time Instructors
Question 7: My Grades Are an Indication of My Learning
0.92.9
10.4
28.8
57.3
1.13.0
10.0
28.3
57.6
0.0
20.0
40.0
60.0
80.0
100.0
Strongly Agree(n=15036)
Agree(n=7496)
Neutral(n=2668)
Disagree(n=768)
StronglyDisagree(n=248)Responses (Total=26,216)
Perc
enta
ge
Full-Time Instructors Part-Time Instructors
Spring 08_SEOI_CumulRpt_Acad, Acad_FTPT_Q6&7.xls Prepared: 7/11/08

Houston Community College Office of Institutional Research
Student Evaluation of Instruction, Spring 2008Academic - Full-Time/Part-Time Analysis
Part 2: Evaluation of Instructor
Question 9: The Instructor is Available For Student Consultation
0.7
63.2
26.2
8.6 1.4 0.6
63.3
25.1 9.4
1.50.0
20.0
40.0
60.0
80.0
100.0
Strongly Agree(n=16078)
Agree (n=6564) Neutral(n=2255)
Disagree(n=367)
StronglyDisagree(n=159)Responses (Total=25,423)
Perc
enta
ge
Full-Time Instructors Part-Time Instructors
Question 8: The Instructor Treats Students With Respect
0.61.24.9
22.3
71.1
0.81.05.3
21.2
71.6
0.0
20.0
40.0
60.0
80.0
100.0
Strongly Agree(n=18769)
Agree(n=5782)
Neutral(n=1321)
Disagree(n=291)
StronglyDisagree(n=180)Responses (Total=26,343)
Perc
enta
ge
Full-Time Instructors Part-Time Instructors
Spring 08_SEOI_CumulRpt_Acad, Acad_FTPT_Q8&9.xls Prepared: 7/11/08

Houston Community College Office of Institutional Research
Student Evaluation of Instruction, Spring 2008Academic - Full-Time/Part-Time Analysis
Part 2: Evaluation of Instructor
Question 11: The Instructor Gives Me Timely Feedback on Graded Work
1.0
60.2
27.2
9.02.6
60.8
26.39.2
2.5 1.10.0
20.0
40.0
60.0
80.0
100.0
Strongly Agree(n=15617)
Agree (n=6955) Neutral(n=2351)
Disagree(n=659)
StronglyDisagree(n=265)Responses (Total=25,847)
Perc
enta
ge
Full-Time Instructors Part-Time Instructors
Question 10: The Instructor Grades Impartially
56.3
24.6 11.84.7 2.6 2.64.6
56.9
23.8 12.0
0.0
20.0
40.0
60.0
80.0
100.0
Strongly Agree(n=14158)
Agree(n=6102)
Neutral(n=2978)
Disagree(n=1167)
StronglyDisagree(n=655)Responses (Total=25,060)
Perc
enta
ge
Full-Time Instructors Part-Time Instructors
Spring 08_SEOI_CumulRpt_Acad, Acad_FTPT_Q10&11.xls Prepared: 7/11/08

Houston Community College Office of Institutional Research
Student Evaluation of Instruction, Spring 2008Academic - Full-Time/Part-Time Analysis
Part 3: Lab Evaluation
Question 12: The Instructor Explains Appropriate Safety Procedures For This Laboratory/Clinical
0.5
58.5
27.412.1
1.5
59.6
27.110.9
1.6 0.80.0
20.0
40.0
60.0
80.0
100.0
Strongly Agree(n=7210)
Agree (n=3340) Neutral(n=1430)
Disagree(n=190)
StronglyDisagree(n=70)Responses (Total=12,240)
Perc
enta
ge
Full-Time Instructors Part-Time Instructors
Question 13: The Instructor Links the Laboratory Exercises to Lecture
0.61.9
13.0
27.3
57.3
0.81.812.6
27.1
57.7
0.0
20.0
40.0
60.0
80.0
100.0
Strongly Agree(n=6927)
Agree (n=3285) Neutral(n=1549)
Disagree(n=224)
StronglyDisagree(n=80)
Responses (Total=12,065)
Perc
enta
ge
Full-Time Instructors Part-Time Instructors
Spring 08_SEOI_CumulRpt_Acad, Acad_FTPT_Q12&13.xls Prepared: 7/11/08

Houston Community College Office of Institutional Research
Student Evaluation of Instruction, Spring 2008Academic - Full-Time/Part-Time Analysis
Part 4: Overall Evaluation
Question 14: The Instructor Encourages Me to Become Actively Engaged in the Learning Process
0.81.88.2
26.8
62.4 61.8
0.91.98.9
26.5
0.0
20.0
40.0
60.0
80.0
100.0
Strongly Agree(n=16260)
Agree (n=6978) Neutral(n=2206)
Disagree(n=470)
StronglyDisagree(n=219)Responses (Total=26,133)
Perc
enta
ge
Full-Time Instructors Part-Time Instructors
Question 15: I Would Recommend This Instructor to Other Students
2.12.28.822.5
64.4
2.52.48.921.8
64.3
0.0
20.0
40.0
60.0
80.0
100.0
Strongly Agree(n=16463)
Agree(n=5701)
Neutral(n=2253)
Disagree(n=588)
StronglyDisagree(n=576)Responses (Total=25,581)
Perc
enta
ge
Full-Time Instructors Part-Time Instructors
Spring 08_SEOI_CumulRpt_Acad, Acad_FTPT_Q14&15.xls Prepared: 7/11/08

Houston Community College Office of Institutional Research
Student Evaluation of Instruction, Spring 2008Workforce - Full-Time/Part-Time Analysis
Part I: Evaluation of Instruction
Question 1: The Course Requirements in the Syllabus Were Clearly Stated
1.47.5
91.1
2.38.7
89.0
0.0
20.0
40.0
60.0
80.0
100.0
120.0
Yes (n=5607) Neutral (n=480) No (n=98)Responses (Total=6,185)
Perc
enta
ge
Full-Time Instructors Part-Time Instructors
Question 2: The Textbook Used For This Course is Suitable
11.9
3.0
85.1 83.2
13.23.7
0.0
20.0
40.0
60.0
80.0
100.0
Yes (n=4982) Neutral (n=717) No (n=186)
Responses (Total=5,885)
Perc
enta
ge
Full-Time Instructors Part-Time Instructors
Spring08_SEOI_CumulRpt_WFC, WFC_FTPT_Q1&2.xls Prepared: 7/11/08

Houston Community College Office of Institutional Research
Student Evaluation of Instruction, Spring 2008Workforce - Full-Time/Part-Time Analysis
Part I: Evaluation of Instruction
Question 3: Other Instructional Materials (Tapes, Handouts, Web Sites, etc.) Used in This Course Enhanced My Learning of the Subject Matter
83.4
13.4
3.2
15.73.9
80.4
0.0
20.0
40.0
60.0
80.0
100.0
Yes (n=4793) Neutral (n=808) No (n=196)Reponses (Total=5,797)
Perc
enta
ge
Full-Time Instructors Part-Time Instructors
Spring08_SEOI_CumulRpt_WFC, WFC_FTPT_Q3.xls Prepared: 7/11/08

Houston Community College Office of Institutional Research
Student Evaluation of Instruction, Spring 2008Workforce - Full-Time/Part-Time Analysis
Part 2: Evaluation of Instructor
Question 4: The Instructor Asks Test Questions That Deal With Material That is Covered in the Course
1.7
64.4
28.0
5.2 0.7
62.2
29.7
5.5 1.9 0.80.0
20.0
40.0
60.0
80.0
100.0
Strongly Agree(n=3851)
Agree(n=1713)
Neutral(n=316)
Disagree(n=107)
StronglyDisagree(n=43)Responses (Total=6,030)
Perc
enta
ge
Full-Time Instructors Part-Time Instructors
Question 5: The Instructor Communicates Clearly
1.2
63.4
25.8
7.2 2.5
57.628.7
8.6 3.3 1.80.0
20.0
40.0
60.0
80.0
100.0
Strongly Agree(n=3819)
Agree(n=1630)
Neutral(n=461)
Disagree(n=167)
StronglyDisagree(n=82)
Responses (Total=6,159)
Perc
enta
ge
Full-Time Instructors Part-Time Instructors
Spring08_SEOI_CumulRpt_WFC, WFC_FTPT_Q4&5.xls Prepared:7/11/08

Houston Community College Office of Institutional Research
Student Evaluation of Instruction, Spring 2008Workforce - Full-Time/Part-Time Analysis
Part 2: Evaluation of Instructor
Question 6: The Assignments Were Relevant to the Course
5.4
27.2
66.2
0.40.7 0.51.66.4
30.0
61.5
0.0
20.0
40.0
60.0
80.0
100.0
Strongly Agree(n=3972)
Agree(n=1701)
Neutral(n=345)
Disagree(n=55)
StronglyDisagree(n=27)Responses (Total=6,100)
Perc
enta
ge
Full-Time Instructors Part-Time Instructors
Question 7: My Grades Are an Indication of My Learning
57.1
30.2
8.9
2.8 1.1
52.2
31.3
11.5
3.3 1.70.0
20.0
40.0
60.0
80.0
100.0
Strongly Agree(n=3393)
Agree(n=1846)
Neutral(n=577)
Disagree(n=176)
StronglyDisagree(n=74)Responses (Total=6,066)
Perc
enta
ge
Full-Time Instructors Part-Time Instructors
Spring08_SEOI_CumulRpt_WFC, WFC_FTPT_Q6&7.xls Prepared: 7/11/08
Houston Community College Office of Institutional Research
Student Evaluation of Instruction, Spring 2008Workforce - Full-Time/Part-Time Analysis
Part 2: Evaluation of Instructor
Question 9: The Instructor is Available For Student Consultation
64.1
26.6
7.6 1.1 0.6 1.1
58.327.7
10.32.6
0.0
20.0
40.0
60.0
80.0
100.0
Strongly Agree(n=3736)
Agree(n=1600)
Neutral(n=490)
Disagree(n=87)
StronglyDisagree(n=44)Responses (Total=5,957)
Perc
enta
ge
Full-Time Instructors Part-Time Instructors
Question 8: The Instructor Treats Students With Respect
0.51.15.423.2
69.8
1.32.46.724.1
65.5
0.0
20.0
40.0
60.0
80.0
100.0
Strongly Agree(n=4219)
Agree(n=1436)
Neutral(n=350)
Disagree(n=85)
StronglyDisagree(n=43)Responses (Total=6,133)
Perc
enta
ge
Full-Time Instructors Part-Time Instructors
Spring08_SEOI_CumulRpt_WFC, WFC_FTPT_Q8&9.xls Prepared:7/11/08

Houston Community College Office of Institutional Research
Student Evaluation of Instruction, Spring 2008Workforce - Full-Time/Part-Time Analysis
Part 2: Evaluation of Instructor
Question 11: The Instructor Gives Me Timely Feedback on Graded Work
1.1
60.4
26.6 9.7
2.2
55.7
29.8
9.1 3.4 2.00.0
20.0
40.0
60.0
80.0
100.0
Strongly Agree(n=3549)
Agree(n=1635)
Neutral(n=574)
Disagree(n=146)
StronglyDisagree(n=79)Responses (Total=5,983)
Perc
enta
ge
Full-Time Instructors Part-Time Instructors
Question 10: The Instructor Grades Impartially
57.2
25.0 10.34.6 2.8 2.85.7
51.9
26.7 13.0
0.0
20.0
40.0
60.0
80.0
100.0
Strongly Agree(n=3280)
Agree(n=1490)
Neutral(n=643)
Disagree(n=283)
StronglyDisagree(n=163)Responses (Total=5,859)
Perc
enta
ge
Full-Time Instructors Part-Time Instructors
Spring08_SEOI_CumulRpt_WFC, WFC_FTPT_Q10&11.xls Prepared: 7/11/08

Houston Community College Office of Institutional Research
Student Evaluation of Instruction, Spring 2008Workforce - Full-Time/Part-Time Analysis
Part 3: Lab Evaluation
Question 12: The Instructor Explains Appropriate Safety Procedures For This Laboratory/Clinical
1.0
9.226.6
62.7
0.5 0.31.3
11.227.3
59.8
0.0
20.0
40.0
60.0
80.0
100.0
Strongly Agree(n=2321)
Agree(n=1001)
Neutral(n=362)
Disagree(n=41)
StronglyDisagree(n=17)Responses (Total=3,742)
Perc
enta
ge
Full-Time Instructors Part-Time Instructors
Question 13: The Instructor Links the Laboratory Exercises to Lecture
0.71.310.6
26.8
60.6
1.4
12.828.2
57.1
0.60.0
20.0
40.0
60.0
80.0
100.0
Strongly Agree(n=2225)
Agree(n=1013)
Neutral(n=415)
Disagree(n=49)
StronglyDisagree(n=25)
Responses (Total=3,727)
Perc
enta
ge
Full-Time Instructors Part-Time Instructors
Spring08_SEOI_CumulRpt_WFC, WFC_FTPT_Q12&13.xls Prepared: 7/11/08

Houston Community College Office of Institutional Research
Student Evaluation of Instruction, Spring 2008Workforce - Full-Time/Part-Time Analysis
Part 4: Overall Evaluation
Question 14: The Instructor Encourages Me to Become Actively Engaged in theLearning Process
0.91.67.8
26.0
63.859.1
1.81.98.4
29.5
0.0
20.0
40.0
60.0
80.0
100.0
Strongly Agree(n=3818)
Agree (n=1635) Neutral (n=483) Disagree(n=102)
StronglyDisagree(n=54)Responses (Total=6,092)
Perc
enta
ge
Full-Time Instructors Part-Time Instructors
Question 15: I Would Recommend This Instructor to Other Students
2.12.48.122.9
64.5
3.02.5
9.826.8
58.0
0.0
20.0
40.0
60.0
80.0
100.0
Strongly Agree(n=3756)
Agree(n=1418)
Neutral(n=508)
Disagree(n=145)
StronglyDisagree(n=138)
Responses (Total=5,965)
Perc
enta
ge
Full-Time Instructors Part-Time Instructors
Spring08_SEOI_CumulRpt_WFC, WFC_FTPT_Q14&15.xls Prepared: 7/11/08

Houston Community College Office of Institutional Research
College Campus Strongly Agree Agree Neutral Disagree Strongly
Disagree
No Basis for
JudgementTotal
Central Distance Ed.-CE Count 0 0 0 0 0 1 1Row % 0.0% 0.0% 0.0% 0.0% 0.0% 100.0% 100.0%
Willie L Gay Hall Count 191 129 74 11 6 103 514Row % 37.2% 25.1% 14.4% 2.1% 1.2% 20.0% 100.0%
Central Count 3,051 2,339 1,599 236 131 2,129 9,485Row % 32.2% 24.7% 16.9% 2.5% 1.4% 22.4% 100.0%
Main Ctr - CE Count 57 50 49 4 4 69 233Row % 24.5% 21.5% 21.0% 1.7% 1.7% 29.6% 100.0%
SW Dual Credit Count 1 1 0 0 0 1 3Row % 33.3% 33.3% 0.0% 0.0% 0.0% 33.3% 100.0%
Coleman Health Sci Ctr Count 758 520 435 50 34 708 2,505Row % 30.3% 20.8% 17.4% 2.0% 1.4% 28.3% 100.0%
Northeast NEC-Off Campus Count 5 7 6 0 0 13 31Row % 16.1% 22.6% 19.4% 0.0% 0.0% 41.9% 100.0%
Automotive Tech. Ctr Count 65 41 37 7 1 2 153Row % 42.5% 26.8% 24.2% 4.6% 0.7% 1.3% 100.0%
Health Sci Ctr Count 3 0 0 0 0 1 4Row % 75.0% 0.0% 0.0% 0.0% 0.0% 25.0% 100.0%
Distance Ed.-NE Count 0 0 0 0 0 1 1Row % 0.0% 0.0% 0.0% 0.0% 0.0% 100.0% 100.0%
Northline Ctr Count 1,051 647 460 72 26 601 2,857Row % 36.8% 22.6% 16.1% 2.5% 0.9% 21.0% 100.0%
Northeast Campus Count 97 58 59 7 4 54 279Row % 34.8% 20.8% 21.1% 2.5% 1.4% 19.4% 100.0%
NE Dual Credit Count 0.0 1.0 0.0 0.0 0.0 0.0 1.0Row % 0.0% 100.0% 0.0% 0.0% 0.0% 0.0% 100.0%
Pinemont Ctr Count 322 173 109 23 8 198 833Row % 38.70% 20.80% 13.10% 2.80% 1.00% 23.80% 100.00%
Northwest Town&Country Ctr Count 2,421 1,531 1,175 145 84 1,704 7,060Row % 34.3% 21.7% 16.6% 2.1% 1.2% 24.1% 100.0%
Question LR1: "The library resources were adequate for the needs of this course."
Research for Library Resources Questions, Student Evaluation of Instruction Spring 2008
TP: Spring08_library_means.xls 1 06-30-2008

Houston Community College Office of Institutional Research
College Campus Strongly Agree Agree Neutral Disagree Strongly
Disagree
No Basis for
JudgementTotal
Question LR1: "The library resources were adequate for the needs of this course."
Research for Library Resources Questions, Student Evaluation of Instruction Spring 2008
Westgate Ctr Count 1,105 627 480 75 36 967 3,290Row % 33.6% 19.1% 14.6% 2.3% 1.1% 29.4% 100.0%
Southeast Distance Ed.-SE Count 4 0 1 0 0 0 5Row % 80.0% 0.0% 20.0% 0.0% 0.0% 0.0% 100.0%
Eastside Ctr Count 1,732 1,127 707 71 35 785 4,457Row % 38.9% 25.3% 15.9% 1.6% 0.8% 17.6% 100.0%
Southwest Gulfton Ctr Count 496 492 209 40 17 96 1350Row % 36.7% 36.4% 15.5% 3.0% 1.3% 7.1% 100.0%
Alief Ctr Count 1,017 704 488 99 45 526 2,879Row % 35.3% 24.5% 17.0% 3.4% 1.6% 18.3% 100.0%
NW College Opt Count 24 26 43 12 4 34 143Row % 16.8% 18.2% 30.1% 8.4% 2.8% 23.8% 100.0%
Stafford Ctr Count 3,037 1,879 1,417 172 65 1,552 8,122Row % 37.4% 23.1% 17.4% 2.1% 0.8% 19.1% 100.0%
Missouri City Ctr Count 3 2 0 0 0 2 7Row % 42.9% 28.6% 0.0% 0.0% 0.0% 28.6% 100.0%
West Loop Ctr Count 1,637 955 608 92 39 839 4,170Row % 39.3% 22.9% 14.6% 2.2% 0.9% 20.1% 100.0%
Distance Ed.-SW Count 0 0 0 1 0 0 1Row % 0.0% 0.0% 0.0% 100.0% 0.0% 0.0% 100.0%
System ACT/CONT Count 1 0 0 0 0 0 1Row % 100.0% 0.0% 0.0% 0.0% 0.0% 0.0% 100.0%
TP: Spring08_library_means.xls 2 06-30-2008

Houston Community College Office of Institutional Research
College Campus Strongly Agree Agree Neutral Disagree Strongly
Disagree
No Basis for
JudgementTotal
Central Distance Ed.-CE Count 0 0 0 0 0 1 1Row % 0.0% 0.0% 0.0% 0.0% 0.0% 100.0% 100.0%
Willie L Gay Hall Count 172 117 83 9 4 123 508Row % 33.9% 23.0% 16.3% 1.8% 0.8% 24.2% 100.0%
Central Count 2,950 2,121 1,648 140 84 2,451 9,394Row % 31.4% 22.6% 17.5% 1.5% 0.9% 26.1% 100.0%
Main Ctr - CE Count 56 46 55 2 1 69 229Row % 24.5% 20.1% 24.0% 0.9% 0.4% 30.1% 100.0%
SW Dual Credit Count 1 1 0 0 0 1 3Row % 33.3% 33.3% 0.0% 0.0% 0.0% 33.3% 100.0%
Coleman Health Sci Ctr Count 717 495 432 30 32 787 2,493Row % 28.8% 19.9% 17.3% 1.2% 1.3% 31.6% 100.0%
Northeast NEC-Off Campus Count 6 6 3 0 0 16 31Row % 19.4% 19.4% 9.7% 0.0% 0.0% 51.6% 100.0%
Automotive Tech. Ctr Count 62 42 34 8 1 6 153Row % 40.5% 27.5% 22.2% 5.2% 0.7% 3.9% 100.0%
Health Sci Ctr Count 3 0 0 0 0 1 4Row % 75.0% 0.0% 0.0% 0.0% 0.0% 25.0% 100.0%
Distance Ed.-NE Count 0 0 0 0 0 1 1Row % 0.0% 0.0% 0.0% 0.0% 0.0% 100.0% 100.0%
Northline Ctr Count 996 632 475 44 19 675 2,841Row % 35.1% 22.2% 16.7% 1.5% 0.7% 23.8% 100.0%
Northeast Campus Count 94 58 56 3 3 62 276Row % 34.1% 21.0% 20.3% 1.1% 1.1% 22.5% 100.0%
NE Dual Credit Count 0 1 0 0 0 0 1Row % 0.0% 100.0% 0.0% 0.0% 0.0% 0.0% 100.0%
Pinemont Ctr Count 306 164 121 14 4 220 829Row % 36.9% 19.8% 14.6% 1.7% 0.5% 26.5% 100.0%
Northwest Town&Country Ctr Count 2,286 1,415 1,207 92 66 1,928 6,994Row % 32.7% 20.2% 17.3% 1.3% 0.9% 27.6% 100.0%
Research for Library Resources Questions, Student Evaluation of Instruction Spring 2008
Question LR2: "The library instruction received for this course was adequate."
TP: Spring2008_library_means.xls 1 06-30-2008

Houston Community College Office of Institutional Research
College Campus Strongly Agree Agree Neutral Disagree Strongly
Disagree
No Basis for
JudgementTotal
Research for Library Resources Questions, Student Evaluation of Instruction Spring 2008
Question LR2: "The library instruction received for this course was adequate."
Westgate Ctr Count 1,035 589 481 46 29 1,095 3,275Row % 31.6% 18.0% 14.7% 1.4% 0.9% 33.4% 100.0%
Southeast Distance Ed.-SE Count 4 0 1 0 0 0 5Row % 80.0% 0.0% 20.0% 0.0% 0.0% 0.0% 100.0%
Eastside Ctr Count 1,621 1,070 716 61 22 925 4,415Row % 36.7% 24.2% 16.2% 1.4% 0.5% 21.0% 100.0%
Southwest Gulfton Ctr Count 486 516 190 23 16 102 1,333Row % 36.5% 38.7% 14.3% 1.7% 1.2% 7.7% 100.0%
Alief Ctr Count 966 691 488 63 35 610 2,853Row % 33.9% 24.2% 17.1% 2.2% 1.2% 21.4% 100.0%
NW College Opt Count 26 24 49 6 1 37 143Row % 18.2% 16.8% 34.3% 4.2% 0.7% 25.9% 100.0%
Stafford Ctr Count 2,909 1,754 1,440 124 50 1,778 8,055Row % 36.1% 21.8% 17.9% 1.5% 0.6% 22.1% 100.0%
Missouri City Ctr Count 2 0 1 0 0 3 6Row % 33.3% 0.0% 16.7% 0.0% 0.0% 50.0% 100.0%
West Loop Ctr Count 1,582 850 611 51 28 1,000 4,122Row % 38.4% 20.6% 14.8% 1.2% 0.7% 24.3% 100.0%
Distance Ed.-SW Count 0 0 0 1 0 0 1Row % 0.0% 0.0% 0.0% 100.0% 0.0% 0.0% 100.0%
System ACT/CONT Count 1 0 0 0 0 0 1Row % 100.0% 0.0% 0.0% 0.0% 0.0% 0.0% 100.0%
TP: Spring2008_library_means.xls 2 06-30-2008

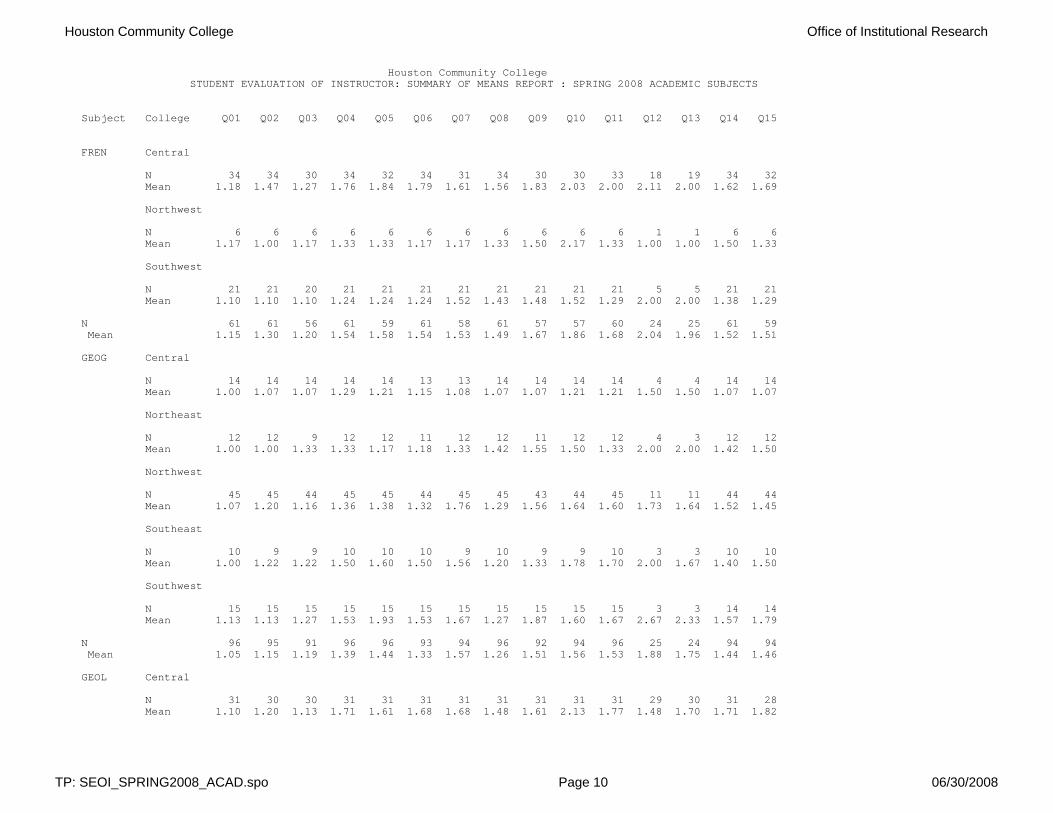
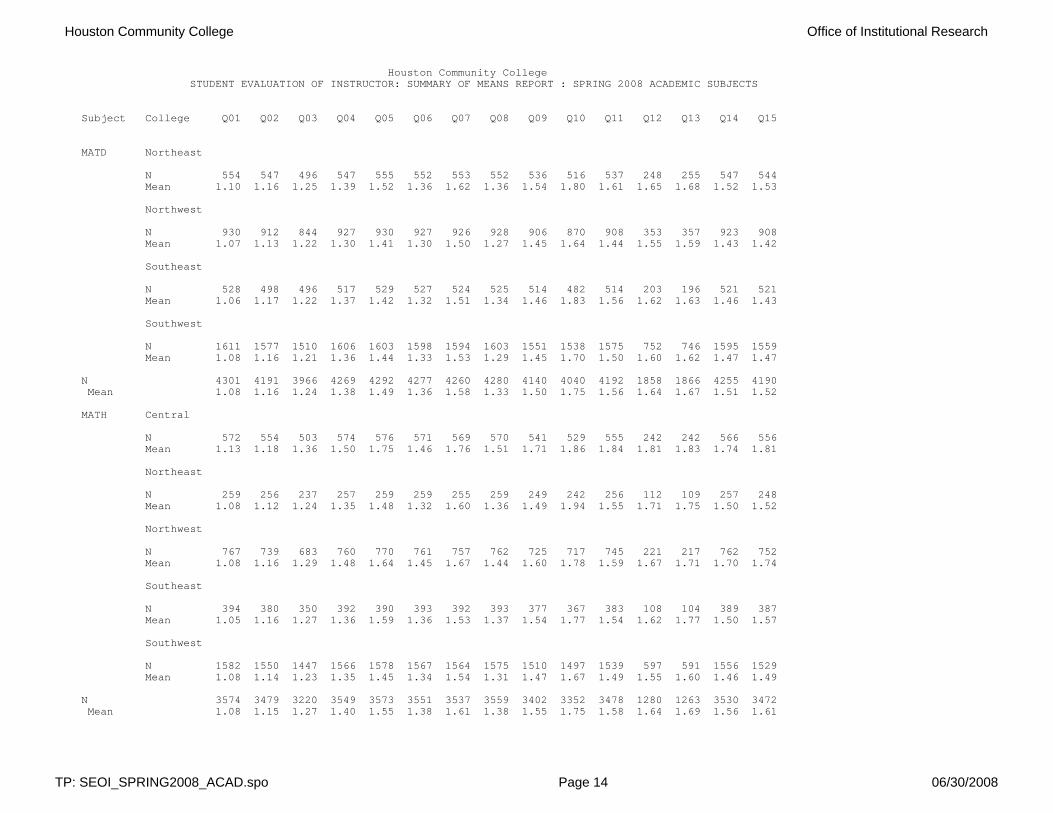
Houston Community College STUDENT EVALUATION OF INSTRUCTOR: SUMMARY OF MEANS REPORT : SPRING 2008 ACADEMIC SUBJECTS
Subject College Q01 Q02 Q03 Q04 Q05 Q06 Q07 Q08 Q09 Q10 Q11 Q12 Q13 Q14 Q15
ANTH Central
N 47 47 44 47 47 47 46 47 45 46 47 6 6 47 46 Mean 1.11 1.11 1.20 1.45 1.36 1.32 1.54 1.19 1.36 1.59 1.45 1.50 1.50 1.43 1.50
Northeast
N 22 22 21 22 22 22 22 22 21 21 21 5 5 22 21 Mean 1.09 1.05 1.05 1.41 1.23 1.36 1.64 1.23 1.14 2.29 1.24 1.00 1.20 1.27 1.24
Northwest
N 70 68 67 70 70 70 69 68 70 69 70 35 33 70 68 Mean 1.04 1.07 1.06 1.34 1.41 1.30 1.52 1.19 1.40 1.52 1.41 1.46 1.42 1.37 1.46
Southeast
N 11 11 11 11 11 11 11 11 11 11 11 1 1 10 10 Mean 1.09 1.18 1.36 1.18 1.27 1.18 1.36 1.09 1.27 1.64 1.27 1.00 1.00 1.50 1.20
Southwest
N 58 57 55 57 58 58 57 55 55 57 58 41 41 57 56 Mean 1.09 1.11 1.15 1.32 1.40 1.36 1.53 1.40 1.53 1.60 1.57 1.56 1.49 1.37 1.39
N 208 205 198 207 208 208 205 203 202 204 207 88 86 206 201 Mean 1.08 1.09 1.13 1.36 1.37 1.32 1.53 1.25 1.39 1.64 1.44 1.48 1.44 1.38 1.41
ARAB Northwest
N 18 17 15 18 17 18 18 18 18 14 16 7 7 18 18 Mean 1.22 1.71 1.73 2.11 2.06 1.78 1.89 2.06 1.72 1.86 1.81 1.86 1.71 1.89 2.22
N 18 17 15 18 17 18 18 18 18 14 16 7 7 18 18 Mean 1.22 1.71 1.73 2.11 2.06 1.78 1.89 2.06 1.72 1.86 1.81 1.86 1.71 1.89 2.22
ARTS Central
N 460 420 423 442 460 459 452 458 437 434 454 224 221 458 448 Mean 1.07 1.22 1.20 1.42 1.44 1.36 1.52 1.37 1.52 1.67 1.50 1.51 1.54 1.46 1.47
Northeast
N 90 89 83 90 90 90 90 90 88 86 89 41 39 89 87 Mean 1.06 1.11 1.16 1.28 1.40 1.24 1.43 1.28 1.36 1.59 1.38 1.46 1.38 1.37 1.31
Northwest
N 324 306 303 311 325 320 320 324 302 308 315 84 86 323 320 Mean 1.10 1.12 1.21 1.43 1.50 1.43 1.62 1.37 1.50 1.75 1.55 1.61 1.69 1.52 1.58
Houston Community College Office of Institutional Research
TP: SEOI_SPRING2008_ACAD.spo Page 1 06/30/2008

Houston Community College STUDENT EVALUATION OF INSTRUCTOR: SUMMARY OF MEANS REPORT : SPRING 2008 ACADEMIC SUBJECTS
Subject College Q01 Q02 Q03 Q04 Q05 Q06 Q07 Q08 Q09 Q10 Q11 Q12 Q13 Q14 Q15
ARTS Southeast
N 169 166 161 163 169 168 165 169 165 158 167 62 59 169 165 Mean 1.10 1.05 1.19 1.52 1.44 1.36 1.58 1.31 1.45 1.84 1.54 1.55 1.56 1.47 1.41
Southwest
N 438 416 412 431 433 428 431 431 416 410 425 199 190 430 416 Mean 1.07 1.11 1.18 1.39 1.49 1.35 1.61 1.35 1.54 1.75 1.55 1.64 1.65 1.53 1.56
N 1481 1397 1382 1437 1477 1465 1458 1472 1408 1396 1450 610 595 1469 1436 Mean 1.08 1.14 1.19 1.41 1.47 1.37 1.57 1.35 1.50 1.72 1.52 1.57 1.59 1.49 1.50
ASTR Central
N 12 9 11 12 12 12 12 11 10 12 12 3 3 12 12 Mean 1.17 1.44 1.09 1.58 2.08 1.50 1.58 1.09 1.30 2.17 1.92 1.67 1.67 1.92 1.75
Northwest
N 18 18 18 18 18 18 18 18 16 16 18 6 6 18 18 Mean 1.22 1.17 1.17 1.72 1.72 1.56 1.78 1.72 1.81 1.88 1.67 2.33 2.17 1.67 1.78
Southeast
N 4 3 3 4 4 3 4 4 4 4 4 1 1 4 4 Mean 1.75 1.00 2.00 2.25 3.50 1.67 3.25 1.25 2.50 3.25 2.75 3.00 3.00 3.00 3.50
N 34 30 32 34 34 33 34 33 30 32 34 10 10 34 34 Mean 1.26 1.23 1.22 1.74 2.06 1.55 1.88 1.45 1.73 2.16 1.88 2.20 2.10 1.91 1.97
BCIS Central
N 87 84 82 87 87 87 86 87 86 84 86 33 31 83 82 Mean 1.06 1.04 1.09 1.24 1.34 1.24 1.27 1.23 1.36 1.55 1.34 1.36 1.39 1.30 1.33
Northwest
N 98 98 94 98 97 97 97 98 91 95 96 45 46 97 97 Mean 1.10 1.15 1.16 1.40 1.55 1.32 1.53 1.24 1.40 1.55 1.55 1.47 1.43 1.48 1.48
Southwest
N 95 92 92 95 95 93 94 94 89 90 92 56 55 93 91 Mean 1.08 1.21 1.21 1.42 1.39 1.37 1.67 1.36 1.46 1.62 1.60 1.57 1.53 1.49 1.60
N 280 274 268 280 279 277 277 279 266 269 274 134 132 273 270 Mean 1.08 1.14 1.15 1.36 1.43 1.31 1.49 1.28 1.41 1.57 1.50 1.49 1.46 1.43 1.48
BIOL Central
N 758 722 706 747 757 753 747 756 725 721 751 527 522 754 741
Houston Community College Office of Institutional Research
TP: SEOI_SPRING2008_ACAD.spo Page 2 06/30/2008

Houston Community College STUDENT EVALUATION OF INSTRUCTOR: SUMMARY OF MEANS REPORT : SPRING 2008 ACADEMIC SUBJECTS
Subject College Q01 Q02 Q03 Q04 Q05 Q06 Q07 Q08 Q09 Q10 Q11 Q12 Q13 Q14 Q15
Mean 1.09 1.18 1.22 1.47 1.53 1.43 1.65 1.38 1.57 1.67 1.55 1.46 1.54 1.54 1.62
BIOL Coleman
N 53 51 48 52 53 51 52 53 51 52 51 39 39 53 51 Mean 1.08 1.10 1.08 1.46 1.53 1.43 1.52 1.28 1.51 1.54 1.51 1.44 1.54 1.43 1.51
Northeast
N 501 497 474 501 499 500 500 499 491 485 499 377 373 500 490 Mean 1.05 1.12 1.15 1.29 1.29 1.29 1.44 1.26 1.36 1.64 1.45 1.29 1.33 1.35 1.34
Northwest
N 865 846 804 864 865 857 856 861 827 829 849 629 624 854 839 Mean 1.11 1.17 1.24 1.45 1.60 1.45 1.70 1.46 1.54 1.71 1.60 1.55 1.57 1.54 1.59
Southeast
N 592 583 549 591 587 584 584 589 575 548 577 540 534 584 573 Mean 1.06 1.08 1.19 1.42 1.49 1.34 1.59 1.31 1.43 1.71 1.44 1.33 1.37 1.41 1.45
Southwest
N 958 927 897 949 955 941 952 946 907 908 941 635 633 943 927 Mean 1.17 1.17 1.30 1.62 1.85 1.58 1.86 1.50 1.65 1.85 1.74 1.78 1.83 1.71 1.89
N 3727 3626 3478 3704 3716 3686 3691 3704 3576 3543 3668 2747 2725 3688 3621 Mean 1.11 1.15 1.23 1.47 1.59 1.44 1.68 1.40 1.53 1.73 1.58 1.50 1.55 1.53 1.62
CHEM Central
N 273 268 238 274 274 263 271 272 258 261 264 239 238 270 269 Mean 1.19 1.21 1.32 1.51 1.85 1.60 1.77 1.44 1.65 1.97 1.71 1.47 1.70 1.76 1.84
Northeast
N 76 71 70 75 74 73 74 75 72 70 74 60 60 76 74 Mean 1.04 1.14 1.21 1.41 1.59 1.33 1.70 1.21 1.35 1.66 1.32 1.27 1.35 1.47 1.51
Northwest
N 381 360 346 377 380 380 380 379 368 366 370 301 304 376 369 Mean 1.08 1.13 1.20 1.43 1.62 1.43 1.68 1.39 1.49 1.72 1.59 1.47 1.59 1.57 1.59
Southeast
N 115 112 110 116 116 115 114 113 110 109 113 115 113 115 112 Mean 1.12 1.21 1.25 1.44 1.97 1.50 1.70 1.73 1.68 1.71 1.62 1.47 1.62 1.77 1.86
Southwest
N 473 450 437 462 472 468 468 467 457 446 463 357 345 463 448
Houston Community College Office of Institutional Research
TP: SEOI_SPRING2008_ACAD.spo Page 3 06/30/2008

Houston Community College STUDENT EVALUATION OF INSTRUCTOR: SUMMARY OF MEANS REPORT : SPRING 2008 ACADEMIC SUBJECTS
Subject College Q01 Q02 Q03 Q04 Q05 Q06 Q07 Q08 Q09 Q10 Q11 Q12 Q13 Q14 Q15
Mean 1.09 1.21 1.22 1.54 1.65 1.49 1.69 1.44 1.60 1.79 1.63 1.41 1.55 1.68 1.70
N 1318 1261 1201 1304 1316 1299 1307 1306 1265 1252 1284 1072 1060 1300 1272 Mean 1.11 1.18 1.24 1.49 1.71 1.49 1.71 1.44 1.57 1.79 1.62 1.44 1.59 1.66 1.70
CHIN Central
N 5 5 5 5 5 5 5 5 5 5 5 5 5 5 5 Mean 1.00 1.00 1.00 1.40 1.40 1.40 1.40 1.40 1.40 2.20 1.40 1.40 1.40 1.40 1.40
N 5 5 5 5 5 5 5 5 5 5 5 5 5 5 5 Mean 1.00 1.00 1.00 1.40 1.40 1.40 1.40 1.40 1.40 2.20 1.40 1.40 1.40 1.40 1.40
COMM Central
N 43 41 40 42 42 42 43 43 42 39 42 22 21 43 43 Mean 1.19 1.17 1.20 1.62 1.57 1.52 1.86 1.53 1.79 1.56 1.64 1.73 1.86 1.49 1.72
Northwest
N 33 30 34 32 34 34 33 34 33 32 32 13 13 34 32 Mean 1.09 1.20 1.18 1.44 1.53 1.50 1.76 1.44 1.52 1.84 1.53 1.62 1.62 1.47 1.66
Southwest
N 51 50 50 50 51 50 50 51 49 50 51 20 20 51 49 Mean 1.08 1.12 1.18 1.68 1.61 1.56 1.76 1.31 1.45 1.66 1.59 1.50 1.55 1.59 1.55
N 127 121 124 124 127 126 126 128 124 121 125 55 54 128 124 Mean 1.12 1.16 1.19 1.60 1.57 1.53 1.79 1.42 1.58 1.68 1.59 1.62 1.69 1.52 1.64
COSC Central
N 39 37 37 39 39 39 39 38 38 39 39 21 22 39 39 Mean 1.08 1.16 1.22 1.72 1.85 1.74 1.82 1.71 1.92 1.92 1.87 1.95 1.91 1.92 1.87
Northwest
N 26 26 24 26 26 26 25 26 24 24 25 14 15 26 26 Mean 1.12 1.08 1.21 1.50 1.50 1.42 1.52 1.65 1.71 1.33 1.68 1.64 1.67 1.58 1.77
Southwest
N 37 36 35 35 37 37 35 37 33 36 35 27 27 37 36 Mean 1.19 1.25 1.23 1.49 1.62 1.54 1.80 1.38 1.42 1.75 1.46 1.70 1.67 1.78 1.78
N 102 99 96 100 102 102 99 101 95 99 99 62 64 102 101 Mean 1.13 1.17 1.22 1.58 1.68 1.59 1.74 1.57 1.69 1.72 1.68 1.77 1.75 1.78 1.81
CRIJ Central
N 14 14 14 14 14 14 14 14 14 14 14 14 14 14 14 Mean 1.00 1.07 1.07 1.21 1.07 1.14 1.21 1.07 1.07 1.57 1.14 1.21 1.21 1.07 1.21
Houston Community College Office of Institutional Research
TP: SEOI_SPRING2008_ACAD.spo Page 4 06/30/2008

Houston Community College STUDENT EVALUATION OF INSTRUCTOR: SUMMARY OF MEANS REPORT : SPRING 2008 ACADEMIC SUBJECTS
Subject College Q01 Q02 Q03 Q04 Q05 Q06 Q07 Q08 Q09 Q10 Q11 Q12 Q13 Q14 Q15
CRIJ Northeast
N 19 19 18 19 19 18 19 19 19 19 19 8 8 19 18 Mean 1.21 1.21 1.39 1.47 1.42 1.50 1.47 1.21 1.26 1.68 1.47 1.63 1.63 1.58 1.39
Northwest
N 35 32 34 35 35 35 35 35 33 34 35 10 10 35 35 Mean 1.09 1.19 1.24 1.34 1.34 1.37 1.51 1.20 1.27 1.56 1.34 2.00 2.10 1.54 1.40
Southeast
N 17 17 16 17 17 17 17 17 17 17 17 9 9 17 17 Mean 1.06 1.06 1.44 1.29 1.35 1.24 1.94 1.18 1.35 2.18 1.47 1.22 1.33 1.35 1.41
Southwest
N 75 75 70 70 75 73 74 74 74 73 74 32 30 73 71 Mean 1.05 1.05 1.14 1.36 1.39 1.34 1.57 1.22 1.49 1.58 1.49 1.69 1.53 1.40 1.44
N 160 157 152 155 160 157 159 159 157 157 159 73 71 158 155 Mean 1.08 1.10 1.22 1.35 1.35 1.34 1.55 1.19 1.36 1.65 1.42 1.58 1.54 1.42 1.40
DANC Central
N 103 76 98 99 104 103 102 104 100 98 100 60 55 103 101 Mean 1.13 1.28 1.22 1.59 1.44 1.44 1.55 1.38 1.46 1.84 1.59 1.60 1.69 1.50 1.57
Northwest
N 52 46 42 52 52 51 52 52 47 48 52 24 23 51 49 Mean 1.02 1.20 1.21 1.44 1.42 1.39 1.63 1.23 1.34 1.58 1.62 1.67 1.78 1.47 1.43
N 155 122 140 151 156 154 154 156 147 146 152 84 78 154 150 Mean 1.09 1.25 1.22 1.54 1.44 1.42 1.58 1.33 1.42 1.75 1.60 1.62 1.72 1.49 1.53
DRAM Central
N 45 44 43 43 45 45 44 45 44 42 43 27 27 45 44 Mean 1.02 1.16 1.09 1.35 1.20 1.20 1.30 1.13 1.36 1.60 1.33 1.52 1.44 1.31 1.30
Northeast
N 7 7 7 7 6 7 7 7 7 7 7 7 7 7 7 Mean 1.14 1.57 1.43 1.71 2.33 2.14 1.86 1.14 1.43 1.57 1.71 1.71 1.71 1.86 1.86
Northwest
N 58 52 51 54 58 57 58 56 54 54 56 17 17 56 55 Mean 1.16 1.27 1.33 1.74 1.78 1.58 1.86 1.45 1.70 1.81 1.88 1.71 1.65 1.55 1.71
Houston Community College Office of Institutional Research
TP: SEOI_SPRING2008_ACAD.spo Page 5 06/30/2008

Houston Community College STUDENT EVALUATION OF INSTRUCTOR: SUMMARY OF MEANS REPORT : SPRING 2008 ACADEMIC SUBJECTS
Subject College Q01 Q02 Q03 Q04 Q05 Q06 Q07 Q08 Q09 Q10 Q11 Q12 Q13 Q14 Q15
DRAM Southwest
N 51 43 44 50 51 51 51 51 49 49 51 17 16 50 49 Mean 1.06 1.21 1.23 1.38 1.47 1.35 1.63 1.29 1.51 1.73 1.51 1.71 1.88 1.64 1.57
N 161 146 145 154 160 160 160 159 154 152 157 68 67 158 155 Mean 1.09 1.23 1.23 1.51 1.54 1.43 1.63 1.30 1.53 1.72 1.60 1.63 1.63 1.53 1.55
ECON Central
N 97 96 91 96 95 95 96 96 92 92 94 25 26 95 94 Mean 1.12 1.18 1.25 1.55 1.68 1.49 1.65 1.51 1.65 1.80 1.81 1.84 1.65 1.73 1.76
Northeast
N 69 62 63 65 68 68 65 69 68 58 66 31 31 69 67 Mean 1.13 1.32 1.30 1.57 1.41 1.35 1.60 1.29 1.38 1.62 1.45 1.45 1.45 1.45 1.45
Northwest
N 247 241 207 246 246 241 241 246 224 231 242 77 68 243 238 Mean 1.15 1.32 1.32 1.57 1.63 1.57 1.83 1.41 1.55 1.64 1.64 1.57 1.57 1.56 1.69
Southeast
N 63 60 53 63 62 62 62 62 61 59 62 27 25 61 58 Mean 1.11 1.22 1.32 1.52 1.69 1.45 1.77 1.44 1.46 1.85 1.55 1.67 1.60 1.46 1.69
Southwest
N 422 411 387 424 421 419 423 422 405 405 412 170 166 417 405 Mean 1.14 1.27 1.33 1.51 1.61 1.47 1.67 1.44 1.55 1.78 1.65 1.62 1.67 1.60 1.67
N 898 870 801 894 892 885 887 895 850 845 876 330 316 885 862 Mean 1.14 1.27 1.32 1.53 1.62 1.49 1.71 1.43 1.54 1.74 1.64 1.62 1.62 1.58 1.67
EDUC Central
N 26 26 26 26 26 26 26 26 26 24 26 12 13 26 25 Mean 1.00 1.04 1.00 1.19 1.04 1.15 1.27 1.08 1.27 1.38 1.23 1.08 1.23 1.19 1.16
Northeast
N 30 30 26 30 30 30 30 30 28 29 30 9 8 30 28 Mean 1.07 1.23 1.19 1.50 1.40 1.43 2.13 1.43 1.39 1.72 1.47 1.22 1.13 1.33 1.29
Northwest
N 29 29 28 29 29 29 29 29 29 29 29 16 16 29 28 Mean 1.03 1.03 1.21 1.66 1.59 1.66 1.66 1.48 1.62 1.93 1.83 2.00 1.88 1.83 1.71
Houston Community College Office of Institutional Research
TP: SEOI_SPRING2008_ACAD.spo Page 6 06/30/2008

Houston Community College STUDENT EVALUATION OF INSTRUCTOR: SUMMARY OF MEANS REPORT : SPRING 2008 ACADEMIC SUBJECTS
Subject College Q01 Q02 Q03 Q04 Q05 Q06 Q07 Q08 Q09 Q10 Q11 Q12 Q13 Q14 Q15
EDUC Southeast
N 21 19 19 21 21 21 21 21 21 21 19 16 16 21 21 Mean 1.00 1.00 1.00 1.14 1.14 1.10 1.14 1.10 1.14 1.19 1.11 1.19 1.25 1.14 1.10
Southwest
N 56 55 54 56 55 55 54 55 55 55 55 21 19 56 53 Mean 1.04 1.11 1.07 1.23 1.18 1.15 1.31 1.09 1.27 1.69 1.22 1.29 1.32 1.20 1.19
N 162 159 153 162 161 161 160 161 159 158 159 74 72 162 155 Mean 1.03 1.09 1.10 1.34 1.27 1.29 1.50 1.22 1.34 1.63 1.36 1.38 1.39 1.33 1.28
ENGD Central
N 207 204 197 198 205 205 205 208 196 192 202 95 95 206 201 Mean 1.07 1.12 1.20 1.36 1.37 1.39 1.53 1.25 1.38 1.73 1.50 1.56 1.66 1.41 1.41
Northeast
N 135 132 127 133 136 136 133 135 135 127 131 50 51 135 129 Mean 1.11 1.15 1.24 1.45 1.48 1.41 1.56 1.39 1.52 1.83 1.53 1.84 1.69 1.57 1.57
Northwest
N 156 142 155 150 158 159 153 157 156 146 153 73 74 157 153 Mean 1.07 1.23 1.20 1.53 1.53 1.47 1.67 1.42 1.54 1.71 1.65 1.58 1.57 1.55 1.60
Southeast
N 168 166 149 166 164 162 166 167 162 151 164 76 77 166 158 Mean 1.08 1.20 1.28 1.49 1.61 1.44 1.59 1.44 1.58 1.89 1.68 1.68 1.82 1.49 1.58
Southwest
N 417 393 385 413 415 412 405 413 400 391 404 202 199 416 407 Mean 1.08 1.20 1.19 1.46 1.45 1.41 1.58 1.35 1.48 1.70 1.50 1.57 1.55 1.48 1.45
N 1083 1037 1013 1060 1078 1074 1062 1080 1049 1007 1054 496 496 1080 1048 Mean 1.08 1.18 1.22 1.46 1.47 1.42 1.58 1.36 1.49 1.75 1.56 1.61 1.63 1.49 1.50
ENGF Central
N 282 265 262 274 281 280 280 281 275 268 276 143 140 274 272 Mean 1.14 1.23 1.25 1.51 1.56 1.51 1.67 1.51 1.60 1.75 1.59 1.80 1.85 1.61 1.71
Northwest
N 92 87 85 88 92 92 92 92 90 87 90 54 53 90 89 Mean 1.16 1.15 1.26 1.45 1.40 1.42 1.46 1.35 1.47 1.57 1.57 1.43 1.51 1.51 1.48
Houston Community College Office of Institutional Research
TP: SEOI_SPRING2008_ACAD.spo Page 7 06/30/2008

Houston Community College STUDENT EVALUATION OF INSTRUCTOR: SUMMARY OF MEANS REPORT : SPRING 2008 ACADEMIC SUBJECTS
Subject College Q01 Q02 Q03 Q04 Q05 Q06 Q07 Q08 Q09 Q10 Q11 Q12 Q13 Q14 Q15
ENGF Southwest
N 393 382 377 390 393 387 393 389 373 372 380 207 209 392 378 Mean 1.17 1.21 1.32 1.58 1.61 1.54 1.75 1.45 1.62 1.80 1.67 1.65 1.73 1.68 1.72
N 767 734 724 752 766 759 765 762 738 727 746 404 402 756 739 Mean 1.16 1.21 1.29 1.54 1.57 1.51 1.69 1.46 1.60 1.75 1.62 1.67 1.74 1.63 1.69
ENGL Central
N 852 820 792 828 858 853 844 854 827 801 834 374 369 846 821 Mean 1.15 1.15 1.23 1.48 1.52 1.44 1.68 1.47 1.56 1.81 1.70 1.74 1.77 1.58 1.64
Northeast
N 339 330 315 333 338 337 336 338 322 316 330 143 137 335 330 Mean 1.11 1.14 1.24 1.40 1.49 1.40 1.58 1.37 1.49 1.91 1.58 1.59 1.60 1.48 1.49
Northwest
N 1002 959 940 953 995 990 975 992 949 933 972 290 286 996 980 Mean 1.08 1.15 1.20 1.44 1.46 1.35 1.65 1.39 1.48 1.74 1.57 1.57 1.58 1.48 1.57
Southeast
N 468 463 451 459 462 464 459 463 452 438 458 182 176 466 453 Mean 1.13 1.14 1.20 1.49 1.47 1.39 1.56 1.35 1.45 1.84 1.58 1.75 1.79 1.47 1.53
Southwest
N 1541 1499 1434 1514 1539 1532 1519 1523 1484 1451 1515 639 624 1523 1487 Mean 1.10 1.17 1.22 1.44 1.55 1.42 1.65 1.37 1.47 1.76 1.58 1.63 1.63 1.53 1.58
N 4202 4071 3932 4087 4192 4176 4133 4170 4034 3939 4109 1628 1592 4166 4071 Mean 1.11 1.16 1.21 1.45 1.51 1.40 1.64 1.39 1.49 1.79 1.60 1.65 1.67 1.52 1.58
ENGR Central
N 3 3 2 3 3 3 3 3 3 3 3 0 0 3 3 Mean 1.33 1.67 2.00 1.67 2.33 1.33 2.67 1.33 2.00 1.67 1.67 . . 2.67 3.00
Northwest
N 12 11 12 12 14 13 12 14 14 13 13 2 1 13 13 Mean 1.17 1.64 1.33 2.00 1.71 1.77 1.42 1.43 1.43 1.77 2.00 2.00 2.00 1.38 1.46
Southwest
N 53 51 48 47 52 52 52 52 52 50 52 25 25 53 51 Mean 1.09 1.12 1.25 1.36 1.60 1.44 1.63 1.33 1.52 1.94 1.52 1.56 1.64 1.53 1.49
N 68 65 62 62 69 68 67 69 69 66 68 27 26 69 67
Houston Community College Office of Institutional Research
TP: SEOI_SPRING2008_ACAD.spo Page 8 06/30/2008

Houston Community College STUDENT EVALUATION OF INSTRUCTOR: SUMMARY OF MEANS REPORT : SPRING 2008 ACADEMIC SUBJECTS
Subject College Q01 Q02 Q03 Q04 Q05 Q06 Q07 Q08 Q09 Q10 Q11 Q12 Q13 Q14 Q15
Mean 1.12 1.23 1.29 1.50 1.65 1.50 1.64 1.35 1.52 1.89 1.62 1.59 1.65 1.55 1.55
ENVR Central
N 66 64 57 66 66 66 65 65 60 63 65 30 28 65 63 Mean 1.12 1.20 1.28 1.45 1.59 1.65 1.78 1.43 1.50 1.90 1.60 1.63 1.86 1.75 1.68
Northwest
N 42 41 42 42 41 42 42 42 41 41 42 23 22 42 42 Mean 1.14 1.17 1.50 1.71 2.02 1.76 1.90 1.43 1.68 1.83 1.76 2.09 2.00 1.90 2.07
Southeast
N 24 24 23 24 24 24 24 24 22 22 23 4 4 24 24 Mean 1.08 1.04 1.22 1.38 1.92 1.38 1.63 1.29 1.73 1.50 1.74 2.25 2.25 1.67 1.79
Southwest
N 103 102 92 102 103 102 103 103 99 98 102 54 55 103 97 Mean 1.18 1.25 1.33 1.73 1.84 1.63 2.02 1.63 1.80 1.98 1.83 1.72 1.80 1.76 2.09
N 235 231 214 234 234 234 234 234 222 224 232 111 109 234 226 Mean 1.15 1.20 1.34 1.61 1.81 1.63 1.89 1.50 1.69 1.88 1.75 1.79 1.87 1.77 1.94
ESOL Central
N 526 516 498 517 524 517 518 522 513 496 506 356 360 518 499 Mean 1.13 1.19 1.26 1.48 1.52 1.47 1.59 1.44 1.53 1.69 1.54 1.64 1.67 1.57 1.57
Northeast
N 335 332 304 338 337 334 335 337 331 325 334 126 118 327 321 Mean 1.13 1.17 1.29 1.51 1.49 1.48 1.59 1.39 1.52 1.70 1.55 1.75 1.87 1.56 1.58
Northwest
N 304 289 285 295 301 298 299 300 299 294 295 242 237 298 288 Mean 1.16 1.15 1.20 1.58 1.55 1.56 1.64 1.47 1.51 1.65 1.56 1.62 1.62 1.64 1.67
Southeast
N 437 433 421 435 438 434 436 434 427 429 423 297 308 429 410 Mean 1.12 1.17 1.25 1.46 1.41 1.55 1.61 1.49 1.53 1.55 1.59 1.51 1.61 1.54 1.55
Southwest
N 1996 1968 1944 1986 1987 1974 1979 1980 1936 1926 1954 793 746 1914 1851 Mean 1.15 1.20 1.26 1.43 1.44 1.50 1.54 1.39 1.46 1.50 1.52 1.75 1.67 1.51 1.52
N 3598 3538 3452 3571 3587 3557 3567 3573 3506 3470 3512 1814 1769 3486 3369 Mean 1.14 1.19 1.26 1.46 1.46 1.51 1.57 1.42 1.49 1.57 1.54 1.67 1.67 1.54 1.55
Houston Community College Office of Institutional Research
TP: SEOI_SPRING2008_ACAD.spo Page 9 06/30/2008
Houston Community College STUDENT EVALUATION OF INSTRUCTOR: SUMMARY OF MEANS REPORT : SPRING 2008 ACADEMIC SUBJECTS
Subject College Q01 Q02 Q03 Q04 Q05 Q06 Q07 Q08 Q09 Q10 Q11 Q12 Q13 Q14 Q15
FREN Central
N 34 34 30 34 32 34 31 34 30 30 33 18 19 34 32 Mean 1.18 1.47 1.27 1.76 1.84 1.79 1.61 1.56 1.83 2.03 2.00 2.11 2.00 1.62 1.69
Northwest
N 6 6 6 6 6 6 6 6 6 6 6 1 1 6 6 Mean 1.17 1.00 1.17 1.33 1.33 1.17 1.17 1.33 1.50 2.17 1.33 1.00 1.00 1.50 1.33
Southwest
N 21 21 20 21 21 21 21 21 21 21 21 5 5 21 21 Mean 1.10 1.10 1.10 1.24 1.24 1.24 1.52 1.43 1.48 1.52 1.29 2.00 2.00 1.38 1.29
N 61 61 56 61 59 61 58 61 57 57 60 24 25 61 59 Mean 1.15 1.30 1.20 1.54 1.58 1.54 1.53 1.49 1.67 1.86 1.68 2.04 1.96 1.52 1.51
GEOG Central
N 14 14 14 14 14 13 13 14 14 14 14 4 4 14 14 Mean 1.00 1.07 1.07 1.29 1.21 1.15 1.08 1.07 1.07 1.21 1.21 1.50 1.50 1.07 1.07
Northeast
N 12 12 9 12 12 11 12 12 11 12 12 4 3 12 12 Mean 1.00 1.00 1.33 1.33 1.17 1.18 1.33 1.42 1.55 1.50 1.33 2.00 2.00 1.42 1.50
Northwest
N 45 45 44 45 45 44 45 45 43 44 45 11 11 44 44 Mean 1.07 1.20 1.16 1.36 1.38 1.32 1.76 1.29 1.56 1.64 1.60 1.73 1.64 1.52 1.45
Southeast
N 10 9 9 10 10 10 9 10 9 9 10 3 3 10 10 Mean 1.00 1.22 1.22 1.50 1.60 1.50 1.56 1.20 1.33 1.78 1.70 2.00 1.67 1.40 1.50
Southwest
N 15 15 15 15 15 15 15 15 15 15 15 3 3 14 14 Mean 1.13 1.13 1.27 1.53 1.93 1.53 1.67 1.27 1.87 1.60 1.67 2.67 2.33 1.57 1.79
N 96 95 91 96 96 93 94 96 92 94 96 25 24 94 94 Mean 1.05 1.15 1.19 1.39 1.44 1.33 1.57 1.26 1.51 1.56 1.53 1.88 1.75 1.44 1.46
GEOL Central
N 31 30 30 31 31 31 31 31 31 31 31 29 30 31 28 Mean 1.10 1.20 1.13 1.71 1.61 1.68 1.68 1.48 1.61 2.13 1.77 1.48 1.70 1.71 1.82
Houston Community College Office of Institutional Research
TP: SEOI_SPRING2008_ACAD.spo Page 10 06/30/2008

Houston Community College STUDENT EVALUATION OF INSTRUCTOR: SUMMARY OF MEANS REPORT : SPRING 2008 ACADEMIC SUBJECTS
Subject College Q01 Q02 Q03 Q04 Q05 Q06 Q07 Q08 Q09 Q10 Q11 Q12 Q13 Q14 Q15
GEOL Northwest
N 77 76 75 77 77 77 77 76 73 70 76 55 63 77 76 Mean 1.03 1.08 1.04 1.42 1.44 1.27 1.57 1.20 1.44 1.46 1.55 1.62 1.46 1.49 1.43
Southeast
N 14 14 13 14 13 14 14 14 13 14 14 14 14 14 14 Mean 1.43 1.36 1.54 1.71 2.15 2.07 1.93 1.71 2.00 2.29 2.07 1.71 1.93 2.14 1.93
Southwest
N 100 99 95 100 100 100 100 100 93 96 100 48 46 98 96 Mean 1.17 1.26 1.28 1.49 1.60 1.41 1.75 1.40 1.39 1.89 1.56 1.75 1.74 1.50 1.55
N 222 219 213 222 221 222 222 221 210 211 221 146 153 220 214 Mean 1.13 1.20 1.19 1.51 1.58 1.44 1.69 1.36 1.48 1.81 1.62 1.64 1.63 1.57 1.57
GERM Central
N 9 9 9 9 9 9 9 9 9 9 8 4 4 9 9 Mean 1.00 1.44 1.33 1.33 1.44 1.44 1.44 1.44 1.67 1.89 1.50 2.50 2.50 1.44 1.33
N 9 9 9 9 9 9 9 9 9 9 8 4 4 9 9 Mean 1.00 1.44 1.33 1.33 1.44 1.44 1.44 1.44 1.67 1.89 1.50 2.50 2.50 1.44 1.33
GOVT Central
N 520 503 455 515 517 513 516 513 482 496 503 212 203 514 497 Mean 1.14 1.17 1.30 1.51 1.64 1.53 1.71 1.49 1.62 1.83 1.70 1.73 1.78 1.59 1.66
Northeast
N 165 163 152 163 162 163 163 162 156 155 158 76 72 161 161 Mean 1.13 1.20 1.26 1.44 1.47 1.45 1.63 1.44 1.52 1.90 1.53 1.67 1.64 1.60 1.67
Northwest
N 605 589 544 601 605 598 601 604 566 571 588 152 144 594 584 Mean 1.11 1.21 1.25 1.54 1.59 1.46 1.78 1.40 1.58 1.77 1.60 1.72 1.68 1.57 1.65
Southeast
N 278 266 267 278 278 279 278 277 269 258 276 87 85 278 272 Mean 1.05 1.09 1.16 1.34 1.35 1.34 1.53 1.34 1.45 1.78 1.51 1.43 1.42 1.34 1.36
Southwest
N 1223 1198 1137 1220 1219 1204 1210 1216 1164 1159 1200 421 408 1212 1183 Mean 1.09 1.18 1.24 1.45 1.49 1.43 1.66 1.37 1.54 1.77 1.60 1.60 1.65 1.57 1.59
N 2791 2719 2555 2777 2781 2757 2768 2772 2637 2639 2725 948 912 2759 2697
Houston Community College Office of Institutional Research
TP: SEOI_SPRING2008_ACAD.spo Page 11 06/30/2008

Houston Community College STUDENT EVALUATION OF INSTRUCTOR: SUMMARY OF MEANS REPORT : SPRING 2008 ACADEMIC SUBJECTS
Subject College Q01 Q02 Q03 Q04 Q05 Q06 Q07 Q08 Q09 Q10 Q11 Q12 Q13 Q14 Q15
Mean 1.10 1.18 1.24 1.47 1.52 1.45 1.68 1.40 1.55 1.79 1.61 1.64 1.66 1.55 1.60
GUST Central
N 525 500 504 506 523 521 521 517 514 506 512 346 340 513 495 Mean 1.15 1.20 1.28 1.45 1.48 1.49 1.60 1.42 1.54 1.72 1.59 1.63 1.71 1.50 1.57
Northeast
N 292 278 280 285 290 291 289 291 282 274 289 157 159 292 278 Mean 1.10 1.28 1.24 1.44 1.46 1.43 1.55 1.47 1.60 1.74 1.54 1.50 1.53 1.54 1.50
Northwest
N 515 506 489 512 514 513 510 513 492 486 502 251 247 515 501 Mean 1.11 1.13 1.23 1.43 1.48 1.43 1.58 1.33 1.48 1.66 1.51 1.62 1.70 1.49 1.53
Southeast
N 182 179 172 182 183 181 178 182 180 170 177 101 102 181 175 Mean 1.10 1.09 1.23 1.57 1.63 1.49 1.63 1.47 1.54 1.77 1.62 1.68 1.77 1.55 1.64
Southwest
N 996 974 946 987 995 985 988 983 962 942 976 550 538 979 961 Mean 1.07 1.11 1.20 1.38 1.40 1.37 1.53 1.31 1.42 1.65 1.52 1.50 1.55 1.44 1.46
N 2510 2437 2391 2472 2505 2491 2486 2486 2430 2378 2456 1405 1386 2480 2410 Mean 1.10 1.15 1.23 1.43 1.46 1.42 1.57 1.36 1.49 1.69 1.54 1.57 1.63 1.48 1.52
HIST Central
N 641 621 594 640 642 635 639 638 619 611 630 261 254 634 624 Mean 1.08 1.19 1.22 1.38 1.38 1.39 1.58 1.30 1.45 1.74 1.48 1.55 1.60 1.46 1.44
Northeast
N 286 282 272 283 284 283 285 284 263 266 278 97 94 280 279 Mean 1.08 1.17 1.24 1.51 1.57 1.43 1.69 1.42 1.57 1.92 1.61 1.74 1.70 1.63 1.57
Northwest
N 820 798 753 810 816 808 814 811 760 765 795 202 195 809 798 Mean 1.09 1.27 1.28 1.57 1.56 1.49 1.83 1.42 1.57 1.84 1.65 1.61 1.68 1.61 1.75
Southeast
N 317 305 300 315 318 317 315 318 308 300 309 88 81 316 313 Mean 1.06 1.28 1.26 1.42 1.42 1.43 1.56 1.32 1.46 1.77 1.60 1.61 1.59 1.52 1.50
Southwest
N 1199 1133 1143 1191 1200 1194 1188 1199 1165 1145 1174 501 496 1186 1166
Houston Community College Office of Institutional Research
TP: SEOI_SPRING2008_ACAD.spo Page 12 06/30/2008

Houston Community College STUDENT EVALUATION OF INSTRUCTOR: SUMMARY OF MEANS REPORT : SPRING 2008 ACADEMIC SUBJECTS
Subject College Q01 Q02 Q03 Q04 Q05 Q06 Q07 Q08 Q09 Q10 Q11 Q12 Q13 Q14 Q15
Mean 1.11 1.21 1.21 1.46 1.49 1.47 1.66 1.39 1.51 1.76 1.58 1.59 1.67 1.55 1.60
N 3263 3139 3062 3239 3260 3237 3241 3250 3115 3087 3186 1149 1120 3225 3180 Mean 1.09 1.22 1.24 1.47 1.49 1.45 1.68 1.38 1.51 1.79 1.58 1.60 1.65 1.55 1.59
HUMA Central
N 29 29 28 29 29 29 29 27 26 28 28 9 9 27 27 Mean 1.07 1.00 1.04 1.28 1.38 1.31 1.41 1.52 1.62 2.00 1.54 1.89 1.67 1.48 1.44
Northeast
N 18 18 16 18 18 18 18 18 18 18 18 0 0 18 18 Mean 1.06 1.06 1.31 1.67 1.72 1.89 1.61 1.39 1.67 1.89 1.61 . . 1.72 1.94
Northwest
N 31 31 25 31 31 31 31 31 30 29 30 15 15 31 31 Mean 1.00 1.16 1.20 1.45 1.45 1.45 1.81 1.55 1.87 1.93 1.87 1.20 1.53 1.74 1.87
Southeast
N 10 10 10 10 10 10 10 9 9 10 10 2 1 10 9 Mean 1.20 1.40 1.40 1.50 1.80 1.70 1.70 1.11 1.33 1.40 1.80 3.50 2.00 1.60 1.22
Southwest
N 58 57 55 55 58 58 55 58 55 52 56 21 21 58 58 Mean 1.17 1.23 1.25 1.58 1.79 1.53 1.82 1.47 1.65 1.75 2.07 1.43 1.62 1.52 1.86
N 146 145 134 143 146 146 143 143 138 137 142 47 46 144 143 Mean 1.10 1.16 1.22 1.50 1.63 1.53 1.70 1.46 1.67 1.83 1.85 1.53 1.61 1.59 1.76
JAPN Central
N 14 13 12 14 14 14 14 14 14 14 14 10 10 14 14 Mean 1.00 1.15 1.00 1.14 1.21 1.14 1.79 1.07 1.14 1.43 1.14 1.20 1.20 1.21 1.21
Northwest
N 19 19 19 19 19 19 19 19 18 18 19 3 3 19 19 Mean 1.11 1.05 1.21 1.53 1.95 1.47 1.68 1.95 1.83 2.11 1.74 1.00 1.00 1.68 2.05
N 33 32 31 33 33 33 33 33 32 32 33 13 13 33 33 Mean 1.06 1.09 1.13 1.36 1.64 1.33 1.73 1.58 1.53 1.81 1.48 1.15 1.15 1.48 1.70
MATD Central
N 678 657 620 672 675 673 663 672 633 634 658 302 312 669 658 Mean 1.12 1.21 1.34 1.55 1.76 1.52 1.85 1.50 1.70 1.93 1.83 1.88 1.88 1.73 1.84
Houston Community College Office of Institutional Research
TP: SEOI_SPRING2008_ACAD.spo Page 13 06/30/2008
Houston Community College STUDENT EVALUATION OF INSTRUCTOR: SUMMARY OF MEANS REPORT : SPRING 2008 ACADEMIC SUBJECTS
Subject College Q01 Q02 Q03 Q04 Q05 Q06 Q07 Q08 Q09 Q10 Q11 Q12 Q13 Q14 Q15
MATD Northeast
N 554 547 496 547 555 552 553 552 536 516 537 248 255 547 544 Mean 1.10 1.16 1.25 1.39 1.52 1.36 1.62 1.36 1.54 1.80 1.61 1.65 1.68 1.52 1.53
Northwest
N 930 912 844 927 930 927 926 928 906 870 908 353 357 923 908 Mean 1.07 1.13 1.22 1.30 1.41 1.30 1.50 1.27 1.45 1.64 1.44 1.55 1.59 1.43 1.42
Southeast
N 528 498 496 517 529 527 524 525 514 482 514 203 196 521 521 Mean 1.06 1.17 1.22 1.37 1.42 1.32 1.51 1.34 1.46 1.83 1.56 1.62 1.63 1.46 1.43
Southwest
N 1611 1577 1510 1606 1603 1598 1594 1603 1551 1538 1575 752 746 1595 1559 Mean 1.08 1.16 1.21 1.36 1.44 1.33 1.53 1.29 1.45 1.70 1.50 1.60 1.62 1.47 1.47
N 4301 4191 3966 4269 4292 4277 4260 4280 4140 4040 4192 1858 1866 4255 4190 Mean 1.08 1.16 1.24 1.38 1.49 1.36 1.58 1.33 1.50 1.75 1.56 1.64 1.67 1.51 1.52
MATH Central
N 572 554 503 574 576 571 569 570 541 529 555 242 242 566 556 Mean 1.13 1.18 1.36 1.50 1.75 1.46 1.76 1.51 1.71 1.86 1.84 1.81 1.83 1.74 1.81
Northeast
N 259 256 237 257 259 259 255 259 249 242 256 112 109 257 248 Mean 1.08 1.12 1.24 1.35 1.48 1.32 1.60 1.36 1.49 1.94 1.55 1.71 1.75 1.50 1.52
Northwest
N 767 739 683 760 770 761 757 762 725 717 745 221 217 762 752 Mean 1.08 1.16 1.29 1.48 1.64 1.45 1.67 1.44 1.60 1.78 1.59 1.67 1.71 1.70 1.74
Southeast
N 394 380 350 392 390 393 392 393 377 367 383 108 104 389 387 Mean 1.05 1.16 1.27 1.36 1.59 1.36 1.53 1.37 1.54 1.77 1.54 1.62 1.77 1.50 1.57
Southwest
N 1582 1550 1447 1566 1578 1567 1564 1575 1510 1497 1539 597 591 1556 1529 Mean 1.08 1.14 1.23 1.35 1.45 1.34 1.54 1.31 1.47 1.67 1.49 1.55 1.60 1.46 1.49
N 3574 3479 3220 3549 3573 3551 3537 3559 3402 3352 3478 1280 1263 3530 3472 Mean 1.08 1.15 1.27 1.40 1.55 1.38 1.61 1.38 1.55 1.75 1.58 1.64 1.69 1.56 1.61
Houston Community College Office of Institutional Research
TP: SEOI_SPRING2008_ACAD.spo Page 14 06/30/2008

Houston Community College STUDENT EVALUATION OF INSTRUCTOR: SUMMARY OF MEANS REPORT : SPRING 2008 ACADEMIC SUBJECTS
Subject College Q01 Q02 Q03 Q04 Q05 Q06 Q07 Q08 Q09 Q10 Q11 Q12 Q13 Q14 Q15
MUAP Central
N 6 6 6 6 6 6 6 6 6 6 6 2 2 6 6 Mean 1.17 1.50 1.67 2.67 1.50 1.83 2.50 1.33 2.33 2.33 2.67 2.00 2.00 1.83 2.00
Northwest
N 20 16 19 20 20 20 20 19 20 18 19 11 10 20 20 Mean 1.10 1.25 1.32 1.80 1.80 1.55 1.70 1.26 1.45 1.50 1.84 2.36 2.10 1.40 1.95
Southwest
N 17 15 15 16 17 17 17 16 17 14 16 13 12 17 16 Mean 1.06 1.27 1.20 1.50 1.59 1.59 2.00 1.50 1.65 1.79 1.75 1.62 1.58 1.35 1.25
N 43 37 40 42 43 43 43 41 43 38 41 26 24 43 42 Mean 1.09 1.30 1.33 1.81 1.67 1.60 1.93 1.37 1.65 1.74 1.93 1.96 1.83 1.44 1.69
MUSI Central
N 89 82 81 88 89 88 87 89 83 85 87 46 46 87 84 Mean 1.13 1.28 1.31 1.41 1.66 1.42 1.60 1.40 1.61 1.71 1.57 1.65 1.72 1.57 1.62
Northwest
N 234 221 215 231 235 231 233 235 220 217 225 93 90 232 225 Mean 1.08 1.19 1.21 1.37 1.55 1.35 1.60 1.34 1.43 1.61 1.44 1.51 1.51 1.41 1.48
Southwest
N 83 78 76 82 82 81 82 80 74 74 81 27 27 82 78 Mean 1.10 1.18 1.30 1.40 1.50 1.44 1.52 1.29 1.49 1.69 1.59 1.59 1.74 1.65 1.54
N 406 381 372 401 406 400 402 404 377 376 393 166 163 401 387 Mean 1.09 1.21 1.25 1.38 1.56 1.39 1.58 1.35 1.48 1.65 1.50 1.56 1.61 1.49 1.52
PHED Central
N 105 80 93 99 105 104 101 105 100 98 97 67 66 103 102 Mean 1.10 1.19 1.27 1.49 1.56 1.60 1.73 1.55 1.65 1.79 1.73 1.60 1.62 1.50 1.62
Northwest
N 16 16 16 16 16 16 15 16 16 16 14 2 2 16 16 Mean 1.00 1.06 1.13 1.38 1.38 1.44 1.73 1.38 1.44 1.94 1.71 1.00 1.50 1.50 1.63
Southwest
N 38 35 35 36 38 36 37 38 38 34 36 20 19 37 34 Mean 1.18 1.20 1.46 1.69 1.79 1.61 1.73 1.71 1.71 2.06 1.78 1.80 2.05 1.70 1.79
N 159 131 144 151 159 156 153 159 154 148 147 89 87 156 152
Houston Community College Office of Institutional Research
TP: SEOI_SPRING2008_ACAD.spo Page 15 06/30/2008

Houston Community College STUDENT EVALUATION OF INSTRUCTOR: SUMMARY OF MEANS REPORT : SPRING 2008 ACADEMIC SUBJECTS
Subject College Q01 Q02 Q03 Q04 Q05 Q06 Q07 Q08 Q09 Q10 Q11 Q12 Q13 Q14 Q15
Mean 1.11 1.18 1.30 1.53 1.60 1.58 1.73 1.57 1.64 1.86 1.74 1.63 1.71 1.55 1.66
PHIL Central
N 187 184 173 187 187 186 187 187 171 173 183 54 51 181 178 Mean 1.17 1.21 1.30 1.67 1.81 1.63 2.16 1.47 1.67 1.99 1.81 1.76 1.76 1.87 2.01
Northeast
N 10 10 8 10 10 10 10 10 9 10 10 3 3 10 10 Mean 1.20 1.20 1.13 1.50 2.20 1.50 1.60 1.70 2.56 1.70 1.90 1.67 1.67 2.30 2.20
Northwest
N 244 241 234 239 243 242 242 238 234 229 239 67 62 243 236 Mean 1.08 1.15 1.20 1.45 1.51 1.45 1.61 1.33 1.45 1.74 1.57 1.64 1.76 1.47 1.54
Southeast
N 32 29 29 32 32 32 32 32 32 30 32 13 14 30 30 Mean 1.16 1.21 1.17 1.50 1.53 1.44 1.47 1.31 1.50 1.50 1.72 1.38 1.29 1.30 1.63
Southwest
N 137 130 129 138 136 137 137 137 133 132 135 66 64 136 132 Mean 1.08 1.12 1.19 1.34 1.42 1.36 1.52 1.31 1.55 1.72 1.55 1.48 1.56 1.49 1.48
N 610 594 573 606 608 607 608 604 579 574 599 203 194 600 586 Mean 1.11 1.17 1.23 1.50 1.60 1.49 1.75 1.38 1.56 1.80 1.65 1.61 1.66 1.60 1.69
PHYS Central
N 103 102 92 103 103 100 101 103 95 95 102 58 58 103 102 Mean 1.13 1.28 1.48 1.94 2.07 1.73 2.11 1.58 1.86 2.09 2.10 1.74 1.88 1.99 2.21
Northeast
N 7 7 7 7 7 7 7 6 7 5 7 5 5 7 7 Mean 1.00 1.14 1.29 1.43 1.29 1.71 1.86 1.00 1.71 2.20 1.43 2.40 2.60 1.86 1.71
Northwest
N 141 128 121 132 134 133 136 135 129 132 133 102 97 134 131 Mean 1.26 1.34 1.43 1.72 1.96 1.55 1.90 1.49 1.69 1.71 1.89 1.69 1.71 1.78 2.05
Southeast
N 30 30 29 30 30 30 30 28 29 30 30 27 27 30 29 Mean 1.17 1.13 1.10 1.43 1.57 1.43 1.50 1.18 1.28 1.47 1.53 1.30 1.33 1.27 1.45
Southwest
N 238 233 220 236 238 236 234 237 223 228 227 155 154 233 228
Houston Community College Office of Institutional Research
TP: SEOI_SPRING2008_ACAD.spo Page 16 06/30/2008

Houston Community College STUDENT EVALUATION OF INSTRUCTOR: SUMMARY OF MEANS REPORT : SPRING 2008 ACADEMIC SUBJECTS
Subject College Q01 Q02 Q03 Q04 Q05 Q06 Q07 Q08 Q09 Q10 Q11 Q12 Q13 Q14 Q15
Mean 1.11 1.23 1.33 1.58 1.82 1.58 1.85 1.50 1.65 1.80 1.70 1.69 1.68 1.63 1.75
N 519 500 469 508 512 506 508 509 483 490 499 347 341 507 497 Mean 1.15 1.26 1.37 1.68 1.88 1.60 1.89 1.49 1.68 1.82 1.82 1.68 1.71 1.72 1.91
PSYC Central
N 461 454 427 459 458 456 456 455 433 428 445 166 160 452 443 Mean 1.09 1.11 1.25 1.48 1.43 1.40 1.68 1.33 1.48 1.74 1.54 1.74 1.74 1.52 1.50
Coleman
N 4 4 4 4 4 4 4 4 4 4 4 1 1 4 4 Mean 1.00 1.00 1.00 1.25 1.25 1.25 1.25 1.25 1.25 2.25 1.25 1.00 2.00 1.00 1.00
Northeast
N 238 229 225 237 238 238 236 237 232 230 231 130 128 237 232 Mean 1.03 1.08 1.08 1.22 1.28 1.23 1.41 1.22 1.27 1.74 1.38 1.38 1.43 1.32 1.25
Northwest
N 649 631 621 651 647 646 643 641 613 614 639 220 216 643 627 Mean 1.07 1.15 1.19 1.40 1.40 1.38 1.63 1.33 1.45 1.73 1.53 1.58 1.64 1.52 1.49
Southeast
N 282 277 271 282 281 281 279 280 275 267 278 107 108 278 267 Mean 1.06 1.07 1.17 1.34 1.35 1.33 1.50 1.25 1.36 1.64 1.43 1.59 1.60 1.37 1.30
Southwest
N 841 824 787 833 840 832 836 833 810 791 826 311 307 831 815 Mean 1.07 1.11 1.19 1.36 1.38 1.36 1.56 1.28 1.44 1.65 1.45 1.62 1.66 1.43 1.46
N 2475 2419 2335 2466 2468 2457 2454 2450 2367 2334 2423 935 920 2445 2388 Mean 1.07 1.11 1.19 1.38 1.38 1.36 1.58 1.29 1.43 1.70 1.48 1.60 1.63 1.45 1.44
SGNL Coleman
N 44 40 43 43 44 44 44 44 41 44 44 28 31 44 42 Mean 1.11 1.13 1.12 1.56 1.61 1.52 1.73 1.57 1.61 1.93 1.59 1.82 1.61 1.50 1.60
N 44 40 43 43 44 44 44 44 41 44 44 28 31 44 42 Mean 1.11 1.13 1.12 1.56 1.61 1.52 1.73 1.57 1.61 1.93 1.59 1.82 1.61 1.50 1.60
SOCI Central
N 282 278 259 278 280 279 280 280 265 264 271 112 106 273 270 Mean 1.11 1.16 1.26 1.47 1.50 1.48 1.63 1.35 1.46 1.82 1.60 1.55 1.65 1.48 1.47
Houston Community College Office of Institutional Research
TP: SEOI_SPRING2008_ACAD.spo Page 17 06/30/2008

Houston Community College STUDENT EVALUATION OF INSTRUCTOR: SUMMARY OF MEANS REPORT : SPRING 2008 ACADEMIC SUBJECTS
Subject College Q01 Q02 Q03 Q04 Q05 Q06 Q07 Q08 Q09 Q10 Q11 Q12 Q13 Q14 Q15
SOCI Northeast
N 101 92 93 96 101 101 98 101 99 91 94 43 49 101 101 Mean 1.08 1.15 1.18 1.36 1.46 1.34 1.42 1.25 1.33 1.75 1.48 1.37 1.45 1.38 1.47
Northwest
N 411 389 377 404 410 405 401 409 393 384 404 140 133 406 402 Mean 1.09 1.24 1.28 1.37 1.52 1.44 1.62 1.28 1.44 1.70 1.49 1.54 1.62 1.42 1.44
Southeast
N 137 136 131 136 136 137 137 136 133 128 136 57 55 135 133 Mean 1.12 1.09 1.20 1.43 1.44 1.41 1.64 1.32 1.52 1.79 1.54 1.70 1.71 1.50 1.52
Southwest
N 483 471 457 485 485 476 482 480 466 466 470 188 180 477 475 Mean 1.09 1.21 1.24 1.53 1.48 1.47 1.75 1.35 1.52 1.84 1.61 1.65 1.70 1.54 1.60
N 1414 1366 1317 1399 1412 1398 1398 1406 1356 1333 1375 540 523 1392 1381 Mean 1.10 1.19 1.25 1.45 1.49 1.44 1.65 1.32 1.47 1.78 1.56 1.59 1.65 1.48 1.51
SPAN Central
N 203 199 193 198 199 200 198 200 184 188 197 99 102 198 189 Mean 1.24 1.29 1.32 1.58 1.57 1.55 1.75 1.54 1.61 1.79 1.60 1.88 1.83 1.59 1.72
Northeast
N 44 43 38 44 45 44 44 45 45 40 43 17 17 45 45 Mean 1.07 1.21 1.11 1.23 1.31 1.23 1.43 1.24 1.44 2.03 1.44 1.59 1.53 1.24 1.42
Northwest
N 128 126 124 127 129 127 127 128 121 121 128 62 68 128 128 Mean 1.09 1.17 1.20 1.32 1.49 1.27 1.57 1.31 1.38 1.55 1.38 1.53 1.53 1.33 1.40
Southeast
N 33 33 30 33 33 33 33 33 32 31 32 13 14 33 33 Mean 1.03 1.06 1.13 1.36 1.67 1.30 1.48 1.27 1.50 1.90 1.41 1.85 1.64 1.39 1.52
Southwest
N 167 162 158 165 167 166 165 165 158 159 163 68 71 164 163 Mean 1.13 1.13 1.25 1.41 1.50 1.38 1.59 1.38 1.61 1.75 1.63 1.59 1.63 1.57 1.61
N 575 563 543 567 573 570 567 571 540 539 563 259 272 568 558 Mean 1.15 1.20 1.24 1.43 1.51 1.40 1.62 1.40 1.54 1.75 1.53 1.70 1.68 1.49 1.58
Houston Community College Office of Institutional Research
TP: SEOI_SPRING2008_ACAD.spo Page 18 06/30/2008

Houston Community College STUDENT EVALUATION OF INSTRUCTOR: SUMMARY OF MEANS REPORT : SPRING 2008 ACADEMIC SUBJECTS
Subject College Q01 Q02 Q03 Q04 Q05 Q06 Q07 Q08 Q09 Q10 Q11 Q12 Q13 Q14 Q15
SPCH Central
N 244 239 222 234 243 241 237 238 228 225 235 72 72 243 241 Mean 1.06 1.13 1.20 1.41 1.33 1.34 1.46 1.31 1.45 1.88 1.49 1.64 1.64 1.33 1.39
Northeast
N 152 150 140 149 151 152 149 151 148 134 149 50 48 150 150 Mean 1.17 1.21 1.24 1.44 1.53 1.45 1.53 1.40 1.53 1.70 1.60 1.50 1.54 1.51 1.55
Northwest
N 365 295 328 322 365 362 350 364 349 335 345 117 116 359 354 Mean 1.13 1.32 1.29 1.61 1.42 1.41 1.55 1.44 1.46 1.84 1.52 1.56 1.53 1.39 1.49
Southeast
N 170 165 159 170 172 171 170 169 166 160 170 46 45 171 167 Mean 1.15 1.22 1.18 1.50 1.45 1.40 1.42 1.32 1.45 1.79 1.55 1.72 1.76 1.40 1.44
Southwest
N 321 312 292 316 321 319 314 319 314 307 314 131 128 316 309 Mean 1.05 1.05 1.17 1.27 1.37 1.28 1.42 1.29 1.37 1.64 1.37 1.35 1.35 1.40 1.43
N 1252 1161 1141 1191 1252 1245 1220 1241 1205 1161 1213 416 409 1239 1221 Mean 1.10 1.18 1.22 1.44 1.41 1.37 1.48 1.36 1.44 1.77 1.49 1.52 1.52 1.40 1.46
TECA Central
N 85 84 78 86 86 84 85 86 81 83 84 48 49 86 85 Mean 1.14 1.14 1.15 1.51 1.64 1.42 1.56 1.28 1.49 1.54 1.46 1.54 1.69 1.52 1.54
Northeast
N 39 40 36 40 40 40 39 40 40 39 39 14 15 40 40 Mean 1.21 1.15 1.33 1.75 1.70 1.58 1.92 1.43 1.60 1.97 2.00 2.07 2.07 1.58 1.80
Northwest
N 72 71 69 72 72 72 72 71 72 66 67 33 31 72 72 Mean 1.08 1.07 1.12 1.43 1.63 1.43 1.61 1.30 1.58 1.74 1.54 1.45 1.52 1.47 1.65
Southeast
N 28 27 27 28 28 27 28 28 27 23 27 11 11 27 24 Mean 1.04 1.04 1.11 1.14 1.11 1.11 1.21 1.18 1.30 2.09 1.30 1.36 1.55 1.33 1.25
Southwest
N 65 64 63 65 65 65 65 65 62 63 65 15 12 65 64 Mean 1.02 1.03 1.11 1.26 1.29 1.29 1.54 1.23 1.23 1.94 1.42 1.33 1.33 1.32 1.38
Houston Community College Office of Institutional Research
TP: SEOI_SPRING2008_ACAD.spo Page 19 06/30/2008

Houston Community College STUDENT EVALUATION OF INSTRUCTOR: SUMMARY OF MEANS REPORT : SPRING 2008 ACADEMIC SUBJECTS
Subject College Q01 Q02 Q03 Q04 Q05 Q06 Q07 Q08 Q09 Q10 Q11 Q12 Q13 Q14 Q15
N 289 286 273 291 291 288 289 290 282 274 282 121 118 290 285 Mean 1.10 1.09 1.15 1.43 1.52 1.39 1.58 1.28 1.45 1.79 1.53 1.54 1.64 1.46 1.54
Houston Community College Office of Institutional Research
TP: SEOI_SPRING2008_ACAD.spo Page 20 06/30/2008

Houston Community College STUDENT EVALUATION OF INSTRUCTOR: SUMMARY OF MEANS REPORT : SPRING 2008 WORKFORCE SECTIONS
Subject College Q01 Q02 Q03 Q04 Q05 Q06 Q07 Q08 Q09 Q10 Q11 Q12 Q13 Q14 Q15
ACCT Central
N 147 143 131 140 146 147 145 147 135 135 143 60 54 141 139 Mean 1.12 1.16 1.23 1.50 1.75 1.48 1.70 1.46 1.61 1.79 1.79 1.63 1.76 1.70 1.77
Northeast
N 27 25 28 28 28 28 28 28 27 28 28 15 13 28 28 Mean 1.30 1.24 1.50 1.82 1.61 1.57 1.89 1.43 1.63 2.00 1.89 1.80 1.92 1.64 1.89
Northwest
N 177 173 161 177 176 175 176 172 169 166 173 71 73 176 173 Mean 1.18 1.25 1.30 1.69 1.85 1.60 1.98 1.40 1.75 1.84 1.71 1.62 1.56 1.72 1.88
Southeast
N 20 20 17 20 20 20 20 19 18 18 20 6 6 20 19 Mean 1.05 1.15 1.18 1.25 1.35 1.40 1.65 1.21 1.50 1.56 1.30 1.67 1.83 1.30 1.26
Southwest
N 428 419 388 421 431 427 421 426 410 406 420 156 157 429 419 Mean 1.09 1.19 1.27 1.45 1.55 1.38 1.59 1.35 1.49 1.70 1.55 1.72 1.73 1.55 1.66
N 799 780 725 786 801 797 790 792 759 753 784 308 303 794 778 Mean 1.12 1.20 1.28 1.52 1.65 1.45 1.71 1.38 1.57 1.76 1.64 1.68 1.70 1.61 1.73
ACNT Central
N 78 77 75 77 78 77 78 76 73 73 72 35 37 77 75 Mean 1.13 1.19 1.16 1.52 1.54 1.45 1.63 1.29 1.44 1.58 1.57 1.69 1.76 1.47 1.47
Northeast
N 14 14 14 14 14 14 14 14 14 14 13 12 13 14 14 Mean 1.07 1.07 1.14 1.21 1.43 1.29 1.21 1.21 1.36 1.57 1.38 1.17 1.46 1.29 1.36
Northwest
N 60 60 58 60 60 59 60 60 57 53 58 27 29 59 54 Mean 1.05 1.12 1.19 1.25 1.30 1.24 1.50 1.20 1.32 1.47 1.41 1.26 1.24 1.34 1.35
Southeast
N 21 21 21 21 21 21 21 21 21 21 21 9 9 21 21 Mean 1.05 1.14 1.14 1.38 1.43 1.43 1.62 1.19 1.43 1.57 1.52 1.78 1.67 1.43 1.57
Southwest
N 309 284 279 302 307 307 303 305 294 291 302 116 121 300 291 Mean 1.13 1.24 1.25 1.56 1.60 1.47 1.54 1.34 1.53 1.71 1.62 1.53 1.67 1.57 1.63
Houston Community College Office of Institutional Research
TP: SEOI_SPRING2008_WFC.spo Page 1 06/30/2008

Houston Community College STUDENT EVALUATION OF INSTRUCTOR: SUMMARY OF MEANS REPORT : SPRING 2008 WORKFORCE SECTIONS
Subject College Q01 Q02 Q03 Q04 Q05 Q06 Q07 Q08 Q09 Q10 Q11 Q12 Q13 Q14 Q15
N 482 456 447 474 480 478 476 476 459 452 466 199 209 471 455 Mean 1.11 1.20 1.22 1.49 1.54 1.43 1.55 1.31 1.48 1.65 1.58 1.51 1.61 1.51 1.56
AHS Northwest
N 1 0 1 0 1 1 0 1 1 1 0 0 0 1 1 Mean 1.00 . 1.00 . 2.00 1.00 . 1.00 1.00 1.00 . . . 1.00 1.00
N 1 0 1 0 1 1 0 1 1 1 0 0 0 1 1 Mean 1.00 . 1.00 . 2.00 1.00 . 1.00 1.00 1.00 . . . 1.00 1.00
ARCE Southeast
N 11 9 10 11 11 11 11 10 11 11 11 11 11 11 11 Mean 1.00 1.00 1.10 1.64 1.45 1.36 1.64 1.40 1.36 1.91 1.55 1.55 1.55 1.27 1.36
N 11 9 10 11 11 11 11 10 11 11 11 11 11 11 11 Mean 1.00 1.00 1.10 1.64 1.45 1.36 1.64 1.40 1.36 1.91 1.55 1.55 1.55 1.27 1.36
ARTC Southwest
N 232 202 211 202 229 230 221 229 224 216 224 107 117 225 226 Mean 1.08 1.17 1.18 1.37 1.47 1.32 1.58 1.34 1.57 1.78 1.61 1.53 1.43 1.44 1.54
N 232 202 211 202 229 230 221 229 224 216 224 107 117 225 226 Mean 1.08 1.17 1.18 1.37 1.47 1.32 1.58 1.34 1.57 1.78 1.61 1.53 1.43 1.44 1.54
ARTV Southwest
N 52 46 50 53 53 53 53 53 49 52 52 27 29 52 52 Mean 1.02 1.22 1.30 1.26 1.32 1.23 1.38 1.19 1.47 1.50 1.67 1.41 1.41 1.40 1.37
N 52 46 50 53 53 53 53 53 49 52 52 27 29 52 52 Mean 1.02 1.22 1.30 1.26 1.32 1.23 1.38 1.19 1.47 1.50 1.67 1.41 1.41 1.40 1.37
AUMT Northeast
N 146 147 143 147 147 147 144 147 144 143 140 139 137 145 139 Mean 1.08 1.07 1.14 1.33 1.41 1.33 1.43 1.30 1.38 1.62 1.59 1.27 1.39 1.35 1.40
N 146 147 143 147 147 147 144 147 144 143 140 139 137 145 139 Mean 1.08 1.07 1.14 1.33 1.41 1.33 1.43 1.30 1.38 1.62 1.59 1.27 1.39 1.35 1.40
BIOM Central
N 5 5 5 5 5 5 5 5 5 5 5 4 4 5 4 Mean 1.00 1.00 1.00 1.20 1.20 1.20 1.20 1.20 1.20 1.80 2.00 1.25 1.50 1.20 1.50
N 5 5 5 5 5 5 5 5 5 5 5 4 4 5 4 Mean 1.00 1.00 1.00 1.20 1.20 1.20 1.20 1.20 1.20 1.80 2.00 1.25 1.50 1.20 1.50
Houston Community College Office of Institutional Research
TP: SEOI_SPRING2008_WFC.spo Page 2 06/30/2008

Houston Community College STUDENT EVALUATION OF INSTRUCTOR: SUMMARY OF MEANS REPORT : SPRING 2008 WORKFORCE SECTIONS
Subject College Q01 Q02 Q03 Q04 Q05 Q06 Q07 Q08 Q09 Q10 Q11 Q12 Q13 Q14 Q15
BMGT Central
N 69 67 62 69 69 69 65 69 65 64 68 43 42 68 65 Mean 1.13 1.19 1.37 1.46 1.59 1.54 1.66 1.42 1.49 1.77 1.60 1.70 1.79 1.60 1.68
Northeast
N 22 22 22 22 22 21 22 22 22 21 22 8 8 22 22 Mean 1.00 1.09 1.14 1.18 1.23 1.43 1.36 1.18 1.27 1.33 1.27 1.00 1.00 1.23 1.23
Northwest
N 11 11 11 11 11 11 11 11 11 11 11 4 4 11 11 Mean 1.09 1.09 1.91 1.36 1.73 1.27 2.09 1.73 2.00 2.73 1.45 1.75 1.75 1.55 2.00
Southeast
N 8 8 8 8 8 8 8 8 8 8 8 3 3 8 8 Mean 1.00 1.13 1.25 1.25 1.25 1.13 1.75 1.13 1.75 1.75 1.38 2.67 2.67 1.38 1.13
Southwest
N 36 35 34 35 35 35 35 35 34 35 35 13 14 35 32 Mean 1.06 1.06 1.06 1.46 1.43 1.37 1.40 1.34 1.41 2.06 1.63 1.69 1.64 1.66 1.53
N 146 143 137 145 145 144 141 145 140 139 144 71 71 144 138 Mean 1.08 1.13 1.29 1.40 1.49 1.44 1.59 1.37 1.49 1.85 1.53 1.66 1.70 1.54 1.57
BNKG Central
N 6 6 6 6 6 6 6 6 6 6 6 4 4 6 6 Mean 1.00 1.00 1.17 1.17 1.33 1.17 1.33 1.00 1.33 1.33 1.33 1.25 1.25 1.33 1.33
N 6 6 6 6 6 6 6 6 6 6 6 4 4 6 6 Mean 1.00 1.00 1.17 1.17 1.33 1.17 1.33 1.00 1.33 1.33 1.33 1.25 1.25 1.33 1.33
BUSG Central
N 82 81 76 81 81 81 82 82 81 79 80 25 25 82 82 Mean 1.15 1.21 1.28 1.43 1.54 1.36 1.67 1.32 1.47 1.75 1.48 1.88 1.80 1.45 1.52
Northeast
N 7 6 6 7 7 7 7 7 7 7 7 7 7 7 7 Mean 1.00 1.00 1.00 1.14 1.14 1.14 1.14 1.14 1.14 1.14 1.14 1.14 1.14 1.14 1.14
Northwest
N 19 19 18 19 19 18 19 19 17 19 18 9 9 19 19 Mean 1.05 1.05 1.11 1.42 1.47 1.44 1.68 1.42 1.47 1.53 1.44 1.56 1.78 1.42 1.53
Houston Community College Office of Institutional Research
TP: SEOI_SPRING2008_WFC.spo Page 3 06/30/2008

Houston Community College STUDENT EVALUATION OF INSTRUCTOR: SUMMARY OF MEANS REPORT : SPRING 2008 WORKFORCE SECTIONS
Subject College Q01 Q02 Q03 Q04 Q05 Q06 Q07 Q08 Q09 Q10 Q11 Q12 Q13 Q14 Q15
BUSG Southeast
N 23 19 20 17 24 24 22 24 24 22 21 7 8 24 24 Mean 1.00 1.00 1.20 1.06 1.00 1.04 1.18 1.00 1.13 1.32 1.10 1.57 1.50 1.04 1.13
Southwest
N 83 82 79 83 83 82 82 82 78 79 81 39 39 81 77 Mean 1.06 1.05 1.10 1.34 1.43 1.32 1.50 1.28 1.38 1.54 1.41 1.77 1.72 1.42 1.36
N 214 207 199 207 214 212 212 214 207 206 207 87 88 213 209 Mean 1.08 1.11 1.18 1.35 1.42 1.31 1.54 1.27 1.39 1.58 1.40 1.71 1.68 1.38 1.41
CDEC Central
N 42 38 35 42 42 42 41 42 41 42 40 27 26 41 39 Mean 1.05 1.08 1.20 1.33 1.55 1.36 1.54 1.33 1.49 1.38 1.55 1.37 1.65 1.49 1.49
Northeast
N 21 21 19 21 21 21 21 21 20 20 21 18 18 21 21 Mean 1.00 1.00 1.16 1.24 1.19 1.14 1.19 1.14 1.15 1.35 1.29 1.22 1.11 1.19 1.29
Southwest
N 13 13 13 13 13 13 13 13 13 13 13 6 6 13 13 Mean 1.15 1.15 1.15 1.62 1.31 1.31 1.85 1.23 1.69 1.46 1.77 1.50 1.50 1.69 1.77
N 76 72 67 76 76 76 75 76 74 75 74 51 50 75 73 Mean 1.05 1.07 1.18 1.36 1.41 1.29 1.49 1.26 1.43 1.39 1.51 1.33 1.44 1.44 1.48
CEC System
N 1 1 1 1 1 1 1 1 1 1 1 1 1 1 1 Mean 1.00 1.00 1.00 1.00 1.00 1.00 1.00 1.00 1.00 1.00 1.00 1.00 1.00 1.00 1.00
N 1 1 1 1 1 1 1 1 1 1 1 1 1 1 1 Mean 1.00 1.00 1.00 1.00 1.00 1.00 1.00 1.00 1.00 1.00 1.00 1.00 1.00 1.00 1.00
CETT Central
N 53 51 50 51 54 54 54 54 54 52 53 34 35 53 53 Mean 1.04 1.12 1.10 1.33 1.28 1.31 1.33 1.31 1.30 1.69 1.30 1.24 1.23 1.30 1.28
Northeast
N 1 0 1 1 1 1 1 1 1 1 1 0 0 1 1 Mean 1.00 . 1.00 1.00 1.00 1.00 1.00 1.00 1.00 1.00 1.00 . . 2.00 2.00
Northwest
N 5 4 4 5 5 5 5 5 4 5 5 4 4 5 4
Houston Community College Office of Institutional Research
TP: SEOI_SPRING2008_WFC.spo Page 4 06/30/2008

Houston Community College STUDENT EVALUATION OF INSTRUCTOR: SUMMARY OF MEANS REPORT : SPRING 2008 WORKFORCE SECTIONS
Subject College Q01 Q02 Q03 Q04 Q05 Q06 Q07 Q08 Q09 Q10 Q11 Q12 Q13 Q14 Q15
Mean 1.20 1.00 1.25 1.20 1.60 1.20 1.20 1.40 1.00 1.40 1.20 1.00 1.00 1.20 1.00
N 59 55 55 57 60 60 60 60 59 58 59 38 39 59 58 Mean 1.05 1.11 1.11 1.32 1.30 1.30 1.32 1.32 1.27 1.66 1.29 1.21 1.21 1.31 1.28
CHEF Central
N 240 219 227 234 237 237 235 238 232 225 230 171 168 235 231 Mean 1.09 1.15 1.10 1.44 1.49 1.38 1.59 1.51 1.45 1.71 1.56 1.45 1.46 1.48 1.51
N 240 219 227 234 237 237 235 238 232 225 230 171 168 235 231 Mean 1.09 1.15 1.10 1.44 1.49 1.38 1.59 1.51 1.45 1.71 1.56 1.45 1.46 1.48 1.51
CMSW Coleman
N 37 36 34 37 37 37 36 37 34 34 36 13 12 36 34 Mean 1.16 1.28 1.29 1.46 1.62 1.51 1.81 1.59 1.68 1.79 1.83 1.77 1.67 1.47 1.38
N 37 36 34 37 37 37 36 37 34 34 36 13 12 36 34 Mean 1.16 1.28 1.29 1.46 1.62 1.51 1.81 1.59 1.68 1.79 1.83 1.77 1.67 1.47 1.38
CPMT Central
N 40 38 35 38 39 39 40 40 37 37 39 25 24 39 38 Mean 1.10 1.13 1.14 1.42 1.38 1.33 1.68 1.25 1.32 1.57 1.54 1.44 1.46 1.36 1.45
N 40 38 35 38 39 39 40 40 37 37 39 25 24 39 38 Mean 1.10 1.13 1.14 1.42 1.38 1.33 1.68 1.25 1.32 1.57 1.54 1.44 1.46 1.36 1.45
CSME Central
N 116 115 112 116 116 116 116 115 114 111 111 86 86 116 115 Mean 1.14 1.11 1.35 1.46 1.58 1.44 1.74 1.49 1.64 2.06 1.73 1.47 1.55 1.66 1.70
Northeast
N 58 59 54 58 58 58 58 57 55 55 57 40 39 58 58 Mean 1.17 1.19 1.15 1.40 1.45 1.47 1.53 1.40 1.44 1.69 1.46 1.48 1.56 1.45 1.47
Northwest
N 70 61 63 69 70 69 69 70 70 68 68 44 43 69 69 Mean 1.06 1.13 1.14 1.29 1.37 1.26 1.46 1.30 1.31 1.60 1.35 1.23 1.26 1.25 1.28
Southeast
N 82 84 76 83 86 81 80 82 81 77 80 72 73 82 83 Mean 1.18 1.23 1.28 1.53 1.58 1.56 1.84 1.48 1.54 1.79 1.56 1.35 1.45 1.56 1.54
N 326 319 305 326 330 324 323 324 320 311 316 242 241 325 325 Mean 1.14 1.16 1.25 1.43 1.51 1.44 1.67 1.43 1.51 1.83 1.56 1.39 1.47 1.51 1.53
Houston Community College Office of Institutional Research
TP: SEOI_SPRING2008_WFC.spo Page 5 06/30/2008

Houston Community College STUDENT EVALUATION OF INSTRUCTOR: SUMMARY OF MEANS REPORT : SPRING 2008 WORKFORCE SECTIONS
Subject College Q01 Q02 Q03 Q04 Q05 Q06 Q07 Q08 Q09 Q10 Q11 Q12 Q13 Q14 Q15
CTEC Northeast
N 10 10 10 9 10 10 9 10 10 8 9 9 9 10 10 Mean 1.00 1.00 1.20 1.11 1.10 1.10 1.00 1.00 1.10 1.50 1.22 1.22 1.33 1.00 1.00
N 10 10 10 9 10 10 9 10 10 8 9 9 9 10 10 Mean 1.00 1.00 1.20 1.11 1.10 1.10 1.00 1.00 1.10 1.50 1.22 1.22 1.33 1.00 1.00
CTMT Coleman
N 24 23 24 24 24 23 24 24 22 23 24 13 13 24 22 Mean 1.21 1.09 1.25 1.75 1.79 1.61 1.67 1.46 1.55 1.57 1.79 2.08 2.00 1.83 2.00
N 24 23 24 24 24 23 24 24 22 23 24 13 13 24 22 Mean 1.21 1.09 1.25 1.75 1.79 1.61 1.67 1.46 1.55 1.57 1.79 2.08 2.00 1.83 2.00
CVTT Coleman
N 91 90 90 91 91 89 89 91 87 90 89 74 78 90 88 Mean 1.15 1.28 1.30 1.69 1.78 1.72 1.98 1.70 1.79 1.81 1.80 1.72 1.72 1.67 1.97
N 91 90 90 91 91 89 89 91 87 90 89 74 78 90 88 Mean 1.15 1.28 1.30 1.69 1.78 1.72 1.98 1.70 1.79 1.81 1.80 1.72 1.72 1.67 1.97
DAAC Coleman
N 50 45 47 50 50 48 50 50 49 47 49 38 36 49 48 Mean 1.06 1.09 1.17 1.44 1.46 1.44 1.76 1.42 1.43 1.94 1.49 1.50 1.61 1.51 1.56
N 50 45 47 50 50 48 50 50 49 47 49 38 36 49 48 Mean 1.06 1.09 1.17 1.44 1.46 1.44 1.76 1.42 1.43 1.94 1.49 1.50 1.61 1.51 1.56
DEMR Northeast
N 16 16 16 16 16 16 16 16 16 16 16 16 16 16 16 Mean 1.19 1.25 1.13 1.38 1.31 1.38 1.31 1.25 1.38 1.50 1.44 1.19 1.56 1.31 1.38
N 16 16 16 16 16 16 16 16 16 16 16 16 16 16 16 Mean 1.19 1.25 1.13 1.38 1.31 1.38 1.31 1.25 1.38 1.50 1.44 1.19 1.56 1.31 1.38
DFTG Northeast
N 167 153 161 160 165 167 164 166 159 154 160 94 99 165 158 Mean 1.10 1.23 1.24 1.49 1.63 1.45 1.74 1.52 1.57 1.86 1.61 1.63 1.68 1.54 1.65
Northwest
N 109 103 101 106 110 110 107 110 103 103 104 46 47 107 108 Mean 1.09 1.15 1.24 1.55 1.72 1.47 1.59 1.47 1.65 1.69 1.64 1.65 1.53 1.62 1.71
Houston Community College Office of Institutional Research
TP: SEOI_SPRING2008_WFC.spo Page 6 06/30/2008
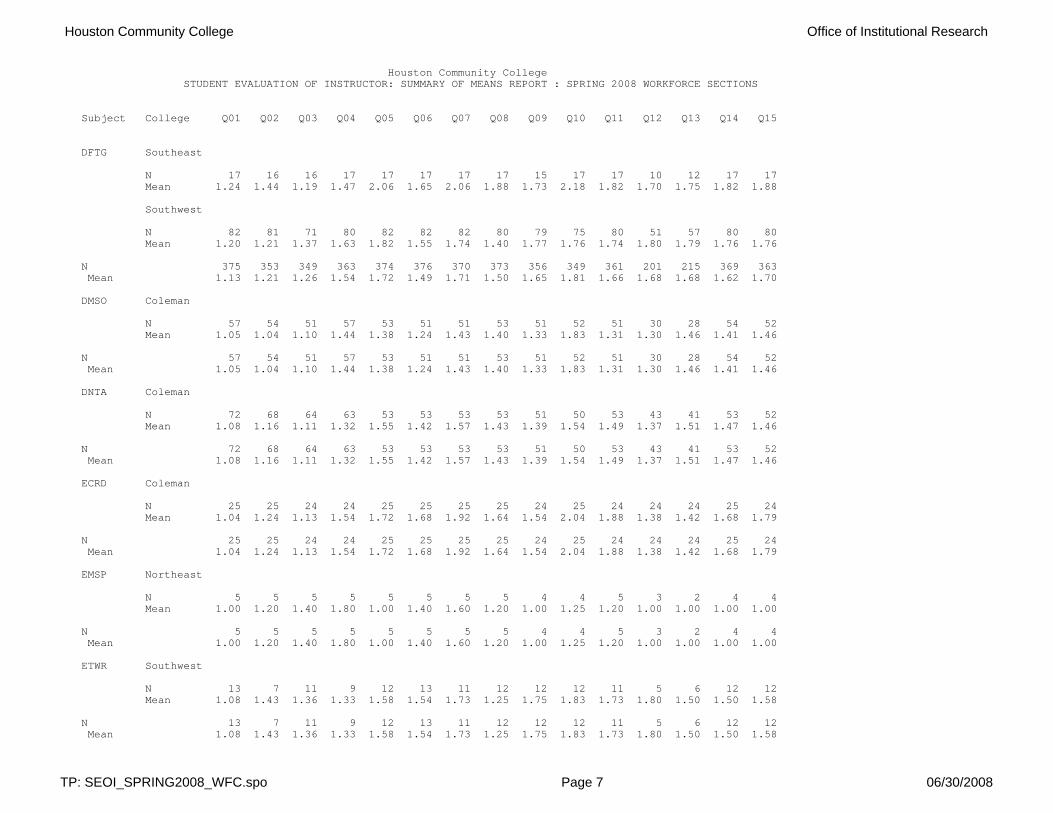
Houston Community College STUDENT EVALUATION OF INSTRUCTOR: SUMMARY OF MEANS REPORT : SPRING 2008 WORKFORCE SECTIONS
Subject College Q01 Q02 Q03 Q04 Q05 Q06 Q07 Q08 Q09 Q10 Q11 Q12 Q13 Q14 Q15
DFTG Southeast
N 17 16 16 17 17 17 17 17 15 17 17 10 12 17 17 Mean 1.24 1.44 1.19 1.47 2.06 1.65 2.06 1.88 1.73 2.18 1.82 1.70 1.75 1.82 1.88
Southwest
N 82 81 71 80 82 82 82 80 79 75 80 51 57 80 80 Mean 1.20 1.21 1.37 1.63 1.82 1.55 1.74 1.40 1.77 1.76 1.74 1.80 1.79 1.76 1.76
N 375 353 349 363 374 376 370 373 356 349 361 201 215 369 363 Mean 1.13 1.21 1.26 1.54 1.72 1.49 1.71 1.50 1.65 1.81 1.66 1.68 1.68 1.62 1.70
DMSO Coleman
N 57 54 51 57 53 51 51 53 51 52 51 30 28 54 52 Mean 1.05 1.04 1.10 1.44 1.38 1.24 1.43 1.40 1.33 1.83 1.31 1.30 1.46 1.41 1.46
N 57 54 51 57 53 51 51 53 51 52 51 30 28 54 52 Mean 1.05 1.04 1.10 1.44 1.38 1.24 1.43 1.40 1.33 1.83 1.31 1.30 1.46 1.41 1.46
DNTA Coleman
N 72 68 64 63 53 53 53 53 51 50 53 43 41 53 52 Mean 1.08 1.16 1.11 1.32 1.55 1.42 1.57 1.43 1.39 1.54 1.49 1.37 1.51 1.47 1.46
N 72 68 64 63 53 53 53 53 51 50 53 43 41 53 52 Mean 1.08 1.16 1.11 1.32 1.55 1.42 1.57 1.43 1.39 1.54 1.49 1.37 1.51 1.47 1.46
ECRD Coleman
N 25 25 24 24 25 25 25 25 24 25 24 24 24 25 24 Mean 1.04 1.24 1.13 1.54 1.72 1.68 1.92 1.64 1.54 2.04 1.88 1.38 1.42 1.68 1.79
N 25 25 24 24 25 25 25 25 24 25 24 24 24 25 24 Mean 1.04 1.24 1.13 1.54 1.72 1.68 1.92 1.64 1.54 2.04 1.88 1.38 1.42 1.68 1.79
EMSP Northeast
N 5 5 5 5 5 5 5 5 4 4 5 3 2 4 4 Mean 1.00 1.20 1.40 1.80 1.00 1.40 1.60 1.20 1.00 1.25 1.20 1.00 1.00 1.00 1.00
N 5 5 5 5 5 5 5 5 4 4 5 3 2 4 4 Mean 1.00 1.20 1.40 1.80 1.00 1.40 1.60 1.20 1.00 1.25 1.20 1.00 1.00 1.00 1.00
ETWR Southwest
N 13 7 11 9 12 13 11 12 12 12 11 5 6 12 12 Mean 1.08 1.43 1.36 1.33 1.58 1.54 1.73 1.25 1.75 1.83 1.73 1.80 1.50 1.50 1.58
N 13 7 11 9 12 13 11 12 12 12 11 5 6 12 12 Mean 1.08 1.43 1.36 1.33 1.58 1.54 1.73 1.25 1.75 1.83 1.73 1.80 1.50 1.50 1.58
Houston Community College Office of Institutional Research
TP: SEOI_SPRING2008_WFC.spo Page 7 06/30/2008

Houston Community College STUDENT EVALUATION OF INSTRUCTOR: SUMMARY OF MEANS REPORT : SPRING 2008 WORKFORCE SECTIONS
Subject College Q01 Q02 Q03 Q04 Q05 Q06 Q07 Q08 Q09 Q10 Q11 Q12 Q13 Q14 Q15
FITT Central
N 7 7 7 7 7 7 7 7 7 4 7 6 6 7 6 Mean 1.14 1.00 1.57 1.57 1.57 1.57 1.86 1.14 1.86 1.50 1.57 1.67 2.00 1.14 1.67
N 7 7 7 7 7 7 7 7 7 4 7 6 6 7 6 Mean 1.14 1.00 1.57 1.57 1.57 1.57 1.86 1.14 1.86 1.50 1.57 1.67 2.00 1.14 1.67
FLMC Northwest
N 90 87 88 91 91 90 89 90 89 84 90 49 48 91 88 Mean 1.13 1.18 1.23 1.44 1.56 1.40 1.65 1.36 1.43 1.49 1.51 1.41 1.40 1.45 1.52
N 90 87 88 91 91 90 89 90 89 84 90 49 48 91 88 Mean 1.13 1.18 1.23 1.44 1.56 1.40 1.65 1.36 1.43 1.49 1.51 1.41 1.40 1.45 1.52
FSHD Central
N 320 299 294 293 318 318 314 318 305 296 311 153 159 312 307 Mean 1.10 1.16 1.21 1.42 1.46 1.35 1.54 1.32 1.44 1.67 1.47 1.52 1.60 1.48 1.52
N 320 299 294 293 318 318 314 318 305 296 311 153 159 312 307 Mean 1.10 1.16 1.21 1.42 1.46 1.35 1.54 1.32 1.44 1.67 1.47 1.52 1.60 1.48 1.52
FSHN Central
N 69 70 65 68 69 70 69 70 64 65 67 34 36 70 70 Mean 1.12 1.11 1.15 1.41 1.46 1.40 1.57 1.41 1.66 1.83 1.63 1.65 1.67 1.47 1.56
N 69 70 65 68 69 70 69 70 64 65 67 34 36 70 70 Mean 1.12 1.11 1.15 1.41 1.46 1.40 1.57 1.41 1.66 1.83 1.63 1.65 1.67 1.47 1.56
GAME Southwest
N 82 80 75 72 82 81 82 82 73 77 82 45 47 82 81 Mean 1.15 1.34 1.28 1.42 1.54 1.51 1.59 1.57 1.64 1.81 1.74 1.73 1.70 1.56 1.65
N 82 80 75 72 82 81 82 82 73 77 82 45 47 82 81 Mean 1.15 1.34 1.28 1.42 1.54 1.51 1.59 1.57 1.64 1.81 1.74 1.73 1.70 1.56 1.65
GISC Southwest
N 42 26 40 33 40 40 39 42 40 35 39 20 25 42 41 Mean 1.14 1.35 1.18 1.70 1.95 1.55 1.85 1.79 1.93 1.91 2.13 2.00 1.88 1.93 2.20
N 42 26 40 33 40 40 39 42 40 35 39 20 25 42 41 Mean 1.14 1.35 1.18 1.70 1.95 1.55 1.85 1.79 1.93 1.91 2.13 2.00 1.88 1.93 2.20
HALT Northwest
N 21 20 19 20 21 21 21 21 20 21 21 15 16 21 21 Mean 1.10 1.20 1.26 1.40 1.71 1.24 1.33 1.38 1.40 1.71 1.43 1.60 1.38 1.52 1.48
Houston Community College Office of Institutional Research
TP: SEOI_SPRING2008_WFC.spo Page 8 06/30/2008

Houston Community College STUDENT EVALUATION OF INSTRUCTOR: SUMMARY OF MEANS REPORT : SPRING 2008 WORKFORCE SECTIONS
Subject College Q01 Q02 Q03 Q04 Q05 Q06 Q07 Q08 Q09 Q10 Q11 Q12 Q13 Q14 Q15
N 21 20 19 20 21 21 21 21 20 21 21 15 16 21 21 Mean 1.10 1.20 1.26 1.40 1.71 1.24 1.33 1.38 1.40 1.71 1.43 1.60 1.38 1.52 1.48
HAMG Central
N 60 50 58 57 60 60 59 59 58 59 56 36 37 60 55 Mean 1.10 1.20 1.21 1.25 1.33 1.28 1.31 1.27 1.28 1.76 1.38 1.58 1.54 1.30 1.40
N 60 50 58 57 60 60 59 59 58 59 56 36 37 60 55 Mean 1.10 1.20 1.21 1.25 1.33 1.28 1.31 1.27 1.28 1.76 1.38 1.58 1.54 1.30 1.40
HART Central
N 48 51 50 53 53 53 53 53 53 52 52 52 51 53 52 Mean 1.25 1.08 1.30 1.38 1.42 1.28 1.38 1.30 1.36 1.58 1.48 1.31 1.39 1.45 1.50
N 48 51 50 53 53 53 53 53 53 52 52 52 51 53 52 Mean 1.25 1.08 1.30 1.38 1.42 1.28 1.38 1.30 1.36 1.58 1.48 1.31 1.39 1.45 1.50
HITT Coleman
N 105 101 102 105 106 105 106 107 104 98 100 81 83 106 104 Mean 1.17 1.21 1.28 1.71 1.75 1.71 1.87 1.71 1.76 1.96 1.85 1.81 1.86 1.71 1.87
N 105 101 102 105 106 105 106 107 104 98 100 81 83 106 104 Mean 1.17 1.21 1.28 1.71 1.75 1.71 1.87 1.71 1.76 1.96 1.85 1.81 1.86 1.71 1.87
HLAB Coleman
N 32 32 31 32 32 32 32 32 32 31 32 30 30 31 30 Mean 1.09 1.19 1.13 1.47 1.69 1.50 1.66 1.41 1.53 1.71 1.69 1.33 1.40 1.42 1.40
N 32 32 31 32 32 32 32 32 32 31 32 30 30 31 30 Mean 1.09 1.19 1.13 1.47 1.69 1.50 1.66 1.41 1.53 1.71 1.69 1.33 1.40 1.42 1.40
HPRS Coleman
N 198 192 194 196 200 199 196 199 192 190 190 104 104 197 197 Mean 1.13 1.28 1.20 1.46 1.53 1.35 1.60 1.43 1.52 1.77 1.61 1.56 1.64 1.49 1.57
N 198 192 194 196 200 199 196 199 192 190 190 104 104 197 197 Mean 1.13 1.28 1.20 1.46 1.53 1.35 1.60 1.43 1.52 1.77 1.61 1.56 1.64 1.49 1.57
HRPO Central
N 44 44 40 45 45 45 43 45 44 43 45 12 12 45 44 Mean 1.00 1.11 1.13 1.51 1.62 1.42 1.72 1.31 1.36 1.95 1.49 2.17 2.08 1.51 1.59
Northeast
N 17 17 15 17 17 17 17 16 17 16 17 2 3 17 17 Mean 1.00 1.06 1.53 1.47 1.41 1.71 1.53 1.19 1.71 2.19 1.53 1.50 1.33 1.65 1.59
Houston Community College Office of Institutional Research
TP: SEOI_SPRING2008_WFC.spo Page 9 06/30/2008
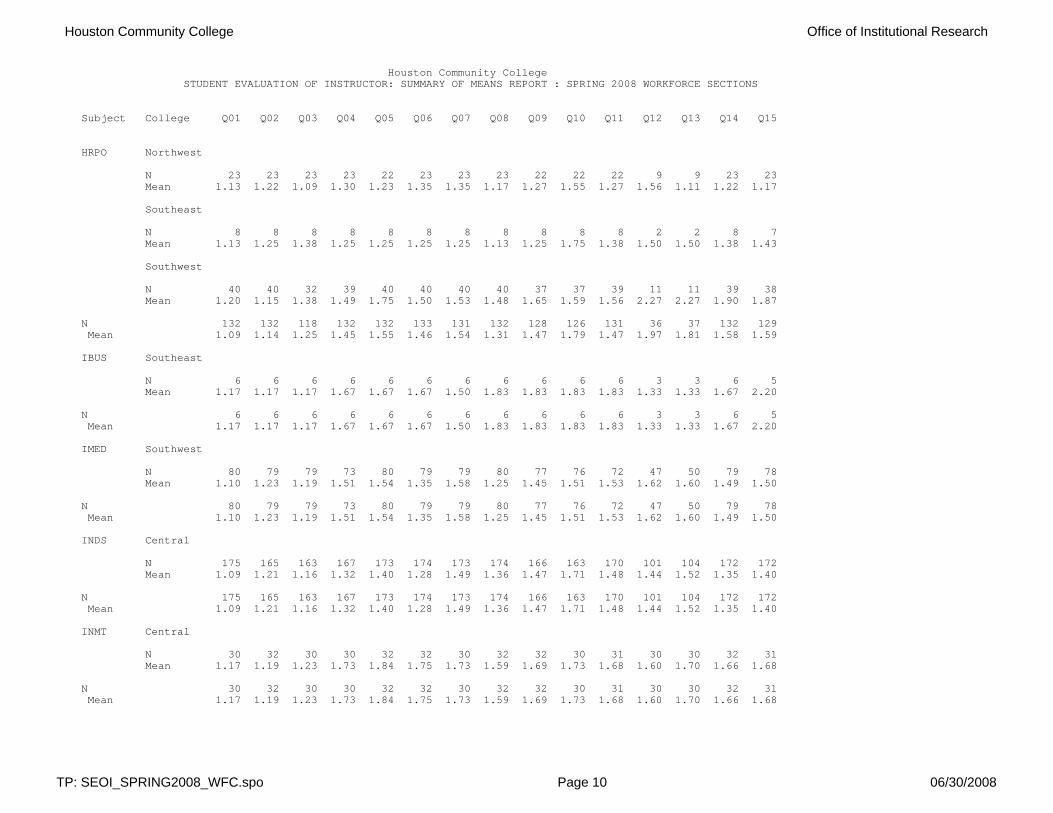
Houston Community College STUDENT EVALUATION OF INSTRUCTOR: SUMMARY OF MEANS REPORT : SPRING 2008 WORKFORCE SECTIONS
Subject College Q01 Q02 Q03 Q04 Q05 Q06 Q07 Q08 Q09 Q10 Q11 Q12 Q13 Q14 Q15
HRPO Northwest
N 23 23 23 23 22 23 23 23 22 22 22 9 9 23 23 Mean 1.13 1.22 1.09 1.30 1.23 1.35 1.35 1.17 1.27 1.55 1.27 1.56 1.11 1.22 1.17
Southeast
N 8 8 8 8 8 8 8 8 8 8 8 2 2 8 7 Mean 1.13 1.25 1.38 1.25 1.25 1.25 1.25 1.13 1.25 1.75 1.38 1.50 1.50 1.38 1.43
Southwest
N 40 40 32 39 40 40 40 40 37 37 39 11 11 39 38 Mean 1.20 1.15 1.38 1.49 1.75 1.50 1.53 1.48 1.65 1.59 1.56 2.27 2.27 1.90 1.87
N 132 132 118 132 132 133 131 132 128 126 131 36 37 132 129 Mean 1.09 1.14 1.25 1.45 1.55 1.46 1.54 1.31 1.47 1.79 1.47 1.97 1.81 1.58 1.59
IBUS Southeast
N 6 6 6 6 6 6 6 6 6 6 6 3 3 6 5 Mean 1.17 1.17 1.17 1.67 1.67 1.67 1.50 1.83 1.83 1.83 1.83 1.33 1.33 1.67 2.20
N 6 6 6 6 6 6 6 6 6 6 6 3 3 6 5 Mean 1.17 1.17 1.17 1.67 1.67 1.67 1.50 1.83 1.83 1.83 1.83 1.33 1.33 1.67 2.20
IMED Southwest
N 80 79 79 73 80 79 79 80 77 76 72 47 50 79 78 Mean 1.10 1.23 1.19 1.51 1.54 1.35 1.58 1.25 1.45 1.51 1.53 1.62 1.60 1.49 1.50
N 80 79 79 73 80 79 79 80 77 76 72 47 50 79 78 Mean 1.10 1.23 1.19 1.51 1.54 1.35 1.58 1.25 1.45 1.51 1.53 1.62 1.60 1.49 1.50
INDS Central
N 175 165 163 167 173 174 173 174 166 163 170 101 104 172 172 Mean 1.09 1.21 1.16 1.32 1.40 1.28 1.49 1.36 1.47 1.71 1.48 1.44 1.52 1.35 1.40
N 175 165 163 167 173 174 173 174 166 163 170 101 104 172 172 Mean 1.09 1.21 1.16 1.32 1.40 1.28 1.49 1.36 1.47 1.71 1.48 1.44 1.52 1.35 1.40
INMT Central
N 30 32 30 30 32 32 30 32 32 30 31 30 30 32 31 Mean 1.17 1.19 1.23 1.73 1.84 1.75 1.73 1.59 1.69 1.73 1.68 1.60 1.70 1.66 1.68
N 30 32 30 30 32 32 30 32 32 30 31 30 30 32 31 Mean 1.17 1.19 1.23 1.73 1.84 1.75 1.73 1.59 1.69 1.73 1.68 1.60 1.70 1.66 1.68
Houston Community College Office of Institutional Research
TP: SEOI_SPRING2008_WFC.spo Page 10 06/30/2008

Houston Community College STUDENT EVALUATION OF INSTRUCTOR: SUMMARY OF MEANS REPORT : SPRING 2008 WORKFORCE SECTIONS
Subject College Q01 Q02 Q03 Q04 Q05 Q06 Q07 Q08 Q09 Q10 Q11 Q12 Q13 Q14 Q15
INTC Northeast
N 9 9 9 9 9 9 9 9 9 9 9 3 2 9 9 Mean 1.33 1.33 1.00 1.67 1.67 1.44 1.67 1.44 2.00 1.56 1.67 1.00 1.00 1.56 1.56
N 9 9 9 9 9 9 9 9 9 9 9 3 2 9 9 Mean 1.33 1.33 1.00 1.67 1.67 1.44 1.67 1.44 2.00 1.56 1.67 1.00 1.00 1.56 1.56
ITCC Central
N 5 5 5 5 5 5 5 5 5 5 5 1 2 5 5 Mean 1.00 1.00 1.00 1.20 1.40 1.40 1.40 1.20 1.00 1.40 1.40 3.00 1.50 1.40 1.40
N 5 5 5 5 5 5 5 5 5 5 5 1 2 5 5 Mean 1.00 1.00 1.00 1.20 1.40 1.40 1.40 1.20 1.00 1.40 1.40 3.00 1.50 1.40 1.40
ITMT Central
N 10 10 9 10 10 10 9 10 10 10 10 6 8 10 10 Mean 1.00 1.10 1.11 1.30 1.40 1.30 1.44 1.20 1.50 1.50 1.30 1.67 1.75 1.40 1.40
N 10 10 9 10 10 10 9 10 10 10 10 6 8 10 10 Mean 1.00 1.10 1.11 1.30 1.40 1.30 1.44 1.20 1.50 1.50 1.30 1.67 1.75 1.40 1.40
ITNW Central
N 12 12 12 12 12 12 11 12 12 11 11 5 5 12 12 Mean 1.25 1.58 1.58 2.00 2.00 1.75 1.82 1.67 1.83 1.91 1.73 1.60 1.60 1.67 1.83
Northwest
N 9 7 8 9 9 9 9 9 9 9 9 8 9 9 9 Mean 1.22 1.86 1.63 2.00 2.33 2.00 2.11 1.78 2.22 2.22 2.33 2.13 2.11 2.22 2.11
N 21 19 20 21 21 21 20 21 21 20 20 13 14 21 21 Mean 1.24 1.68 1.60 2.00 2.14 1.86 1.95 1.71 2.00 2.05 2.00 1.92 1.93 1.90 1.95
ITSC Central
N 46 43 40 44 45 45 45 45 45 45 45 26 25 46 43 Mean 1.24 1.30 1.33 1.61 1.69 1.62 1.76 1.71 1.87 1.82 1.76 1.88 2.20 1.91 1.95
Northeast
N 14 14 12 14 14 14 14 14 14 14 14 4 4 14 14 Mean 1.00 1.00 1.08 1.07 1.07 1.21 1.36 1.21 1.43 1.21 1.29 1.50 1.75 1.43 1.29
Northwest
N 54 52 52 54 53 52 52 53 50 51 53 20 19 54 50 Mean 1.04 1.19 1.29 1.31 1.47 1.35 1.52 1.40 1.40 1.67 1.53 1.70 1.79 1.44 1.46
Houston Community College Office of Institutional Research
TP: SEOI_SPRING2008_WFC.spo Page 11 06/30/2008

Houston Community College STUDENT EVALUATION OF INSTRUCTOR: SUMMARY OF MEANS REPORT : SPRING 2008 WORKFORCE SECTIONS
Subject College Q01 Q02 Q03 Q04 Q05 Q06 Q07 Q08 Q09 Q10 Q11 Q12 Q13 Q14 Q15
ITSC Southeast
N 9 9 8 9 9 8 9 9 9 9 8 6 7 9 8 Mean 1.78 1.22 1.50 2.33 3.00 2.00 2.22 1.78 2.22 2.22 3.13 2.67 2.71 2.78 2.88
Southwest
N 92 90 88 87 92 91 90 90 85 85 91 32 31 90 85 Mean 1.02 1.12 1.13 1.34 1.55 1.34 1.57 1.27 1.49 1.62 1.53 1.44 1.52 1.51 1.55
N 215 208 200 208 213 210 210 211 203 204 211 88 86 213 200 Mean 1.10 1.17 1.22 1.42 1.59 1.42 1.61 1.41 1.58 1.68 1.62 1.72 1.88 1.63 1.65
ITSE Central
N 7 6 6 7 7 6 6 7 7 6 6 2 2 7 7 Mean 1.00 1.00 1.33 1.43 1.43 1.33 1.50 1.29 2.14 1.83 1.83 1.50 1.50 2.00 1.43
Southwest
N 34 34 33 32 34 34 32 34 33 32 32 19 20 34 34 Mean 1.06 1.18 1.15 1.69 1.56 1.44 1.75 1.29 1.39 1.69 1.53 1.42 1.45 1.44 1.56
N 41 40 39 39 41 40 38 41 40 38 38 21 22 41 41 Mean 1.05 1.15 1.18 1.64 1.54 1.43 1.71 1.29 1.53 1.71 1.58 1.43 1.45 1.54 1.54
ITSW Central
N 10 10 9 10 10 10 10 10 10 10 10 7 7 10 9 Mean 1.30 1.20 1.33 1.70 1.90 1.60 1.70 1.70 2.30 1.90 1.80 2.00 2.00 2.10 1.89
N 10 10 9 10 10 10 10 10 10 10 10 7 7 10 9 Mean 1.30 1.20 1.33 1.70 1.90 1.60 1.70 1.70 2.30 1.90 1.80 2.00 2.00 2.10 1.89
ITSY Central
N 12 12 12 12 12 12 12 12 12 12 11 6 6 12 12 Mean 1.00 1.17 1.00 1.33 1.33 1.25 1.42 1.33 1.25 1.58 1.27 1.83 1.33 1.33 1.58
N 12 12 12 12 12 12 12 12 12 12 11 6 6 12 12 Mean 1.00 1.17 1.00 1.33 1.33 1.25 1.42 1.33 1.25 1.58 1.27 1.83 1.33 1.33 1.58
KORE Northwest
N 5 5 5 5 5 5 5 5 5 5 5 2 2 5 5 Mean 1.20 1.20 1.20 1.40 1.40 1.40 1.60 1.40 1.60 1.80 1.60 2.50 2.00 1.40 1.60
N 5 5 5 5 5 5 5 5 5 5 5 2 2 5 5 Mean 1.20 1.20 1.20 1.40 1.40 1.40 1.60 1.40 1.60 1.80 1.60 2.50 2.00 1.40 1.60
Houston Community College Office of Institutional Research
TP: SEOI_SPRING2008_WFC.spo Page 12 06/30/2008
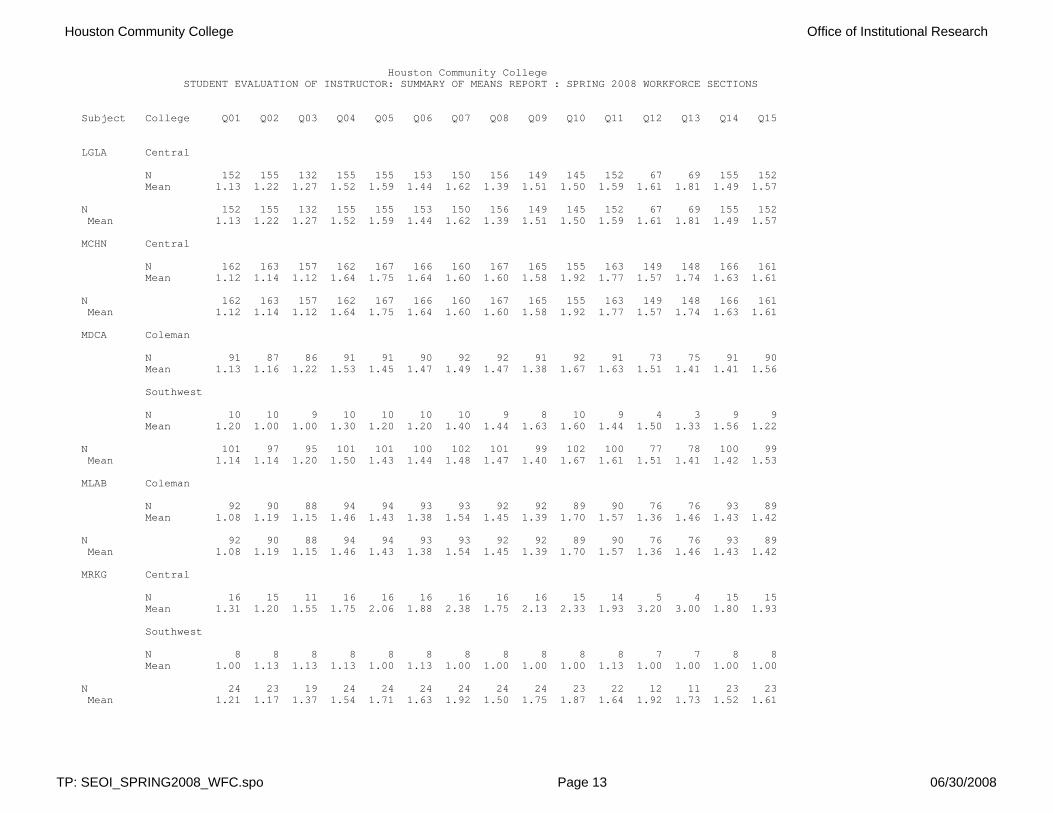
Houston Community College STUDENT EVALUATION OF INSTRUCTOR: SUMMARY OF MEANS REPORT : SPRING 2008 WORKFORCE SECTIONS
Subject College Q01 Q02 Q03 Q04 Q05 Q06 Q07 Q08 Q09 Q10 Q11 Q12 Q13 Q14 Q15
LGLA Central
N 152 155 132 155 155 153 150 156 149 145 152 67 69 155 152 Mean 1.13 1.22 1.27 1.52 1.59 1.44 1.62 1.39 1.51 1.50 1.59 1.61 1.81 1.49 1.57
N 152 155 132 155 155 153 150 156 149 145 152 67 69 155 152 Mean 1.13 1.22 1.27 1.52 1.59 1.44 1.62 1.39 1.51 1.50 1.59 1.61 1.81 1.49 1.57
MCHN Central
N 162 163 157 162 167 166 160 167 165 155 163 149 148 166 161 Mean 1.12 1.14 1.12 1.64 1.75 1.64 1.60 1.60 1.58 1.92 1.77 1.57 1.74 1.63 1.61
N 162 163 157 162 167 166 160 167 165 155 163 149 148 166 161 Mean 1.12 1.14 1.12 1.64 1.75 1.64 1.60 1.60 1.58 1.92 1.77 1.57 1.74 1.63 1.61
MDCA Coleman
N 91 87 86 91 91 90 92 92 91 92 91 73 75 91 90 Mean 1.13 1.16 1.22 1.53 1.45 1.47 1.49 1.47 1.38 1.67 1.63 1.51 1.41 1.41 1.56
Southwest
N 10 10 9 10 10 10 10 9 8 10 9 4 3 9 9 Mean 1.20 1.00 1.00 1.30 1.20 1.20 1.40 1.44 1.63 1.60 1.44 1.50 1.33 1.56 1.22
N 101 97 95 101 101 100 102 101 99 102 100 77 78 100 99 Mean 1.14 1.14 1.20 1.50 1.43 1.44 1.48 1.47 1.40 1.67 1.61 1.51 1.41 1.42 1.53
MLAB Coleman
N 92 90 88 94 94 93 93 92 92 89 90 76 76 93 89 Mean 1.08 1.19 1.15 1.46 1.43 1.38 1.54 1.45 1.39 1.70 1.57 1.36 1.46 1.43 1.42
N 92 90 88 94 94 93 93 92 92 89 90 76 76 93 89 Mean 1.08 1.19 1.15 1.46 1.43 1.38 1.54 1.45 1.39 1.70 1.57 1.36 1.46 1.43 1.42
MRKG Central
N 16 15 11 16 16 16 16 16 16 15 14 5 4 15 15 Mean 1.31 1.20 1.55 1.75 2.06 1.88 2.38 1.75 2.13 2.33 1.93 3.20 3.00 1.80 1.93
Southwest
N 8 8 8 8 8 8 8 8 8 8 8 7 7 8 8 Mean 1.00 1.13 1.13 1.13 1.00 1.13 1.00 1.00 1.00 1.00 1.13 1.00 1.00 1.00 1.00
N 24 23 19 24 24 24 24 24 24 23 22 12 11 23 23 Mean 1.21 1.17 1.37 1.54 1.71 1.63 1.92 1.50 1.75 1.87 1.64 1.92 1.73 1.52 1.61
Houston Community College Office of Institutional Research
TP: SEOI_SPRING2008_WFC.spo Page 13 06/30/2008

Houston Community College STUDENT EVALUATION OF INSTRUCTOR: SUMMARY OF MEANS REPORT : SPRING 2008 WORKFORCE SECTIONS
Subject College Q01 Q02 Q03 Q04 Q05 Q06 Q07 Q08 Q09 Q10 Q11 Q12 Q13 Q14 Q15
MUSB Northeast
N 9 9 8 9 9 9 9 9 9 9 9 1 1 9 9 Mean 1.00 1.00 1.25 1.22 1.22 1.22 1.44 1.33 1.33 1.44 1.44 1.00 1.00 1.56 1.44
Northwest
N 26 25 25 26 25 25 25 24 22 24 24 18 17 26 24 Mean 1.08 1.00 1.12 1.27 1.52 1.48 1.64 1.42 1.27 1.50 1.42 1.39 1.29 1.42 1.50
N 35 34 33 35 34 34 34 33 31 33 33 19 18 35 33 Mean 1.06 1.00 1.15 1.26 1.44 1.41 1.59 1.39 1.29 1.48 1.42 1.37 1.28 1.46 1.48
MUSC Central
N 6 5 5 6 6 5 6 6 5 4 6 0 0 6 6 Mean 1.00 1.20 1.80 1.50 1.33 1.60 2.83 1.17 1.40 2.25 2.00 . . 1.33 1.67
Northwest
N 157 135 141 157 158 158 157 156 149 146 153 122 122 156 154 Mean 1.14 1.38 1.21 1.55 1.69 1.55 1.73 1.60 1.67 1.81 1.80 1.75 1.70 1.58 1.65
N 163 140 146 163 164 163 163 162 154 150 159 122 122 162 160 Mean 1.13 1.37 1.23 1.55 1.68 1.55 1.77 1.59 1.66 1.82 1.81 1.75 1.70 1.57 1.65
MUSP Northwest
N 26 22 23 25 26 26 24 26 24 24 24 6 7 25 26 Mean 1.00 1.14 1.35 1.36 1.42 1.50 1.54 1.27 1.33 1.58 1.54 1.67 1.43 1.48 1.42
N 26 22 23 25 26 26 24 26 24 24 24 6 7 25 26 Mean 1.00 1.14 1.35 1.36 1.42 1.50 1.54 1.27 1.33 1.58 1.54 1.67 1.43 1.48 1.42
NMTT Coleman
N 89 88 86 89 89 88 89 89 87 87 88 55 56 89 86 Mean 1.10 1.27 1.23 1.48 1.52 1.40 1.70 1.28 1.37 1.59 1.43 1.49 1.54 1.38 1.44
N 89 88 86 89 89 88 89 89 87 87 88 55 56 89 86 Mean 1.10 1.27 1.23 1.48 1.52 1.40 1.70 1.28 1.37 1.59 1.43 1.49 1.54 1.38 1.44
OTHA Coleman
N 66 65 64 66 65 65 64 65 60 62 61 41 42 66 65 Mean 1.08 1.15 1.17 1.45 1.51 1.49 1.64 1.49 1.70 2.06 1.87 1.71 1.83 1.48 1.55
N 66 65 64 66 65 65 64 65 60 62 61 41 42 66 65 Mean 1.08 1.15 1.17 1.45 1.51 1.49 1.64 1.49 1.70 2.06 1.87 1.71 1.83 1.48 1.55
Houston Community College Office of Institutional Research
TP: SEOI_SPRING2008_WFC.spo Page 14 06/30/2008

Houston Community College STUDENT EVALUATION OF INSTRUCTOR: SUMMARY OF MEANS REPORT : SPRING 2008 WORKFORCE SECTIONS
Subject College Q01 Q02 Q03 Q04 Q05 Q06 Q07 Q08 Q09 Q10 Q11 Q12 Q13 Q14 Q15
PHRA Coleman
N 149 140 138 146 149 145 147 149 143 145 142 112 105 145 142 Mean 1.12 1.24 1.19 1.49 1.67 1.52 1.63 1.53 1.54 1.81 1.67 1.54 1.63 1.65 1.66
N 149 140 138 146 149 145 147 149 143 145 142 112 105 145 142 Mean 1.12 1.24 1.19 1.49 1.67 1.52 1.63 1.53 1.54 1.81 1.67 1.54 1.63 1.65 1.66
PHTC Southwest
N 9 9 9 9 9 9 9 9 9 9 9 3 2 9 9 Mean 1.33 1.00 1.33 1.89 2.11 1.78 1.89 1.22 1.33 1.78 1.44 3.33 3.50 2.00 2.22
N 9 9 9 9 9 9 9 9 9 9 9 3 2 9 9 Mean 1.33 1.00 1.33 1.89 2.11 1.78 1.89 1.22 1.33 1.78 1.44 3.33 3.50 2.00 2.22
POFI Central
N 12 12 10 12 11 12 12 12 12 12 12 9 10 12 12 Mean 1.00 1.08 1.10 1.50 1.00 1.33 1.50 1.33 1.17 1.50 1.50 1.67 1.50 1.50 1.50
Northeast
N 29 27 27 29 29 29 29 29 28 28 29 11 11 28 29 Mean 1.10 1.11 1.26 1.28 1.34 1.28 1.59 1.24 1.43 1.64 1.55 1.64 1.55 1.36 1.48
Northwest
N 13 12 12 13 13 13 13 13 13 10 13 5 5 13 13 Mean 1.00 1.08 1.17 1.15 1.15 1.15 1.31 1.08 1.23 1.30 1.23 1.60 1.40 1.31 1.08
Southeast
N 16 17 17 17 17 17 17 17 16 17 16 12 11 17 16 Mean 1.19 1.06 1.18 1.65 1.76 1.71 1.82 1.76 1.88 2.06 1.69 1.67 1.64 1.76 1.81
Southwest
N 75 73 65 75 74 74 74 75 72 68 74 33 32 74 72 Mean 1.05 1.05 1.32 1.57 1.61 1.43 1.54 1.39 1.53 1.93 1.59 1.64 1.78 1.69 1.72
N 145 141 131 146 144 145 145 146 141 135 144 70 69 144 142 Mean 1.07 1.07 1.26 1.48 1.49 1.40 1.56 1.37 1.49 1.80 1.56 1.64 1.65 1.58 1.61
POFM Central
N 14 14 14 14 14 13 14 14 14 14 14 12 11 13 12 Mean 1.07 1.00 1.21 1.21 1.43 1.23 1.50 1.21 1.14 1.36 1.29 1.33 1.27 1.38 1.25
Northeast
N 4 4 3 4 4 4 4 4 4 4 4 4 3 4 4
Houston Community College Office of Institutional Research
TP: SEOI_SPRING2008_WFC.spo Page 15 06/30/2008

Houston Community College STUDENT EVALUATION OF INSTRUCTOR: SUMMARY OF MEANS REPORT : SPRING 2008 WORKFORCE SECTIONS
Subject College Q01 Q02 Q03 Q04 Q05 Q06 Q07 Q08 Q09 Q10 Q11 Q12 Q13 Q14 Q15
Mean 1.00 1.00 1.00 1.50 1.50 1.25 1.25 1.75 1.50 1.50 1.25 1.75 2.00 1.75 1.25
POFM Southwest
N 9 9 8 9 9 8 8 8 8 8 8 3 3 8 8 Mean 1.11 1.33 1.00 1.22 1.22 1.13 1.25 1.25 1.25 2.00 1.25 1.67 1.67 1.38 1.38
N 27 27 25 27 27 25 26 26 26 26 26 19 17 25 24 Mean 1.07 1.11 1.12 1.26 1.37 1.20 1.38 1.31 1.23 1.58 1.27 1.47 1.47 1.44 1.29
POFT Central
N 20 20 19 20 20 20 19 19 20 20 20 11 11 20 20 Mean 1.05 1.15 1.32 1.55 1.60 1.45 1.58 1.47 1.50 1.50 1.50 1.18 1.45 1.45 1.55
Northeast
N 6 6 6 6 6 6 6 6 6 6 6 4 4 6 6 Mean 1.00 1.17 1.17 1.17 1.17 1.17 1.33 1.17 1.17 1.33 1.17 2.00 1.75 1.33 1.33
Northwest
N 10 10 10 10 10 10 9 10 10 10 10 3 3 10 10 Mean 1.00 1.30 1.30 1.40 1.70 1.60 1.56 1.20 1.50 1.60 1.70 1.67 2.00 1.50 1.40
Southeast
N 18 17 17 17 18 17 17 18 18 17 18 11 12 18 18 Mean 1.11 1.00 1.18 1.41 1.72 1.29 1.35 1.11 1.28 1.59 1.50 1.64 1.67 1.56 1.50
Southwest
N 22 22 20 22 22 22 22 22 21 21 22 12 13 22 20 Mean 1.27 1.14 1.20 1.36 1.50 1.50 1.68 1.32 1.48 1.62 1.68 1.50 1.46 1.59 1.55
N 76 75 72 75 76 75 73 75 75 74 76 41 43 76 74 Mean 1.12 1.13 1.24 1.41 1.58 1.43 1.53 1.28 1.41 1.55 1.55 1.51 1.58 1.51 1.50
PSTR Central
N 54 46 51 45 55 53 51 55 53 47 51 43 42 55 52 Mean 1.07 1.15 1.12 1.33 1.38 1.15 1.39 1.36 1.34 1.60 1.35 1.30 1.26 1.29 1.31
N 54 46 51 45 55 53 51 55 53 47 51 43 42 55 52 Mean 1.07 1.15 1.12 1.33 1.38 1.15 1.39 1.36 1.34 1.60 1.35 1.30 1.26 1.29 1.31
PTAC Northeast
N 35 35 34 35 35 35 35 34 35 34 34 15 15 35 35 Mean 1.00 1.11 1.12 1.37 1.31 1.31 1.37 1.18 1.37 1.76 1.38 1.33 1.27 1.40 1.37
N 35 35 34 35 35 35 35 34 35 34 34 15 15 35 35 Mean 1.00 1.11 1.12 1.37 1.31 1.31 1.37 1.18 1.37 1.76 1.38 1.33 1.27 1.40 1.37
Houston Community College Office of Institutional Research
TP: SEOI_SPRING2008_WFC.spo Page 16 06/30/2008

Houston Community College STUDENT EVALUATION OF INSTRUCTOR: SUMMARY OF MEANS REPORT : SPRING 2008 WORKFORCE SECTIONS
Subject College Q01 Q02 Q03 Q04 Q05 Q06 Q07 Q08 Q09 Q10 Q11 Q12 Q13 Q14 Q15
PTHA Coleman
N 94 89 86 90 94 92 94 93 92 91 92 63 62 91 90 Mean 1.18 1.27 1.33 1.52 1.83 1.61 1.93 1.61 1.57 1.89 1.64 1.62 1.66 1.71 1.92
N 94 89 86 90 94 92 94 93 92 91 92 63 62 91 90 Mean 1.18 1.27 1.33 1.52 1.83 1.61 1.93 1.61 1.57 1.89 1.64 1.62 1.66 1.71 1.92
PTRT Northeast
N 29 29 27 29 29 29 28 29 28 26 28 8 8 29 28 Mean 1.17 1.31 1.15 1.59 1.55 1.59 1.64 1.41 1.64 1.96 1.86 1.38 1.38 1.41 1.71
N 29 29 27 29 29 29 28 29 28 26 28 8 8 29 28 Mean 1.17 1.31 1.15 1.59 1.55 1.59 1.64 1.41 1.64 1.96 1.86 1.38 1.38 1.41 1.71
RADR Coleman
N 362 348 340 359 359 350 359 358 347 343 357 229 218 355 345 Mean 1.06 1.13 1.12 1.44 1.41 1.36 1.61 1.33 1.44 1.66 1.52 1.34 1.41 1.45 1.45
N 362 348 340 359 359 350 359 358 347 343 357 229 218 355 345 Mean 1.06 1.13 1.12 1.44 1.41 1.36 1.61 1.33 1.44 1.66 1.52 1.34 1.41 1.45 1.45
RELE Southeast
N 16 5 16 9 16 16 16 16 16 14 12 4 5 16 16 Mean 1.06 1.40 1.06 1.44 1.31 1.25 1.44 1.25 1.38 1.86 1.25 2.25 2.00 1.19 1.19
Southwest
N 44 21 40 35 45 44 43 45 45 38 39 16 16 44 42 Mean 1.09 1.48 1.05 1.34 1.20 1.14 1.23 1.11 1.20 1.26 1.28 1.25 1.06 1.20 1.29
N 60 26 56 44 61 60 59 61 61 52 51 20 21 60 58 Mean 1.08 1.46 1.05 1.36 1.23 1.17 1.29 1.15 1.25 1.42 1.27 1.45 1.29 1.20 1.26
RNSG Coleman
N 146 142 144 144 146 145 147 145 145 145 138 125 129 145 144 Mean 1.06 1.15 1.16 1.33 1.32 1.34 1.67 1.47 1.32 1.60 1.42 1.30 1.27 1.37 1.44
N 146 142 144 144 146 145 147 145 145 145 138 125 129 145 144 Mean 1.06 1.15 1.16 1.33 1.32 1.34 1.67 1.47 1.32 1.60 1.42 1.30 1.27 1.37 1.44
RSPT Coleman
N 128 125 124 129 129 129 129 128 126 125 128 85 82 128 125 Mean 1.06 1.15 1.19 1.32 1.43 1.36 1.40 1.31 1.34 1.54 1.34 1.40 1.39 1.38 1.36
N 128 125 124 129 129 129 129 128 126 125 128 85 82 128 125 Mean 1.06 1.15 1.19 1.32 1.43 1.36 1.40 1.31 1.34 1.54 1.34 1.40 1.39 1.38 1.36
Houston Community College Office of Institutional Research
TP: SEOI_SPRING2008_WFC.spo Page 17 06/30/2008

Houston Community College STUDENT EVALUATION OF INSTRUCTOR: SUMMARY OF MEANS REPORT : SPRING 2008 WORKFORCE SECTIONS
Subject College Q01 Q02 Q03 Q04 Q05 Q06 Q07 Q08 Q09 Q10 Q11 Q12 Q13 Q14 Q15
RSTO Central
N 82 77 79 82 82 80 80 82 79 77 82 53 53 80 81 Mean 1.06 1.19 1.10 1.29 1.29 1.39 1.46 1.20 1.39 1.43 1.41 1.57 1.55 1.31 1.26
N 82 77 79 82 82 80 80 82 79 77 82 53 53 80 81 Mean 1.06 1.19 1.10 1.29 1.29 1.39 1.46 1.20 1.39 1.43 1.41 1.57 1.55 1.31 1.26
RTVB Northwest
N 123 114 119 120 123 123 119 122 115 113 115 61 63 122 121 Mean 1.09 1.17 1.29 1.38 1.54 1.40 1.62 1.35 1.42 1.46 1.46 1.33 1.40 1.44 1.49
Southwest
N 27 27 27 27 27 27 27 27 27 27 26 14 16 27 27 Mean 1.04 1.26 1.26 1.63 1.59 1.44 1.74 1.44 1.48 1.52 1.62 1.57 1.56 1.63 1.63
N 150 141 146 147 150 150 146 149 142 140 141 75 79 149 148 Mean 1.08 1.18 1.29 1.43 1.55 1.41 1.64 1.37 1.43 1.47 1.49 1.37 1.43 1.48 1.51
SCIT Coleman
N 26 26 26 26 26 26 26 25 26 26 26 24 25 26 22 Mean 1.27 1.31 1.27 1.65 1.69 1.65 1.81 1.84 1.77 2.15 1.81 1.50 1.72 1.81 2.14
N 26 26 26 26 26 26 26 25 26 26 26 24 25 26 22 Mean 1.27 1.31 1.27 1.65 1.69 1.65 1.81 1.84 1.77 2.15 1.81 1.50 1.72 1.81 2.14
SLNG Coleman
N 60 48 55 57 56 59 58 58 58 56 57 33 36 59 57 Mean 1.08 1.17 1.24 1.70 1.80 1.68 1.88 1.69 1.79 2.11 1.86 1.85 1.78 1.76 1.75
N 60 48 55 57 56 59 58 58 58 56 57 33 36 59 57 Mean 1.08 1.17 1.24 1.70 1.80 1.68 1.88 1.69 1.79 2.11 1.86 1.85 1.78 1.76 1.75
SRGT Coleman
N 119 111 110 112 120 116 120 117 118 117 117 95 87 111 115 Mean 1.26 1.31 1.42 1.76 1.94 1.68 2.15 1.78 1.95 2.09 1.99 1.60 1.56 1.73 2.03
N 119 111 110 112 120 116 120 117 118 117 117 95 87 111 115 Mean 1.26 1.31 1.42 1.76 1.94 1.68 2.15 1.78 1.95 2.09 1.99 1.60 1.56 1.73 2.03
TRVM Central
N 46 40 40 42 45 44 44 45 43 44 43 31 30 44 43 Mean 1.09 1.28 1.35 1.38 1.67 1.52 1.55 1.64 1.49 1.70 1.56 1.45 1.47 1.68 1.72
N 46 40 40 42 45 44 44 45 43 44 43 31 30 44 43 Mean 1.09 1.28 1.35 1.38 1.67 1.52 1.55 1.64 1.49 1.70 1.56 1.45 1.47 1.68 1.72
Houston Community College Office of Institutional Research
TP: SEOI_SPRING2008_WFC.spo Page 18 06/30/2008

Houston Community College STUDENT EVALUATION OF INSTRUCTOR: SUMMARY OF MEANS REPORT : SPRING 2008 WORKFORCE SECTIONS
Subject College Q01 Q02 Q03 Q04 Q05 Q06 Q07 Q08 Q09 Q10 Q11 Q12 Q13 Q14 Q15
VNSG Coleman
N 467 442 432 454 463 456 452 461 452 438 441 303 290 461 450 Mean 1.13 1.25 1.25 1.58 1.56 1.52 1.75 1.47 1.46 1.77 1.58 1.52 1.60 1.54 1.61
N 467 442 432 454 463 456 452 461 452 438 441 303 290 461 450 Mean 1.13 1.25 1.25 1.58 1.56 1.52 1.75 1.47 1.46 1.77 1.58 1.52 1.60 1.54 1.61
VTHT Northwest
N 47 45 47 47 47 47 47 47 47 47 47 44 43 46 46 Mean 1.04 1.02 1.04 1.11 1.09 1.11 1.26 1.00 1.06 1.55 1.19 1.09 1.02 1.07 1.02
N 47 45 47 47 47 47 47 47 47 47 47 44 43 46 46 Mean 1.04 1.02 1.04 1.11 1.09 1.11 1.26 1.00 1.06 1.55 1.19 1.09 1.02 1.07 1.02
WLDG Central
N 2 2 2 2 2 2 2 2 2 2 2 0 0 2 2 Mean 1.00 1.00 1.00 1.00 1.00 1.00 1.00 1.00 1.50 1.00 1.00 . . 1.00 1.00
N 2 2 2 2 2 2 2 2 2 2 2 0 0 2 2 Mean 1.00 1.00 1.00 1.00 1.00 1.00 1.00 1.00 1.50 1.00 1.00 . . 1.00 1.00
Houston Community College Office of Institutional Research
TP: SEOI_SPRING2008_WFC.spo Page 19 06/30/2008
Houston Community College SEOI – Instructor Office of Institutional Research Updated on: 1/06/03
INSTRUCTOR’S DIRECTIONS
Enclosed are two sets of forms. All students are requested to complete an SEOI Questionnaire. The Written Comments form is optional. Please do not staple the forms together. 1. Specify an individual and location for the student proctor to return completed surveys, usually a department or campus office. 2. Recruit a student proctor to conduct the survey. Review with the student proctor their directions as the proctor (see Student Proctor's Directions). 3. Give the survey packet to the student proctor. Inform the student proctor about the return
of the surveys (name of individual and location). In order to ensure proper handling of SEOI forms, be sure to give the student proctor the envelope in which the survey materials were received. This is the return envelope.
4. Write your name and the Class number (not the course number) on the blackboard.
Explain to your students that the purpose of this survey is to improve certain aspects of the course and to help you improve the way you teach. Please be sure to explain that the survey is anonymous. Under no circumstances will the instructor know the student’s identity. Introduce the student proctor to the class.
5. Leave the room and do not return until the students have completed and turned in their surveys to the student proctor. The proctor is responsible for turning the materials in. Please make sure the student proctor understands where to turn in the survey packet.
If you have any questions regarding these directions please call 713-718-6259

Houston Community College SEOI – Proctor Office of Institutional Research Updated on: 1/06/03
STUDENT PROCTOR’S DIRECTIONS
Enclosed are two sets of forms. All students are requested to complete an SEOI Questionnaire. The Written Comments form is optional. Please do not staple the forms together. 1. Make sure that the Class number that the instructor wrote on the board matches the class
number on the survey packet. After the instructor has left the room, pass out both sheets of the Student Evaluation of Instruction (SEOI) survey. Keep any extra forms in your possession.
2. Read “Statement of Intent” to the students:
This survey instrument has been designed to identify strengths and weaknesses of your instructor and your perceptions of the effectiveness of the class instruction. Please give us your serious and fair evaluation of both your and class instruction.
3. Read the following instructions to the students:
• Use only a #2 pencil or a blue or black ink pen. • Write the instructor’s name and bubble in the Class number in the upper
right corner of the Questionnaire and the Written Comments sheet, if used. (Check to see that this is being done properly.)
• Fill out the Questionnaire independently, without consultation with other students. • Do not sign your name or leave any marks of identification on the answer sheet. • If this is a lecture class, you do not need to complete Section III. If this is a lab, clinical, workshop or practicum class complete all sections. • Written comments are optional but very much encouraged.
4. When students have completed the survey, collect the forms, place them face up in the
same direction, and place both completed and unused forms into the original envelope and close it.
5. Return the envelope (containing all forms) to the location and individual specified by
your instructor. (This is most likely the department or campus secretary) Do not return the forms to the instructor.

Click here to view the SEOI Survey Instrument.

Houston Community College Office of Institutional Research
INFORMATION SHEET - STUDENT EVALUATION OF INSTRUCTION (SEOI) PROGRAM
HOW TO READ THE INDIVIDUAL INSTRUCTOR REPORT
Your individual evaluation report contains the following information: • Name, Class Number (CRN), Course Title, Course Number • Question identification numbers (Q01 – Q15) appear across the top of the evaluation report. The
numbers correspond with the items on the standard questionnaire forms. • TOTAL - The "TOTAL " row shown reflects the total number of students in a specific course who
responded to each item. The numbers underneath "TOTAL" correspond to the items on the answer scale for the standard questionnaire.
Values for the answer scale to Questions 01-03: 1 = YES 2 = NEUTRAL 3 = NO 4 = NO BASIS FOR JUDGMENT
Values for the answer scale to Questions 04-15: 1 = STRONGLY AGREE 2 = AGREE 3 = NEUTRAL 4 = DISAGREE 5 = STRONGLY DISAGREE 6 = NO BASIS FOR JUDGMENT
• MEAN - Averaged scores for each questionnaire item per individual class. At the bottom of the last page for each report, you will find cumulative statistics which provide the following information: • TOT. FREQ (total frequency) - Indicates the cumulative sum of students from your combined classes who
responded to each item. • TOTAL MEAN - Indicates combined mean scores for each questionnaire item for all your classes. • SYST MEAN – Indicates the combined mean scores on each questionnaire item for your discipline across the
entire college system. NOTE: If you taught more than one course during the semester, the data for those courses appear on the printout under the respective course numbers. Now, turn to the other side of this sheet for an illustration of how to read your report.

Houston Community College Office of Institutional Research
HOUSTON COMMUNITY COLLEGE SYSTEM STUDENT EVALUATION REPORT - BY INSTRUCTOR
NAME CRN Q01 Q02 Q03 Q4 ……. Q12 Q13 Q14 Q15 DOE, J. M. 54321 ABCD 2301 TOTAL 8 8 8 8 ……. 8 0 0 0 1 3 7 7 3 7 0 0 0 2 3 1 0 3 1 0 0 0 3 2 0 1 2 0 0 0 0 MEAN 1.87 1.12 1.25 1.25 1.12 0 0 0 TOT. FREQ 8 8 8 8 ……. 8 0 0 0 1 3 7 7 3 7 0 0 0 2 3 1 0 3 1 0 0 0 3 2 0 1 2 0 0 0 0 TOTAL MEAN 1.87 1.12 1.12 1.87 ……. 1.12 0 0 0 SYST MEAN 1.85 1.20 1.19 1.85 1.17 0 0 0
FOR QUESTIONS 01 - 03: Look at the TOTAL Now look under the column Q01: • Eight students responded to questionnaire item
one. • Three students answered "Yes" to Question 1. • Three students answered "Neutral" to Question 1. • Two students answered "No" to Question 1. • None of the students answered "No Basis for
Judgement" to Question 1. There are four possible answers to Q1-Q3, but if a field is not populated, it does not appear on the report.
FOR QUESTIONS 04 - 15: Look at the TOTAL.
Now look under the column Q04: • Eight students responded to questionnaire item
four. • Three students answered "Strongly Agree" to
Question 4. • Three students answered "Agree" to Question 4. • Two students answered "Neutral" to Question 4 • None of the students answered "Disagree",
"Strongly Disagree", or "No Basis for Judgement" to Question 4. There are six possible answers to Q4-Q15, but if a field is not populated, it does not appear on the report.
Look at the TOT. FREQ row that (number of responses). Now look under column Q01: • The total number of responses for all classes taught by the instructor is eight. In the example, the number for the
cumulative statistic is the same because the instructor only taught one class. For an instructor who taught more than one class, the cumulative statistics would reflect the total responses received from all students taught during the semester.
The System mean is the cumulative average for all instructors from the appropriate teaching area who participated in the program during the semester. These figures provide comparative performance information.