RESULTS OF OPERATIONS FOR THE NINE MONTHS ENDED …
25
Contact: IR Group Global Management Promotion Dept. 2‐47, Shikitsuhigashi 1‐chome, Naniwa‐ku, Osaka 556‐8601, Japan Phone: +81‐6‐6648‐2645 FOR IMMEDIATE RELEASE February 16, 2016 ‐1‐ Kubota Corporation reported its consolidated results for the nine months ended December 31, 2015 today. Consolidated Financial Highlights RESULTS OF OPERATIONS FOR THE NINE MONTHS ENDED DECEMBER 31, 2015 1. Consolidated results of operations for the nine months ended December 31, 2015 (1) Results of operations (In millions of yen, except per common share amounts) Adjusted change [%] [%] Consolidated Financial Highlights Change Nine months ended Dec. 31, 2015 Year ended Mar. 31, 2015 [%] [%] Revenues ¥ 1,244,775 9.2 4.9 Operating income ¥ 166,874 13.4 (0.4) % of revenues 13.4% 12.8% Income before income taxes and equity in net income of affiliated companies ¥ 169,504 8.5 (0.8) % of revenues 13.6% 13.3% Net income attributable to Kubota Corporation ¥ 110,107 9.8 5.2 ¥ 139,534 ¥ 210,709 ¥ 203,105 ¥ 1,584,265 Net income attributable to Kubota Corporation ¥ 110,107 9.8 5.2 % of revenues 8.8% 8.8% Net income attributable to Kubota Corporation per common share: Basic ¥ 88.47 Diluted ‐ Ratio of net income attributable to Kubota Corporation to shareholders' equity 9.8% Ratio of income before income taxes and 13.7% ‐ ¥ 111.68 ¥ 139,534 equity in net income of affiliated companies to total assets 6.8% (2) Financial position (In millions of yen, except per common share amounts) Total assets Equity ¥ 1,218,558 Dec. 31, 2015 Mar. 31, 2015 9.2% ¥ 2,533,002 ¥ 2,472,258 ¥ 1,178,466 Kubota Corporation shareholders' equity Ratio of Kubota Corporation shareholders' equity to total assets Kubota Corporation shareholders' equity per common share (3) Summary of statements of cash flows (In millions of yen) Net cash provided by operating activities ¥ 1,140,310 ¥ 916.28 44.5% ¥ 1,100,079 Nine months ended Dec. 31, 2015 Year ended ¥ 197 040 ¥ 85 880 Mar. 31, 2015 ¥ 883.10 45.0% Net cash providedby operating activities Net cash used in investing activities Net cash provided by (used in) financing activities Cash and cash equivalents, end of period ( ¥ 130,307) ( ¥ 117,227) ¥ 112,428 ¥ 197,040 ¥ 85,880 ( ¥ 27,671) ¥ 47,994 ¥ 146,286 ‐1‐
Transcript of RESULTS OF OPERATIONS FOR THE NINE MONTHS ENDED …

Contact: IR GroupGlobal Management Promotion Dept.2‐47, Shikitsuhigashi 1‐chome,Naniwa‐ku, Osaka 556‐8601, JapanPhone: +81‐6‐6648‐2645
FOR IMMEDIATE RELEASE February 16, 2016
‐1‐
Kubota Corporation reported its consolidated results for the nine months ended December 31, 2015 today.
Consolidated Financial Highlights
RESULTS OF OPERATIONS FOR THE NINE MONTHS ENDED DECEMBER 31, 2015
1. Consolidated results of operations for the nine months ended December 31, 2015
(1) Results of operations (In millions of yen, except per common share amounts)
Adjusted
change
[%] [%]
Consolidated Financial Highlights
ChangeNine months ended
Dec. 31, 2015
Year ended
Mar. 31, 2015[%] [%]
Revenues ¥ 1,244,775 9.2 4.9
Operating income ¥ 166,874 13.4 (0.4)
% of revenues 13.4% 12.8%
Income before income taxes and
equity in net income of affiliated companies ¥ 169,504 8.5 (0.8)
% of revenues 13.6% 13.3%
Net income attributable to Kubota Corporation ¥ 110,107 9.8 5.2¥ 139,534
¥ 210,709
¥ 203,105
¥ 1,584,265
Net income attributable to Kubota Corporation ¥ 110,107 9.8 5.2
% of revenues 8.8% 8.8%
Net income attributable to Kubota Corporation per common share:
Basic ¥ 88.47
Diluted ‐
Ratio of net income attributable to Kubota Corporation
to shareholders' equity 9.8%
Ratio of income before income taxes and
13.7%
‐
¥ 111.68
¥ 139,534
equity in net income of affiliated companies to total assets 6.8%
(2) Financial position (In millions of yen, except per common share amounts)
Total assets
Equity ¥ 1,218,558
Dec. 31, 2015 Mar. 31, 2015
9.2%
¥ 2,533,002 ¥ 2,472,258
¥ 1,178,466
Kubota Corporation shareholders' equity
Ratio of Kubota Corporation shareholders' equity to total assets
Kubota Corporation shareholders' equity per common share
(3) Summary of statements of cash flows (In millions of yen)
Net cash provided by operating activities
¥ 1,140,310
¥ 916.28
44.5%
¥ 1,100,079
Nine months ended
Dec. 31, 2015
Year ended
¥ 197 040 ¥ 85 880
Mar. 31, 2015
¥ 883.10
45.0%
Net cash provided by operating activities
Net cash used in investing activities
Net cash provided by (used in) financing activities
Cash and cash equivalents, end of period
( ¥ 130,307) ( ¥ 117,227)
¥ 112,428
¥ 197,040 ¥ 85,880
( ¥ 27,671) ¥ 47,994
¥ 146,286
‐1‐

Kubota Corporation
and its Subsidiaries
Notes:
1.
2.
3.
4.
5.
2. Cash dividends (In millions of yen except per common share amounts)
Nine months ended Dec. 31, 2015Year ended Mar. 31, 2015
Note:
3. Anticipated results of operations for the year ending December 31, 2016
(In millions of yen except per common share amounts)
Revenues
Operating income
Income before income taxes and
equity in net income of affiliated companies
Net income attributable to Kubota Corporation
Net income attributable to Kubota Corporation
per common share
Notes:
1.
¥ 235,000
Due to the change in the fiscal year‐end, the business term for this fiscal year was the nine‐month period that commenced on
April 1, 2015 and ended on December 31, 2015. For this reason, adjusted change [%] for the six months ending June 30, 2016
and for the year ending December 31, 2016, represents percentage change from the same period in the prior year (unaudited),
which is the six‐month period and the 12‐month period that commenced on January 1, 2015 and ended on June 30 and
December 31, 2015, respectively.
Equity in net income of affiliated companies for the nine months ended December 31, 2015 was \2,009 million and the year
ended March 31, 2015 was \1,748 million.
Comprehensive income for the nine months ended December 31, 2015 was \82,060 million [adjusted change (57.0%)] and the
year ended March 31, 2015 was \228,886 million [21.7%].
The results of operations in the prior year, such as results for the year ended March 31, 2015 and financial position as of March
31, 2015 have been retrospectively adjusted, as described in the accompanying materials, "4. Consolidated financial statements
(7) Notes to consolidated financial statements" on page 16.
Annual cash
dividends
as % to share‐
holders' equity
5.4
[%]
25.1% 3.4%
Adjusted change
¥ 34,939
¥ 1,750,000
2.
- ¥ 14.00 ¥ 28.00
Year‐end Total
Although Kubota Corporation's basic policy for the return of profit to shareholders is to maintain stable dividends and raise
dividends, the specific amount of cash dividends for each fiscal year is decided in consideration of the development of business
performance, financial condition, and shareholder return ratio calculated from dividends and retirement of own shares.
3.6
June 30, 2016 [%]
Year ending
Dec. 31, 2016
31.6%
¥ 240,000 7.1
¥ 124.55
¥ 880,000 3.1
¥ 77,000 (1.9)
¥ 61.87
¥ 117,000 1.5
¥ 120,000 2.3
¥ 155,000 3.8
Please refer to the accompany materials, "1. Review of operations and financial condition (1) Review of operations c) Prospects
for the year ending December 31, 2016" on page 6 for further information related to the anticipated results of operations.
Six months ending Adjusted change
-
-
3.1%
Cash dividends per common shareAnnual
cash dividends
Payout
ratioFirst
quarter
period
Change [%] represents percentage change from the prior year.
¥ 14.00
¥ 12.00 -
Second
quarter
period
Third
quarter
period
¥ 16.00 ¥ 28.00
¥ 34,857
At the 125th Ordinary General Meeting of Shareholders held on June 19, 2015, a partial amendment to the Articles of
Incorporation was resolved. Accordingly, Kubota Corporation changed its fiscal year‐end from March 31 to December 31, from
the 126th business term. The same change in the fiscal year‐end was made to subsidiaries in Japan that had fiscal year‐ends
other than December 31.
For this reason, the results of operations for the 126th business term, a transitional period for the change in the fiscal year‐end,
represent the results for the nine‐month period that commenced on April 1, 2015 and ended on December 31, 2015.
Additionally, adjusted change [%] for the nine months ended December 31, 2015 represents percentage change from the same
period last year that commenced on April 1, 2014 and ended on December 31, 2014. Furthermore, the results of operations for
the same period last year are presented on the consolidated financial statements and other materials as reference.
‐2‐

Kubota Corporation
and its Subsidiaries
4. Other
(1) Changes in material subsidiaries: No
(2) Changes in accounting principles, procedures, and presentations for consolidated financial statements
a) Changes due to the revision of accounting standards, etc.: No
b) Changes in matters other than a) above: Yes
Note: Please refer to the accompanying materials "4. Consolidated financial statements (7) Notes to consolidated financial
statements" on page 16 for further details.
‐3‐
(3) Number of common shares issued including treasury stock as of December 31, 2015 :
Number of common shares issued including treasury stock as of March 31, 2015 :
Number of treasury stock as of December 31, 2015 :
Number of treasury stock as of March 31, 2015 :
Weighted average number of common shares outstanding during the nine months ended December 31, 2015 :
Weighted average number of common shares outstanding during the year ended March 31, 2015 :
Note: Please refer to the accompanying materials "4. Consolidated financial statements (9) Per common share information"
on page 20
1,244,521,893
1,249,363,232
1,244,919,180
1,246,219,180
415,635
518,708
(Reference) Non‐consolidated Financial Highlights
(1) Results of operations (In millions of yen except per common share amounts)Change
[%] [%]
Net sales ¥ 575,127 3.8 1.5
O ti i ¥ 42 811 (12 0) (11 2)
Nine months ended Year ended
Dec. 31, 2015 Mar. 31, 2015
Adjusted change
¥ 776,518
¥ 66 968
on page 20.
Operating income ¥ 42,811 (12.0) (11.2)
Ordinary income ¥ 64,411 (10.3) (7.1)
Net income ¥ 47,426 (9.2) (0.8)
Net income per common share
Basic ¥ 38.09
Diluted ‐
Note:
1. Change [%] represents percentage change from the prior year.
¥ 66,968
¥ 92,768
¥ 65,939
¥ 52.76
‐
1. Change [%] represents percentage change from the prior year.
2.
(2) Financial position (In millions of yen except per common share amounts)
Kubota Corporation changed its fiscal year‐end from March 31 to December 31, from the 126th business term.
For this reason, the results of operations for the 126th business term, a transitional period for the change in the fiscal year‐
end, represent the results for the nine‐month period that commenced on April 1, 2015 and ended on December 31, 2015.
Additionally, adjusted change [%] for the nine months ended December 31, 2015 represents percentage change from the
same period last year that commenced on April 1, 2014 and ended on December 31, 2014.
Total assets
Net assets
Equity
Ratio of equity to total assets
Net assets per common share
(Information on status of the audit by the independent auditor)
Dec. 31, 2015 Mar. 31, 2015
¥ 448.27
¥ 1,027,461
¥ 555,810
¥ 555,810
54.1%
¥ 446.47
¥ 1,007,561
¥ 558,596
¥ 558,596
55.4%
(Information on status of the audit by the independent auditor)
This release has not been audited in accordance with the Financial Instruments and Exchange Law of Japan by the independent
auditor because this release is not subject to audit.
As of the date of this release, the consolidated financial statements for the nine months ended December 31, 2015 of Kubota
Corporation and its subsidiaries (hereinafter, the “Company”) are under procedures of the audit.
< Cautionary Statements with Respect to Forward‐Looking Statements >This document may contain forward‐looking statements that are based on management’s expectations, estimates, projections and assumptions. These statements are not guarantees of future performance and involve certain risks and uncertainties, which are difficult to predict. Therefore, t l f t lt diff t i ll f h t i f t i f d l ki t t t d t i t f f t i l di ith t
This document may contain forward‐looking statements that are based on management’s expectations, estimates, projections and assumptions. These statements are not guarantees of future performance and involve certain risks and uncertainties, which are difficult to predict. Therefore, actual future results may differ materially from what is forecast in forward‐looking statements due to a variety of factors, including, without limitation: general economic conditions in the Company's markets, particularly government agricultural policies, levels of capital expenditures both in public and private sectors, foreign currency exchange rates, the occurrence of natural disasters, continued competitive pricing pressures in the marketplace, as well as the Company's ability to continue to gain acceptance of its products.
‐3‐

Kubota Corporation
and its Subsidiaries
1. Review of operations and financial condition ………………………………………………………………………………………… 5
(1) Review of operations ……………………………………………………………………………………………………………………. 5
(2) Financial condition ……………………………………………………………………………………………………………………..... 7
2. Management policies ……………………………………………………………………………………………………………………........ 9
(1) Basic management policy ……………………………………………………………………………………………………………… 9
(2) Priority measures for medium‐to‐long‐term growth in profit ………………………………………………………… 9
3. Basic rationale for selection of accounting standards …………………………………………………………………………… 10
4. Consolidated financial statements ………………………………………………………………………………………………………… 11
(1) Consolidated balance sheets ………………………………………………………………………………………………………… 11
(2) Consolidated statements of income ……………………………………………………………………………………………… 13
(3) Consolidated statements of comprehensive income (loss) …………………………………………………………… 14
(4) Consolidated statements of changes in equity ……………………………………………………………………………… 14
(5) Consolidated statements of cash flows ………………………………………………………………………………………… 15
(6) Notes to assumption for going concern ………………………………………………………………………………………… 16
(7) Notes to consolidated financial statements …………………………………………………………………………………… 16
(8) Consolidated segment information ………………………………………………………………………………………………… 18
(9) Per common share information ……………………………………………………………………………………………………… 20
(10) Subsequent events …………………………………………………………………………………………………………………….... 20
(11) Consolidated revenues by product group ……………………………………………………………………………………… 21
(12) Anticipated consolidated revenues by reporting segment ……………………………………………………………… 22
5. Results of operations for the three months ended December 31, 2015 ………………………………………………… 23
(1) Consolidated statements of income ……………………………………………………………………………………………… 23
(2) Consolidated segment information ………………………………………………………………………………………………… 24
(3) Consolidated revenues by product group ……………………………………………………………………………………… 25
Index to Accompanying Materials
‐4‐

Kubota Corporation and its Subsidiaries
‐5‐
In order for the Kubota Group to strengthen and refine its financial reporting and management systems
throughout the world by aligning the accounting year of Kubota Corporation with its foreign subsidiaries, a partial
amendment to the Articles of Incorporation was resolved at the 125th Ordinary General Meeting of Shareholders held
on June 19, 2015. Accordingly, Kubota Corporation changed its fiscal year‐end from March 31 to December 31. The
same change in the fiscal year‐end was made to subsidiaries in Japan that had fiscal year‐ends other than December 31.
For this reason, the 126th business term, a transitional period for the change in the fiscal year‐end, is the nine‐month
period that commenced on April 1, 2015 and ended on December 31, 2015. Therefore, the results of operations for the
nine months ended December 31, 2015 are compared with the results for the same period in the prior year that
commenced on April 1, 2014 and ended on December 31, 2014.
As described in the accompanying materials, "4. Consolidated financial statements (7) Notes to consolidated
financial statements c) Accounting changes for consolidated financial statements" on page 16, certain subsidiaries and
affiliated companies aligned their reporting periods with that of Kubota Corporation. Due to this alignment, the results
of operations in the prior year have been adjusted retrospectively.
1. Review of operations and financial condition
(1) Review of operations
a) Summary of the results of operations for the nine months under audit
For the nine months ended December 31, 2015, revenues of Kubota Corporation and its subsidiaries (hereinafter,
the “Company”) increased by ¥104.4 billion [9.2%] from the same period in the prior year, to ¥1,244.8 billion.
In the domestic market, revenues increased by ¥19.2 billion [5.0%] from the same period in the prior year, to
¥401.9 billion. Domestic revenues in Farm & Industrial Machinery increased due to higher sales of farm equipment and
construction machinery. Revenues in Water & Environment also increased slightly.
In overseas markets, revenues increased by ¥85.2 billion [11.2%] from the same period in the prior year, to
¥842.9 billion. Overseas revenues in Farm & Industrial Machinery rose significantly mainly in North America, where
economic recovery has been continuing. Revenues in Water & Environment also increased mainly due to expansion in
exports of ductile iron pipes to the Middle East. As a result, the ratio of overseas revenues to consolidated revenues
was 67.7%, 1.3 percentage points higher than in the same period in the prior year.
Operating income increased by ¥19.8 billion [13.4%] from the same period in the prior year, to ¥166.9 billion, as
increased domestic and overseas revenues, and the positive effect of yen depreciation exceeded the negative impact of
increased fixed costs, and sales promotion expenses.
Income before income taxes and equity in net income of affiliated companies, equivalent to operating income
plus other income of ¥2.6 billion, increased by ¥13.3 billion [8.5%] from the same period in the prior year, to ¥169.5
billion. Income taxes were ¥54.3 billion, and equity in net income of affiliated companies was ¥2.0 billion. Furthermore,
after the deduction of net income attributable to non‐controlling interests of ¥7.1 billion, net income attributable to
Kubota Corporation was ¥110.1 billion, ¥9.8 billion [9.8%] higher than in the same period in the prior year.
b) Review of operations by reporting segment
1) Farm & Industrial Machinery
Farm & Industrial Machinery is comprised of farm equipment, engines, construction machinery, and electronic
equipped machinery.
Revenues in this segment increased by 10.6% from the same period in the prior year, to ¥1,020.3 billion, and
accounted for 82.0% of consolidated revenues.
Domestic revenues increased by 7.7%, to ¥225.3 billion. Sales of farm equipment showed a substantial increase

Kubota Corporation and its Subsidiaries
‐6‐
owing to an adverse reaction to the decline in the prior year, caused by Japan’s consumption tax hike, and sales
promotion activities timed to coincide with the strengthening of emission regulations. Sales of construction machinery
also increased due to the strengthening of emission regulations and preferential taxation systems. However, sales of
engines decreased due to the overseas production transfer of clients.
Overseas revenues increased by 11.4%, to ¥795.0 billion. In North America, revenues increased because of
higher sales of compact tractors for home owners along with the strong housing markets, while sales of midscale
tractors for farming decreased due to the negative impact of declines in agricultural prices. In addition, sales of
construction machinery rose significantly due to the favorable market demand in the construction industry. Revenues in
Europe expanded due to higher sales of tractors, construction machinery, and engines along with the economic
recovery, while the implement business for the agriculture‐related market stagnated. As for Asia outside Japan, severe
drought caused a substantial decline in the sales of compact tractors in Thailand. However, sales of combine harvesters
in China rose significantly due to the effect of the resumption of government subsidies. In Vietnam, Myanmar and other
countries, where agricultural mechanization has been proceeding, sales of compact tractors and combine harvesters
expanded.
Operating income in this segment increased by 20.2%, to ¥175.0 billion, as the impact of increased domestic
and overseas revenues and the positive effect of yen depreciation exceeded the negative impact of increased fixed
costs and sales promotion expenses.
2) Water & Environment
Water & Environment is comprised of pipe‐related products (ductile iron pipes, plastic pipes, pumps, valves, and
other products), environment‐related products (environmental control plants and other products), and social
infrastructure‐related products (industrial castings, ceramics, spiral‐welded steel pipes, and other products).
Revenues in this segment increased by 2.9% from the same period in the prior year, to ¥203.7 billion, and
accounted for 16.4% of consolidated revenues.
Domestic revenues increased by 1.3%, to ¥156.2 billion. Revenues from environment‐related products and
social infrastructure‐related products increased, while revenues from pipe‐related products, such as ductile iron pipes,
decreased slightly. Overseas revenues increased by 8.6%, to ¥47.5 billion owing to increased sales of ductile iron pipes.
Operating income in this segment decreased by 27.2%, to ¥10.9 billion due to the negative impact of higher
selling expenses.
3) Other
Other is comprised of services and other business.
Revenues in this segment increased by 3.8% from the same period in the prior year, to ¥20.7 billion, and
accounted for 1.6% of consolidated revenues.
Operating income in this segment decreased by 4.4%, to ¥1.7 billion.
Note: Beginning with the current consolidated fiscal year, in conformity with the change in the business reporting
structure of the Company, the amounts related to "electronic equipped machinery" are reported in the "Farm &
Industrial Machinery" segment, whereas they were formerly reported in the "Water & Environment" segment.
The segment information for the prior year has been retrospectively adjusted to conform to the current fiscal
year’s presentation.
c) Prospects for the year ending December 31, 2016 Due to the change in the fiscal year‐end, the business term for this fiscal year was the nine‐month period that
commenced on April 1, 2015 and ended on December 31, 2015. For this reason, the forecast results of operations for
the year ending December 31, 2016 are compared with the results of operations for the same period in the prior year
(unaudited), which is the 12‐month period that commenced on January 1, 2015 and ended on December 31, 2015. The

Kubota Corporation and its Subsidiaries
‐7‐
following percentages represent changes from the same period in the prior year for the 12‐month period from January
1, 2015 to December 31, 2015.
The Company forecasts consolidated revenues for the year ending December 31, 2016 to be ¥1,750.0 billion
[+3.6%]. Domestic revenues are forecast to increase since revenues in Water & Environment are expected to increase,
while revenues in Farm & Industrial Machinery are expected to remain at almost the same level as in the same period
in the prior year.
Overseas revenues are also forecast to increase due to expansion of overseas revenues in North America,
Europe, and Asia outside Japan in Farm & Industrial Machinery and higher revenues in Water & Environment compared
with the corresponding period in the prior year.
The Company forecasts operating income of ¥235.0 billion [+5.4%]. The impact of increasing revenues in
domestic and overseas markets is expected to exceed the negative impact of yen appreciation. The Company expects
income before income taxes and equity in net income of affiliated companies for the next fiscal year to be ¥240.0 billion
[+7.1%]. Net income attributable to Kubota Corporation is forecast to be ¥155.0 billion [+3.8%].
(These forecasts are based on the assumption of exchange rates of ¥115=US$1 and ¥130=€1.)
(2) Financial condition a) Assets, liabilities, and equity
Total assets at December 31, 2015 amounted to ¥2,533.0 billion, an increase of ¥60.7 billion from the prior
year‐end (March 31, 2015). Among assets, notes and accounts receivable decreased substantially, mainly in the
businesses related to the public works and overseas business in Farm & Industrial Machinery. On the other hand, short‐
and long‐term finance receivables increased due to the effect of expansion in sales financing operations, and cash and
cash equivalents also increased.
Among liabilities, trade notes payable increased. Equity increased as the accumulation of retained earnings
exceeded the deterioration in accumulated other comprehensive income due to fluctuations in exchange rates and
stock prices. The shareholders’ equity ratio was 45.0%, 0.5 percentage points higher than at the prior fiscal year‐end.
b) Cash flows Net cash provided by operating activities during the nine months ended December 31, 2015 under audit was
¥197.0 billion, an increase of ¥120.0 billion in cash inflow compared with the same period in the prior year. This overall
increase in cash from operating activities resulted from higher net income and changes in working capital, such as notes
and accounts receivable and trade notes and accounts payable.
Net cash used in investing activities was ¥130.3 billion, an increase of ¥19.9 billion in cash outflow compared
with the same period in the prior year. This increase was mainly due to a rise in spending for purchases of fixed assets
and an increase in finance receivables.
Net cash used in financing activities was ¥27.7 billion mainly due to a significant decrease in proceeds from
issuance of long‐term debt, as compared to ¥57.5 billion of net cash provided for the same period in the prior year.
As a result, after taking account of the effect of exchange rate changes, cash and cash equivalents at December
31, 2015 were ¥146.3 billion, an increase of ¥33.9 billion from the prior year‐end.

Kubota Corporation and its Subsidiaries
‐8‐
(Reference)Cash flow indices
Nine months ended
December 31, 2015
Year ended
March 31, 2015
Ratio of shareholders' equity to total assets [%] 45.0 44.5
Equity ratio based on market capitalization [%] 92.8 95.9
Interest‐bearing debt / Net cash provided by operating activities [year] 3.9 8.9
Interest coverage ratio [times] 17.4 6.8
Note:
Equity ratio based on market capitalization: market capitalization / total assets
Interest coverage ratio: net cash provided by operating activities / interest paid
Each ratio is calculated based on the figures in the consolidated financial statements. Market capitalization is calculated based on
closing price at the end of the fiscal year multiplied by the number of shares outstanding at the end of the fiscal year, excluding treasury
stock. Net cash provided by operating activities is the amount in the consolidated statements of cash flows. Interest‐bearing debt
includes short‐term borrowings, current portion of long‐term debt, and long‐term debt in the consolidated balance sheets. Additionally,
interest paid is the amount of cash paid during the period for interest in the consolidated statements of cash flows.
Due to the change in the fiscal year‐end, the 126th business term was the nine‐month period that commenced on April 1, 2015
and ended on December 31, 2015. For this reason, the equity ratio based on market capitalization and the interest coverage ratio for the
nine months ended December 31, 2015 are calculated based on net cash provided by operating activities and interest paid for the
nine‐month period. The adjusted cash flow indices calculated based on net cash provided by operating activities and interest paid for the
12‐month period that commenced on January 1, 2015 and ended on December 31, 2015 (unaudited) are as follows.
Adjusted cash flow indices
12‐month period January 1, 2015
‐ December 31, 2015
Interest‐bearing debt / Net cash provided by operating activities [year] 3.7
Interest coverage ratio [times] 14.0

Kubota Corporation and its Subsidiaries
‐9‐
2. Management policies (1) Basic management policy
For more than a century since its founding, the Company has continued to contribute to society by helping to
improve people’s quality of life by offering products and services—including farm equipment, pipes for water supply
and sewage systems and environmental control plants.
The Company is developing its business globally under the corporate mission “Continue to support the future of
the earth and humanity by contributing products that help the affluent and stable production of food, help supply and
restore reliable water, and help create a comfortable living environment through its superior products, technologies and
services” with the aim of solving the worldwide problems of food, water and the environment, which are indispensable
for human beings.
In the years to come, the Company will strive to attain an even higher corporate value, through improvement of
its capabilities for flexibly responding to changes in society by emphasizing agility in its operations, strengthening its
global operational presence, and relentlessly working to transform itself.
(2) Priority measures for medium‐to‐long‐term growth in profit The Company’s long‐term objective is to build “Global Major Brand Kubota.” By raising each element of
management to a higher level appropriate for “Global Major Brand”, the Company aims to be a “sustainable enterprise”
that continues to develop in the long‐term. To realize this aim, the Company is implementing the following strategies.
a) Development in Strategic Businesses The Company will develop its business activities by expanding its presence in the farm machinery market for
upland farming as the core of its growth strategy. In 2015, the Company began the production and distribution of its
largest, 170‐horsepower class tractor and made a full‐scale entry into the farm machinery market for upland farming.
Along with this, the Company introduced a series of new products for the farm machinery market for upland farming in
emerging countries, including multi‐purpose tractors and wheel drive combine harvesters. The full‐scale delivery of
these new products starts in 2016. The Company is currently working to strengthen its production, sales, and services
capabilities to enable it to supply these high‐quality products speedily and on a stable basis to satisfy both its dealers
and customers.
The key to building “Global Major Brand Kubota” will be the Farm & Industrial Machinery business in North
America. The Company is expanding its lineup of products not only in the farm machinery business for upland farming
but also in construction machinery, including its new skid steer loader, and in utility vehicles for which the Company
currently has a dedicated plant under construction, and other products. In 2015, the Company decided to move its U.S.
sales company to a location near upland farming regions and expand its business functions and capabilities. The
Company is strengthening its local production, product development, and its human resources and business
infrastructure to support business activities. In this way, the Company is planning to substantially expand its business
operations in North America.
In the Water & Environment business, the Company is focusing on business development in Asia. With the
receipt of multiple orders for water treatment facilities in the Thilawa Special Economic Zone in Myanmar as an
example of its success in this region, the Company will sharpen the focus of its activities on the regions and
technologies that the Company should aim for, and actively pursue business development based on the strengths of the
Kubota Group. Going forward, the Company will endeavor to realize further synergies through strengthening
collaboration among various business regions.
b) Globalize all aspects of management
In R&D activities, the Company is establishing new R&D centers both in Japan and overseas, and expanding our
R&D personnel, including the hiring of non‐Japanese personnel. Looking ahead, the Company will also be working to

Kubota Corporation and its Subsidiaries
‐10‐
secure R&D personnel, both in terms of numbers and quality, and, while collaborating with outside parties, the
Company is aiming to review and structure its R&D activities to enable it to win out over major global competitors.
In production, the Company is moving forward quickly to establish the “Kubota Production Method” on a global
basis. In 2015, the Company established a basic policy that combines the production methods of advanced companies
with the Company’s unique approach and methods. Moving forward, the Company will promote the full‐scale
application of this basic policy in Kubota Group plants, and expand application to the plants of partner companies with
the aim of further improving the level of excellence in manufacturing of the Group as a whole.
In management, the Company is working to promote the efficiency of working capital by reducing assets and
improving cash flows. Among these initiatives, the Company is focusing especially on activities to reduce inventories as
efforts to further improve its many management functions from orders to sales. Through unceasing efforts, Company is
working to raise its comprehensive strengths and maximize cash to provide funding for growth.
c) Revitalize the farm equipment business in Japan As for the domestic farm equipment market in 2015, demand for tractors has recovered to the level prior to
Japan’s consumption tax hike; however, demand for rice planters and combine harvesters has not recovered, and the
market as a whole is stagnant. This has not been due to temporary factors such as the consumption tax hike and
suggests that structural changes are under way. Looking to the future, the Company is moving forward with initiatives
to understand the directions of these market changes more so than in the past. The Company is also endeavoring to
provide products and services as well as implement marketing activities that are clearly superior to those of
competitors. In addition, the Company is taking initiatives to increase its organizational efficiency to respond to market
changes and to restructure its operating systems. The Company is using its products and services to the fullest extent to
contribute to providing solutions for the issues confronting farmers as the Company also works to create new business
opportunities. The initiatives include expanding its ICT‐based agricultural support system, KUBOTA Smart Agri System
(KSAS), establishing agricultural production companies, and working to expand rice exports and others.
d) Increase profitability in the Water & Environment Business In the Water & Environment business, on the one hand, the Company is working to create new markets,
principally in Asia. On the other hand, the Company is focusing on maximizing profitability in existing markets in order
to generate resources for creating new markets. The market in Japan for pipe‐related products has reached maturity,
and the Company is taking steps to establish profitable operations without relying on expansion in sales. Conditions in
the domestic market for environment‐related products are intensely competitive, and, to respond to this, the Company
is making a shift from selling plants and equipment to offering packages of operating, management, and maintenance
services. In the industrial castings business, the Company is moving forward with the overall optimization of its overseas
production plant network and implementing measures to restructure these locations and further upgrade their
business infrastructure. Looking forward, by pursuing these measures decisively, the Company will aim to make major
improvements in profitability in the Water & Environment business.
3. Basic rationale for selection of accounting standards
In order to unify the Group’s accounting policy and further enhance the international comparability of its
financial information in the capital markets, the Company is considering adoption of International Financial Reporting
Standards.
< Cautionary Statements with Respect to Forward‐Looking Statements >
This document may contain forward‐looking statements that are based on management’s expectations, estimates, projections and
assumptions. These statements are not guarantees of future performance and involve certain risks and uncertainties, which are difficult to
predict. Therefore, actual future results may differ materially from what is forecast in forward‐looking statements due to a variety of factors,
including, without limitation: general economic conditions in the Company's markets, particularly government agricultural policies, levels of
capital expenditures both in public and private sectors, foreign currency exchange rates, the occurrence of natural disasters, continued
competitive pricing pressures in the marketplace, as well as the Company's ability to continue to gain acceptance of its products.

Kubota Corporation
and its Subsidiaries
4. Consolidated financial statements
(1) Consolidated balance sheets
Assets
Amount % Amount % Amount Amount %
146,286 112,428 33,858 119,058
Trade notes 78,928 87,505 (8,577) 86,084
Trade accounts 551,905 598,554 (46,649) 554,807
Less: Allowance for doubtful notes and accounts receivable (3,216) (4,042) 826 (4,008)
Total notes and accounts receivable‐net 627,617 682,017 (54,400) 636,883
Short‐term finance receivables‐net 224,058 206,756 17,302 210,483
356,441 336,840 19,601 353,741
136,444 104,536 31,908 119,391
Total current assets 1,490,846 58.9 1,442,577 58.3 48,269 1,439,556 58.4
26,416 24,574 1,842 24,469
139,636 156,216 (16,580) 150,124
482,482 441,129 41,353 447,159
648,534 25.6 621,919 25.2 26,615 621,752 25.3
81,915 85,890 (3,975) 94,582
268,965 269,436 (471) 270,041
465,425 457,298 8,127 452,460
11,252 14,089 (2,837) 9,677
827,557 826,713 844 826,760
(541,687) (531,467) (10,220) (526,417)
285,870 11.3 295,246 11.9 (9,376) 300,343 12.2
Other assets:
Goodwill and intangible assets‐net 29,430 32,447 (3,017) 33,902
Long‐term trade accounts receivable 36,758 37,589 (831) 35,344
Other 42,363 43,030 (667) 33,057
Less: Allowance for doubtful non‐current receivables (799) (550) (249) (609)
107,752 4.2 112,516 4.6 (4,764) 101,694 4.1
2,533,002 100.0 2,472,258 100.0 60,744 2,463,345 100.0
Dec. 31, 2015
Notes and accounts receivable:
Less: Accumulated depreciation
Inventories
Other current assets
Investments in and loan receivables from affiliated companies
Other investments
Investments and long‐term finance receivables:
Change
Current assets:
Cash and cash equivalents
Dec. 31, 2014
(In millions of yen)
Total other assets
Total
Total property, plant, and equipment
Land
Buildings
Property, plant, and equipment:
Total investments and long‐term finance receivables
Construction in progress
Net property, plant, and equipment
Long‐term finance receivables‐net
Mar. 31, 2015
Machinery and equipment
‐11‐

Kubota Corporation
and its Subsidiaries
Liabilities and equity
Amount % Amount % Amount Amount %
Short‐term borrowings 186,216 158,888 27,328 217,260
Trade notes payable 157,165 112,792 44,373 150,821
Trade accounts payable 103,169 116,775 (13,606) 104,382
Advances received from customers 7,475 9,209 (1,734) 10,473
Notes and accounts payable for capital expenditures 15,470 19,469 (3,999) 13,715
Accrued payroll costs 33,099 39,282 (6,183) 31,306
Accrued expenses 61,494 60,343 1,151 55,226
Income taxes payable 5,544 17,468 (11,924) 8,609
Other current liabilities 80,152 66,716 13,436 75,281
Current portion of long‐term debt 158,117 126,737 31,380 116,857
807,901 31.9 727,679 29.4 80,222 783,930 31.8
Long‐term debt 424,446 479,612 (55,166) 438,939
Accrued retirement and pension costs 12,148 12,632 (484) 13,366
Other long‐term liabilities 69,949 73,869 (3,920) 72,710
506,543 20.0 566,113 22.9 (59,570) 525,015 21.3
Kubota Corporation shareholders' equity:
Common stock 84,070 84,070 - 84,070
Capital surplus 87,838 87,880 (42) 88,691
Legal reserve 19,539 19,539 - 19,539
Retained earnings 869,769 799,545 70,224 767,989
Accumulated other comprehensive income 79,292 109,446 (30,154) 113,001
Treasury stock, at cost (198) (401) 203 (333)
Total Kubota Corporation shareholders' equity 1,140,310 45.0 1,100,079 44.5 40,231 1,072,957 43.6
Non‐controlling interests 78,248 3.1 78,387 3.2 (139) 81,443 3.3
1,218,558 48.1 1,178,466 47.7 40,092 1,154,400 46.9
2,533,002 100.0 2,472,258 100.0 60,744 2,463,345 100.0
Dec. 31, 2015 Mar. 31, 2015 Change Dec. 31, 2014
(In millions of yen)
Equity:
Total
Current liabilities:
Long‐term liabilities:
Total current liabilities
Total long‐term liabilities
Total equity
‐12‐

Kubota Corporation
and its Subsidiaries
(2) Consolidated statements of income
Nine months ended Same period
Dec. 31, 2015 last year
(In millions of yen)
Adjusted changeYear ended
Mar. 31, 2015
Apr. 1, 2015 Apr. 1, 2014 Apr. 1, 2014 Compared with
the same period‐ ‐ ‐
‐13‐
Amount % Amount % Amount % Amount %
Revenues 1,244,775 100.0 1,584,265 100.0 1,140,418 100.0 104,357 9.2
Cost of revenues 848,397 68.2 1,102,944 69.6 798,169 70.0 50,228 6.3
Selling, general, and administrative expenses 224,564 18.0 278,962 17.6 196,570 17.2 27,994 14.2
Other operating expenses (income)‐net 4 940 0 4 (746) 0 0 (1 425) (0 1) 6 365 ‐
Dec. 31, 2015 last yearDec. 31, 2014Mar. 31, 2015
Other operating expenses (income)‐net 4,940 0.4 (746) 0.0 (1,425) (0.1) 6,365 ‐
Operating income 166,874 13.4 203,105 12.8 147,104 12.9 19,770 13.4
Other income (expenses):
Interest and dividend income 5,782 5,208 4,497 1,285
Interest expense (698) (1,114) (998) 300
Gain on sales of securities‐net 1,559 1,366 676 883
Foreign exchange gain (loss)‐net (11,935) 3,668 6,491 (18,426)Foreign exchange gain (loss)‐net (11,935) 3,668 6,491 (18,426)
Other‐net 7,922 (1,524) (1,580) 9,502
Other income (expenses)‐net 2,630 7,604 9,086 (6,456)
Income before income taxes and
equity in net income of affiliated companies 169,504 13.6 210,709 13.3 156,190 13.7 13,314 8.5
Income taxes:
Current 47,614 64,364 41,594 6,020
Deferred 6,647 (3,214) 7,256 (609)
Total income taxes 54,261 61,150 48,850 5,411
Equity in net income of affiliated companies 2,009 1,748 1,776 233
Net income 117,252 9.4 151,307 9.6 109,116 9.6 8,136 7.5
Less: Net income attributable to non controlling interests 7 145 11 773 8 840 (1 695)Less: Net income attributable to non‐controlling interests 7,145 11,773 8,840 (1,695)
Net income attributable to Kubota Corporation 110,107 8.8 139,534 8.8 100,276 8.8 9,831 9.8
Notes:
Due to the change in the fiscal year‐end, the business term for this fiscal year was the nine‐month period that
commenced on April 1, 2015 and ended on December 31, 2015. For this reason, the results of operations for the same
period last year that commenced on April 1, 2014 and ended on December 31, 2014 and changes from them areperiod last year that commenced on April 1, 2014 and ended on December 31, 2014 and changes from them are
presented for reference purposes.
‐13‐

Kubota Corporation
and its Subsidiaries
(3) Consolidated statements of comprehensive income (loss)
(In millions of yen)
Nine months ended
Dec. 31, 2015
Apr. 1, 2015
‐
Dec. 31, 2015
Apr. 1, 2014
‐
Mar. 31, 2015
Apr. 1, 2014
‐
Dec. 31, 2014
Compared with
the same period
last year
Year ended
Mar. 31, 2015
Same period
last yearAdjusted change
‐14‐
Net income 117,252 151,307 109,116 8,136
Other comprehensive income (loss), net of tax:
Foreign currency translation adjustments (17,612) 61,550 74,162 (91,774)
Unrealized gains (losses) on securities (10,675) 12,602 8,512 (19,187)
Unrealized gains on derivatives 10 11 11 (1)
Pension liability adjustments (6,915) 3,416 (774) (6,141)
y
y j ( , ) , ( ) ( , )
Total other comprehensive income (loss) (35,192) 77,579 81,911 (117,103)
Comprehensive income 82,060 228,886 191,027 (108,967)
1,991 18,578 16,216 (14,225)
Comprehensive income attributable to Kubota Corporation 80,069 210,308 174,811 (94,742)
Notes:
Less: Comprehensive income
attributable to non‐controlling interests
Due to the change in the fiscal year‐end, the business term for this fiscal year was the nine‐month period that commenced on April 1, 2015 and ended on
D b 31 2015 F hi h l f i f h i d l h d A il 1 2014 d d d D b 31
(4) Consolidated statements of changes in equity
(In millions of yen)
Shares of
December 31, 2015. For this reason, the results of operations for the same period last year that commenced on April 1, 2014 and ended on December 31,
2014 and changes from them are presented for reference purposes.
Shareholders' Equity
Balance at Mar. 31, 2014 84,070 88,753 19,539 705,216 38,466 (287) 65,818 1,001,575
139,534 11,773 151,307
70,774 6,805 77,579
(37 503) (37 503)
common stock
outstanding
(thousands
of shares)
Non‐
controlling
interests
Accumulated
other
comprehensive
income
Treasury
stock,
at cost
Retained
earnings
1,249,746
Common
stock
Legal
reserve
Capital
surplus
Total
equity
Cash dividends paid to Kubota Corporation shareholders,
Other comprehensive income
Net income
(37,503) (37,503)
(658) (658)
(7,816) (7,816)
(7,702) 7,702 -
(873) 206 (5,351) (6,018)
Balance at Mar. 31, 2015 84,070 87,880 19,539 799,545 109,446 (401) 78,387 1,178,466
(4,046)
1,245,700
p p ,
\30 per common share
Cash dividends paid to non‐controlling interests
Purchases and sales of treasury stock
Retirement of treasury stock
Changes in ownership interests in subsidiaries
110,107 7,145 117,252
(30,038) (5,154) (35,192)
(37,366) (37,366)
(1,797) (1,797)
(2,314) (2,314)
(2,517) 2,517 -
(1,196)
Net income
Other comprehensive loss
Cash dividends paid to Kubota Corporation shareholders,
\30 per common share
Cash dividends paid to non‐controlling interests
Purchases and sales of treasury stock
Retirement of treasury stock
141 141
(42) (116) (474) (632)
Balance at Dec. 31, 2015 84,070 87,838 19,539 869,769 79,292 (198) 78,248 1,218,5581,244,504
Changes in ownership interests in subsidiaries
Increase in non‐controlling interests related to contribution
‐14‐

Kubota Corporation
and its Subsidiaries
(In millions of yen)
Nine months ended Year ended Same period
Dec. 31, 2015 Mar. 31, 2015 last year
Apr. 1, 2015 Apr. 1, 2014 Apr. 1, 2014 Compared with
‐ ‐ ‐ the same period
Dec. 31, 2015 Mar. 31, 2015 Dec. 31, 2014 last year
(5) Consolidated statements of cash flows
Adjusted change
‐15‐
Dec. 31, 2015 Mar. 31, 2015 Dec. 31, 2014 last year
Operating activities:
Net income 117,252 151,307 109,116
Depreciation and amortization 31,193 38,249 28,060
Gain on sales of securities‐net (1,559) (1,366) (676)
(Gain) loss from disposal of fixed assets‐net 760 (1,981) (1,538)
Impairment loss on long‐lived assets 3,738 1,244 113
Equity in net income of affiliated companies (2,009) (1,748) (1,776)
Deferred income taxes 6,647 (3,214) 7,256, ( , ) ,
(Increase) decrease in notes and accounts receivable 49,479 (45,930) 7,980
Increase in inventories (27,881) (19,787) (26,857)
Increase in other current assets (13,949) (2,226) (23,959)
Increase (decrease) in trade notes and accounts payable 34,249 (16,833) 4,604
Decrease in income taxes payable (11,860) (20,229) (29,352)
Increase in other current liabilities 9,202 11,915 7,247
Decrease in accrued retirement and pension costs (5,634) (11,470) (8,079)
Other 7,412 7,949 4,883
Net cash provided by operating activities 197,040 85,880 77,022 120,018
Investing activities:
Purchases of fixed assets (39,267) (46,412) (34,144)
Purchases of investments (47) (127) (15)
Proceeds from sales of property, plant, and equipment 3,027 11,399 3,115
Proceeds from sales and redemption of investments 2,532 2,373 1,304
Acquisition of business, net of cash acquired 136 (334) -
Increase in finance receivables (304,678) (341,900) (262,814)
Collection of finance receivables 222,611 265,254 187,162
3,443 (4,459) (2,843)
Net (increase) decrease in time deposits (17,368) (116) 203
Other (696) (2,905) (2,332)
Net cash used in investing activities (130,307) (117,227) (110,364) (19,943)
Financing activities:
Proceeds from issuance of long‐term debt 87,585 337,964 236,369
Repayments of long‐term debt (109,741) (196,933) (146,707)
Net (increase) decrease in short‐term loan receivables from affiliated companies
Repayments of long term debt (109,741) (196,933) (146,707)
Net increase (decrease) in short‐term borrowings 35,956 (41,013) 6,067
Payments of cash dividends (37,366) (37,503) (37,503)
Purchases of treasury stock (2,314) (7,817) (47)
Purchases of non‐controlling interests (37) (6,048) (1)
Other (1,754) (656) (632)
Net cash provided by (used in) financing activities (27,671) 47,994 57,546 (85,217)
Effect of exchange rate changes on cash and cash equivalents (5,204) 7,376 6,449 (11,653)
Net increase in cash and cash equivalents 33 858 24 023 30 653Net increase in cash and cash equivalents 33,858 24,023 30,653
Cash and cash equivalents, beginning of period 112,428 88,405 88,405
Cash and cash equivalents, end of period 146,286 112,428 119,058 27,228
(In millions of yen)
Notes:
Cash paid during the period for:
Interest 11,349 12,656 9,324 2,025
Income taxes net of refunds 69 093 82 997 78 070 (8 977) Income taxes, net of refunds 69,093 82,997 78,070 (8,977)
Notes:
Due to the change in the fiscal year‐end, the business term for this fiscal year was the nine‐month period that commenced on April 1, 2015 and
ended on December 31, 2015. For this reason, the results of operations for the same period last year that commenced on April 1, 2014 and ended
on December 31, 2014 and changes from them are presented for reference purposes.
‐15‐
Kubota Corporation and its Subsidiaries
‐16‐
(6) Notes to assumptions for going concern None
(7) Notes to consolidated financial statements
a) Summary of accounting policies
The accompanying consolidated financial information has been prepared in accordance with accounting principles
generally accepted in the United States of America (U.S. GAAP).
b) Consolidated subsidiaries and affiliated companies under the equity method
153 subsidiaries are consolidated.
Major consolidated subsidiaries:
Domestic
Kubota Credit Co., Ltd.Kubota‐C.I. Co., Ltd.
Overseas Kubota U.S.A., Inc.Kubota Tractor Corporation Kubota Credit Corporation, U.S.A. Kubota Manufacturing of America Corporation Kubota Industrial Equipment Corporation Kubota Engine America Corporation Kubota Canada Ltd. Kubota Materials Canada Corporation Kubota Europe S.A.S. Kubota Baumaschinen GmbH Kverneland AS Kubota China Holdings Co., Ltd. Kubota Agricultural Machinery (Suzhou) Co., Ltd. Kubota Construction Machinery (Wuxi) Co., Ltd. Kubota China Financial Leasing Ltd. SIAM KUBOTA Corporation Co., Ltd. Siam Kubota Leasing Co., Ltd. SIAM KUBOTA Metal Technology Co., Ltd. Kubota Engine (Thailand) Co., Ltd. Kubota Saudi Arabia Company, LLC
18 affiliated companies are accounted for under the equity method.
Major affiliated company: Domestic KMEW Co., Ltd.
c) Accounting changes for consolidated financial statements
From the current fiscal year, certain subsidiaries and affiliated company (as of December 31, 2015, 36 subsidiaries
and 1 affiliated company) aligned their reporting periods, which were previously consolidated using their own reporting
periods, to that of Kubota Corporation. To reflect the impact of these changes, the Company has retrospectively adjusted its
consolidated balance sheets, consolidated statements of income, consolidated statements of comprehensive income (loss),
consolidated statements of changes in equity, consolidated statements of cash flows, consolidated segment information, and
per common share information for the prior year.
Retrospectively adjusted net income attributable to Kubota Corporation for the year ended March 31, 2015 and
Kubota Corporation shareholders’ equity and total assets as of March 31, 2015, were as follows:

Kubota Corporation and its Subsidiaries
‐17‐
(In millions of yen)
Before retrospective
adjustment Adjustment
After retrospective
adjustment
Net income attributable to
Kubota Corporation 140,012 (478) 139,534
Kubota Corporation
shareholders’ equity 1,100,998 (919) 1,100,079
Total assets 2,476,820 (4,562) 2,472,258
d) Change in fiscal year‐end
In order for Kubota Corporation to strengthen and refine its financial reporting and management system throughout
the world by aligning the accounting year of Kubota Corporation with those of its foreign subsidiaries, Kubota Corporation
changed its fiscal year‐end from March 31 to December 31 from the current fiscal year by the resolution of a partial
amendment to the Articles of Incorporation at the 125the Ordinary General Meeting of Shareholders held on June 19, 2015.
Accordingly, the business term for this fiscal year, the transitional period for the change in the fiscal year‐end, was the
nine‐month period that commenced on April 1, 2015 and ended on December 31, 2015.

Kubota Corporation
and its Subsidiaries
a) Reporting segments
Nine months ended December 31, 2015 (April 1, 2015 ‐ December 31, 2015)
Revenues External customers 1,020,279 203,747 20,749 - 1,244,775
Intersegment 405 1,518 19,698 (21,621) -
Total 1,020,684 205,265 40,447 (21,621) 1,244,775
Operating income 175,025 10,894 1,727 (20,772) 166,874
Identifiable assets at Dec. 31, 2015 1,998,074 258,033 87,510 189,385 2,533,002
Depreciation and amortization 23,142 5,413 388 2,250 31,193
Capital expenditures 28,534 5,822 273 667 35,296
Year ended March 31, 2015 (April 1, 2014 ‐ March 31, 2015)
Revenues External customers 1,243,054 312,523 28,688 - 1,584,265
Intersegment 746 1,103 24,535 (26,384) -
Total 1,243,800 313,626 53,223 (26,384) 1,584,265
Operating income 192,158 29,633 3,252 (21,938) 203,105
Identifiable assets at Mar. 31, 2015 1,908,447 288,139 91,685 183,987 2,472,258
Depreciation and amortization 27,434 7,388 574 2,853 38,249
Capital expenditures 37,132 9,358 523 3,379 50,392
Same period last year (April 1, 2014 ‐ December 31, 2014)
Revenues External customers 922,465 197,957 19,996 - 1,140,418
Intersegment 439 684 17,902 (19,025) -
Total 922,904 198,641 37,898 (19,025) 1,140,418
Operating income 145,596 14,959 1,806 (15,257) 147,104
Notes:
1.
2.
3.
4.
5.
Water &
Environment
Water &
Environment
(In millions of yen)
Farm &
Industrial
Machinery
Water &
EnvironmentOther Adjustments Consolidated
Due to the change in the fiscal year‐end, the business term for this fiscal year was the nine‐month period that
commenced on April 1, 2015 and ended on December 31, 2015. For this reason, the results of operations for the same
period last year that commenced on April 1, 2014 and ended on December 31, 2014 are presented for reference
purposes.
"Adjustments" include the elimination of intersegment transfers and the unallocated corporate expenses that cannot
be apportioned to reporting segments, and corporate assets. Corporate assets mainly consist of certain assets of Kubota
Corporation such as cash and cash equivalents, securities and assets related to administration departments.
(8) Consolidated segment information
Adjustments Consolidated
(In millions of yen)
(In millions of yen)
ConsolidatedAdjustments
The aggregated amounts of operating income are equal to those in the consolidated statements of income. Refer to the
consolidated statements of income for the reconciliation of operating income to income before income taxes and
equity in net income of affiliated companies.
Intersegment transfers are recorded at values that approximate market prices.
Beginning with the current consolidated fiscal year, in conformity with the change in the business reporting structure of
the Company, the amounts related to "electronic equipped machinery" are reported in the "Farm & Industrial
Machinery" segment, whereas they were formerly reported in the "Water & Environment" segment. The segment
information for the prior fiscal year has been retrospectively adjusted to conform to the current fiscal year’s
presentation.
Other
Farm &
Industrial
Machinery
Farm &
Industrial
Machinery
Other
‐18‐

Kubota Corporation
and its Subsidiaries
b) Revenues from external customers by product group
Information about revenues from external customers by product group (In millions of yen)
Year ended
Mar. 31, 2015 last year
Apr. 1, 2014
‐
Apr. 1, 2014
‐
Same periodNine months ended
Dec. 31, 2015
Apr. 1, 2015
‐
‐19‐
Farm Equipment and Engines 849,921 1,032,001 771,228
Construction Machinery 148,785 180,298 128,904
Electronic Equipped Machinery 21,573 30,755 22,333
1,020,279 1,243,054 922,465
Pipe‐related Products 125,967 191,204 123,307
Mar. 31, 2015 Dec. 31, 2014Dec. 31, 2015
Farm & Industrial Machinery
Environment‐related Products 44,850 73,798 41,217
Social Infrastructure‐related Products 32,930 47,521 33,433
203,747 312,523 197,957
20,749 28,688 19,996
Total 1,244,775 1,584,265 1,140,418
Notes:
Water & Environment
Other
Notes:
c) Geographic information
Due to the change in the fiscal year‐end, the business term for this fiscal year was the nine‐month period that commenced on
April 1, 2015 and ended on December 31, 2015. For this reason, the results of operations for the same period last year that
commenced on April 1, 2014 and ended on December 31, 2014 are presented for reference purposes.
Information about revenues from external customers by destination (In millions of yen)
Japan 401 856 561 201 382 704
Dec. 31, 2015 Mar. 31, 2015 Dec. 31, 2014
‐ ‐ ‐
Apr. 1, 2014 Apr. 1, 2014
Nine months ended
Dec. 31, 2015
Apr. 1, 2015
Year ended Same period
Mar. 31, 2015 last year
Japan 401,856 561,201 382,704
North America 395,582 443,368 340,175
Europe 150,044 208,571 151,020
Asia outside Japan 240,952 304,635 218,597
Other areas 56,341 66,490 47,922
Total 1,244,775 1,584,265 1,140,418
Notes:
1.
2. There was no single customer from whom revenues exceeded 10% of total consolidated revenues of the Company.
3. Due to the change in the fiscal year‐end, the business term for this fiscal year was the nine‐month period that commenced on
April 1, 2015 and ended on December 31, 2015. For this reason, the results of operations for the same period last year that
commenced on April 1, 2014 and ended on December 31, 2014 are presented for reference purposes.
Revenues from North America included those from the United States of \352,950 million, \386,359 million, and \297,958 million
for the nine months ended December 31, 2015, the year ended March 31, 2015, and the same period last year, respectively.
p , , p p p
‐19‐

Kubota Corporation
and its Subsidiaries
Information about property, plant, and equipment based on physical location (In millions of yen)
Japan 169,373 178,393
North America 38,679 34,407
Europe 22,129 21,692
Asia outside Japan 51 416 55 987
Dec. 31, 2015 Mar. 31, 2015
‐20‐
Asia outside Japan 51,416 55,987
Other areas 4,273 4,767
Total 285,870 295,246
(9) Per common share information(9) Per common share information
(In yen)
last year
Apr. 1, 2014‐
Apr. 1, 2015‐
Mar. 31, 2015
Apr. 1, 2014‐
Nine months ended
¥ 916 28 ¥ 883 10
Year ended
Dec. 31, 2015 Mar. 31, 2015
Kubota Corporation shareholders' equity per common share
Same period
Dec. 31, 2014
¥ 858 56
Dec. 31, 2015
Numerators (In millions of yen)
The numerators and denominators used for calculation of basic net income attributable to Kubota Corporation per common share are as
follows:
Basic net income attributable to Kubota Corporation per common share ¥ 111.68 ¥ 88.47
Nine months ended
¥ 80.24
Same period
¥ 916.28 ¥ 883.10 Kubota Corporation shareholders' equity per common share ¥ 858.56
Year ended
Basic net income attributable to Kubota Corporation
Denominators (In thousands of shares)
¥ 100,276
Dec. 31, 2015 Mar. 31, 2015 last year
Apr. 1, 2014‐
Dec. 31, 2015
¥ 110,107
Apr. 1, 2015‐
Nine months ended Same period
Dec. 31, 2014
Apr. 1, 2014‐
Year ended
Mar. 31, 2015
¥ 139,534
Weighted average number of common shares outstanding
1. Diluted net income attributable to Kubota Corporation per common share is not presented because there are no dilutive
Dec. 31, 2015 Mar. 31, 2015 last year
1,249,730
Dec. 31, 2015
Apr. 1, 2015‐
Same period
Dec. 31, 2014
Apr. 1, 2014‐
Apr. 1, 2014‐
Nine months ended
Note:
Year ended
Mar. 31, 2015
1,244,522 1,249,363
1.
2.
Diluted net income attributable to Kubota Corporation per common share is not presented because there are no dilutive
securities.
Due to the change in the fiscal year‐end, the business term for this fiscal year was the nine‐month period that commenced on
April 1, 2015 and ended on December 31, 2015. For this reason, the results of operations for the same period last year that
commenced on April 1, 2014 and ended on December 31, 2014 are presented for reference purposes.
(10) Subsequent events
None
‐20‐

Kubota Corporation
and its Subsidiaries
(11) Consolidated revenues by product group
Compared with
th i d
(In millions of yen)
Nine months ended Year ended Same periodAdjusted change
Dec. 31, 2015 Mar. 31, 2015 last year
Apr. 1, 2015 Apr. 1, 2014 Apr. 1, 2014
‐21‐
Amount % Amount % Amount % Amount %
Farm Equipment and Engines 849,921 68.2 1,032,001 65.1 771,228 67.6 78,693 10.2
Domestic 170,233 215,103 156,872 13,361 8.5
Overseas 679,688 816,898 614,356 65,332 10.6
C t ti M hi 148 785 12 0 180 298 11 4 128 904 11 3 19 881 15 4
‐ ‐ ‐ the same period
Dec. 31, 2015 Mar. 31, 2015 Dec. 31, 2014 last year
Construction Machinery 148,785 12.0 180,298 11.4 128,904 11.3 19,881 15.4
Domestic 34,882 42,450 31,184 3,698 11.9
Overseas 113,903 137,848 97,720 16,183 16.6
Electronic Equipped Machinery 21,573 1.8 30,755 2.0 22,333 2.0 (760) (3.4)
Domestic 20,157 29,005 21,040 (883) (4.2)
Overseas 1,416 1,750 1,293 123 9.5
1 020 279 82 0 1 243 054 78 5 922 465 80 9 97 814 10 6F & I d i l M hi 1,020,279 82.0 1,243,054 78.5 922,465 80.9 97,814 10.6
Domestic 225,272 18.1 286,558 18.1 209,096 18.3 16,176 7.7
Overseas 795,007 63.9 956,496 60.4 713,369 62.6 81,638 11.4
Pipe‐related Products 125,967 10.1 191,204 12.1 123,307 10.8 2,660 2.2
Domestic 100,746 156,299 101,728 (982) (1.0)
Overseas 25,221 34,905 21,579 3,642 16.9
44 850 3 6 73 798 4 6 41 217 3 6 3 633 8 8
Farm & Industrial Machinery
Environment‐related Products 44,850 3.6 73,798 4.6 41,217 3.6 3,633 8.8
Domestic 40,088 68,087 37,133 2,955 8.0
Overseas 4,762 5,711 4,084 678 16.6
Social Infrastructure‐related Products 32,930 2.7 47,521 3.0 33,433 3.0 (503) (1.5)
Domestic 15,381 22,335 15,330 51 0.3
Overseas 17,549 25,186 18,103 (554) (3.1)
203,747 16.4 312,523 19.7 197,957 17.4 5,790 2.9
Domestic 156,215 12.6 246,721 15.6 154,191 13.5 2,024 1.3
Overseas 47,532 3.8 65,802 4.1 43,766 3.9 3,766 8.6
20,749 1.6 28,688 1.8 19,996 1.7 753 3.8
Domestic 20,369 1.6 27,922 1.8 19,417 1.7 952 4.9
Overseas 380 0.0 766 0.0 579 0.0 (199) (34.4)
Water & Environment
Other
1,244,775 100.0 1,584,265 100.0 1,140,418 100.0 104,357 9.2
Domestic 401,856 32.3 561,201 35.5 382,704 33.5 19,152 5.0
Overseas 842,919 67.7 1,023,064 64.5 757,714 66.5 85,205 11.2
1.
Note:
Beginning with the current consolidated fiscal year, in conformity with the change in the business reporting structure of the
Company, the amounts related to "electronic equipped machinery" are reported in the "Farm & Industrial Machinery" segment,
whereas they were formerly reported in the "Water & Environment" segment The segment information for the prior fiscal year
Total
2.
whereas they were formerly reported in the "Water & Environment" segment. The segment information for the prior fiscal year
has been retrospectively adjusted to conform to the current fiscal year’s presentation.Due to the change in the fiscal year‐end, the business term for this fiscal year was the nine‐month period that commenced on April
1, 2015 and ended on December 31, 2015. For this reason, the results of operations for the same period last year that commenced
on April 1, 2014 and ended on December 31, 2014 and changes from them are presented for reference purposes.
‐21‐
Kubota Corporation
and its Subsidiaries
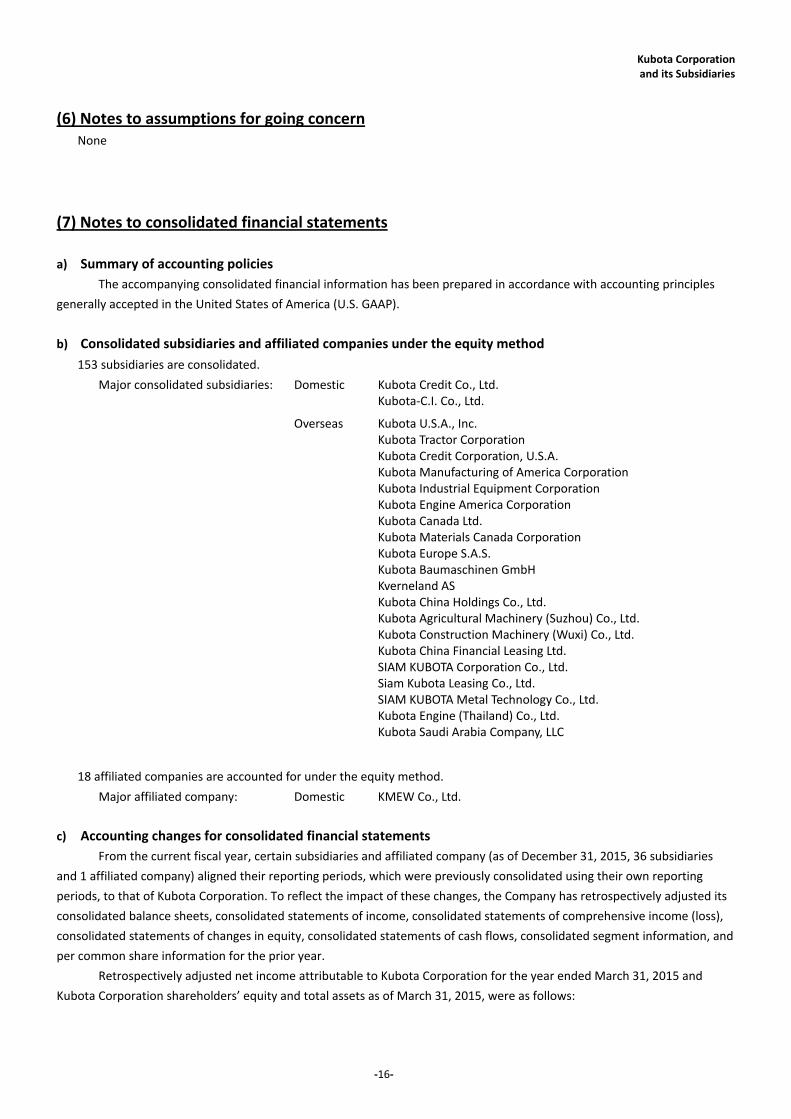
(12) Anticipated consolidated revenues by reporting segment
(In billions of yen)
Compared with
Year ending
Dec. 31, 2016
Same period
prior yearAdjusted change
Jan. 1, 2016 Jan. 1, 2015
‐22‐
Amount % Amount % Amount %
Domestic 302.0 302.7 (0.7) (0.2)
Overseas 1,088.0 1,038.1 49.9 4.8
1,390.0 79.4 1,340.8 79.4 49.2 3.7
Dec. 31, 2015
pthe same period
prior year
Farm & Industrial Machinery
Jan. 1, 2016‐
Dec. 31, 2016
Jan. 1, 2015‐
Domestic 258.0 248.7 9.3 3.7
Overseas 72.0 69.6 2.4 3.4
330.0 18.9 318.3 18.9 11.7 3.7
Domestic 30.0 28.9 1.1 3.8
Overseas - 0.6 (0.6) (100.0)
30 0 1 7 29 5 1 7 0 5 1 7
Water & Environment
30.0 1.7 29.5 1.7 0.5 1.7
1,750.0 100.0 1,688.6 100.0 61.4 3.6
590.0 33.7 580.3 34.4 9.7 1.7
1,160.0 66.3 1,108.3 65.6 51.7 4.7Overseas
Total
Domestic
Other
Notes:
The business term for this fiscal year was the nine‐month period that commenced on April 1, 2015 and ended on
December 31, 2015. Since it is different from the following fiscal year, which is the 12‐month period that commenced on
January 1, 2016 and ending on December 31, 2016, anticipated revenues for the year ending December 31, 2016 are
compared with revenues for the same period in the prior year (unaudited), which is the 12‐month period that
commenced on January 1, 2015 and ended on December 31, 2015. Please note that revenues for the same period in the
prior year are provided for reference purposes only and are not subject to an audit.
‐22‐

Kubota Corporation
and its Subsidiaries
5. Results of operations for the three months ended December 31, 2015
(1) Consolidated statements of income
Amount % Amount % Amount %
Revenues 433,690 100.0 404,837 100.0 28,853 7.1
Cost of revenues 294,416 67.9 284,396 70.3 10,020 3.5
Selling, general, and administrative expenses 83,281 19.2 71,336 17.6 11,945 16.7
Other operating expenses (income)‐net 2,748 0.6 (1,697) (0.4) 4,445 ‐
Operating income 53,245 12.3 50,802 12.5 2,443 4.8
Other income (expenses):
Interest and dividend income 2,306 1,805 501
Interest expense (308) (168) (140)
Gain on sales of securities‐net 158 496 (338)
Foreign exchange gain‐net 2,040 1,444 596
Other‐net (2,213) 2,008 (4,221)
Other income (expenses)‐net 1,983 5,585 (3,602)
Income before income taxes and
equity in net income of affiliated companies 55,228 12.7 56,387 13.9 (1,159) ( 2.1 )
Income taxes 16,649 15,844 805
Equity in net income of affiliated companies 738 538 200
Net income 39,317 9.1 41,081 10.1 (1,764) ( 4.3 )
Less: Net income attributable to non‐controlling interests 1,944 3,660 (1,716)
Net income attributable to Kubota Corporation 37,373 8.6 37,421 9.2 (48) ( 0.1 )
Net income attributable to Kubota Corporation per commom share: (In yen)
Basic 30.03 29.94
Notes:
Due to the change in the fiscal year‐end, the business term for this fiscal year was the nine‐month period that commenced on
April 1, 2015 and ended on December 31, 2015. For this reason, the results of operations for the same period last year that
commenced on October 1, 2014 and ended on December 31, 2014 and changes from them are presented for reference
purposes.
Three months ended Three months ended
(In millions of yen)
ChangeDec. 31, 2015 Dec. 31, 2014
‐23‐

Kubota Corporation
and its Subsidiaries
(2) Consolidated segment information
a) Reporting segments
Three months ended December 31, 2015
Revenues External customers 344,907 81,479 7,304 - 433,690
Intersegment 228 1,150 7,468 (8,846) -
Total 345,135 82,629 14,772 (8,846) 433,690
Operating income 53,190 6,767 697 (7,409) 53,245
Three months ended December 31, 2014
Revenues External customers 317,292 80,860 6,685 - 404,837
Intersegment 114 261 6,145 (6,520) -
Total 317,406 81,121 12,830 (6,520) 404,837
Operating income 47,513 7,765 726 (5,202) 50,802
Notes:
1. "Adjustments" include the elimination of intersegment transfers and the unallocated corporate expenses.
2.
3. Intersegment transfers are recorded at values that approximate market prices.
4.
5.
b) Geographic information
Information about revenues from external customers by destination
141,457 129,371
151,026 122,896
51,550 53,110
72,132 79,062
17,525 20,398
433,690 404,837
Notes:
1.
2. There was no single customer from whom revenues exceeded 10% of total consolidated revenues of the Company.
3.
(In millions of yen)
Consolidated
Farm &
Industrial
Machinery
Water &
EnvironmentOther Adjustments
The aggregated amounts of operating income are equal to those in the consolidated statements of income. Refer to the
consolidated statements of income for the reconciliation of operating income to income before income taxes and equity
in net income of affiliated companies.
Beginning with the current consolidated fiscal year, in conformity with the change in the business reporting structure of
the Company, the amounts related to "electronic equipped machinery" are reported in the "Farm & Industrial Machinery"
segment, whereas they were formerly reported in the "Water & Environment" segment. The segment information for the
prior fiscal year has been retrospectively adjusted to conform to the current fiscal year’s presentation.
Due to the change in the fiscal year‐end, the business term for this fiscal year was the nine‐month period that commenced
on April 1, 2015 and ended on December 31, 2015. For this reason, the results of operations for the same period last year
that commenced on October 1, 2014 and ended on December 31, 2014 are presented for reference purposes.
(In millions of yen)
Farm &
Industrial
Machinery
Water &
Environment
(In millions of yen)
ConsolidatedOther Adjustments
Three months ended
Dec. 31, 2015
Total
Other areas
Japan
North America
Asia outside Japan
Europe
Three months ended
Dec. 31, 2014
Revenues from North America included those from the United States of \139,164 million and \109,610 million for the
three months ended December 31, 2015 and 2014, respectively.
Due to the change in the fiscal year‐end, the business term for this fiscal year was the nine‐month period that commenced
on April 1, 2015 and ended on December 31, 2015. For this reason, the results of operations for the same period last year
that commenced on October 1, 2014 and ended on December 31, 2014 are presented for reference purposes.
‐24‐

Kubota Corporation
and its Subsidiaries
(3) Consolidated revenues by product group
Amount % Amount % Amount %
Farm Equipment and Engines 291,212 67.1 268,211 66.3 23,001 8.6
Domestic 47,885 42,608 5,277 12.4
Overseas 243,327 225,603 17,724 7.9
Construction Machinery 46,734 10.8 42,144 10.4 4,590 10.9
Domestic 13,407 12,418 989 8.0
Overseas 33,327 29,726 3,601 12.1
Electronic Equipped Machinery 6,961 1.6 6,937 1.7 24 0.3
Domestic 6,362 6,434 (72) (1.1)
Overseas 599 503 96 19.1
344,907 79.5 317,292 78.4 27,615 8.7
Domestic 67,654 15.6 61,460 15.2 6,194 10.1
Overseas 277,253 63.9 255,832 63.2 21,421 8.4
Pipe‐related Products 51,952 12.0 51,672 12.8 280 0.5
Domestic 43,541 40,789 2,752 6.7
Overseas 8,411 10,883 (2,472) (22.7)
Environment‐related Products 18,751 4.3 16,451 4.1 2,300 14.0
Domestic 17,130 14,438 2,692 18.6
Overseas 1,621 2,013 (392) (19.5)
Social Infrastructure‐related Products 10,776 2.5 12,737 3.1 (1,961) (15.4)
Domestic 5,924 6,206 (282) (4.5)
Overseas 4,852 6,531 (1,679) (25.7)
81,479 18.8 80,860 20.0 619 0.8
Domestic 66,595 15.4 61,433 15.2 5,162 8.4
Overseas 14,884 3.4 19,427 4.8 (4,543) (23.4)
7,304 1.7 6,685 1.6 619 9.3
Domestic 7,208 1.7 6,478 1.6 730 11.3
Overseas 96 0.0 207 0.0 (111) (53.6)
433,690 100.0 404,837 100.0 28,853 7.1
Domestic 141,457 32.7 129,371 32.0 12,086 9.3
Overseas 292,233 67.3 275,466 68.0 16,767 6.1
1.
2.
Note:
Beginning with the current consolidated fiscal year, in conformity with the change in the business reporting structure of the
Company, the amounts related to "electronic equipped machinery" are reported in the "Farm & Industrial Machinery" segment,
whereas they were formerly reported in the "Water & Environment" segment. The segment information for the prior fiscal year
has been retrospectively adjusted to conform to the current fiscal year’s presentation.Due to the change in the fiscal year‐end, the business term for this fiscal year was the nine‐month period that commenced on
April 1, 2015 and ended on December 31, 2015. For this reason, the results of operations for the same period last year that
commenced on October 1, 2014 and ended on December 31, 2014 and changes from them are presented for reference
purposes.
(In millions of yen)
Three months ended
Dec. 31, 2015
Three months ended
Dec. 31, 2014Change
Total
Farm & Industrial Machinery
Water & Environment
Other
‐25‐