Results H1 2012 -...
60
Results H1 2012 July 27 th , 2012
Transcript of Results H1 2012 -...

Results H1 2012
July 27th, 2012

2
Disclaimer
This document contains certain forward-looking statements concerning DANONE. Although
DANONE believes its expectations are based on reasonable assumptions, these forward-looking
statements are subject to numerous risks and uncertainties, which could cause actual results to
differ materially from those anticipated in these forward-looking statements. For a detailed
description of these risks and uncertainties, please refer to the section “Risk Factors” in
DANONE’s Annual Report (which is available on www.danone.com). DANONE undertakes no
obligation to publicly update or revise any of these forward-looking statements. This document
does not constitute an offer to sell, or a solicitation of an offer to buy, Danone shares.
2

3
H1 Highlights
3 3

4
H1 2012 Highlights
(1) Like-for-like : Based on constant scope of consolidation and constant exchange rates
Sales growth (1)
4 (2) Free cash flow: Cash flow from operations less capital expenditure (net of disposals) and excluding business combinations fees
+5.9%
H1 2012
13.85%
-61 bps Like-for-like(1)
Trading operating margin
€ 890 mln
Free cash flow (2)
4

EUROPE
INFLATION
EMERGING
Specific Support & Adjustments No compromise vs LT building Investment maintained
2012 Parameters evolving – Managing with same Priorities
higher productivities H1 inflation above expectations
Deterioration in Southern Europe
Continued strong growth & operational leverage
5

Dual dynamics
6
Western Europe
38% Rest of the World
62%
Western Europe
35%
Rest of the World 65%
Sales
Margin
H1 2011
H1 2012
+3 pts
Sales
Margin
Group Sales breakdown

Unemployment rate in Spain (%)
Southern Europe deteriorating
Focus on Spain
Jun
2011
74.9
Jun
2012
50.6
Dic
2011
71.0
Ene
2012
68.3
Feb
2012
58.0
Mar
2012
63.7
Abr
2012
50.3
May
2012
50.5
7
Dairy Spain - Like-for-like sales growth (%)
FY 2011 Q1 2012 Q2 2012
Instituto Nacional Estadistica
Indicador de confianza consumidor

Dairy Spain requiring specific response
Support and differentiate
Innovate
Continued productivity
Increase competitiveness
8 8

Continued double-digit growth outside Europe
9
CIS
APAC
LATAM
NORAM
AME
9

Danone becomes majority shareholder
of Centrale Laitière in Morocco
63%
Competitor1 20%
Competitor 2 5% Others
12%
Dairy – Value Market shares*
Oujd
a
Tetoua
n
Tanger
Fes
Meknes Casa / Mly Slimane
El jadida
Mararkech
Laâyoune
FBS
Agadir
Safi
Salé Rabat
Ouarzazate
Kenitra
2011 Sales : ca. € 600 mln
2011 EBITDA Margin : 16.9%
* Company data - 2011 10

India : Wockhardt Nutrition acquisition completed
Competitor 1 78%
Wockhardt 7%
Competitor 2 6%
Competitor 5 3%
Competitor 4 3% Competitor 3
3%
NATIONAL DISTRIBUTION WITH LOCAL PRODUCTION FACILITY 2nd PLAYER IN A FAST GROWING BABY FOOD MARKET (1)
o 25 million baby
born/year
o 15% annual growth for
the baby food market
Factory
H1 2012 Sales
+22%(2)
o 1 factory located in
Punjab
o National sales
coverage
o More that 30,000 HCPs
/ doctors coverage
Baby brands Nutrition brand
CREDIBLE BRANDS IN BABY AND NUTRITION
(2) Wockhardt data
(1) 2011 Value market shares – company data
11

Danone ranks 9
out of 50 global brands
Target: December 2012, cover ca. 70% of
total sales and over 35,000 products
Nature Sourcing
Milk Business
Academy:
education program
for Russian dairy
farmers
Objective: ensure high quality and
long-term supply of milk to Danone-
Unimilk; increase productivity
Purpose: a teaching farm to provide
practical trainings and agricultural
education
Carbon Footprint
measurement
Sustainability in the core of our mission
Rewarded by
12

13
H1 2012 results
13 13

Underlying net income
+5.9% like-for-like (1)
+7.7% reported € 10,475 mln
€ 1,451 mln
Trading operating margin -61 bps like-for-like (1)
-62 bps reported 13.85%
€ 911 mln
€ 1.51
€ 890 mln -3.8% reported
(1) Like-for-like : Based on constant scope of consolidation and constant exchange rates
(2) Excluding exceptionals
(3) Free Cash Flow: Cash flow from operations less capital expenditure (net of disposals) and excluding business combinations fees
+1.4% like-for-like (1)
+3.1% reported
KEY FIGURES – H1 12
Sales Sales
Trading operating income
Underlying EPS (fully diluted)
Free cash flow (3)
+2.1% like-for-like (1,2)
+4.3% reported
+2.5% like-for-like (1,2)
+4.7% reported
14

15
Sales growth analysis – H1 2012
+5.9% Like-for-like
+7.7% Reported
2.0%
(0.2)% 2.2%
3.7%
H1 2011 Currency Scope Volume Value H1 2012
€ 10,475 mln
€ 9,728 mln

16
Sales growth analysis – Q2 12
+7.8% Reported
+5.0% Like-for-like
2.8%
0.0% 2.1%
2.9%
Q2 2011 Currency Scope Volume Value Q2 2012
€ 5,359 mln
€ 4,970 mln

Like-for-like sales growth
Total Group : Q2 sales, as expected, at the bottom end of
the full-year guidance
17
8.7%
5.9%
H1 2011 H1 2012
Good H1 sales, well into the 5-7% range, providing a good idea of overall underlying trends
A dual picture: Western Europe sales declining, and rest of world growing double digit
Waters the main game changer in Q2 vs Q1: high 2011 comps and poor weather in Q2 2012 in Western Europe
8.5% 8.8%
5.9%
7.8%
6.9%
5.0%
Q1 11 Q2 11 Q3 11 Q4 11 Q1 12 Q2 12

Total Group : resilient volume growth
Like-for-like sales growth
18
Volume growth
Price/mix growth
4.0%
2.2%
4.7%
3.7%
H1 2011 H1 2012
Resilient volume, 2011 price increases lapsing gradually
5.0%
3.1% 1.5% 2.2% 2.2% 2.1%
3.5%
5.7%
4.4%
5.6% 4.7%
2.9%
Q1 11 Q2 11 Q3 11 Q4 11 Q1 12 Q2 12

19
Sales performance
by division
19

6.5%
5.5%
3.5% 3.0%
3.8%
2.1%
Q1 11 Q2 11 Q3 11 Q4 11 Q1 12 Q2 12
20
FRESH DAIRY PRODUCTS
Soft Q2, impacted by Southern Europe
Like-for-like sales growth
Q2 not benefiting from the leap day of Q1, impacted by Southern Europe deterioration
Continued outperformance in Latam, AME, Asia
CIS and North America on track with their plans
6.0%
2.9%
H1 2011 H1 2012

FRESH DAIRY PRODUCTS – Volume stabilized
2011 price increases lapsing
CIS volume recovery offset by Spain deterioration
Volume and price/mix growth
21
Volume growth
Price/mix growth
1.4%
(0.2%)
4.6%
3.1%
H1 2011 H1 2012
2.9%
(0.2%) (1.5%) (1.7%) (0.1%) (0.3%)
3.6%
5.7% 5.0% 4.7%
3.9%
2.4%
Q1 11 Q2 11 Q3 11 Q4 11 Q1 12 Q2 12

Fresh Dairy CIS
Continued strong performance of Unimilk key brands
Danone-Unimilk CIS % volume growth 2012 agenda: Activating the key brands
22
Q1 11 Q2 11 Q3 11 Q4 11 Q1 12 Q2 12
Volume growth gradually improving while pricing not material any more
22

+11%
H1 12 like-for-like
growth - Russia
23
Fresh Dairy CIS –
Prostokvashino - New Brand Identity in Q2 2012
23

Fresh Dairy US
Continued share gains globally and on the Greek segment
Oikos*
$ sales
x 2.2
24
Total Danone*
Competitor 1
Competitor 2
Oikos*
* Dannon + Stonyfield
H1 11 H1 12
32.9
24.6
15.7
7.3
Jan-12 Feb-12 Mar-12 Apr-12 May-12 Jun-12
US Value Market shares Source : IRI Grocery
24

25
Oikos - Multipack
Activia Breakfast
Greek – Light & Fit
Fresh Dairy US – Entering Q3 with strong plans and
additional capacities, in a very competitive market

FRESH DAIRY PRODUCTS – Selected innovations
26
Oikos “best new product award”
(Canada)
Greek segment
Oykos (UK) Griego Light
(Spain)
Activia Toppers for Breakfast
(Czech)
Yolado (Spain)
26

13.3%
18.9%
7.9%
23.3%
16.4%
4.6%
Q1 11 Q2 11 Q3 11 Q4 11 Q1 12 Q2 12
27
Like-for-like sales growth
WATERS – Soft Q2 +4.6% on the back of high comps
Strong H1 growth
Q2 hit by high 2011 comps (earthquake in Japan and favorable weather
in WE & Latam) and poor Western European weather
Continued strong underlying category dynamics
Continued outperformance of Aquadrinks
16.6%
9.6%
H1 2011 H1 2012

10.7% 10.0%
4.9%
10.1% 7.7%
3.1%
2.6%
8.9%
3.0%
13.2%
8.7%
1.5%
Q1 11 Q2 11 Q3 11 Q4 11 Q1 12 Q2 12
WATERS – Balanced growth
28
Volume and Price/mix growth
Positive mix brought by Aquadrinks, and still carry over effect of price
increases taken from Q2 2011
Partly offset by negative geographical mix
Volume growth
Price/mix growth
10.4%
5.2%
6.2%
4.4%
H1 2011 H1 2012

WATERS – Selected innovations
29
Volvic Sparkling (Germany) FontVella (Spain)
New image & TV campaign
Villa del Sur Levite Limonada (Argentina) Evian Masters to become a Major
(France)
29

BABY NUTRITION – Excellent performance, pulled by Asia
30
Continued great performance across the board, boosted by Asia
China : gaining market shares and renovating Dumex
Positive mix from Milk outperformance vs Food decline
Like-for-like sales growth
H1 2011 H1 2012
11.3% 10.4% 11.2%
9.6% 10.5%
11.4%
9.0%
13.6%
Q1 11 Q2 11 Q3 11 Q4 11 Q1 12 Q2 12

BABY NUTRITION – Selected innovations
31
Dumex renovation (China) Blédina du jour –
Chilled food range (France)
Optimized “1000Days Growth Program”
PROGRAM
STAGE ENHANCED NUTRITION
PRODUCTS

MEDICAL NUTRITION – Similar trend to Q1
32
Like-for-like sales growth
Continued adverse market conditions in Southern Europe and Noram
China, Turkey, Brazil outperforming
9.0%
6.6%
H1 2011 H1 2012
9.3% 8.7%
9.8% 9.8%
6.4% 6.7%
Q1 11 Q2 11 Q3 11 Q4 11 Q1 12 Q2 12

MEDICAL NUTRITION – Selected innovations
33
Compact protein
(6 more countries)
Neocate LCP upgrade
(All Markets)
Infatrini Peptisorb
(UK)
Presenting Souvenir II trials results
Alzheimer's Association International
Conference
Journal of Alzheimer’s Disease
Issue : Volume 31, Number 1, July
2012

Dual geographical dynamics
34
EUROPE
ASIA
REST OF THE WORLD
Like-for-like sales growth by region
3.7% 4.2% 0.1% 1.5% 0.9%
-1.0%
Q1 11 Q2 11 Q3 11 Q4 11 Q1 12 Q2 12
18.0% 20.8% 19.6%
22.0% 19.4%
17.2%
Q1 11 Q2 11 Q3 11 Q4 11 Q1 12 Q2 12
14.8% 12.6% 11.5%
14.4% 12.7%
10.7%
Q1 11 Q2 11 Q3 11 Q4 11 Q1 12 Q2 12
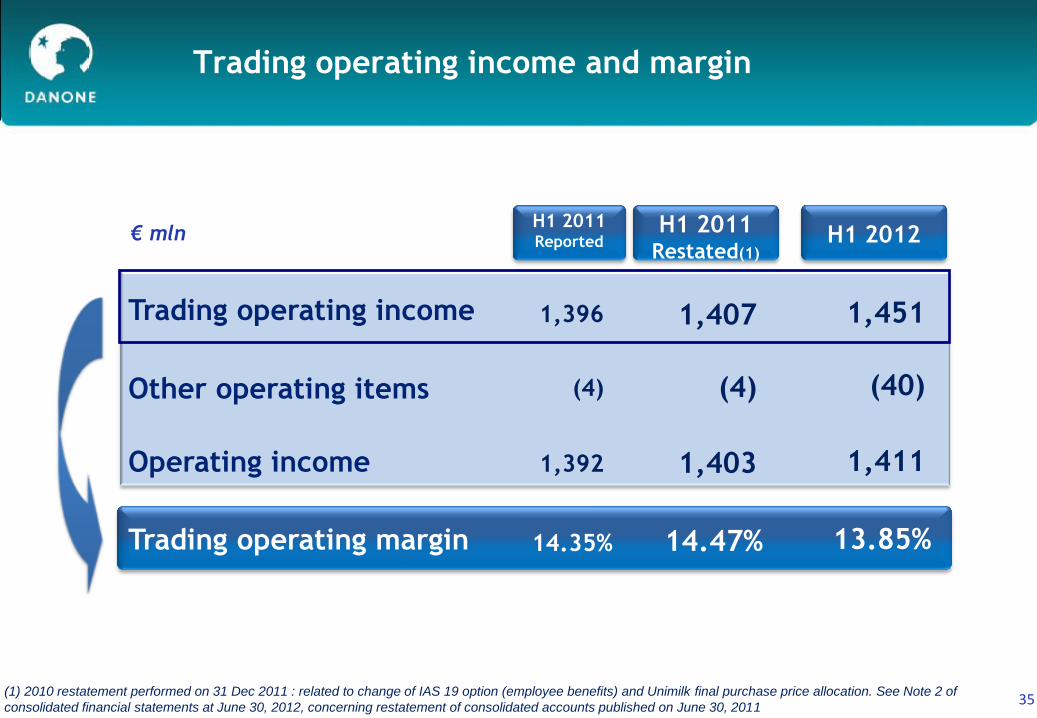
35
Trading operating income
Other operating items
Operating income
Trading operating margin
1,396
(4)
1,392
14.35%
€ mln
Trading operating income and margin
H1 2011 Reported
1,451
(40)
1,411
13.85%
H1 2012
1,407
(4)
1,403
14.47%
H1 2011 Restated(1)
(1) 2010 restatement performed on 31 Dec 2011 : related to change of IAS 19 option (employee benefits) and Unimilk final purchase price allocation. See Note 2 of
consolidated financial statements at June 30, 2012, concerning restatement of consolidated accounts published on June 30, 2011

36
- 17 Bps + 147 Bps - 144 Bps
- 105 Bps + 58 Bps
Margin S1 2011 Leverage &Others
Pricing & Mix Input costs Other COGS A&P Margin S1 2012
- 61 Bps
Like-for-like
Margin bridge
Net of +243 bps productivity
(€246 mln)

37
Whey & Milk Proteins: > 20%
Packaging: mid-single digit
Milk: very low cream resale price
Fruits & sugar: > 10%
H1 Inflation higher than expected
Productivity 2008-2012 (€ mln)
H1
246
324
470 516 528
2008 2009 2010 2011 2012
> 500
Input cost inflation vs. last year (in %)
246
H1 12

38
A&P, sales force and R&D costs (€mln)
Keeping on fueling the topline :
A&P, SalesForce and R&D
A&P spends stable vs. last year, digital media spends keep
growing
- Advertising slightly up, keeping high brand visibility
- Promotion down
SalesForce and R&D spends growing double-digit
STRATEGIC JOINT BUSINESS PLAN WITH KEY INTEGRATOR
Priority 1
Optimize media
mix through digital
Priority 3
Build digital
capabilities
Priority 2
Innovate (media, sales)
Ambition
Build and leverage digital advantage
in multi-touchpoint dialogue
with consumers
Promotions
& other
marketing costs
H1 2011 H2 2011 H1 2012
R&D
Sales force
Adverstising

39
Trading operating margin
by business line & geographical area
Fresh Dairy 11.23% 12.17%
Baby Nutrition 19.97% 19.86%
Waters
Medical Nutrition
13.67%
18.70%
(9) bps
(252) bps
(35) bps
(85) bps
14.02%
21.44%
Europe
Asia
Rest of World
11.93%
12.36%
22.57%
14.16%
12.00%
20.64%
(201) bps
+36 bps
+168 bps
H1 2011 H1 2012
Like-for-like
change
Total 13.85% 14.47% (61) bps
Reported
(1) Restated
(1)
39

Other operating items
Income tax
Attributable to minority interests
€ mln
(40)
(341)
84
Net income of affiliates 39
Total financial expenses (144)
From operating income to net income
H12012 Non current
items
H1 2012
Underlying
Trading operating income 1,451
Operating income 1,411
Net income 965
(30)
(6)
(36)
-
10
(6)
(40)
(40)
-
911
90
1,001
39
(351)
(138)
1,451
-
1,451
Attributable to the parent 881
40
(331)
92
23
(133)
1,407
966
874
H1 2011
Underlying
(restated)
1,407
*
-
40

41
Total income tax (reported) (341)
€ mln
Non current income tax (2)
26.9%
10
Reported tax rate
26.7% Underlying tax rate
Tax rate development
Current income tax (351)
41 (2) Tax related to non current items
(333)
26.3%
26.0%
(331)
H1 2012 H1 2011 (restated)
(2)
41
(1)
(1) Refers to 2011 restatement

€ million
million
Underlying EPS
Underlying net income
Fully diluted number of shares
Fully diluted underlying EPS
911
603
€ 1.51
874
606
€ 1.44
42
H1 2012 H1 2011 (restated)
(1) Refers to 2011 restatement
(1)

Analysis of underlying fully diluted EPS growth FY 11
43
Reported growth
Underlying EPS H12011
Currency Scope Like-for-like growth Underlying EPS H12012
€ 1,44 € 1,51
+ 4,7%
+ 2,1% + 0,1% + 2,5%
(restated) (1)
(1) Refers to 2011 restatement

44
Cash bridge
1,451
337 (351)
(138) 23
1,322
(67)
(416) 51
890
Tradingoperatingincome
Depreciation Taxes Financialresults
Others Cash fromoperatingactivities
W cap var Capex Sales ofassets
& Businesscomb. fees
FreeCash Flow
(1) Underlying
(1)
(1)

-958 -1,156
H1 11 H1 12
925 949 890
H1 11 H2 11 H1 12
337
548 416
H1 11 H2 11 H1 12
Consistent cash-flow excellence
9.9% % of sales 9.5% 8.5%
Free cash flow
Working Capital (€ mln) Capital expenditures (€ mln)
(€ mln)
% of sales - 5.2% - 5.8% 5.7% % of sales 3.5% 4.0%
45

46
FCF to net debt change
(166)
890
(51)
(1,003)
(4) (46) 48
Free Cash Flow M&A Dividends Share Buy back Other Non cash items,scope & Forex
Total change innet debt

Synthetic Balance Sheet
Liabilities € mln
Working capital
Intangible
assets
Other assets
Working capital
Shareholders’
equity
Net debt(2)
Other liabilities
Liabilities(2) Assets(1)
(1) Excluding assets included in net debt
(2) Net of cash, cash equivalents, marketable securities, other short term investments and financial instrument assets 47
June 11
4,059
15,607
5,858
25,524(1)
June 12
5,472
12,293
6,798
2,128
26,691(2)
June 12
4,317
6,147
26,691(1)
June 11
5,016
11,045
7,526
1,937
25,524(2)
16,227
47

Debt profile
48
June 30 2011 June 30 2012
Gross Debt maturity profile as of June 30 2012 (€ bn)
CP Bond
Gross Debt profile
Inaugural “Yankee” bond issue
Successful launch of a $850 million
10-year bond on May 29, 2012
carried out by way of a private
placement to institutional investors
only to diversify geographically its
sources of financing and extend the
maturity of its debt at favorable
market conditions.
Bonds
39%
Com.
Paper
13%
Put
options
39%
Bonds
27%
Com.
Paper
22%
Put
options
37%
Others
Others
1 316
293 618 603 710
1 604
CP 2013 2014 2015 2016 >2016

Danone Spain minority shareholding evolution
49
%Shareholding
In Danone Spain
Danone Spain
Put Options
in group net debt
• Financed by debt : share buy back programs for the same quantity of shares
=> no dilution for Group shareholders
=> positive impact on net debt €81 mln(1)
=> accretive on EPS
€ 2,153 mln
€ 461 mln
€ 1,693 mln
31 december 2011 30 june 2012
• Agreement : 2 shareholders selling their 8.6% stake to Danone
• Transaction : €91.5mln cash + 6,110,039 Treasury shares
Non-current
Current
26 july 2012
32.4%
8.6%
Danone Spain
Put Options
in group net debt
(1) Based on an average price of €47,15 per Danone share, corresponding to the opening price on July 26, 2012.

50
2012 OUTLOOK
50 50

-50 bps
Trading operating margin(1)
51
New 2012 targets confirmed
(1) Like-for-like : Based on constant scope of consolidation and constant exchange rates
5-7%
Objectives 2012
Sales growth (1)
€ 2 bn
Free cash flow (2)
51 (2) Free cash flow: Cash flow from operations less capital expenditure (net of disposals) and excluding business combinations fees
51

52
APPENDIX
52

2012 Share price & Shareholding
Danone Share price evolution
Institutional shareholders
79%
Others
2% Retail
Investors
10%
Company
related
9%
Shareholding by investor (1)
France
Switzerland Germany
UK
Rest of
Europe
US Rest of the World
32%
4% 5%
12%
11%
29% 7%
Institutional Shareholding by geography (1)
Absolute
Relative vs. CAC 40
Relative vs. Eurostoxx 50
Danone YTD June 2012 stock performance
+0.9%
-0.3%
+3.2%
53 (1) The company conducted a survey of the Company’s identifiable shareholders as of August 2011
90
95
100
105
110
115
déc.-11 janv.-12 févr.-12 mars-12 avr.-12 mai-12 juin-12
53

54
Currency
Scope of consolidation
Reported sales growth
Waters Dairy Baby
Nutrition
Medical
Nutrition Total
Like-for-like sales growth
+2,4%
(0.1)%
+6.9%
+2.3%
0.0%
+4.4%
+4.8%
+0.2%
+18.6% +10.3%
+2.7%
+0.9%
+2.8%
+7.8%
0.0%
+4.6% +2.1% +13.6% +6.7% +5.0%
Impact of currencies and scope – Q2 12
54

55
Impact of currencies and scope – H1 12
Currency
Scope of consolidation
Reported sales growth
+1.9%
(0.2)%
+11.3%
+1.4%
(0.2)%
+4.1%
Waters Dairy Baby
Nutrition
+3.7%
0.0%
+15.0%
Medical
Nutrition
+9.3%
+1.9%
Total
+0.8%
2.0%
+7.7%
(0.2)%
Like-for-like sales growth +9.6% +2.9% +11.3% +6.6% +5.9%
Including Unimilk
55

Sales by business & geographical area – Q2 12
Fresh Dairy 2,946
Baby Nutrition 1,076
Waters
Medical Nutrition
+13.6%
+6.7%
+4.6%
+2.1%
1,014
323
€ mln
Europe
Asia
Rest of World
2,839
1,587
933
(1.0)%
+10.7%
+17.2%
Q2 2012
Like-for-like
sales growth
Total 5,359 +5.0%
56
2,821
907
949
293
2,845
1,391
734
Q2 2011
4,970

Sales by business & geographical area – H1 12
Fresh Dairy 5,906
Baby Nutrition 2,090
Waters
Medical Nutrition
+11.3%
+6.6%
+9.6%
+2.9%
1,855
624
€ mln
Europe
Asia
Rest of World
5,548
3,165
1,762
(0.1)%
+11.7%
+18.2%
H1 2012 Like-for-like
sales growth
Total 10,475 +5.9%
57
5,672
1,818
1,667
571
5,543
2,790
1,395
H1 2011
9,728

58
1.5%
(0.4)%
+6,6%
2.4%
+3.1%
+7.1%
+7.0%
(0.3)%
+1.8%
+6.8%
+3.4%
(2.8)%
+3.9%
+13.8%
Like-for-like Volume Price/mix Total
Like-for-like sales growth – Q2 12
Breakdown volume/value
Fresh Dairy
Baby Nutrition
Waters
Medical Nutrition
Europe
Asia
Rest of World
Total +2.1% 2.9%
+13.6%
+6.7%
+4.6%
+2.1%
(1.0)%
+10.7%
+17.2%
+5.0%

59
+4.4%
(0.5)%
+5.9%
+3.1%
+5.2%
+7.1%
+5.4%
(0.2)%
+2.5%
+7.6%
+4.0%
(2.6)%
+4.1%
+14.2%
Like-for-like
Total +2.2% +3.7%
Volume Price/mix Total
Like-for-like sales growth – H1 12
Breakdown volume/value
Fresh Dairy
Baby Nutrition
Waters
Medical Nutrition
Europe
Asia
Rest of World
+11.3%
+6.6%
+9.6%
+2.9%
(0.1)%
+11.7%
+18.2%
+5.9%

60
Changes in exchange rates
31% of sales denominated in €
US dollar 9%
Chinese yuan 6%
4% Brazilian real
6% Indonesian rupee
10% Russian ruble
6% Mexican peso
2% Turkish lira
2% Canadian dollar
Polish zloty 3%
+ 12%
- 3%
- 3%
+ 1%
+ 15%
- 9%
+ 4%
+ 8%
- 7%
5% British pound + 9%
% total
H1 12 sales H1 12 vs
H1 11 (avg)
Q2 12 vs
Q2 11 (avg)
+ 10%
+ 3%
+ 1%
+ 5%
+ 8%
- 1%
+ 2%
+ 5%
- 3%
+ 8%
5% Argentinian peso + 3% + 16%
60