Danone Results Q113 -...
29
Transcript of Danone Results Q113 -...


2
Disclaimer
This document contains certain forward-looking statements concerning DANONE. AlthoughDANONE believes its expectations are based on reasonable assumptions, these forward-lookingstatements are subject to numerous risks and uncertainties, which could cause actual results todiffer materially from those anticipated in these forward-looking statements. For a detaileddescription of these risks and uncertainties, please refer to the section “Risk Factors” inDANONE’s Annual Report (which is available on www.danone.com). DANONE undertakes noobligation to publicly update or revise any of these forward-looking statements. This documentdoes not constitute an offer to sell, or a solicitation of an offer to buy, Danone shares.
2

33
Total Group - Solid start to the year
Like-for-like sales growth
Underlying trends continuing similarly to H2 2012
Baby Nutrition outperforming
8.5% 8.8%
5.9%
7.8%
6.9%
5.0% 5.0% 4.9%5.6%
Q1 11 Q2 11 Q3 11 Q4 11 Q1 12 Q2 12 Q3 12 Q4 12 Q1 13

44
Sales growth analysis – Q1 13
(2.4)%+1.1%
+3.0%
+2.6%
Q1 2012 Currency Scope Volume Value Q1 2013
+4.3%Reported
+5.6%Like-for-like
€5,338 mln
€5,117 mln
55
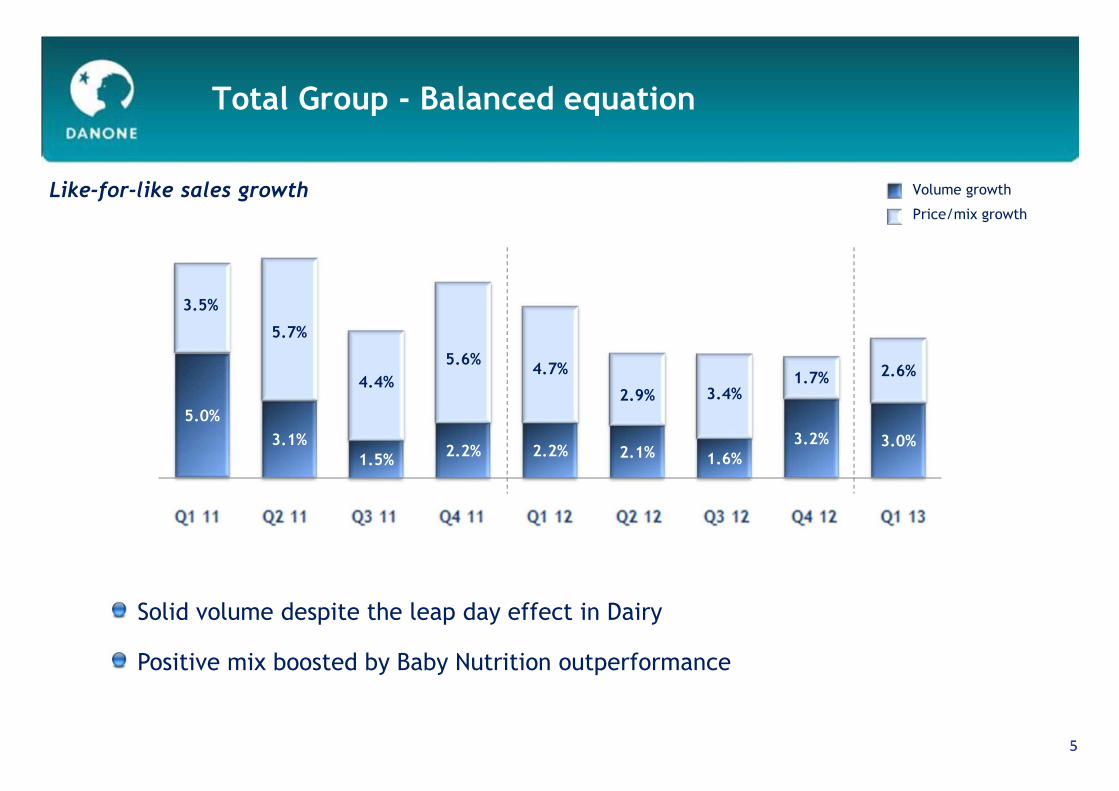
Like-for-like sales growth Volume growth
Price/mix growth
Total Group - Balanced equation
Solid volume despite the leap day effect in Dairy
Positive mix boosted by Baby Nutrition outperformance
5.0%
3.1%
1.5%2.2% 2.2% 2.1% 1.6%
3.2% 3.0%
3.5%
5.7%
4.4%
5.6%4.7%
2.9% 3.4%1.7% 2.6%

66
Like-for-like sales growth by region
EUROPE
ALMA
AsiapacLatamMiddleEastAfrica
CIS-NoramCIS+USA+Canada
Different geographical dynamics
18.1%
15.4% 15.2%14.2%
16.6%
Q1 12 Q2 12 Q3 12 Q4 12 Q1 13
5.3% 5.3%6.8%
9.7%8.5%
(0.5)%(2.8)% (3.8)%
(5.1)% (5.1)%
77
Sales performanceby division

88
Like-for-like sales growth
Similar dynamics to Q4 12, reduced by the 2012 leap day effect
CIS-Noram growing high-single digit
ALMA continuing to grow double-digit: Latam, Africa, Indonesia
Europe showing similar trends to Q4 2012
FRESH DAIRY PRODUCTS - Continued soft performance on high comps
6.5%
5.5%
3.5%3.0%
3.8%
2.1%
0.7%1.3%
0.7%
Q1 11 Q2 11 Q3 11 Q4 11 Q1 12 Q2 12 Q3 12 Q4 12 Q1 13

99
FRESH DAIRY PRODUCTS - Volume keeps improving
Volume and price/mix growth Volume growth
Price/mix growth
2.9%
(0.2%) (1.5%) (1.7%) (0.1%) (0.3%)(0.7%)
0.4% 0.5%
3.6%
5.7%5.0% 4.7%
3.9%
2.4% 1.4% 0.9% 0.2%
Volume keeps improving with CIS and ALMA accelerating
Price/mix is getting lower, on the back of price/promo investments in Europe and
limited price increases elsewhere

FRESH DAIRY PRODUCTS – Selected innovations
Danio (UK)
Plus - cooling laban(Saudi Arabia)
Danette Le Liégeois(France)
Ecolean Pouch(Portugal)
Activia Greek(USA)
Danet 3D(Spain)
Zakvaska(Russia)
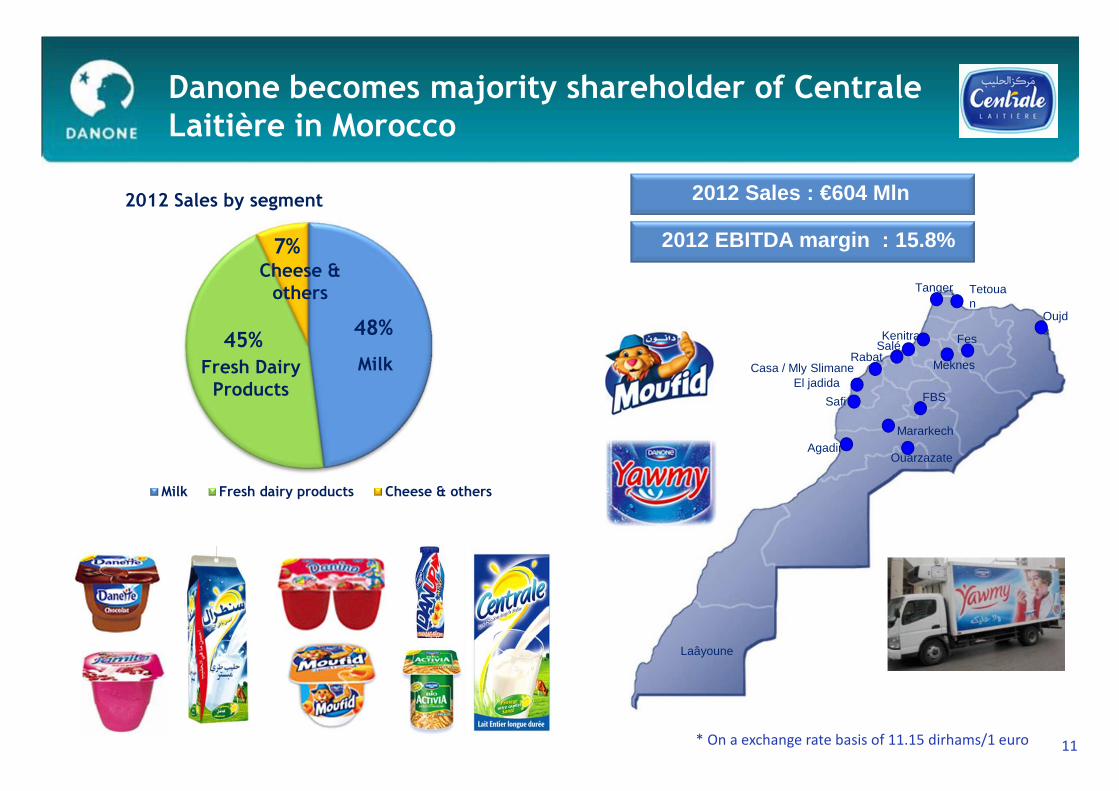
Danone becomes majority shareholder of CentraleLaitière in Morocco
* On a exchange rate basis of 11.15 dirhams/1 euro 11
Oujda
Tetouan
Tanger
Fes
MeknesCasa / Mly SlimaneEl jadida
Mararkech
Laâyoune
FBS
Agadir
Safi
SaléRabat
Ouarzazate
Kenitra
2012 Sales : €604 Mln
2012 EBITDA margin : 15.8%
48%45%
7%
Milk Fresh dairy products Cheese & others
Fresh Dairy Products
Milk
Cheese & others
2012 Sales by segment

12
Like-for-like sales growth
WATERS – Strong performance
Europe resilient, despite cold weather in March
Emerging markets continuing very strong
Aquadrinks still the main driver
13.3%
18.9%
7.9%
23.3%
16.4%
4.6%
12.3%
8.5% 8.6%
Q1 11 Q2 11 Q3 11 Q4 11 Q1 12 Q2 12 Q3 12 Q4 12 Q1 13

WATERS – Balanced equation
13
Volume and Price/mix growth
Solid volume despite unfavorable weather in Europe and Argentina
Positive mix from Aquadrinks and valorized formats
10.7% 10.0%
4.9%
10.1%7.7%
3.1%5.4%
7.9%
4.6%
2.6%
8.9%
3.0%
13.2%
8.7%
1.5%
6.9% 0.6%
4.0%
Volume growth
Price/mix growth
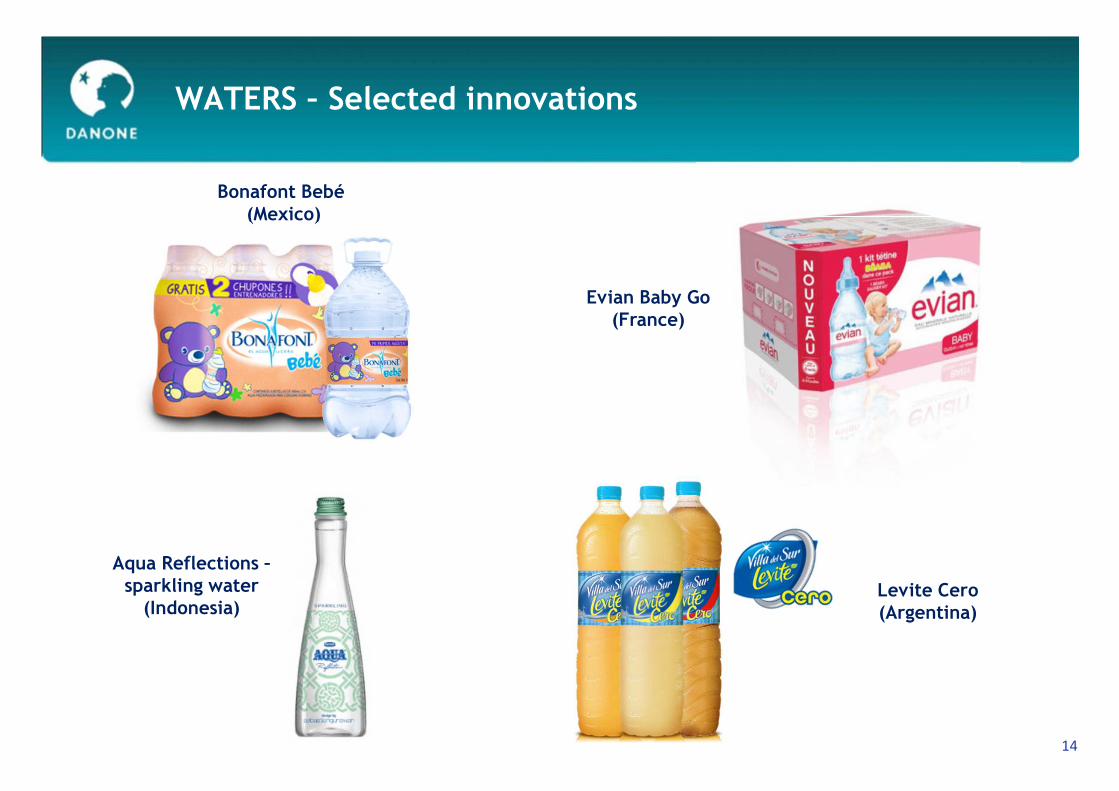
WATERS – Selected innovations
14
Bonafont Bebé (Mexico)
Aqua Reflections –sparkling water(Indonesia)
Levite Cero(Argentina)
Evian Baby Go(France)

BABY NUTRITION – Exceptional performance
15
Like-for-like sales growth
Outperformance driven by China, partly favored by Chinese new year
Europe strong; supported by overseas demand and good dynamics of milks, despite
continued weakness in food and Southern Europe
Latam developing well
11.2%
9.6%10.5%
11.4%
9.0%
13.6%
11.5%12.1%
17.1%
Q1 11 Q2 11 Q3 11 Q4 11 Q1 12 Q2 12 Q3 12 Q4 12 Q1 13

BABY NUTRITION – Selected innovations
16
Aptamil Soja(Brazil)
Mellin Bakery line (Italy)
Dumex specials renovation(China)
Hi Q Yo-Kids(Thailand)
Nutrilon Pepti Lactose-free(Thailand)
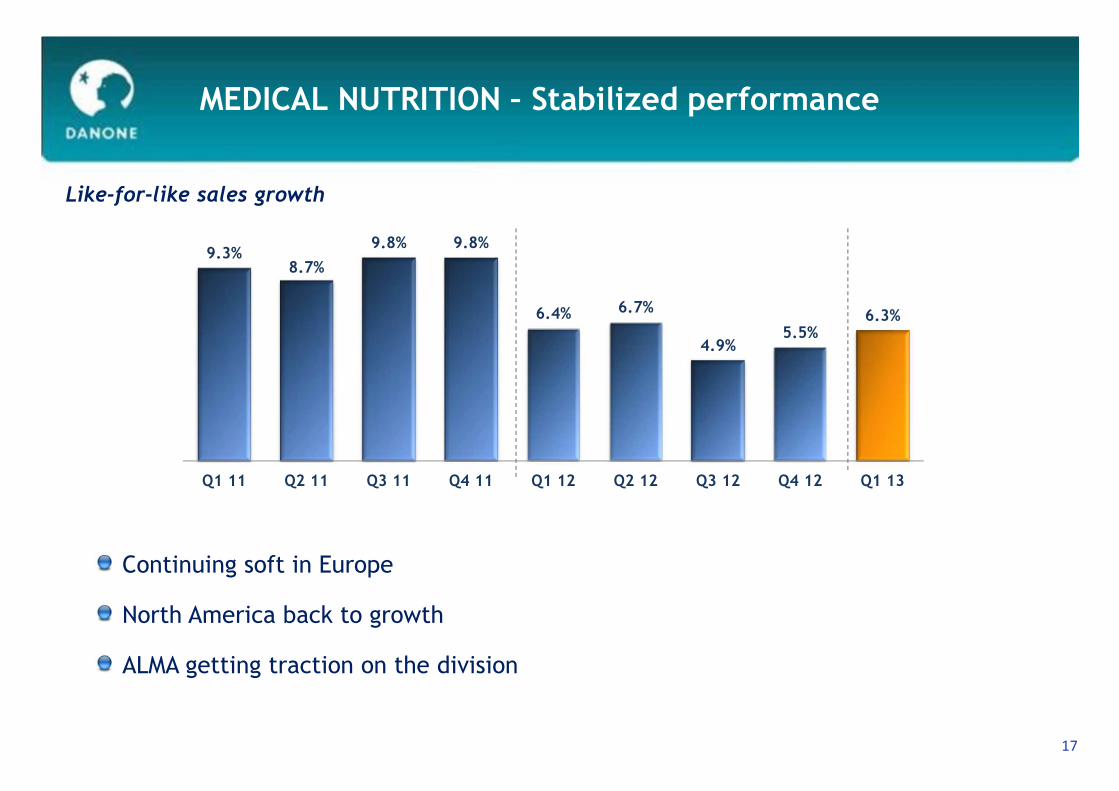
MEDICAL NUTRITION – Stabilized performance
17
Like-for-like sales growth
Continuing soft in Europe
North America back to growth
ALMA getting traction on the division
9.3%8.7%
9.8% 9.8%
6.4% 6.7%
4.9%5.5%
6.3%
Q1 11 Q2 11 Q3 11 Q4 11 Q1 12 Q2 12 Q3 12 Q4 12 Q1 13
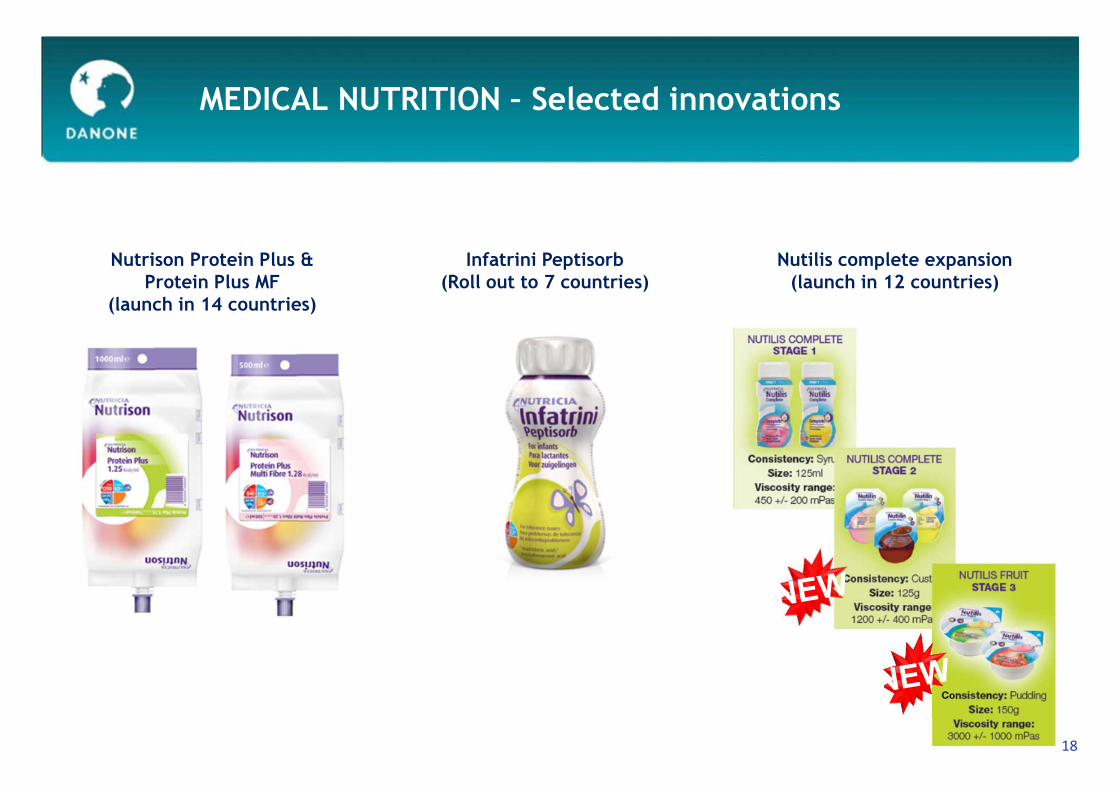
MEDICAL NUTRITION – Selected innovations
18
Nutrison Protein Plus & Protein Plus MF
(launch in 14 countries)
Infatrini Peptisorb(Roll out to 7 countries)
Nutilis complete expansion (launch in 12 countries)

2013 OUTLOOK
1919

20
2013-2014 Vision
2020
Europe :
Adapt & fix
– Savings & competitiveness
– Value for consumers
Growth markets :
Invest & leverage
Strong Sustainable
2013 a year of transition 2014 back to

-30bps to -50bpsTrading operating margin(1)
21
2013 Objectives
(1) Like-for-like : Based on constant scope of consolidation and constant exchange rates
At least 5%
2013 objectives
Sales growth (1)
Around € 2 bn Ex exceptionnal items
Free cash-flow (2)
21(2) Free cash-flow: Cash flow from operations less capital expenditure (net of disposals) and excluding business combinations fees
22
APPENDIX
22

Impact of currencies and scope – Q1 13
Currency
Scope of consolidation
Reported sales growth
(2.8)%
(0.3)%
+5.5%
(2.6)%
+1.6%
(0.3)%
WatersDairyBaby
Nutrition
(1.6)%
+0.6%
+16.1%
Medical
Nutrition
+6.8%
(1.3)%
Total
+1.8%
(2.4)%
+4.3%
+1.1%
Like-for-like sales growth +8.6%+0.7% +17.1% +6.3% +5.6%
23
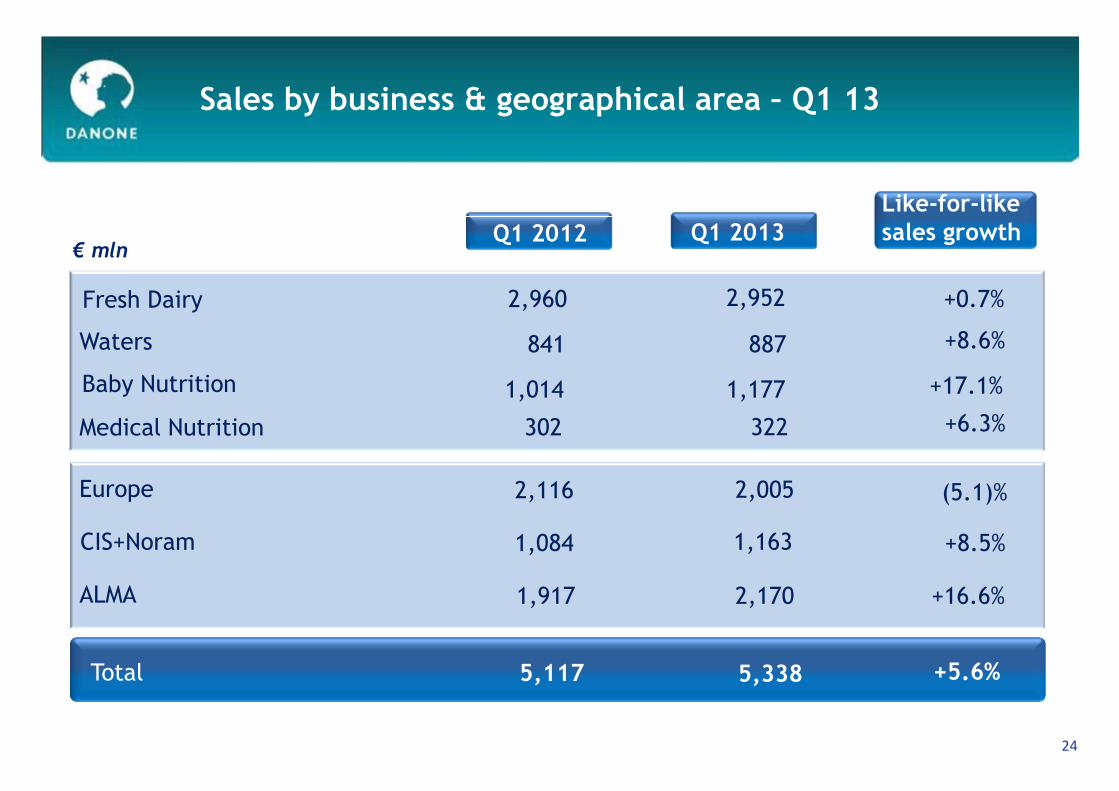
Sales by business & geographical area – Q1 13
Fresh Dairy
Baby Nutrition
Waters
Medical Nutrition
€ mln Q1 2013
Like-for-like sales growth
Total
24
Q1 2012
Europe
CIS+Noram
ALMA
2,952
1,177 +17.1%
+6.3%
+8.6%
+0.7%
887
322
2,960
1,014
841
302
5,338 +5.6%5,117
2,005
2,170
1,163
(5.1)%
+16.6%
+8.5%
2,116
1,917
1,084
25
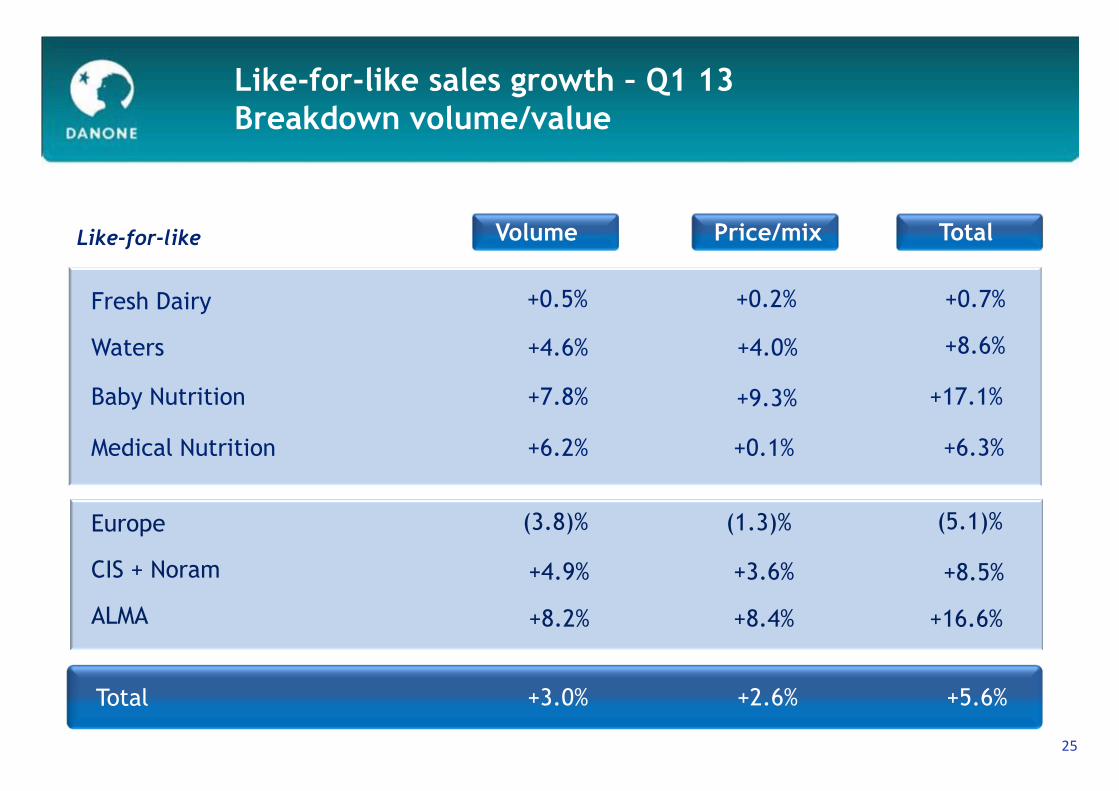
+4.0%
+0.1%
+9.3%
+0.2%
+4.6%
+6.2%
+7.8%
+0.5%
(1.3)%
+8.4%
+3.6%
(3.8)%
+8.2%
+4.9%
Like-for-like Volume Price/mix Total
Like-for-like sales growth – Q1 13 Breakdown volume/value
Fresh Dairy
Baby Nutrition
Waters
Medical Nutrition
Europe
CIS + Noram
ALMA
Total +3.0% +2.6%
+17.1%
+6.3%
+8.6%
+0.7%
(5.1)%
+16.6%
+8.5%
+5.6%

26
Changes in exchange rates27.9% of sales denominated in €
US dollar 8.8%
4.6%Brazilian real
5.9%Indonesian rupiah
10.6%Russian ruble
5.4%
Mexican peso
1.7%Turkish lira
1.8%Canadian dollar
Polish zloty 2.6%
4.5%British pound
% totalQ1 13 sales
Q1 13 vsQ1 12 (avg)
(0.7)%
+1.9%
(0.1)%
(1.5)%
(12.1)%
(6.9)%
(1.4)%
+1.8%
(2.0)%
5.3%
Argentinian peso (14.0)%
Chinese yuan 6.7% +0.6%
Notes
27

Notes
28