Results from the National Survey of Independent and ...
32
Results from the National Survey of Independent and Community Clinical Laboratories November 14, 2012
Transcript of Results from the National Survey of Independent and ...
Results from the National Survey of Independent and Community Clinical Laboratories November 14, 2012

2
This report was prepared by Marsha Regenstein1 and Ellie Andres2 from the Department of Health Policy at the George Washington University School of Public Health and Health Services.
1Marsha Regenstein, PhD, is a Professor in the Department of Health Policy. 2Ellie Andres, MPH, is a Senior Research Associate in the Department of Health Policy.
3
Table of Contents
Executive Summary ............................................................................................................... 4
Introduction .......................................................................................................................... 7
Methods ............................................................................................................................... 7
A Note about the Display of Results ....................................................................................... 8
Characteristics of National Survey Respondents ..................................................................... 9
Organizational Service and Volume Characteristics .............................................................. 11 Testing Volume ................................................................................................................................................................ ....... 11 Specimen Collection by Venipuncture .......................................................................................................................... 13 Client Types and Services................................................................................................................................................... 13 Laboratory Information System Connectivity Capabilities .................................................................................. 16
Financial Characteristics ...................................................................................................... 17 Workforce and Staffing ....................................................................................................................................................... 17 Operating Revenue and Expenses .................................................................................................................................. 18 Requisition and Service Volume by Payer and Client Type ................................................................................. 20 Operating Revenue by Payer, Client and Test............................................................................................................ 23
Payment Issues ................................................................................................................... 24 Delayed or Lack of Payment .............................................................................................................................................. 25 Response to Medicare Payment Cuts ............................................................................................................................ 26 Future Business Challenges .............................................................................................................................................. 28
Laboratory Profiles .............................................................................................................. 28 Shiel Medical Laboratory, New York ............................................................................................................................. 29 Biomedical Laboratory, Ohio ............................................................................................................................................ 30 Western Health Sciences, California .............................................................................................................................. 32

4
Executive Summary
In 2012, researchers from the Department of Health Policy at The George Washington University School of Public Health and Health Services conducted a survey of community and regional independent laboratories across the country to gather information about their characteristics and the challenges they face in an increasingly competitive marketplace. Seventy-seven laboratories responded to the survey and provided in-depth information about their organizations, business and payer trends, service delivery and workforce challenges, and pressing concerns associated with decreases in Medicare Part B payment rates for clinical laboratory services from a multitude of recent cuts made by Congress. The responding laboratories represent a broad range of independent community and regional laboratories with primary testing facilities in 22 states. Respondents are primarily privately-owned and most identify as “clinical” or “clinical and anatomic” laboratories. Two-thirds of respondents operate only one testing facility. Most laboratories serve urban, suburban and rural markets; on average, an individual laboratory has been in business 22 years.
The second largest market served by the independent community laboratories surveyed is nursing homes and skilled nursing facilities, a market that distinguishes this segment of the independent laboratory community from large national laboratories. Many respondents specifically indicated that congressionally-imposed Medicare cuts are resulting in an adjustment to their business decisions and the markets they are able to serve. Laboratory respondents stated that they have reduced the number of nursing home clients they serve as a result of the Medicare cuts, with some indicating that they no longer seek out nursing home clients and others indicating they more carefully select nursing home clients to limit their geographic service area and reduce associated travel costs. Many of the respondents reported low profit margins, making them particularly vulnerable to cuts in Medicare payments and threatening their ability to provide services to their communities. In thinking about the implications of these business challenges, some of the labs directly talked about what happens if they are unable to provide these critically important services, particularly to nursing homes and home care agencies. Some noted that without a community independent laboratory to service market need, nursing homes and home care agencies would likely send their patients to the hospital for urgent testing, resulting in higher Medicare and private insurance costs in terms of emergency services and inpatient stays.
Among the survey findings:
• In terms of testing volume, community and regional independent laboratories tend to be small, relative to industry standards – i.e., they have less than $10 million in annual revenues or perform fewer than one million tests annually.
• Community and regional independent laboratories employ a mix of scientific and technical staff and administrative staff. On average, respondents reported employing 272 total employees, including full- and part-time employees.

5
• Nearly half of the small to medium-sized independent community laboratories estimated their average profit margins between zero and 3 percent.
• Laboratories with low profit margins were more likely to provide most of their stat and same-
day turnaround testing to nursing homes/SNFs: 71 percent of labs that provide the majority of their stat and same-day turnaround testing to nursing homes and SNFs had low profit margins.
• Many independent community and regional laboratories serve patients, such as homebound and nursing home patients that other types of laboratories are not willing to serve. As laboratory services contract or laboratories curtail those services that are not profitable, patients who are underserved by other segments of the laboratory market will have fewer opportunities to receive the critical diagnostic and monitoring services that they need.
• Medicare Part B laboratory payments have not gone up in years while inflation has continued to increase on the expense side. About half of respondents reported participation in a buyer’s group or cooperative for reagents, supplies or laboratory equipment, indicating they are already taking advantage of opportunities to increase efficiencies.
• Several low-cost laboratory tests comprised a large proportion of respondents’ operating revenues. These include: complete blood counts (CBC-85025), which have a Medicare fee limit of $11.02; comprehensive metabolic panels (CMP-80053) with a fee limit of $14.97; urinalysis (81001) at $4.48; prothrombin (85610) at $5.56; lipid panels (80061) at $14.57; and basic metabolic panels (BMP-80048) at $11.98.Almost all of the respondents receive specimens for testing from individual or group physician practices and approximately half of respondents process specimens collected from patients’ homes, nursing homes/skilled nursing facilities (SNFs) and assisted living facilities. About one-quarter of respondents receive specimens from hospitals, community health centers and other laboratories.
• More than half of the services provided by respondents were for individual or group physician practices. Nursing homes and SNFs accounted for the second highest volume of services, representing one-fifth of respondents’ total services.
• Among independent community and regional laboratories, providing local customer service appears to be a core value. The majority of respondents indicated they take calls directly from patients, operate an “800” number and offer other types of customer service (69%). Eight out of ten respondents provide “stat” and same-day turnaround testing for their clients.
• For some laboratories, nursing homes and SNFs are the most common place for stat and same-day turnaround tests. About one in four laboratories report that at least 60 percent of their same-day turnaround services are for nursing homes and skilled nursing facilities and about a quarter report the same proportion for stat testing

6
• Laboratories commonly provide services to different patient populations and different health care settings and consequently have a payer mix that reflects this variation. Medicare Part B and private insurance paid for the vast majority of laboratory requisitions.
• Laboratories routinely face the challenge of providing services that are never paid, or paid only after long delays. Payment delays are a substantial problem for laboratories that perform work for Medicaid providers, including fee-for-service Medicaid as well as Medicaid managed care. These programs took an average of 48 and 50 days, respectively, to deliver payment. Not far behind, Medicare Part A was reported taking 43 days for payment and private insurers were paying on average at about 40 days.
• The top business challenges indicated by respondents were Medicare cuts with 66 percent of respondents indicating this as one of their top two business challenges, followed by national insurers selecting preferred laboratory providers (50%).

7
Introduction This report presents findings from a national survey of community and regional independent clinical laboratories conducted by researchers from the Department of Health Policy at George Washington University School of Public Health and Health Services, with support from the National Independent Laboratory Association (NILA). The purpose of this survey was to profile independent community clinical laboratories, including descriptive information, financial characteristics and analyses of the impact of changes in the market, such as reductions in Medicare Part B payments for clinical laboratory services that are reimbursed under the Medicare Clinical Laboratory Fee Schedule. Relatively little information is currently available about the structure, financial characteristics, and business challenges of this important segment of the laboratory market. The results of this study will enhance understanding of the clinical laboratory industry and the impact of Medicare payment cuts and will provide useful information to guide policymaking and advocacy efforts.
Methods We developed an in-depth survey for community and regional independent clinical laboratories. The survey was targeted toward laboratory owners or managers who could provide detailed information about a laboratory’s operations and financial characteristics. The survey included basic questions about the size and scope of participants’ laboratories to provide baseline information about independent community laboratories as well as detailed financial questions and open-ended questions about business choices in light of increasing Medicare cuts. For several questions, we asked laboratories to provide information for 2010 and 2011. This allowed us to see changes across the two years and also to identify potential reporting errors. The survey questions were reviewed by representatives from NILA and member laboratories and revised based on their feedback.
We worked closely with NILA to generate a list of potential survey participants. NILA’s goal was to engage traditional, independent community (local and regional) clinical laboratories whose Medicare reimbursement is derived mainly from the Part B Clinical Laboratory Fee Schedule (CLFS). As such, the sample of labs surveyed is not representative of the overall independent laboratory market.
Our sample selection involved several stages. We used the June 14, 2012, CLIA-published list of independent laboratories in all 50 states (not including US Territories or Washington, DC) as a starting point for generating a sample of labs. This generated a list of nearly 4,000 independent labs. CLIA's categorization as “independent” relies on the laboratory self-designation and does not require specific designation criteria related to a lab’s independent governance or business structure. We then excluded laboratories that are affiliated with other practice structures (i.e., physician office laboratories or hospital laboratories without separate federal tax ID numbers) or other labs that did not meet our definition of independence. We also excluded assisted reproductive laboratories/in vitro fertilization laboratories, since these laboratories receive virtually no Medicare reimbursement. Finally, we excluded publicly traded national laboratories (e.g. LabCorp, Quest), since their data is already publicly available, and the intent of this survey was to collect information not previously available to the public.

8
We generated a convenience sample of approximately 180 laboratories from the larger list of potential laboratories meeting our inclusion criteria to participate in the survey. The sample includes NILA members and other non-member laboratories.
We designed the survey using the Survey Monkey online platform, allowing for easy access via a personalized web-based link for survey participants. We pilot tested the survey with two NILA member laboratories to identify any problems with the survey questions or other technical issues. Laboratories from the list were invited via email to respond to the survey. The survey included two initial questions to determine that respondents met our inclusion criteria. Respondents who answered “yes” to either of the following two questions were not permitted to continue with the survey:
1) If your laboratory is owned by a hospital, does your laboratory have a federal tax ID number separate and distinct from the hospital tax ID number?
2) Is your laboratory owned, in whole or in part, by Quest or LabCorp?
The survey was open for approximately one month between mid-July and mid-August 2012.
We supplemented the survey data with qualitative descriptions developed through interviews with three survey respondents. These interviews provide a deeper understanding of the laboratories’ business environment, the practices they use to provide the highest quality care to patients in their communities, and the challenges they face in staying competitive in their markets. The interviews illustrate the range of service providers in the independent laboratory marketplace and the types of concerns community and regional laboratories have in the face of current and future Medicare Part B payment cuts. The laboratories that participated in the qualitative interviews are profiled at the end of this report.
A Note about the Display of Results Throughout this report we present results in a number of ways to give readers a sense of the depth of the findings. Results are displayed as aggregate total volumes, average total volumes, and by numerical categories. Generally, we begin by discussing the total and average volumes, before discussing the breakdown by specific categories.

9
Characteristics of National Survey Respondents A total of 77 laboratories completed the survey, for a response rate of 43 percent. Respondents represent a broad range of regional and community independent laboratories. Approximately half of respondents are members of NILA. Respondent laboratories operate their primary testing facilities in over 22 states and serve all community types, including urban (90%), suburban (85%) and rural (71%) markets (Figure 1).
We asked respondents to identify the category that best describes the type of laboratory services they provide (Figure 2). Half of the respondents primarily identified as a clinical lab (51%) and a third (32%) identified as clinical and anatomic pathology laboratories. Other types of laboratories represented included toxicology (9%), anatomic pathology (5%), genetic testing (2%) and molecular (2%).

10
On average, respondent laboratories have been in business for 22 years, although the range in this sample is quite wide. Some of the laboratories have been operating for more than 50 years; one lab has been in business for nearly a century. Twenty-five respondents have been in business for 20 years or more and of those, 10 have been in business for 35 years or more. Five laboratories that responded noted being new to the market, indicating they have been in business for less than one year. Nearly one-in-five respondents have been operating for three years or less. Figure 3 illustrates the ownership of responding laboratories. Approximately seven out of 10 respondents are privately owned laboratories (69%). About one in five indicated other types of ownership, including venture capital or investment groups (7%), medical groups or clinics (6%), hospitals or hospital systems (6%) and the government (1%). Eleven percent of respondents indicated “other” as their ownership type. Note that hospital-owned laboratories that did not have separate tax IDs from the owning hospital were excluded from the survey. Laboratories owned in whole or in part by Quest or LabCorp were also excluded. The majority of respondents operate as S Corporations (46%), C Corporations (24%) or partnerships (20%) including LLCs and LLPs.

11
Organizational Service and Volume Characteristics
Testing Volume The majority of community and regional independent laboratories that responded to the survey are small, relative to industry standards. The best estimates of industry-wide information for clinical laboratories to provide a benchmark for annual test volume are captured in the annual G-2 reports, which provide analyses of market trends for the laboratory industry. The 2009 Washington G-2 Reports Laboratory Industry Strategic Outlook defines small independent laboratories in two ways: having less than $10 million in annual revenue or performing less than one million tests annually. Based on the second criterion, nearly two-thirds of respondents would be considered “small” independent laboratories conducting fewer than a million tests per year. While many respondents would be considered “small” laboratories, the average annual test volume reported by respondents (2.5 million) is about 36 percent higher than the average test volume for small independent laboratories reported in the 2009 G-2 Report.
Total testing volume increased over the 2010-2011 period, although average volumes across respondents stayed flat. In 2011, respondents reported a total of 104 million tests performed. The average annual test volume was approximately 2.53 million in 2010 and 2.55 million in 2011. However, despite this relatively high average annual volume, nearly half of laboratories reported annual testing volumes less than 500,000 in both years (Figure 4). Less than 30 percent of respondents operated at test volumes under 100,000. Approximately 35 percent of respondents in 2010 and 31 percent of respondents in 2011 conducted between 100,000 and 1 million tests, while nearly 40 percent conducted over a million tests in both years. Only one respondent indicated volume greater than 10 million for 2010 and only two indicated so for 2011.

12
Two-thirds of respondents (67%) said they operate only one testing facility. A quarter (25%) of respondents operate between two and five testing facilities, and 9 percent operate six or more. Respondents’ primary testing facilities were located in 23 states spanning primarily the northeast and southwest. However, most respondents indicated that they receive specimens for testing from at least two states and several respondents indicated that they provide testing for specimens received from all 50 states.
Collectively, respondent laboratories billed 58 million CPT codes in 2010 and 67 million in 2011, lower than the total testing volumes reported above (Figure 5). This finding indicates respondent laboratories may not be billing for all tests performed, and thus, are likely not being paid for the full volume of tests performed. The average number of CPT codes billed was 2.1 and 2.3 million in 2010 and 2011, respectively.
Approximately one-third of laboratories in 2010 and just over a quarter in 2011 billed less than 100,000 CPT codes (Figure 6). Another 36 percent in 2010 and 2011 billed between 100,000 and 1 million CPT codes. Thirty percent of respondents in 2010 and 36 percent in 2011 billed over one million CPT codes. Only one laboratory reported billing more than 10 million CPT codes in both years.

13
Specimen Collection by Venipuncture The 77 responding laboratories reported a total of approximately 8.5 million specimens collected by venipuncture in 2011. More than a quarter of respondents indicated that they do not collect any specimens. Most respondents collected fewer than 100,000 specimens; 72 percent in 2011 reported fewer than 100,000 specimen collections (Figure 7).
Laboratories that collect specimens generally do so at multiple facilities. Almost half (44%) operate six or more facilities that collect specimens and just over a third (36%) operate two to five collection facilities. Only about one in five (21%) operates only one facility that collects specimens. While 40 percent of respondents that collected specimens collected them in only one state, over a third (35%) collected specimens from two to five states and a fifth (20%) collected specimens from six or more states.
Client Types and Services We asked respondents to identify the types of clients they serve; all survey respondents chose multiple responses, indicating that they serve several different client types. Almost all of the respondents (91%) receive specimens for testing from individual or group physician practices (Figure 8). In addition, approximately half of respondents process specimens collected from patients’ homes (51%), nursing homes/skilled nursing facilities (47%), and assisted living facilities (47%). Approximately one-quarter of respondents receive specimens from hospitals (28%), community health centers (25%) and other laboratories (28%).

14
Consistent with the large number of respondents that indicated they serve physician practices, the majority of services provided by respondents were for individual or group physician practices (57% in 2010 and 60% in 2011) (Figure 9). Nursing homes and SNFs accounted for the second highest volume of services, representing 21 percent of respondents’ services for both years. The large proportion of nursing home/SNF services is important to note in light of the fact that only half of respondents indicated serving nursing homes/SNFs as stated earlier. Hospitals, assisted living facilities, and home health services each accounted for eight percent or less of services provided by laboratories surveyed; community health centers comprised only about 2 percent of respondents’ services in either year.
15
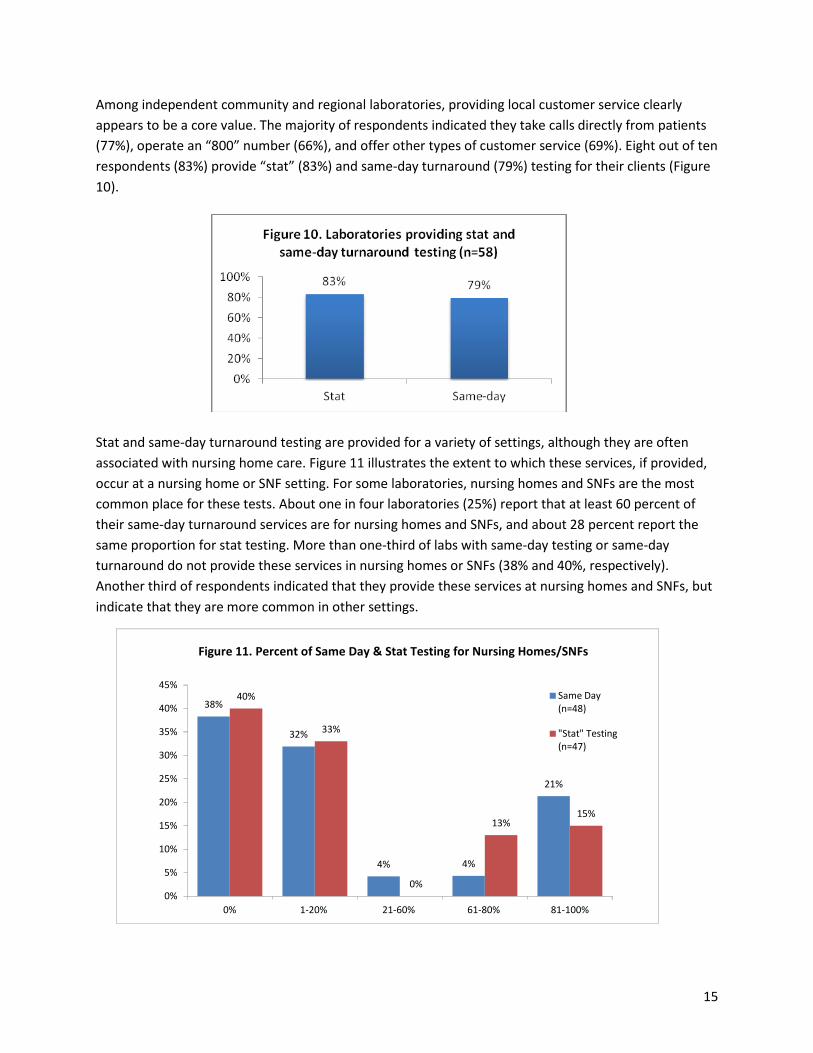
Among independent community and regional laboratories, providing local customer service clearly appears to be a core value. The majority of respondents indicated they take calls directly from patients (77%), operate an “800” number (66%), and offer other types of customer service (69%). Eight out of ten respondents (83%) provide “stat” (83%) and same-day turnaround (79%) testing for their clients (Figure 10).
Stat and same-day turnaround testing are provided for a variety of settings, although they are often associated with nursing home care. Figure 11 illustrates the extent to which these services, if provided, occur at a nursing home or SNF setting. For some laboratories, nursing homes and SNFs are the most common place for these tests. About one in four laboratories (25%) report that at least 60 percent of their same-day turnaround services are for nursing homes and SNFs, and about 28 percent report the same proportion for stat testing. More than one-third of labs with same-day testing or same-day turnaround do not provide these services in nursing homes or SNFs (38% and 40%, respectively). Another third of respondents indicated that they provide these services at nursing homes and SNFs, but indicate that they are more common in other settings.
38%
32%
4% 4%
21%
40%
33%
0%
13%15%
0%
5%
10%
15%
20%
25%
30%
35%
40%
45%
0% 1-20% 21-60% 61-80% 81-100%
Same Day(n=48)
"Stat" Testing (n=47)
Figure 11. Percent of Same Day & Stat Testing for Nursing Homes/SNFs
16
The majority of responding laboratories (88%) refer tests to other clinical laboratories. Most laboratories (60%) refer less than 5 percent of all tests and another 28 percent refer between 5 and 10 percent of tests. Only 12 percent of respondents refer more than 10 percent of their tests.
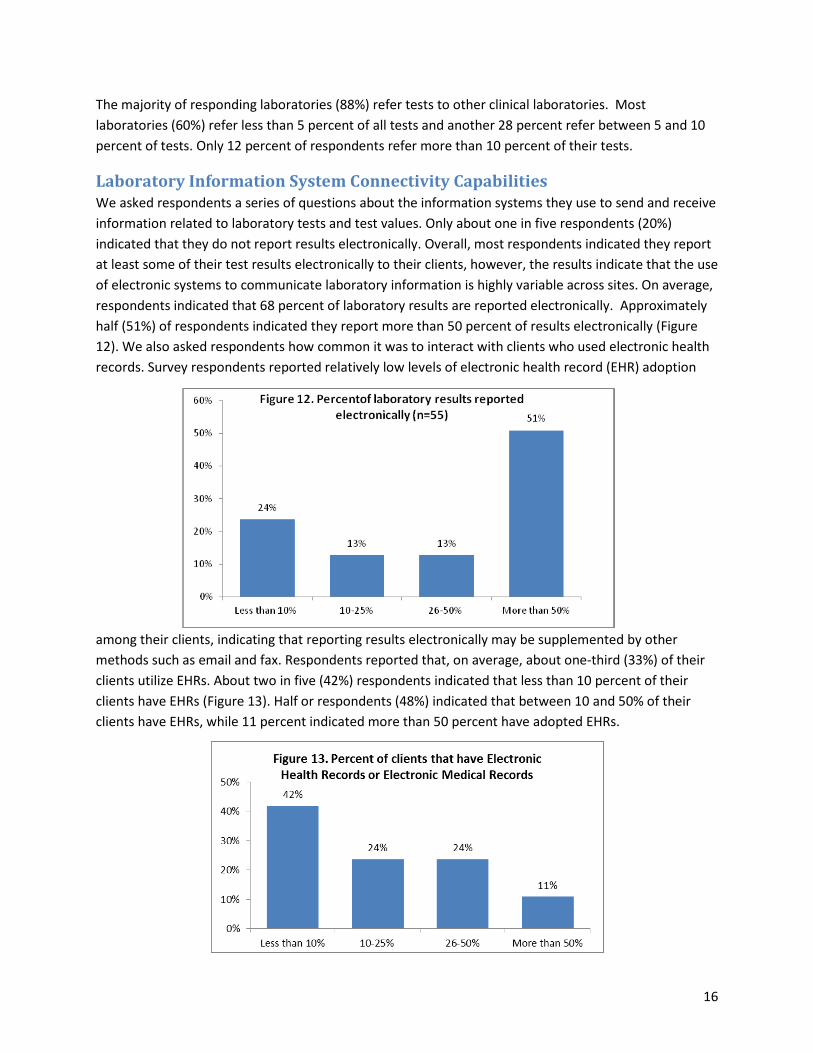
Laboratory Information System Connectivity Capabilities We asked respondents a series of questions about the information systems they use to send and receive information related to laboratory tests and test values. Only about one in five respondents (20%) indicated that they do not report results electronically. Overall, most respondents indicated they report at least some of their test results electronically to their clients, however, the results indicate that the use of electronic systems to communicate laboratory information is highly variable across sites. On average, respondents indicated that 68 percent of laboratory results are reported electronically. Approximately half (51%) of respondents indicated they report more than 50 percent of results electronically (Figure 12). We also asked respondents how common it was to interact with clients who used electronic health records. Survey respondents reported relatively low levels of electronic health record (EHR) adoption
among their clients, indicating that reporting results electronically may be supplemented by other methods such as email and fax. Respondents reported that, on average, about one-third (33%) of their clients utilize EHRs. About two in five (42%) respondents indicated that less than 10 percent of their clients have EHRs (Figure 13). Half or respondents (48%) indicated that between 10 and 50% of their clients have EHRs, while 11 percent indicated more than 50 percent have adopted EHRs.

17
About two-thirds of respondents (67%) indicated they are able to bridge to or interface with at least some of their clients’ electronic systems and receive laboratory requisitions electronically (Figure 14). However, a third of respondents (33%) indicated that they are not able to bridge with any client systems. Among respondents that were unable to bridge to or interface with clients at all or in some cases, the most common reason given for the lack of connectivity was the high cost of electronic systems. Respondents also reported lack of system interoperability as a barrier; some also indicated a preference for email or other systems to communicate with clients. Other challenges in this area relate to clients’ lack of electronic systems, client reluctance to acquire such systems, the time commitment necessary to develop an electronic interface system, and the fact that many of their clients are very small and consequently resource and time intensive in terms of implementation and operations.
The majority of respondents (63%) estimated their average cost of interfacing with clients to be between $5000 and $9999. Some respondents (19%) indicated their average cost was under $5000 and a few (13%) estimated their cost was between $10,000 and $20,000. Respondents commented that, in addition to cost, lack of vendor and client responsiveness and a lack of standardization with disparate systems also contribute to an inability to electronically interface with clients.
Financial Characteristics
Workforce and Staffing Laboratories rely on a mix of professionals and other support staff to perform technical work, manage business and marketing operations, and support the day-to-day delivery of services. Laboratories report that just over half of their workforce (54%) is made up of scientific or technical staff and a quarter (25%) is comprised of staff responsible for administrative or billing tasks (Figure 15). Other staff include maintenance or janitorial workers (2%), drivers who pick up specimens (9%), sales or marketing (8%) and other unspecified employees (11%). Respondents reported, on average, that they employ 272 total employees. In terms of full and part-time status, this includes an average of 201 full-time employees, 43 part-time employees and 2 contract employees.

18
When asked about workforce shortage issues, most respondents (81%) indicated technical positions are the most difficult to fill, although filling administrative positions were reported to be most difficult for 7 percent of responding laboratories. Twelve percent of respondents said they did not experience any particular difficulties filling positions. Among those having difficulties filling positions, 71 percent of respondents indicated it took one to three months to fill them, 21 percent said it took four to six months and 7 percent reported it took seven to twelve months. When asked about the factors that contributed to difficulties finding qualified candidates to fill employment openings, laboratories indicated two principal reasons: 1) competition with hospitals and other larger organizations that offer higher wages; and 2) a limited pool of qualified candidates with the necessary training or experience to meet the requirements of the position.
Operating Revenue and Expenses The independent laboratory market is a competitive one, with challenges resulting from market consolidation, Medicare Part B payment cuts, aggressive pricing from larger independent laboratory companies, and other considerations associated with operating service-based industries in a changing health care environment. We asked responding laboratories to provide information about their revenues and expenses for the years 2010 and 2011, as well as the payers that figure most prominently in their financial outlook.
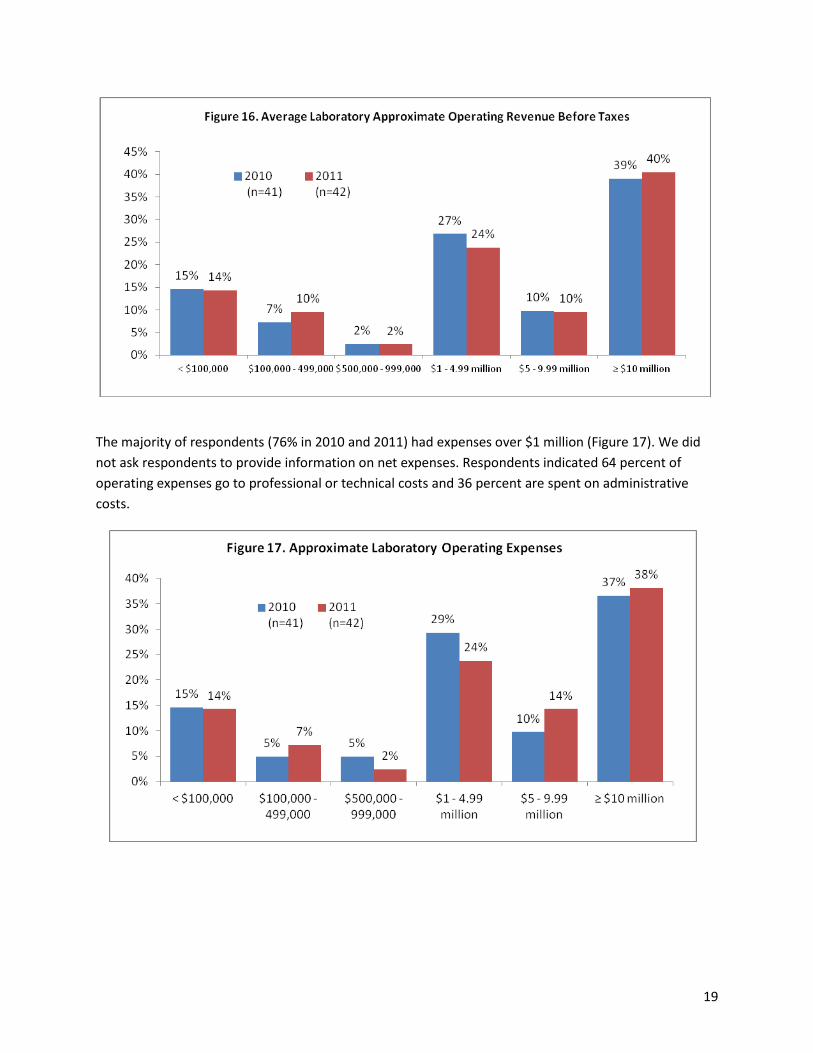
Respondents reported average operating revenues of $21.6 million in 2010 and $24.3 million in 2011. Approximately a quarter of laboratories (24% in 2010 and 26% in 2011) reported operating revenues of less than a million (Figure 16). Another quarter reported operating revenues between $1 and $5 million. Half of respondents (49% in 2010 and 50% in 2011) reported operating revenues over $5 million, with most (39% in 2010 and 40% in 2011) indicating revenues greater than or equal to $10 million.
19
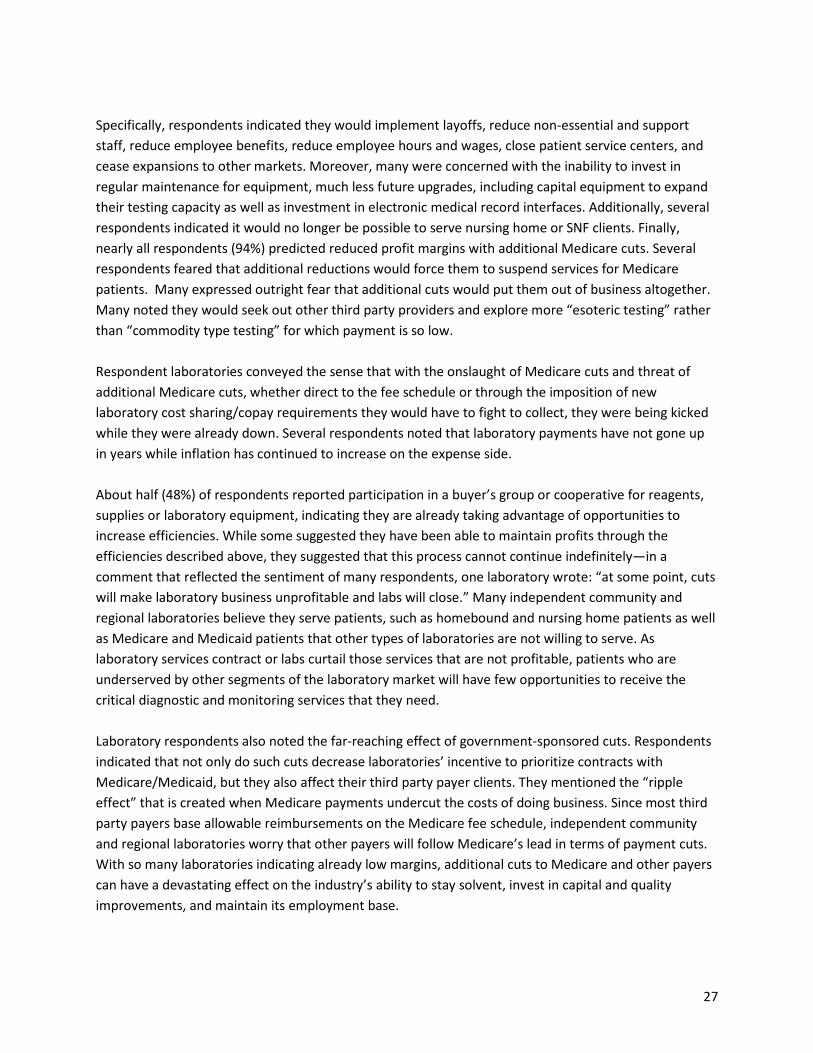
The majority of respondents (76% in 2010 and 2011) had expenses over $1 million (Figure 17). We did not ask respondents to provide information on net expenses. Respondents indicated 64 percent of operating expenses go to professional or technical costs and 36 percent are spent on administrative costs.

20
We asked laboratories about their average profit margins to gain a sense of the health of the small to medium-sized independent laboratory market. The findings indicate that most laboratories are operating at very low margins (Figure 18). Nearly half of laboratories estimated their average margins between zero and 3 percent (48% in 2010 and 49% in 2011). One-fifth (20% in 2010 and 17% in 2011) estimated their profit margin to be between 4 and 6 percent. About one-quarter (26%) indicated that their margins were 10 percent or greater in either year.
We reviewed the data to determine whether laboratories with relatively low profit margins were more likely to have certain characteristics. Laboratories with low profit margins were more likely to:
• Serve rural communities: Nearly 40 percent of laboratories serving rural communities had low profit margins.
• Provide most of their stat and same-day turnaround testing to nursing homes/SNFs: 71 percent of labs that provide the majority of their stat and same-day turnaround testing to nursing homes and SNFs had low profit margins.
Requisition and Service Volume by Payer and Client Type Respondents processed an average of 622,000 laboratory requisitions in 2010 and 653,000 in 2011 for an average of approximately four tests per requisition in each year. About three-quarters of respondents processed under 500,000 requisitions, with most of those indicating they processed under 100,000 (Figure 19). All but one of the other respondents processed between 500,000 and 1.5 million requisitions. These numbers were quite consistent between 2010 and 2011.
Figure 18. Average Laboratory Profit Margin

21
Laboratories commonly provide services to different patient populations and in different health care settings and consequently have a payer mix that reflects this variation. We asked the respondents to provide information about the distribution of volume and revenues across the different payer categories. As we anticipated, Medicare Part B and private insurance paid for the vast majority of requisitions processed in 2010 and 2011. Respondents processed on average 106,000 Medicare Part B requisitions and 93,000 private insurance requisitions in 2010 (See Table 1). In 2011, Medicare Part B requisitions declined slightly while private insurance, Medicare Part A and Medicaid requisitions increased. While Medicare Part B paid the largest number of requisitions in 2010 and 2011, private insurance paid for the most total services. On average, respondents billed Medicare Part B for 293,000 services and private insurance for 371,000 services in 2010. The average number of services billed to private insurance more than doubled to 786,000 in 2011. Medicare Part B billed services increased a more modest 12 percent to 329,000 services on average. This finding may indicate that private insurance requisitions are more likely to have multiple tests per requisition than Medicare Part B requisitions. Medicaid saw the largest boost in services, tripling between 2010 and 2011, from about 59,000 to 176,000 services.

22
Table 1. Laboratories’ Average Number of Requisitions and Services by Payer 2010
Requisitions (n=29)
2011 Requisitions
(n=30)
2010 Services (n=28)
2011 Services (n=31)
Medicare (Part A) hospital insurance 35,331 39,328 94,219 96,507 Medicare (Part B) fee-for-service 106,544 105,196 293,912 328,924 Medicare managed care (Medicare Advantage)
4,706 5,663 7,578 13,514
Medicaid 14,156 15,185 58,729 176,482 Medicaid managed care 12,538 14,402 3,344 56,963 Private Insurance 93,072 100,649 371,280 785,937 Self Pay (cash from patient) 7,351 8,197 14,731 27,999 Other 35,874 37,920 164,696 196,461
We also asked respondents specifically about the number of requisitions they process for nursing homes and SNFS. Among respondents that served nursing homes and SNFs, the average number of requisitions processed for nursing homes/SNFs declined from 224,000 in 2010 to 197,000 in 2011. Most respondents (82% in both years) processed less than 100,000 nursing home/SNF requisitions, but one-fifth processed over 100,000 (Figure 20).

23
Operating Revenue by Payer, Client and Test Respondents confirmed that Medicare Part B and private insurance reimbursement comprise the majority of their operating revenue. Each payer made up 31 percent of operating revenues in 2010 and slightly more in 2011 (Figure 21). “Other” payers, including self-pay and cash-only patients, also comprised a large proportion of operating revenue at 30 percent and 34 percent for 2010 and 2011, respectively. Medicaid comprised only 6 and 5 percent of operating revenue for 2010 and 2011, respectively. This finding is of note in light of the Medicaid requisition and service volume reported above. While Medicaid service volume is relatively high and increasing, payment appears to be disproportionately low.
Consistent with respondents’ service volume, individual and group physician practices and nursing home/SNFs accounted for the majority of operating revenue. Physician practices represented 51 percent of operating revenue in 2010 and 47 percent in 2011 (Figure 22). Nursing homes and SNFs accounted for 28 percent in 2010 and 26 percent in 2011. Unspecified client types represented the next largest share of operating revenue at nine percent in 2010 and 16 percent in 2011.

24
We asked respondents to provide information about the types of laboratory tests they perform and the revenues associated with these different types of tests. We found a substantial share of laboratory work involves very common, low-cost laboratory tests; in fact, these types of tests appear to be the “bread and butter” of the small- to medium-sized independent laboratory market.
Several low-cost tests comprised a large proportion of respondents’ operating revenues (Figure 23). Complete blood counts (CBC-85025), which have a Medicare fee limit of $11.02 contributed substantially to respondents’ operating revenues of the tests discussed, comprising 10 percent of respondents’ operating revenues, on average. The comprehensive metabolic panel (CMP-80053) with a fee limit of $14.97 also comprised a significant proportion of operating revenue at 9 percent, on average, as well as urinalysis (81001 - $4.48) and prothrombin (85610 - $5.56) tests at eight percent of operating revenue each, lipid panels (80061 - $14.57; varies slightly by carrier) at seven percent and basic metabolic panels (BMP-80048 - $11.98) at six percent. These basic, low-cost tests made up nearly 60 percent of respondents’ operating revenue, on average.
Payment Issues The survey included several questions about respondents’ business challenges and concerns, including open-ended questions designed to elicit individual comments. These included concerns related to timing of payment and whether payment was ever received from certain payers, as these issues came up frequently in our preliminary discussions with laboratories. We also asked about laboratories’ responses to recent and forthcoming Medicare payment cuts. As part of the Affordable Care Act, Congress reduced Medicare reimbursement for laboratory services through a “productivity adjustment” to the annual Consumer Price Index fee schedule update as well as a reduction in the Medicare Part B clinical laboratory fee schedule by 1.75 percent annually over five years. These cuts went into effect in 2011. In February of 2012, Congress passed an additional 2 percent cut to the Medicare Part B Clinical Laboratory Fee Schedule, which will go into effect in January of 2013. Also, in January 2013, sequestration is set to go into effect, resulting in a cut of up to 2 percent to Medicare reimbursement rates, including the

25
Medicare Part B Clinical Laboratory Fee Schedule. We asked respondent laboratories to describe the ways they have responded to the cuts already in effect and how they anticipate they will respond to additional cuts coming in 2013. We also asked respondents about their anticipated business challenges going forward.
Delayed or Lack of Payment The survey responses underscored a critical problem that many laboratories experience when seeking reimbursements from their payer sources. Laboratories routinely face the challenge of providing services that are never paid, or paid only after long delays. Payment delays are a substantial problem for laboratories that perform work for Medicaid providers, including fee-for-service Medicaid as well as Medicaid managed care. These programs took an average of 48 and 50 days, respectively, to deliver payment. Not far behind, Medicare Part A was reported taking 43 days for payment and private insurers were paying on average at about 40 days.
hese payment delays are particularly troublesome, given that so many tests that the laboratories bill for go unpaid by certain payers. Again, Medicaid payments presented the most challenging scenario in terms of unpaid tests. Respondents indicated that nearly a quarter of the tests (24%) that were performed under Medicaid managed care arrangements were never paid and 16 percent were never paid by fee-for-service Medicaid (Figure 24). Laboratories also reported that they were less likely to get paid by “self-pay” patients, with nearly 20 percent of self-pay patients’ tests never paid. The percent of tests for Medicare and private health insurance that were never paid is substantially smaller than the percent for Medicaid, yet Medicare and private coverage represent a much greater number of total tests for laboratories and therefore create substantial concerns in terms of lost revenue.
Survey respondents were asked to indicate the most common reasons for lack of payment. Laboratories indicated that receiving incorrect diagnosis or CPT codes from the physician, frequency limitations, and third party coverage limitations were the most common reasons for lack of payment (Figure 25). Frequency limitations refer to volume limits on Medicare services. These limitations can be invisible to

26
the health care provider or laboratory. Consequently, physicians may order lab tests for patients even though these tests exceed volume limits set by the Medicare program. Labs provide these tests based on a physician’s order and in good faith, but these services are deemed to be beyond coverage limits and are therefore not paid by Medicare. More than one-fifth of respondents attributed at least some non-payment to their practice of serving uninsured patients, who may lack resources to cover all or some portion of the costs of laboratory services. Notably, only 1 respondent indicated duplicative tests as a top reason for lack of payment.
Response to Medicare Payment Cuts Survey respondents were asked to provide comments about how their laboratories have responded to the Medicare cuts that went into effect in 2011 and 2012. Respondents’ comments make it clear that independent community and regional clinical laboratories are feeling the effects of recent Medicare cuts. The majority of respondents commented on the effect on their business, with most indicating they had implemented reductions in staff, including layoffs and hiring freezes. Two-thirds of respondents indicated they reduced hours by cutting overtime and salaries. Unfortunately, most respondents reported a need to reduce the number of services they provide, including services for skilled nursing facility and homebound patients, patient service centers that are not profitable, and stat testing services. Many respondents specifically indicated that they reduced the number of nursing home clients they served as a result of the Medicare cuts, with some indicating that they no longer seek out nursing home clients and others indicating they more carefully select nursing home clients to limit their geographic service area and reduce associated travel costs. The majority of respondents also reported a reduction in profit margins as a result of Medicare cuts, with some indicating that they were unable to sustain a profit with the cuts. When asked what effect additional Medicare payment cuts might have, respondents predicted further reductions in employees, hours, services, nursing home clients and profit margins. These findings raise important concerns for access to critical laboratory services, especially in communities where small to medium-sized independent community laboratories are core service providers. The potential for further cuts creates an even more dire prediction for the laboratories’ ability to meet the needs of patients and providers in their communities. Many laboratories indicated they are already feeling the strains of economic downsizing, thereby creating fewer opportunities to find additional efficiencies.
27
Specifically, respondents indicated they would implement layoffs, reduce non-essential and support staff, reduce employee benefits, reduce employee hours and wages, close patient service centers, and cease expansions to other markets. Moreover, many were concerned with the inability to invest in regular maintenance for equipment, much less future upgrades, including capital equipment to expand their testing capacity as well as investment in electronic medical record interfaces. Additionally, several respondents indicated it would no longer be possible to serve nursing home or SNF clients. Finally, nearly all respondents (94%) predicted reduced profit margins with additional Medicare cuts. Several respondents feared that additional reductions would force them to suspend services for Medicare patients. Many expressed outright fear that additional cuts would put them out of business altogether. Many noted they would seek out other third party providers and explore more “esoteric testing” rather than “commodity type testing” for which payment is so low. Respondent laboratories conveyed the sense that with the onslaught of Medicare cuts and threat of additional Medicare cuts, whether direct to the fee schedule or through the imposition of new laboratory cost sharing/copay requirements they would have to fight to collect, they were being kicked while they were already down. Several respondents noted that laboratory payments have not gone up in years while inflation has continued to increase on the expense side. About half (48%) of respondents reported participation in a buyer’s group or cooperative for reagents, supplies or laboratory equipment, indicating they are already taking advantage of opportunities to increase efficiencies. While some suggested they have been able to maintain profits through the efficiencies described above, they suggested that this process cannot continue indefinitely—in a comment that reflected the sentiment of many respondents, one laboratory wrote: “at some point, cuts will make laboratory business unprofitable and labs will close.” Many independent community and regional laboratories believe they serve patients, such as homebound and nursing home patients as well as Medicare and Medicaid patients that other types of laboratories are not willing to serve. As laboratory services contract or labs curtail those services that are not profitable, patients who are underserved by other segments of the laboratory market will have few opportunities to receive the critical diagnostic and monitoring services that they need. Laboratory respondents also noted the far-reaching effect of government-sponsored cuts. Respondents indicated that not only do such cuts decrease laboratories’ incentive to prioritize contracts with Medicare/Medicaid, but they also affect their third party payer clients. They mentioned the “ripple effect” that is created when Medicare payments undercut the costs of doing business. Since most third party payers base allowable reimbursements on the Medicare fee schedule, independent community and regional laboratories worry that other payers will follow Medicare’s lead in terms of payment cuts. With so many laboratories indicating already low margins, additional cuts to Medicare and other payers can have a devastating effect on the industry’s ability to stay solvent, invest in capital and quality improvements, and maintain its employment base.

28
Future Business Challenges
Looking ahead, respondents were asked to predict their top business challenges over the next three years. Not surprisingly given the prior comments, the top challenge indicated was Medicare cuts with 66 percent of respondents indicating this as one of their top two business challenges (Figure 26). This was followed by national insurers selecting preferred laboratory providers (50%) and health information technology requirements (34%). Other challenges include ACO and other payment reform models (22%), and Medicaid cuts (22%).
The 22 percent of respondents who indicated Medicaid cuts as a foreseeable challenge bear highlighting given the significant Medicaid coverage expansions under the Affordable Care Act. While many states are undecided about whether they will expand Medicaid, the potential expansions could pose new challenges for laboratories serving Medicaid clients. While the expansions will bring more people into coverage, if the coverage carries with it a low payment, as well as the other challenges indicated above, such as delayed and lack of payment and potential additional cuts, this may deter laboratories from taking on new Medicaid clients and ultimately affect access for new Medicaid enrollees as well.
When asked who they consider their biggest competitors, more than half (52%) of respondents reported large national laboratories. Another 29 percent of respondents reported other community laboratories and 19 percent reported local hospital laboratories to be their largest competition.
Laboratory Profiles In this section we present descriptions of three respondent laboratories and their experiences and challenges in the current market. Their accounts help to illuminate some of the findings from the survey data. The three laboratories represent common characteristics and experiences of independent community and regional clinical laboratories. Their descriptions help to provide a deeper understanding

29
of the challenges specific to this sector of the clinical laboratory market. The laboratories are diverse in their geographic location and business size, and thus provide a sense of the range of organizations represented in this sector of the market; yet all three of the laboratories share a common characteristic of significant Medicare business and face serious challenges related to Medicare payment cuts.
Shiel Medical Laboratory, New York Established nearly a century ago, Shiel Medical Laboratory is one of the oldest continuously operating clinical laboratories in the United States. Based in Brooklyn, New York, it is the largest privately-owned laboratory in the NY/Metropolitan area. Shiel’s clients include private physicians, group practices, union and industrial accounts, long term care facilities and home care agencies in New York, New Jersey and Pennsylvania. Shiel employs more than 600 employees, operating in a 50,000 square foot main facility as well as 21 patient service centers. Committed to Shiel’s tradition in the New York area, many of Shiel’s employees have been with the organization for 15 to 20 years. According to representatives from the company, employees are drawn to Shiel because they feel much more autonomy than at large national laboratories. They are able to respond to clients’ concerns quickly and efficiently, since they work with the owners, as opposed to going through layers of management. Employees also recognize the organization’s high quality standards and commitment to putting patients first over the bottom line. Nevertheless, Shiel increasingly faces a number of challenges filling positions stemming from stringent technician requirements under New York State law, competition for skilled technical staff from large national laboratories that can afford to offer more generous benefit packages, and shortages of technologists with the requisite skills and experience.
Shiel has experienced tremendous growth over the past few years that speaks to the organization’s dedicated and experienced personnel, strong community relationships, innovative processes and expansive test menu. Nevertheless, like many other independent community laboratories, Shiel faces a number of business challenges. For example, Shiel routinely performs tests that are never paid by Medicare and other insurers. Shiel struggles to get paid for the services it provides but faces at least three barriers to payment: frequency limitations, incorrect billing codes (ICD-9 codes), and short timeframes for payment collection. Frequency limitations refer to limits placed on the number of times tests can be ordered for a single patient each year. The Centers for Medicare and Medicaid Services (CMS) sets limits for Medicare and Medicaid beneficiaries and private insurers have limitations as well. Frequency limitations are generally not disclosed by CMS and other payers, so once patients have reached the maximum allowable number of a certain test performed, any additional tests performed will likely not be paid, but laboratories are not informed of frequency limitation until payment is denied. The problem of incorrect coding also creates barriers to payment. As the number of billing codes continues to grow with the expansion of services, codes are increasingly being entered incorrectly or omitted. When providers fail to enter billing codes correctly, Shiel often has to “eat the cost.” Laboratories have very limited time periods during which codes can be corrected and resubmitted, but must depend on hospitals, nursing homes, physician offices and others to correct the coding that may be misclassified. This often results in delays that kick claims out of the time window for payment – a practice that falls completely on the laboratory in terms of unpaid claims.
30
Shiel also struggles with Medicare payment cuts. Medicare represents 43 percent of Shiel’s business. Hence, Medicare cuts have a fundamental and serious impact on Shiel, unlike the larger national laboratory chains, whose Medicare services represents a smaller proportion of their overall business. Shiel and many other independent community laboratories provide the bulk of testing for nursing homes and home care agencies, services that are much more labor intensive than for other markets served. Shiel also provides stat and same-day turnaround testing for all of its clients, including nursing home and home care clients, which requires having phlebotomists on standby to provide testing at all times, as well as significant costs associated with driving to nursing homes and patient homes. Yet, maintaining these services is becoming increasingly unprofitable as Medicare payments do not recognize the additional costs associated with providing stat and same-day testing services to these client types. The recent Medicare payment cuts only exacerbate already low payment rates, making it impossible for Shiel and other laboratories to expand services for nursing home and home care clients. Yet if Shiel does not provide these critically important services, nursing homes and home care agencies would likely send their patients to the hospital for urgent testing, resulting in higher Medicare and private insurance costs in terms of emergency services and inpatient stays.
Shiel operates in an environment that has experienced a trend toward national insurers selecting single laboratory providers to provide all services for their clients. Independent community laboratories like Shiel are often locked out of these contracts, losing significant business, especially from Medicare Advantage plans. Such contracts potentially exclude Shiel from providing 20 to 30 percent of Medicare business in a given area.
Despite these formidable challenges, Shiel is aggressively working to reduce expenses and get the lowest prices possible for equipment and supplies. Nevertheless, Shiel has had to postpone planned expansions in Pennsylvania and continues to face dropping profit margins. Shiel is also delaying plans to expand their test menu since doing so would require new equipment or start-up costs. While Shiel has had to restrict services in some areas, it remains extremely patient service oriented. Where other laboratories may have cut back on personalized services, Shiel has sought to foster these services, recognizing their essential value to customers. Shiel is dedicated to serving the needs of its clients, many of whom national laboratories ceased serving (e.g. nursing homes, home patients) over a decade ago. Shiel commits to providing these services because of its longstanding relationships with such clients as well as with providers who have patients in home care and nursing homes.
Biomedical Laboratory, Ohio Biomedical Laboratory based in Liberty Township, Ohio, has for 35 years been a family business. Founded in 1977 as a female-owned business with one employee, Biomedical Laboratory now employs nearly 50 workers. Biomedical Laboratory is the only independent community laboratory in the northeast Ohio tri-county (Columbiana, Mahoning and Trumbull ) area. The laboratory is committed to excellence, having received accreditation with the highest distinction from the College of American Pathologists, which sets a rigorous quality standard. Over 98 percent of Biomedical’s testing is performed in its local facility, allowing for meticulous quality control and accuracy in test information. Biomedical is also very committed to its community and providing services that are responsive to its clients’ needs, including stat and same-day turnaround services.
31
More than half of Biomedical’s clients are nursing homes and skilled nursing facilities. While committed to serving this population, the company faces a unique set of logistical and financial challenges, primarily due to the high labor intensity involved in serving these client types. Technicians from Biomedical routinely draw specimens from patients in nursing homes and home care settings. This creates a very different model of service than one in which the patient walks through the door of the laboratory. This also creates additional challenges once technicians arrive at the facility. Because many of the patients are elderly, the time per patient service is much higher than the average patient population who arrive at a laboratory’s doorstep. Nursing home residents, for example, have veins that are often thinner and more challenging – requiring greater skill on the part of the laboratory workers and adding time to the typical collection visit. Additionally, Biomedical serves a number of mentally challenged patients for whom blood draws often take significantly longer.
Serving a large proportion of nursing home patients also poses financial challenges. Many of the tests provided by Biomedical are common, inexpensive tests. Such tests are critical for nursing home patients, but do not provide the higher payment rates associated with some other types of tests. All of these challenges are on top of overall payment issues associated with laboratory care for nursing home patients. Nursing homes generally provide a monthly census of patients served – a practice that is necessary for billing purposes. Biomedical cannot bill for laboratory services until the monthly census is sent by the nursing home; this requires accurate information on the patient as well as his or her coverage source. It is only once the lab receives this information that the billing process can begin to determine whether insurance, the facility or the patient is responsible for payment. This schedule poses challenges as many insurers require billing within 90 days. If any of the information from the nursing home census is incorrect, it is likely that Biomedical will not get paid, as errors would delay the process beyond a 90-day payment window. Finally, the laboratory is feeling the effects of recent Medicare fee schedule cuts. Medicare is Biomedical’s primary business, representing 84 percent of its revenue. Additionally, Biomedical noted that Medicare fee schedule cuts are increasingly being mirrored in private payers’ payment amounts as well. Biomedical has seen payment reductions across the board, not just for Medicare patients, creating a situation that creates confusion about whether a service provided will ever be paid by the insurer or the patient. This uncertainty makes planning for service delivery, potential expansion, or allocation of workforce extremely difficult.
Despite these challenges, Biomedical remains committed to serving its community and patients. The company representatives take pride in their deep community roots and the fact that it has grown over the years in large part because of its reputation for excellence and service delivery. Clients can access the laboratory 24 hours a day and can reach company representatives easily since they all have an owner’s personal cell phone number. It is not uncommon for the laboratory to receive calls from nurses at three in the morning requesting tests. Because the company is the only lab in its service area that treats such a high-need, vulnerable group of patients, cutbacks in services could threaten care for these patients. If Biomedical’s services were not accessible around the clock, patients requiring services would most likely be taken to the hospital at a much greater expense to the health care system.

32
Western Health Sciences, California Western Health Sciences is a full-service medical laboratory serving the west suburbs of Los Angeles, California. Founded nearly 30 years ago, Western Health Sciences has an established reputation in its community for personal and customized services. Western emphasizes customer service in all aspects of its service, including employing a full-time telephone receptionist to address client needs rather than moving to an automated system. Western operates 17 patient service centers in Los Angeles County, San Gabriel Valley, Ventura County and Riverside County and conducts testing at its main facility in Canoga Park, California. The laboratory employs nearly 90 staff members, most of who work full-time. Western Health Sciences primarily serves physician practices, providing personal and customized services, including stat and same-day turnaround testing.
In recent years, Western has encountered a number of new business challenges with increasing competition, shrinking reimbursements and laboratory consolidation. Western Health Sciences faces competitive pressures that make operating in the environment particularly challenging. For example, many large insurers, particularly in California, have canceled contracts with community laboratories in order to negotiate lower rates with large national laboratories. This practice could be detrimental not only to community laboratories, but also to the quality of services patients receive. Western faces challenges from lack of payment for services, such as testing provided for other referring laboratories as well as self-paying patients. Given these challenges, Western has made a number of cuts, including closing patient service centers and reducing the number of tests offered. Additionally, Western conducted employee layoffs in response to shrinking reimbursement related to Medicare cuts. Medicare represents Western’s main business, comprising 42 percent of Western’s operating revenue. Thus, Medicare fee cuts significantly affect the way Western conducts business.
Despite the significant challenges in this market, Western Health Sciences has been able to weather the challenges to date. The company credits its exceptional customer service for its successes thus far. Western employees are on a first name basis with customers and work hard to ensure that services are provided more quickly and efficiently than services from competitors. This includes specimen collection at patient service centers, test results and patient calls. The company, however, fears additional Medicare fee cuts and how they will affect the business in the short- and long-term.