
Results for the Year Ended 31 December 2011 - Investis...
47
1 Results for the Year Ended 31 December 2011
Transcript of Results for the Year Ended 31 December 2011 - Investis...
1
Results for the Year Ended 31 December 2011

BRIAN MATTINGLEY, CEO | INTRODUCTION
2

Agenda � Brian Mattingley | Introduction
� Aviad Kobrine | Financial Review
� Itai Frieberger | Operational Review
� Brian Mattingley | Summary
� Q&A
3
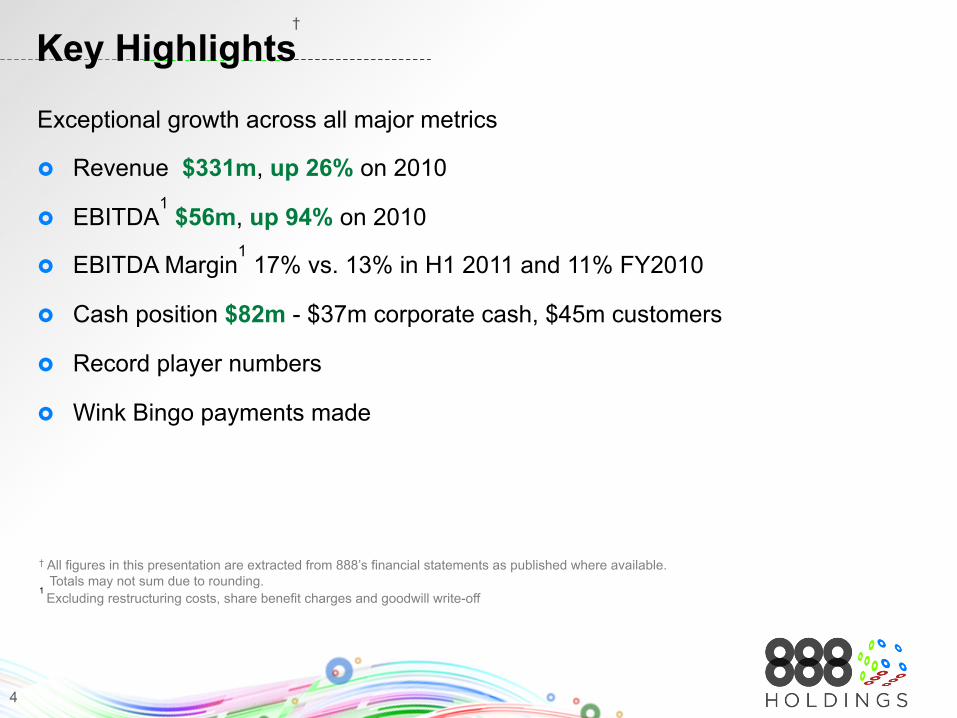
Key Highlights
Exceptional growth across all major metrics
� Revenue $331m, up 26% on 2010
� EBITDA1 $56m, up 94% on 2010
� EBITDA Margin1 17% vs. 13% in H1 2011 and 11% FY2010
� Cash position $82m - $37m corporate cash, $45m customers
� Record player numbers
� Wink Bingo payments made
† All figures in this presentation are extracted from 888’s financial statements as published where available. Totals may not sum due to rounding.
1 Excluding restructuring costs, share benefit charges and goodwill write-off
†
4

Delivering on Strategy
� Core B2C focus
� Growth through volume
� Increased marketing spend but lower marketing ratio
� Invested in infrastructure
� Improved margin
� Active in new markets
� Rationalised B2B contracts
� Mytopia stabilising
� Management team in place, meeting expectations
5

Regulated Markets
Core Strand of Strategy
� Italy - 5% Market Share with low level of investment
� Spain - License application & software adaptation
- Launch circa July 2012
� Germany - License application & software adaptation
� U.S. - CIE contract
- Nevada License Application
- Software adaptation – strong platform
- Negotiations with significant other partners
6

Outlook and Opportunities
� Continued focus on core strategy
� Continue to develop pipeline of sizeable B2B contracts
� Regulative framework
� New Markets
� Europe, investment necessary
� U.S. – blue ocean
� Expected return to dividend
7

AVIAD KOBRINE, CFO | FINANCIAL REVIEW
8

Highlights
� Highest yearly revenue ever - $331m, up 26%
� Revenue B2C up 28% to $284m
� Revenue Casino B2C up 27% to $148m
� Revenue Poker B2C up 58% to $61m
� Casino & Poker B2C first time depositors up 55%, led by Poker
� Active Players Casino & Poker B2C up 102%
� EBITDA1 up 94% to $56m
� EBITDA1 margin up to 17%
� Cash at year end $82m
†
† All figures in this presentation are extracted from 888’s financial statements as published where available. Totals may not sum due to rounding. All comparisons on a Yearly basis.
1 Excluding restructuring costs, share benefit charges and goodwill write-off.
9

Profit and loss account
� 2011 - Total Revenue up 26% to $331m ( 2010 : $262m) � EBITDA up 94% to $56m ( 2010 : $29m), improved profitability
1
1 Rounded 2 Excluding depreciation & amortisation. 3 Excluding restructuring costs. 4 Excluding share benefit charges. 5 Excluding Mytopia goodwill write-‐off. 6 Interest (2011) paid at $3.7m, the rest represent non-‐cash items. 7 Excluding Mytopia write back of conIngent consideraIon.
$m 2011 2010 FY'11 / FY'10Revenue 331.1 262.1 26% Operating expenses2,3 108.6 97.2 Research and development expenses 3 29.9 21.8 Selling and marketing expenses 102.3 91.5 % of Revenues 31% 35%
Administrative expenses3,4,5,7 27.5 21.6 Gaming Taxes and duties 7.3 1.4EBITDA3,4,5,7 55.6 28.6 94% % of Revenues 17% 11%
Depreciation & Amortization (13.0) (12.3) Interest , F/X, other6 (13.1) (1.2)Profit before tax3,4,5,7 29.5 15.1 Taxation (3.9) (2.7)Profit after tax3,4,5,7 25.6 12.4Basic Earning per Share3,4,5,7 7.4 ¢ 3.6 ¢
10
70%
80%
90%
100%
110%
120%
130%
140%
150%
1 2 3 4 5 6 7 8 9 10 11 12 1 2 3 4 5 6 7 8 9 10 11 12 1 2 3
2010 2011 2012
% Relative change base on Jan 2010
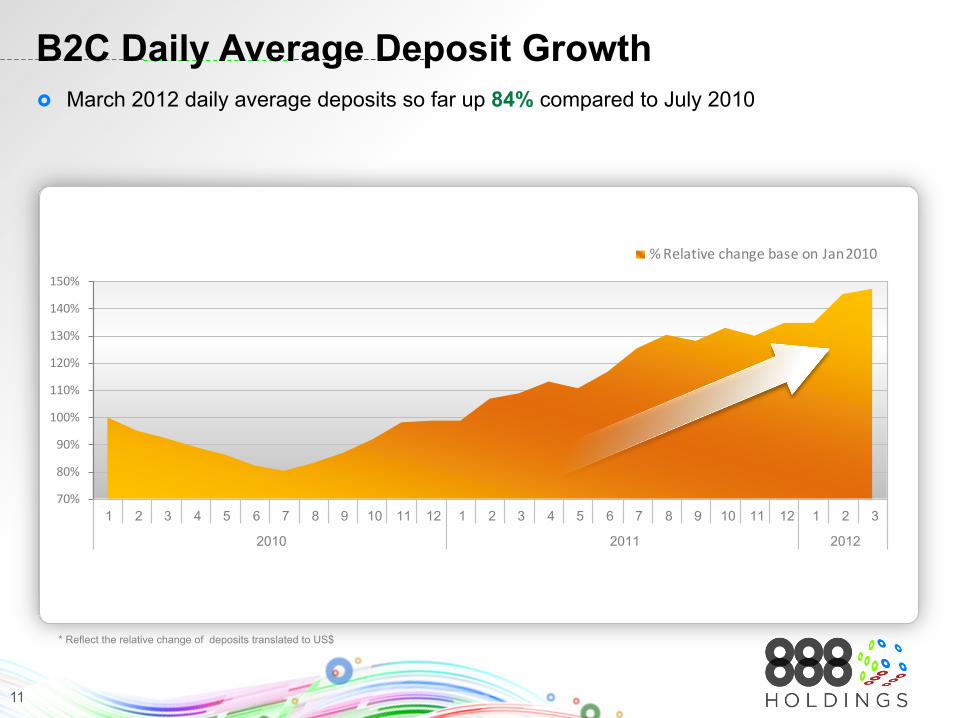
B2C Daily Average Deposit Growth
* Reflect the relative change of deposits translated to US$
� March 2012 daily average deposits so far up 84% compared to July 2010
11

Total Revenue � 2011 - Total Revenue up 26% to $331m (2010: $262m) � 2011 – highest Revenue in 888 History � Representing a CAGR of 24%
Total Revenue 2003 – 2011 ($m)
$m
0
50
100
150
200
250
300
350
2003 2004 2005 2006 2007 2008 2009 2010 2011
59 75
123 157
217
263 247
262
331
* Revenues for 2003-2009 are excluding US
12

Total Revenue � Q4 2011 Revenue up 28% to $91m (Q4 2010: $71m) � Five consecutive quarterly revenue growth
Quarterly Revenue 2010 – 2011 ($m)
40
50
60
70
80
90
Q1 Q2 Q3 Q4 Q1 Q2 Q3 Q4
2010 2011
69
61 61
71 75
79
86 91
$m
13
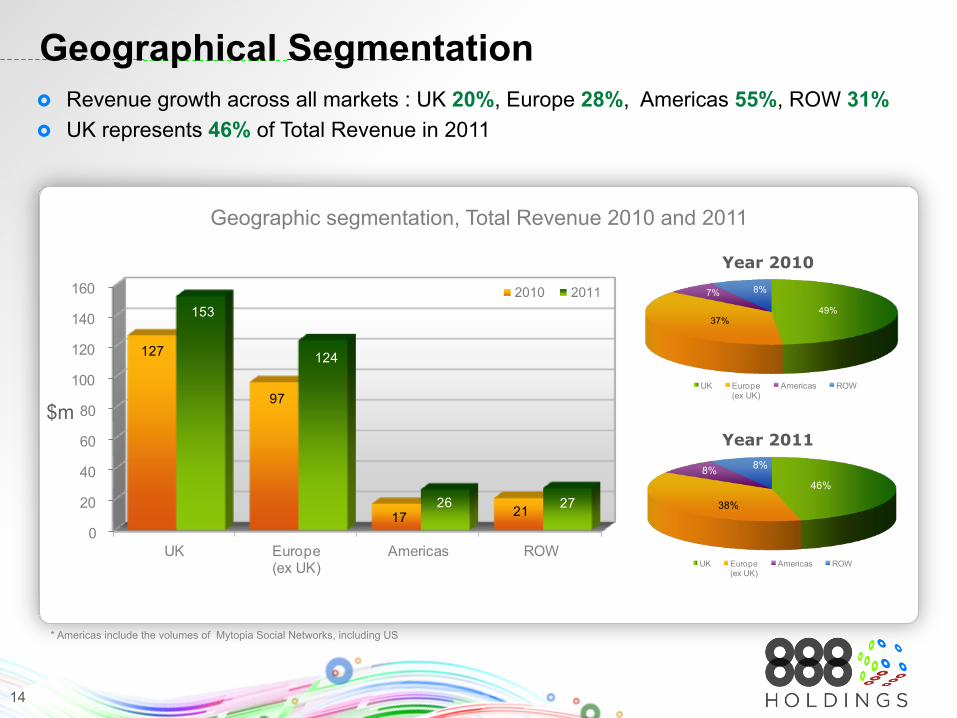
Geographical Segmentation � Revenue growth across all markets : UK 20%, Europe 28%, Americas 55%, ROW 31% � UK represents 46% of Total Revenue in 2011
Geographic segmentation, Total Revenue 2010 and 2011
Year 2010
Year 2011
0
20
40
60
80
100
120
140
160
UK Europe (ex UK)
Americas ROW
127
97
17 21
153
124
26 27
2010 201149%
37%
7% 8%
UK Europe (ex UK)
Americas ROW
46%
38%
8% 8%
UK Europe (ex UK)
Americas ROW
* Americas include the volumes of Mytopia Social Networks, including US
$m
14
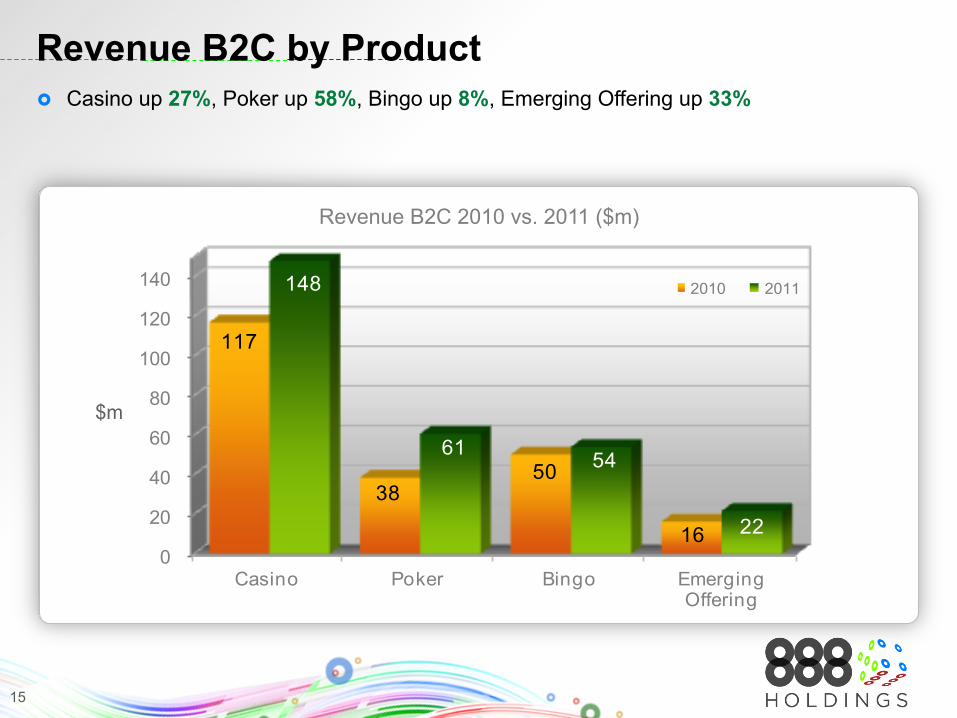
Revenue B2C by Product � Casino up 27%, Poker up 58%, Bingo up 8%, Emerging Offering up 33%
Revenue B2C 2010 vs. 2011 ($m)
0
20
40
60
80
100
120
140
Casino Poker Bingo Emerging Offering
117
38 50
16
148
61 54
22
2010 2011
$m
15
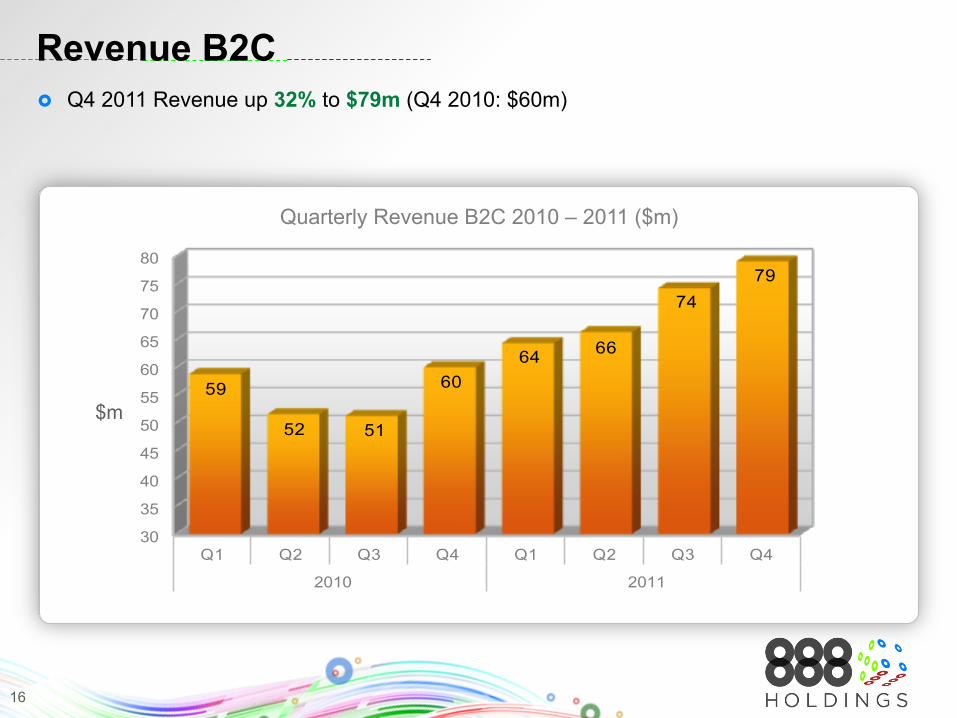
Revenue B2C � Q4 2011 Revenue up 32% to $79m (Q4 2010: $60m)
Quarterly Revenue B2C 2010 – 2011 ($m)
30
35
40
45
50
55
60
65
70
75
80
Q1 Q2 Q3 Q4 Q1 Q2 Q3 Q4
2010 2011
59
52 51
60 64 66
74 79
$m
16

Revenue B2C � H2 2011 Revenue up 38% to $153m (H2 2010: $111m)
Revenue B2C H1 2010 – H2 2011 ($m)
50
70
90
110
130
150
H1 10 H2 10 H1 11 H2 11
110 111
131
153
$m
17
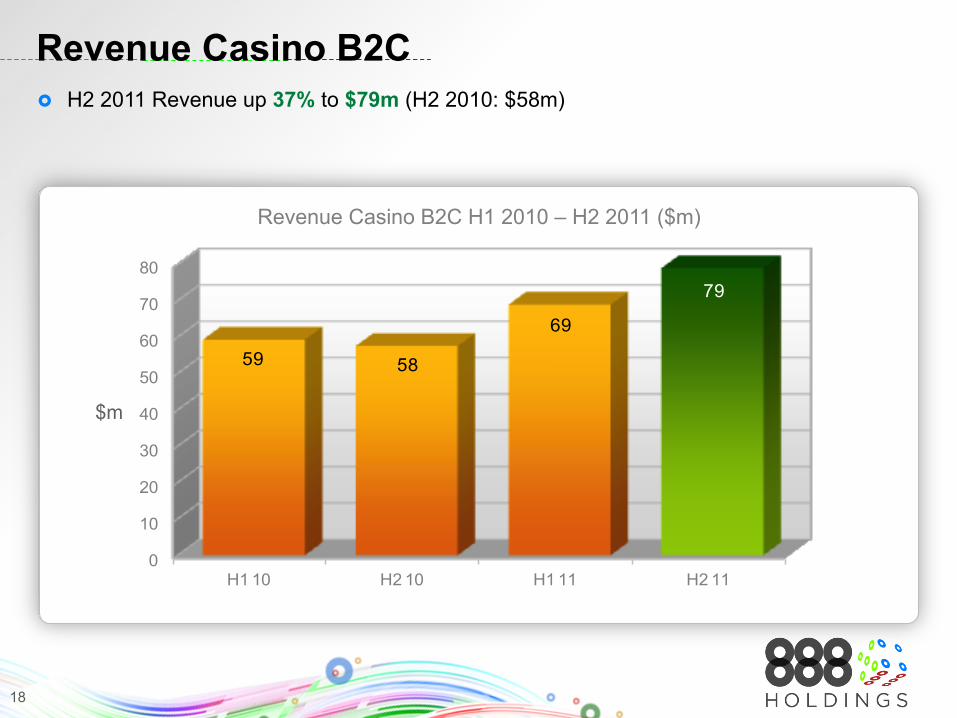
Revenue Casino B2C � H2 2011 Revenue up 37% to $79m (H2 2010: $58m)
Revenue Casino B2C H1 2010 – H2 2011 ($m)
0
10
20
30
40
50
60
70
80
H1 10 H2 10 H1 11 H2 11
59 58
69
79
$m
18

Revenue Poker B2C � H2 2011 Revenue up 95% to $37m (H2 2010: $19m)
Revenue Poker B2C H1 2010 – H2 2011 ($m)
0
5
10
15
20
25
30
35
40
H1 10 H2 10 H1 11 H2 11
20 19
24
37
$m
19

Revenue B2B � H2 2011 Revenue up 16% to $24m (H2 2010: $21m)
Revenue B2B H1 2010 – H2 2011 ($m)
15
16
17
18
19
20
21
22
23
24
H1 10 H2 10 H1 11 H2 11
20 21
23 24
$m
20

50%
60%
70%
80%
90%
100%
110%
120%
1 2 3 4 5 6 7 8 9 10 11 12 1 2 3 4 5 6 7 8 9 10 11 12 1 2 3
2010 2011 2012
888Casino Deposit Trend � 888Casino shows continues growth of deposits as of Q3 2010 � March 2012 daily average up 64% compared to July 2010
888Casino Daily Deposits
21

30%
50%
70%
90%
110%
130%
1 2 3 4 5 6 7 8 9 10 11 12 1 2 3 4 5 6 7 8 9 10 11 12 1 2 3
2010 2011 2012
888Poker Deposit Trend � 888Poker product and CRM activities as of July 2010 translated into strong growth � March 2012 daily average up 156% above July 2010
888Poker Daily Deposit
22

EBITDA and EBITDA margin � EBITDA up 94% to $56m (2010: $29m) � EBITDA margin up to 17% (2010: 11%)
EBITDA 2010 vs. 2011
EBITDA EBITDA margin
* Excluding share benefit charges, depreciation, amortisation, restructuring and goodwill write-off
-
10
20
30
40
50
60
2010 2011
29
56
0%
2%
4%
6%
8%
10%
12%
14%
16%
18%
2010 2011
11%
17%
$m
23

Marketing Cost Ratio � Marketing ratio to Revenue in 2011 at 31% � 2011 B2C Casino & Poker CPA* lower than previous year � Higher efficiency in core business helped to increase profitability despite high investment in regulatory
markets
Marketing Costs 2010 vs. 2011
$m
Marketing Costs Marketing Costs % of Revenue
* Excluding Revshare components
-
20
40
60
80
100
120
2010 2011
92 102
15%
25%
35%
2010 2011
35% 31%
24
0%
20%
40%
60%
80%
100%
2010 2011
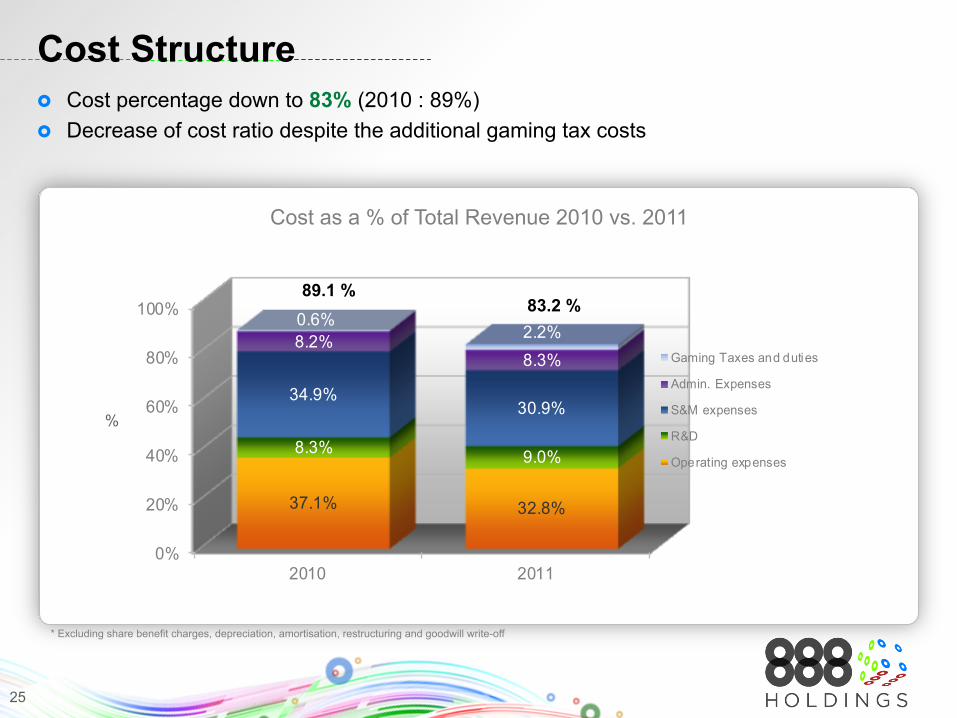
37.1% 32.8%
8.3% 9.0%
34.9%30.9%
8.2%8.3%
0.6%2.2%
Gaming Taxes and duties
Admin. Expenses
S&M expenses
R&D
Operating expenses
Cost Structure � Cost percentage down to 83% (2010 : 89%) � Decrease of cost ratio despite the additional gaming tax costs
Cost as a % of Total Revenue 2010 vs. 2011
%
89.1 % 83.2 %
* Excluding share benefit charges, depreciation, amortisation, restructuring and goodwill write-off
25
0%
2%
4%
6%
8%
10%
2008 2009 2010 2011
5.8% 5.6% 5.5% 5.9%
1.8%3.7%
1.1% 1.0%
CB PSP
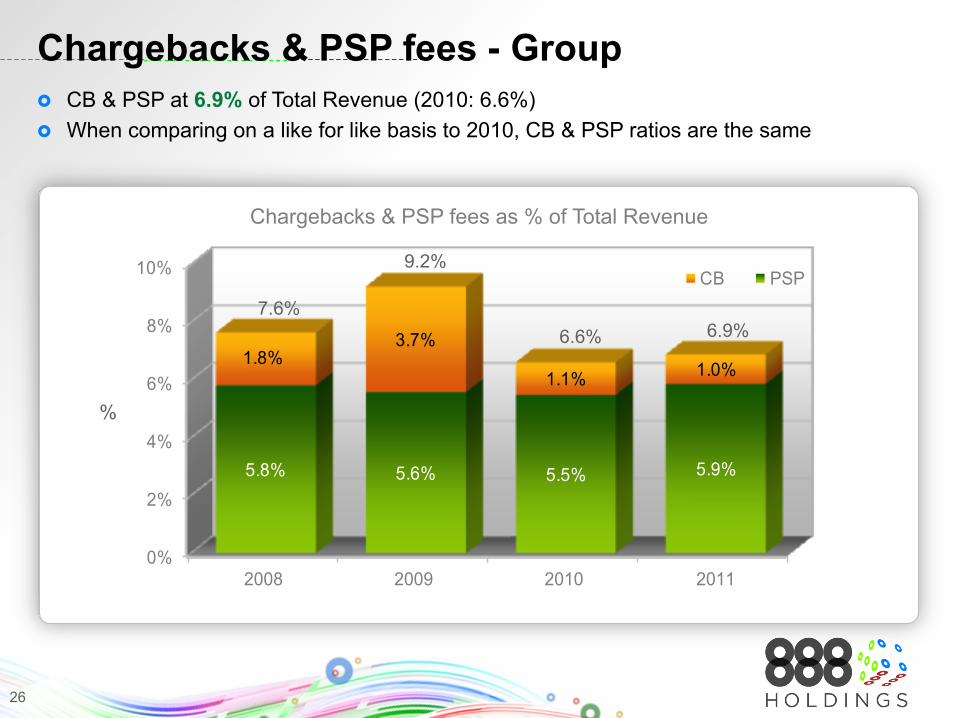
Chargebacks & PSP fees - Group � CB & PSP at 6.9% of Total Revenue (2010: 6.6%) � When comparing on a like for like basis to 2010, CB & PSP ratios are the same
Chargebacks & PSP fees as % of Total Revenue
9.2%
6.9% 6.6% 7.6%
%
26

18% 17%
35.0
55.0
75.0
95.0
115.0
135.0
155.0
0%
5%
10%
15%
20%
25%
2010 2011Bonus Ratio% Rev $m
Customer Bonuses B2C Casino � Casino revenue growth continue to be driven by optimal use of bonuses and CRM
efforts
1 Excluding converted loyalty points
Customer Bonuses as % of Revenue
Revenue increase of 27%
1
% $m
27

8%11%
15.00
20.00
25.00
30.00
35.00
40.00
45.00
50.00
55.00
60.00
65.00
0%
2%
4%
6%
8%
10%
12%
14%
2010 2011Bonus Ratio% Rev $m
Customer Bonuses B2C Poker � Poker revenue growth continue to be driven by optimal use of bonuses and CRM
efforts, leveraging the 2011 industry events
1
Customer Bonuses as % of Revenue
1 Excluding converted loyalty points
% $m
28

Players’ Value Over Time � Average revenue generated by new players during first 3 months (an indicator of life time value)
increase over time (Jul 10 = 100) � Casino first 3M up 42% in value, Poker first 3M is up 20% � This reinforces the strong acquisition trend during FY 2011 and especially Q4
3 Month Ave. Revenue per player B2C Casino & Poker
0
20
40
60
80
100
120
140
160
July 2010 Base Poker 3M Value vs. July 10 Casino 3M Value vs. July 10
100
120 142
29
0%
20%
40%
60%
80%
100%
120%
140%
160%
180%
200%
2010/Q1 2010/Q2 2010/Q3 2010/Q4 2011/Q1 2011/Q2 2011/Q3 2011/Q4
Ave. Revenue/Player
Active Players
Ave. Revenue/Player (Depositors Only)
Deposits / Unique Depositors
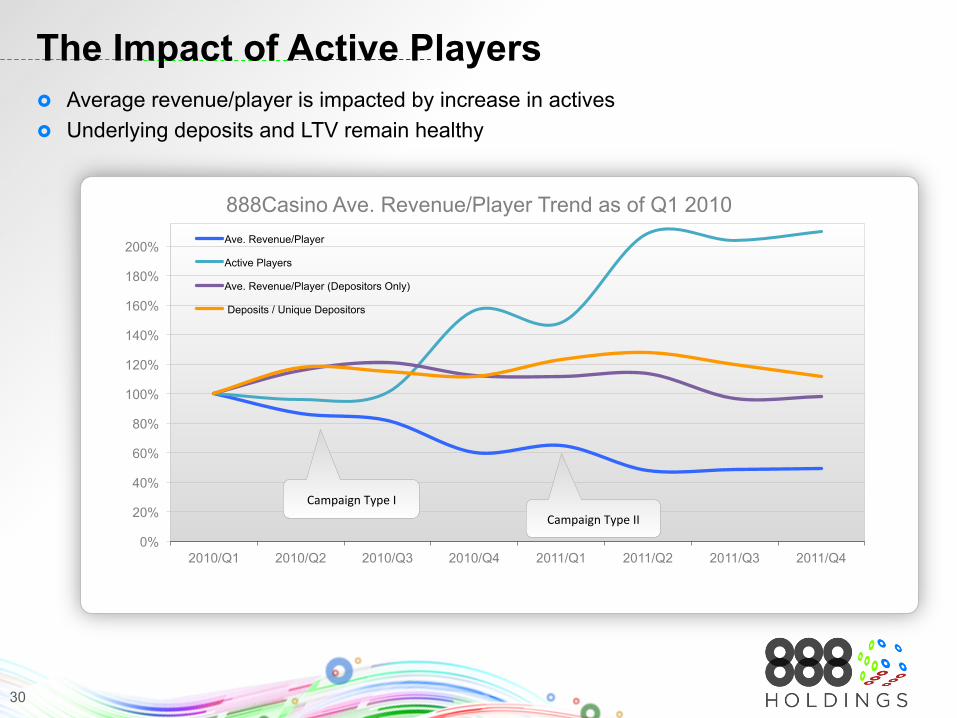
The Impact of Active Players � Average revenue/player is impacted by increase in actives � Underlying deposits and LTV remain healthy
888Casino Ave. Revenue/Player Trend as of Q1 2010
Campaign Type II Campaign Type I
30
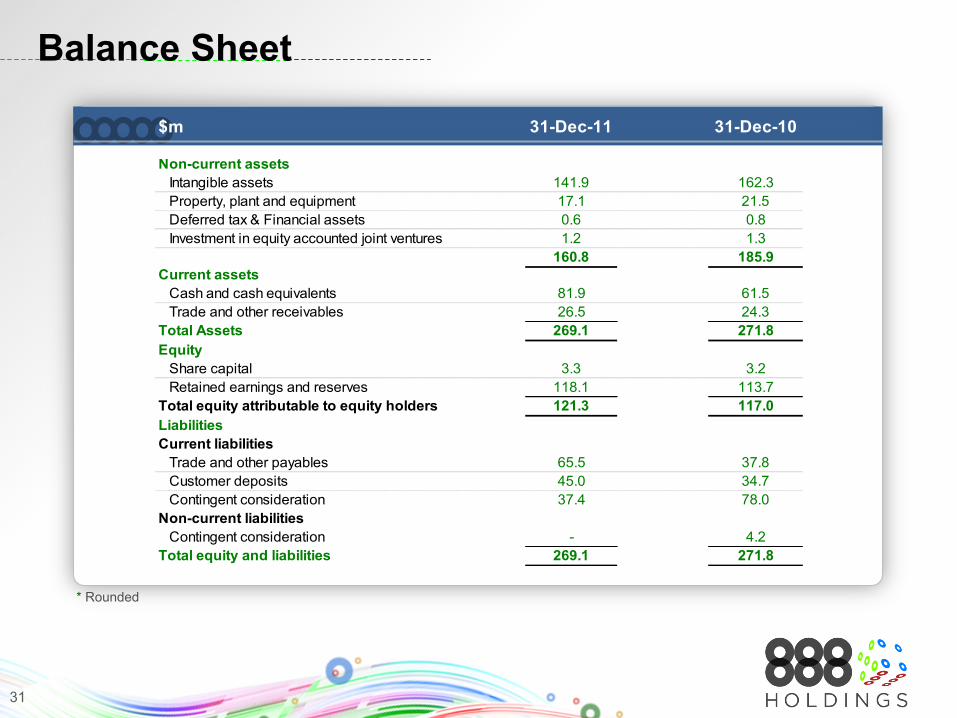
Balance Sheet
* Rounded
$m 31-Dec-11 31-Dec-10
Non-current assets Intangible assets 141.9 162.3 Property, plant and equipment 17.1 21.5 Deferred tax & Financial assets 0.6 0.8 Investment in equity accounted joint ventures 1.2 1.3
160.8 185.9Current assets Cash and cash equivalents 81.9 61.5 Trade and other receivables 26.5 24.3Total Assets 269.1 271.8Equity Share capital 3.3 3.2 Retained earnings and reserves 118.1 113.7Total equity attributable to equity holders 121.3 117.0LiabilitiesCurrent liabilities Trade and other payables 65.5 37.8 Customer deposits 45.0 34.7 Contingent consideration 37.4 78.0Non-current liabilities Contingent consideration - 4.2Total equity and liabilities 269.1 271.8
31

* Rounded
Cash Flow Statement
$m Year to 31 December 2011 2010Cash flows from operating activities Profit before tax 5.8 10.6 Goodwill Write-off 20.7 - Share benefit charges 2.9 2.3 Depreciation & amortisation 13.0 12.3 Change in current assets and liabilities 36.1 (6.2) Other non cash adjustments 4.6 0.9
Cash generated from operating activities 83.1 19.9
Tax paid (4.3) (3.7)Net cash generated from operating activities 78.7 16.2
Acquisitions of Wink & MyTopia (46.1) (12.3) Purchase of property, plant and equipment (4.6) (8.6) Acquisitions & internally generated intangible assets (4.3) (6.2) Other investment activity 0.2 (1.1)
Net cash used in Investing Activities (54.7) (28.3)
Interset paid in respect of Wink Acquisition (3.7) - Dividends paid and share buy-back - (14.0)
Net increase (decrease) in cash and cash equivalents 20.3 (26.0)
Cash and cash equivalents - beginning of year 61.5 87.5
Cash and cash equivalents - end of year 81.9 61.5
32
ITAI FRIBERGER, COO | OPERATIONAL REVIEW
33
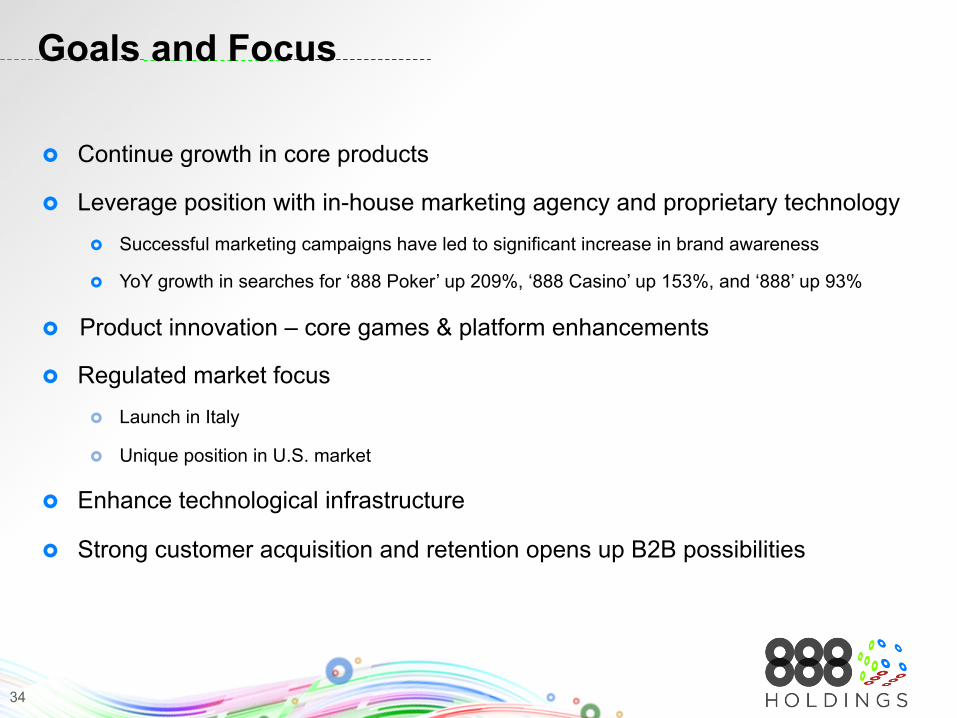
34
� Continue growth in core products
� Leverage position with in-house marketing agency and proprietary technology
� Successful marketing campaigns have led to significant increase in brand awareness
� YoY growth in searches for ‘888 Poker’ up 209%, ‘888 Casino’ up 153%, and ‘888’ up 93%
� Product innovation – core games & platform enhancements
� Regulated market focus
� Launch in Italy
� Unique position in U.S. market
� Enhance technological infrastructure
� Strong customer acquisition and retention opens up B2B possibilities
Goals and Focus

35
� Potential growth via marketing and product
� New Casino product – Casino 50
� 888 Games Studio and the GGP platform
� Mobile
� Segmented CRM – analytics
� Multi brands and cross-sell throughout the platform
Casino and Games

36
Casino 50

37
888
UK Casino – Searches for ‘888 and Casino’ � Successful marketing campaigns cause spikes in searches
� Strength of our product and CRM lead to ongoing uplift

� Leverage strong market position
� “We play different” strategy
� External brands (LG & Ryanair)
� Regulations
� On Tablets iOS & Android
� Poker Infra
888poker
38

39
888poker – Keeping the Trend

0
10
20
30
40
50
60
70
888 Poker CompeItor 1 CompeItor 2 CompeItor 3 CompeItor 4 CompeItor 5 CompeItor 6 CompeItor 7
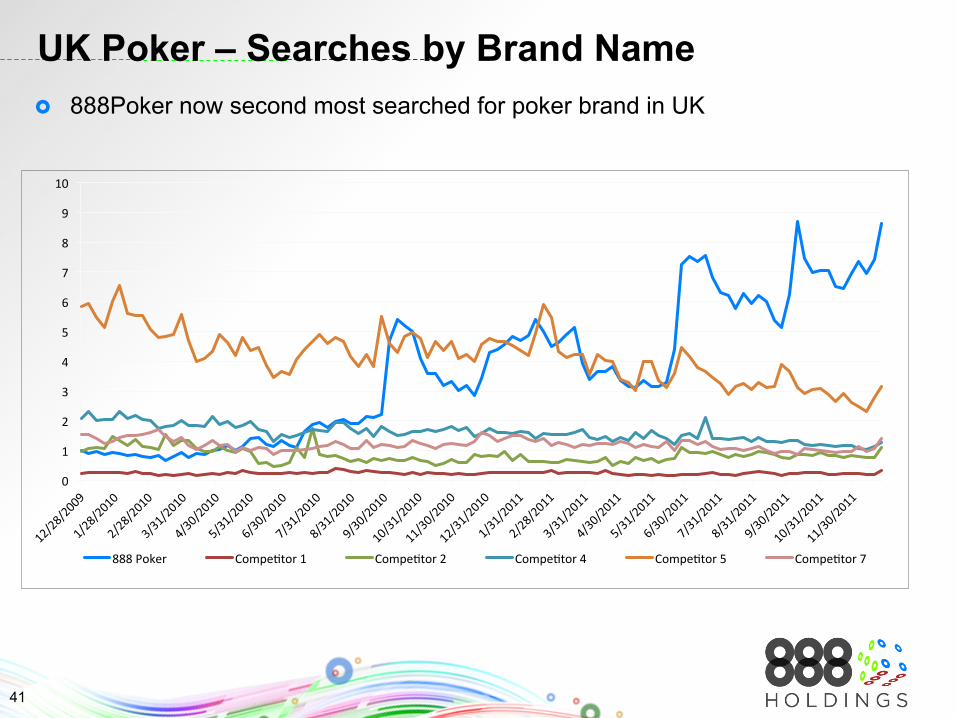
UK Poker – Searches by Brand Name
40
0
1
2
3
4
5
6
7
8
9
10
888 Poker CompeItor 1 CompeItor 2 CompeItor 4 CompeItor 5 CompeItor 7
UK Poker – Searches by Brand Name � 888Poker now second most searched for poker brand in UK
41

� Focus on player value
� Bingo no back office
� More Games
� 27 new skins, 3 new Networks
� BigBrother bingo
� Going forward:
� Bonuses, Jackpots
� Mobile
Bingo
42

43
� 2011 into 2012
� Operational optimisation
� Capitalising on FIFA World Cup
� Euro12 and Olympic Games
� Sport is an opportunity for 888
Sport

44
� Widespread appraisal of contracts
� Launched CasinoFlex with leading Italian brands
� Caesars Interactive Entertainment
� More US deals anticipated

BRIAN MATTINGLEY, CEO | SUMMARY
45

Summary
� Focused, talented management team � Focused on core strategy
� Innovative products embraced by customers
� Robust trading and strong cash generation
� Quality partnerships in new markets
� Investing now for longer term
46

Q&A
47