entertainmentonegroup - Investis Digital
76
Transcript of entertainmentonegroup - Investis Digital


entertainmentonegroup.com
05Entertainment One Ltd.Overview
04 Entertainment One Ltd.Overview
Annual Report and Accounts 2012entertainmentonegroup.com
Our Year at a Glance
digital rights maximises value of content
Five year deal signed with LOVEFiLMIn September 2011 a licensing deal was signed with Amazon.com inc’s subsidiary, LOVEFiLM, on its entry into the UK “subscription video on demand” market.
Members of LOVEFiLM will be able to watch eOne’s movies through the LOVEFiLM player, either on a PC, via in-home connected living room devices or on the PlayStation®3.
new network orders and renewals
AMC renews Hell on Wheels for season twoeOne produced contemporary western television series Hell on Wheels premiered in November 2011 and became the second highest watched show ever on AMC (behind eOne-distributed The Walking Dead).
Hell on Wheels was renewed for a second season and is now selling well internationally.
global expansion continues
eOne heads down underHopscotch was acquired in May 2011 extending eOne’s reach to Australia and New Zealand.
Hopscotch is a successful local independent film distributor and has been quickly integrated into the Group. With eOne’s backing, investment in content is being increased and the Group has extended its output deals with Summit and Lakeshore to include Australia and New Zealand.
Entertainment One’s goal is to become the world’s leading independent entertainment company, through the ownership and distribution of film and television content rights across all media throughout the world.
Inside this report
01 Overview02 Our Business at a Glance04 Our Year at a Glance
10 Business and Financial Review 12 Market Overview14 Chief Executive’s Review16 Summary Financial Performance17 Divisional Reviews24 Financial Review28 Risks and Uncertainties
30 Corporate Governance30 Board of Directors32 Corporate Responsibility34 Directors’ Report36 Directors’ Remuneration Report39 Corporate Governance Statement41 Directors’ Responsibility Statement
42 Financial Statements42 Independent Auditors’ Report43 Consolidated Income Statement43 Consolidated Statement of Comprehensive Income44 Consolidated Balance Sheet45 Consolidated Cash Flow Statement46 Consolidated Statement of Changes in Equity47 Notes to the Financial Statements73 Company Information
Contents
Our Year at a Glance04 Chief Executive’s Review
Darren ThroopChief Executive Officer
14We are pleased to report another year of strong growth.

Entertainment One Ltd.Overview
01
Annual Report & Accounts 2012
Strategichighlights
Financialhighlights1
Investment in film and television content up almost 50% to £136 million, further building the strength of the content library and driving improved margins
Hopscotch integrated quickly and performed ahead of management’s expectations following acquisition in May 2011
Further plans for increased investment to grow shareholder value supported by strong balance sheet following extension of debt facilities in November 2011
Strategic review concluded that existing strategy for organic development, supplemented by corporate acquisition opportunities, delivers the best value for shareholders
£502.7m
£52.6m
£23.1m
15.4p
£44.1m
2011: £469.7m
2011: £42.5m
2011: £11.4m
2011: 13.0p
2011: £38.6m
+7.0%
+23.8%
+102.6%
+18.5%
+14.2%
Revenue
Underlying EBITDA2
Profit before tax
Adjusted diluted earnings per share3
Adjusted net debt4
1 Financial highlights, other than adjusted net debt, are from continuing operations, which excludes the results of the discontinued Canadian Retail business in the prior year
2 Underlying EBITDA is operating profit before one-off items, share-based payment charges, depreciation and amortisation of intangible assets
3 Adjusted diluted earnings per share is adjusted for operating one-off items, share-based payment charges, amortisation of acquired intangible assets and one-off items within net finance charges and taxation
4 Adjusted net debt includes net borrowings under the Group’s senior debt facility
Released 152 films theatrically with gross box office receipts of $212 million (2011: $202 million), including number one hit The Twilight Saga: Breaking Dawn – Part 1
Digital revenue doubled to £66 million, reflecting impact of exclusive five year licensing deal in the UK with LOVEFiLM and strong growth in North America
Delivered 237 half hours of television programming including network premieres of Hell on Wheels and The Firm and new seasons of established shows Rookie Blue, Haven and Call Me Fitz, with strong pipeline of new network orders and renewals
Peppa Pig remained number one UK pre-school property, is expanding well internationally and, in the US, is on track for nationwide licensing and merchandising launch in 2012
Operational highlights

Entertainment One Ltd.Overview
02
entertainmentonegroup.com
Our Business at a GlanceStrategic priorities
Invest incontent and programming
Maximiserights ownership
Expand global presence
Strategic prioritiesThe Group continues to target increasing investment in content and programming. Building a library of films and television titles will drive the future value of the Group.
Film titles are acquired from leading independent studios across the globe while television programmes, including our Family properties, are developed and produced in-house, benefiting from the Canadian funding environment. The library is supplemented by acquiring third party television shows, such as The Walking Dead, which we are able to sell through our international distribution infrastructure.
By investing in a large number of titles across film and television we look to create a portfolio which delivers a balanced performance and mitigates the risk associated with any individual property.
Strategic prioritiesThe way consumers view film and television content is changing. While traditional markets such as cinema and television remain strong, the shift to consumption of content via digital devices, computers and through video on demand is continuing to grow resulting in an increasing overall market.
The strategy of obtaining rights to titles in all these areas means that the Group is protected from changes in viewing habits. This is supported by strong relationships in our core territories with the major cinema chains, high street retailers, on-line e-tailers, television broadcasters and digital providers.
Our physical infrastructure businesses in Canada and the US provide the Group’s titles with a route to over 4,000 retail partners and distribute products for a wide range of third parties such as major film studios and music labels.
Strategic prioritiesThrough corporate acquisitions and partnerships we look to extend our global footprint, which now includes all major English-speaking territories.
A growing network of offices and partnerships across the world enables us to expand our ability to provide producers with the best multi-territory distribution service, builds the Group’s profile and increases access to international markets for our own television properties. A larger infrastructure also creates the opportunity for operating efficiencies and reduces the Group’s exposure to any one territory.
The Group continues to increase its revenue in territories outside our core operations, which reached £30 million in 2012, up 25% from £24 million in 2011.
(2011: $250m+) – independent valuation of the Group’s library
$350m+
Content rights library
Film TV Family
Cinema
DVD/Blu-ray
TV
Digital
Licensing & Merchandising
Media channels
South Africa
Scandinavia
eOne operationsPartner territories
TorontoNew YorkLos Angeles
Global presence

Entertainment One Ltd.Overview
03
Annual Report & Accounts 2012
2009 2010 2011 2012
Investment in content (£m)
TVFilm
38
1024
51
39
52
64
72
150
90
120
60
30
0
2009 2010 2011 2012
360
270
180
90
0
Entertainment division revenue by media (£m)
TVCinema
DigitalHome EntertainmentLicensing & Merchandising
£503mTotal
Financial contribution by major territory (2012)
25%
40%
5%
9%
21%
Revenue UK CanadaBenelux
Australia/Other US
Performance indicators
Performance indicatorsDigital is growing:
Performance indicators
(2011: £91 million) – invested in film and television content in the year
(2011: £33m) – digital revenue
(2011: 7%) – of Group revenue
£136m
£66m
13%
The Group operates in territories representing 63% of the global film market
63%
(2011: £24m) – revenue from territories outside core operations
£30m
Library comprises:
(2011: 20,000+) – film and television titles
24,000+
(2011: 2,400+) – hours of original television programming
2,700+(2011: 121) – theatrical releases
152
(2011: 249) – half hours delivered
237
Film TV Family
Cinema
DVD/Blu-ray
TV
Digital
Licensing & Merchandising
London
France Germany
Amsterdam
Sydney

04 Entertainment One Ltd.Overview
entertainmentonegroup.com
Our Year at a Glance
diGiTaL riGhTS MaxiMiSeS VaLue oF ConTenT
Five year deal signed with LOVEFiLMIn September 2011 a licensing deal was signed with Amazon.com Inc’s subsidiary, LOVEFiLM, on its entry into the UK “subscription video on demand” market.
Members of LOVEFiLM are able to watch eOne’s movies through the LOVEFiLM player, either on a PC, via in-home connected living room devices or on the PlayStation®3.
new neTwork orderS and renewaLS

05Entertainment One Ltd.Overview
Annual Report & Accounts 2012
AMC renews Hell on Wheels for season twoeOne-produced contemporary western television series Hell on Wheels premiered in November 2011 and became the second highest watched show ever on AMC (behind eOne-distributed The Walking Dead).
Hell on Wheels has been renewed for a second season and is selling well internationally.
GLobaL exPanSion ConTinueS
eOne heads down underHopscotch was acquired in May 2011 extending eOne’s reach to Australia and New Zealand.
Hopscotch is a successful local independent film distributor and has been integrated quickly into the Group. With eOne’s backing, investment in content is being increased and the Group has extended its output deals with Summit and Lakeshore to include Australia and New Zealand.

Entertainment One Ltd.Overview
06
entertainmentonegroup.com
Our Year at a Glance continued
Peppa Pig accelerates international expansionWith daily broadcast slots in the US on Nick Jr. for over a year and backed by strong viewing figures, preparations continue to plan for a nationwide US launch of a full toy range as well as books and a DVD for the 2012 holiday season.
Elsewhere Peppa Pig has rapidly become the number one pre-school show in Spain, Italy and Australia, is expanding in central Europe and plans are being accelerated to move into the Far East and Latin America.
#1 in SPain, iTaLy and auSTraLia

07Entertainment One Ltd.Overview
Annual Report & Accounts 2012
box oFFiCe SuCCeSS in The uk and Canada
Breaking Dawn – Part 1 breaks box office recordsThe Twilight Saga: Breaking Dawn – Part 1 was released in Canada and the UK in November and reached number one at the box office in both territories. Worldwide it was the fifth highest grossing film in 2011.
The DVD was released in March 2012 and also reached number one in both the UK and Canada, becoming the highest selling release so far this calendar year in both territories.

Entertainment One Ltd.Overview
08
entertainmentonegroup.com
Our Year at a Glance continued
GrowTh in inTernaTionaL SaLeS
The Walking Dead sets record for viewing figuresThe second season finale of The Walking Dead set a new record for viewing figures on US cable networks and has become a major international hit.
eOne is building on this success by growing its UK based sales team and increasing its investment in acquired television titles including international rights to Primeval: New World and the UK rights to the Scandinavian show The Bridge.
inCreaSed oPPorTuniTy To aCquire ConTenT

09Entertainment One Ltd.Overview
Annual Report & Accounts 2012
20092008 2010 2011 2012
Revenue growth 2008–2012 (£m)
500
375
250
125
0
20092008 2010 2011 2012
EBITDA growth 2008–2012 (£m)
60
50
40
30
20
10
0
New initiatives to expand Film businesseOne expanded its International Film Sales business with the opening of an office in London to focus on European markets and enhance the Group’s presence in the industry.
In addition the Group has commenced its expansion of the US Film business and the first theatrical titles acquired are due for limited release in 2012.
Continuing growtheOne’s strategy to invest in Film and Television content and expand the business through corporate acquisition has delivered a consistent track record of year on year growth. Revenues are now driven by a wide portfolio of Film releases and Television programming, underpinned by the Group’s extensive content rights library. The success of the Group’s investment alongside improved operational efficiency has driven increased profitability and higher margins. The Group expects momentum to be sustained going forward driven by increasing investment in content and programming, maximising rights ownership and further global expansion.
Entertainment One Ltd.Business and Financial Review
10
entertainmentonegroup.com
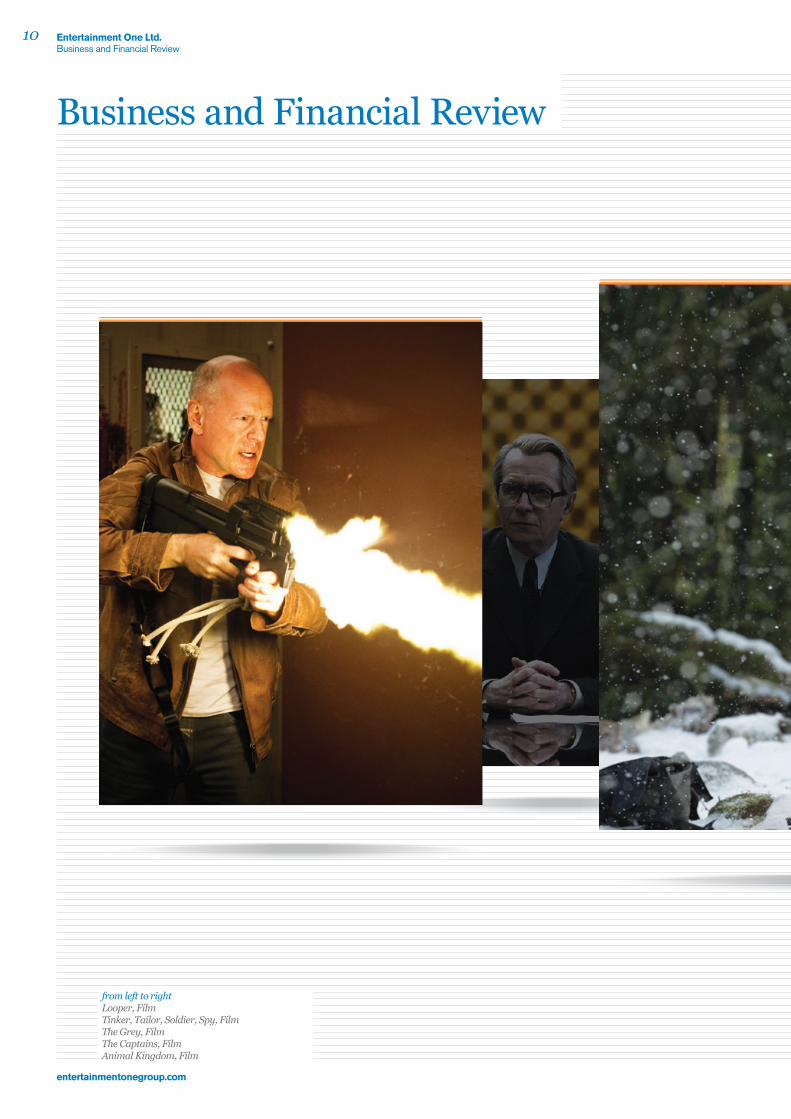
Business and Financial Review
from left to rightLooper, FilmTinker, Tailor, Soldier, Spy, FilmThe Grey, FilmThe Captains, FilmAnimal Kingdom, Film

Entertainment One Ltd.Business and Financial Review
11
Annual Report & Accounts 2012

Entertainment One Ltd.Business and Financial Review
12
entertainmentonegroup.com
2011 Global film box office (US$bn)
$34.7bn
UK US Canada
Australia & New Zealand Benelux Rest of the World
20.010.2 1.20.51.01.8
Source: Rentrak EDI
Market Overview
FilmThe film industry continued to break revenue records in 2011 with three theatrical releases for the first time generating in excess of $1 billion in global box office receipts. More significant for eOne was the growth in box office outside the US, which reached an estimated $24.5 billion in 2011, an increase of over 10% from 2010.
The global film industry generates revenues of $107 billion annually through cinema, home entertainment (DVD and Blu-ray), digital downloads, streaming and television. It is expected to increase to $115 billion by 2016 driven by growth in digital offsetting the decline in DVD. Over 63% of these global revenues are generated in markets where eOne already has existing operations and partnerships. These markets are expected to continue to grow over the next five years.
The industry is dominated by the six major US studios, who operate their own distribution networks and supply approximately 75% of content for the global market. The smaller independent studios and producers, who account for the remaining 25% of movies, generally do not own international distribution infrastructure and consequently sell the long-term rights to distributors such as eOne to manage the exploitation of their movies. eOne is the largest global independent distributor of films in the industry.
Market developmentsCinemaThe theatrical market has continued to grow as ticket prices rise reflecting the price premium for 3D and the switch over to digital screens. Admission numbers have remained relatively consistent in the last few years. The market is expected to continue to grow modestly.
Home EntertainmentThe market for standard DVD is declining at around 10% per annum in major territories driven by a growing preference for electronic access to content. This is being partially offset by growth in Blu-ray sales with high definition televisions now in around half of all households in North America stimulating demand. The overall DVD market is expected to continue to decline as consumers switch to digital viewing to watch films in their homes and on the move. However, this decline is offset by growth in digital.
DigitalExpanding broadband penetration and increasing ways of accessing content is boosting the growing digital film market. This segment of the market was worth $8 billion in 2010 and is expected to increase to $24 billion by 2016 driven by increasing broadband speeds, improved hardware including tablets and new digital downloading and streaming services led by iTunes, Amazon, Netflix and Hulu. US audiences are predicted to pay more for movies online this year than they will on physical video formats. eOne believes that despite the decline in home entertainment absolute revenues and margins will be protected, if not enhanced, as the market shifts to digital which can be delivered more cost efficiently than physically formatted product.
TelevisionRevenue from the sale of films to broadcasters is expected to grow modestly over the next five years driven by increased subscriptions and advertising. Fees from television broadcasters to distributors have been increasing recently driven by competition from new consumer propositions into the market such as Netflix and LOVEFiLM and the proliferation of TV channels. Combined with the growth in digital the television market provides the platform for distributors to sustain their margins into the future.
Digital driving demand for content

Entertainment One Ltd.Business and Financial Review
13
Annual Report & Accounts 2012
Children’s TV broadcast production and merchandising market (US$bn)
US
UK
Rest of the World
3 2713
Source: PWC Global entertainment and media outlook June 2011
Global broadcast revenues, by region 2010–15
2010 2011 2012 2013 20152014
US
Latin America
EMEA
Asia Pacific
Canada
50
100
150
200
Source: PWC Global entertainment and media outlook June 2011
(US$bn)
Television productionThe global broadcasting market is estimated to be worth approximately $400 billion and is expected to grow by over 6% annually.The US and Canada make up circa 40% of the market and are the core territories in eOne’s production strategy.
Financing available for production is partly dependent on TV advertising revenue, which is forecast to grow in the US and Canada by between 3% and 4%, and also TV subscriber and licence fees which in the US are also forecast to grow by over 5%. The rest of the global market for TV subscriber and licence fees is forecast to grow by over 7% pa. This growth is driving an increasing demand for content.
In the past few years broadcasters have spent in excess of $50 billion annually on original television programming globally (excluding news and sports programming) with broadcasters in the US and leading European markets accounting for almost half of all originated TV content spend.
US cable networks represent the largest share of total production commissioning spend, especially for independent producers such as eOne. In 2011, total forecast commissioning spend (excluding news and sport) was expected to be $11 billion with $5 billion attributed to cable networks.
Licensing and merchandisingThe global market for children’s TV broadcast licensing and merchandising is worth approximately $43 billion. The US accounts for $13 billion and the UK $3 billion and the market is increasing at around 3% per annum. The total US toy market was worth $21.1 billion in 2011 of which infant/pre-school sales were $3.2 billion.
eOne’s Family licensing and merchandising team look to develop product lines in conjunction with our licensee partners across a variety of different categories including toys, video games, apparel, footwear, publishing, home furnishings, foods and stationery. eOne manages and approves all product at the development stage and is constantly looking to refresh the “style” guides to ensure the brands remain up to date and relevant for consumers around the world.
Market developmentseOne’s television production business benefits from its Canadian heritage. Canada is unique globally in the extent to which government-sponsored financing is available to producers to create high quality English-speaking television content for domestic broadcast and international distribution. The range of public and private subsidies available in Canada means that producers are able to produce programming at lower cost and with lower risk to their own capital.
This allows the business to continue to deliver high quality content while also maintaining the rights to its programmes in perpetuity. The Group continues to expand its slate of productions for broadcast on the major North American and European networks.
Market developmentsThe dynamics of licensing and merchandising markets vary fundamentally in different territories around the world. Performance of individual brands and titles in the Entertainment/Character sector is dependent more on consumer reactions to the product, television airtime and marketing and advertising strategies than macro economic factors.
The UK has the highest level of retail sales of licensed merchandise in Western Europe, providing a strong infrastructure for expanding existing properties and bringing the right new products to market.
While eOne continues to grow its revenue from characters such as Peppa Pig and Ben & Holly’s Little Kingdom in the UK it also looks to enter new development projects and expand existing properties into international markets.
Growth in markets outside the US and Europe is expected to continue to accelerate on the back of a rapidly emerging middle class in Brazil, Russia, India, China and elsewhere. Digital games and applications are also expected to increase their share of the market and eOne is well placed with multiple Peppa Pig apps all of which have now debuted at number one on iTunes.
Forecast global broadcasting market growth 2011–2016
US toy market 2011
+6.8% $21.1bn

Entertainment One Ltd.Business and Financial Review
14
entertainmentonegroup.com
Chief Executive’s Review
We are pleased to report another year of strong growth with revenue increasing 7% to £502.7 million, profit before tax up 103% to £23.1 million and underlying EBITDA up 24% to £52.6 million compared to the previous year. This performance was driven by the increased investment in our Entertainment division, where revenue was up 21% and underlying EBITDA was up 48%.
Revenue in the Film business increased 17% to £272 million with 152 theatrical releases compared to 121 in the prior year, generating box office takings of $212 million (2011: $202 million). The highlight of the year was the fourth Twilight Saga instalment, Breaking Dawn – Part 1, which was again the number one release at the box office and on DVD in both the UK and Canada. The UK business benefited significantly from signing a five year output deal granting Amazon.com Inc’s subsidiary LOVEFiLM exclusive rights to the Company’s releases in the subscription video on demand Pay TV window. The Hopscotch business in Australia, acquired in May 2011, has integrated quickly into the Group and performed strongly in the period since acquisition. New initiatives to expand the Group’s international sales and US Film businesses are both progressing well.
Digital revenue doubled to £66 million, with a significant proportion of this increase resulting from the LOVEFiLM deal in the UK. Digital now represents 13% of Group revenues.
The Television business also had an excellent year. Revenue increased by 43% to £97 million as the Group consolidated its position as a leading independent studio. Performance highlights included delivery of new network series Hell on Wheels and The Firm, new seasons of successful shows Call me Fitz and Haven and continued acclaim for original TV movies such as Goodnight for Justice and Whiskey Business. The third season of Rookie Blue was also delivered and premiered in the US and Canada in May 2012 with the highest opening viewer ratings of the series so far. The pipeline continues to remain strong. Recent renewals include a second season of Hell on Wheels, the first season of which achieved AMC’s second highest ever ratings for a scripted series, Haven for a third season and Call me Fitz for a fourth. New commissions include hospital drama Saving Hope, suspense drama Rogue and factual series Perfect Storms. The international television sales business is making excellent progress, building on the strength and quality of the Group’s growing slate. Following the huge success of The Walking Dead, where production is now into a third season, the Company is actively growing its third party content slate and has recently acquired the international rights to Primeval: New World.
“ The business continues to perform strongly and the strategy of investing in building the content slate across formats is expected to continue to deliver strong organic results.”
Darren ThroopChief Executive Officer

Entertainment One Ltd.Business and Financial Review
15
Annual Report & Accounts 2012
The Family business continued its good progress. Peppa Pig remained the number one pre-school property in the UK both in terms of viewing figures on FIVE’s Milkshake and Nick Jr. and retail sales of licensed toys. In the US viewing figures continue to grow well which resulted in Nick Jr. extending the programme’s broadcast slot. Preparations continue for the nationwide launch of a full toy range for the 2012 holiday season. Deals have recently been agreed with two leading US publishers to support the launch of books at the same time. Peppa Pig is also making excellent progress internationally, and is now the number one pre-school show in Australia, Spain and Italy, expanding in central Europe and plans are now being accelerated to move into the Far East and Latin America. Elsewhere a second season of Ben & Holly’s Little Kingdom will start airing on Nick Jr. in the UK later this year, which will coincide with the roll out of an autumn/winter merchandising range. We are continuing to develop a strong pipeline of new shows with major international broadcasters. In Distribution revenues were 16% down compared to the prior year, mainly due to a weak performance in Canada against a background of a declining market for physical home entertainment product and significant restructuring by the major movie studios. While the Board believes this should create consolidation opportunities in the future we are managing the current changes in the market by extending our product offering beyond our traditional product range and through rigorous cost management.
In November 2011 the Group extended its existing banking facilities and secured additional working capital to support the continued growth of the business. The facility is underpinned by the 2011 independent annual library valuation which increased by 40% to $350 million.
The strategic review undertaken by the Board during the year concluded that offers made for all or parts of the Group did not maximise value for shareholders. The Board determined that it would continue to evaluate acquisition opportunities to supplement the organic development of the Group, which could generate superior shareholder value and enhance the Group’s strategic position.
The Board notes the recent speculation in the market regarding a possible acquisition of Alliance Films and the potential for an associated capital raising exercise. The Board confirms it has held discussions with the shareholders of Alliance Films but there can be no certainty this will lead to a transaction. In any event the Company would only undertake such a transaction on acceptable terms, and on the basis that the directors believe it would be financially and strategically value enhancing for the Company and its shareholders. Should a transaction be agreed the Company would intend to raise funds through a combination of committed debt facilities and, subject to market conditions, the proceeds of an equity placing that would be fully underwritten by a limited group of institutional investors.
OutlookThe business continues to perform strongly and the strategy of investing in building the content slate across formats is expected to continue to deliver strong organic results. We will continue to reinvest the strong operating cash flows being generated into further building our Film, Television and Family businesses.
rightA Dangerous Method, Film
Independent annual library valuation increased to $350m
Underlying EBITDA
+40%
+24%

Entertainment One Ltd.Business and Financial Review
16
entertainmentonegroup.com
Summary Financial Performance
Group overview
The Group’s strategy continues to deliver increased revenue year on year and strong underlying EBITDA growth. Reported revenue from continuing activities increased by 7% to £502.7 million. Reported profit before tax from continuing activities was up 103% at £23.1 million compared to £11.4 million in the prior year. Excluding depreciation, amortisation, share-based payments and one-off items, adjusted profit before tax was up 33.1% to £43.0 million compared to £32.3 million in 2011 with continued excellent results from the Film and Television businesses more than offsetting the decline in physical distribution.
Earnings before interest, tax, depreciation, amortisation of intangible assets, share-based payment charges and one-off items (“underlying EBITDA”) increased strongly, by 23.8% to £52.6 million. Adjusting for exchange translation and the impact of the Hopscotch acquisition, underlying EBITDA increased by 19.6%. A key driver of this increase was the improvement in the Group’s EBITDA margin percentage, which increased to 10.5% from 9.0%, with the strong growth in the Entertainment division more than offsetting the impact of the lower margins in Distribution.
Investment in content and programmes increased by 49% to £135.8 million. This was driven by large production orders in Television resulting in a £33 million increase in investment in programmes and an increase of £12 million in investment in content as the film slate continues to expand.
2012 Reported (audited)
2011 Reported (audited)
2012 Proforma, Constant
Currency* (unaudited)
2011 Proforma, Constant Currency*
(unaudited)
Continuing operations £m £m % £m £m %
Revenue 502.7 469.7 7.0% 503.8 479.1 5.2%Underlying EBITDA 52.6 42.5 23.8% 52.4 43.8 19.6%Investment in content
& programmes 135.8 91.3 48.7% 136.3 94.5 44.2%
* In order to provide like for like comparisons, the above table includes the results and prior year figures on a proforma and constant currency basis. For the purposes of this analysis “proforma” includes the results of Hopscotch, which was acquired on 13 May 2011, as if that business had been acquired on the first day of the comparative period. Constant currencies have been calculated by retranslating the comparative figures using weighted average exchange rates for the period to 31 March 2012. The impact of currency movements has had an immaterial impact on revenue and underlying EBITDA in the period
The Group reports its results as two divisions, Entertainment and Distribution. Unless otherwise stated, prior year comparative information in the Divisional Reviews section is stated on a proforma and constant currency basis.
from left to rightStarbuck, FilmKiller Joe, FilmDon’t Be Afraid of the Dark, FilmThe Host, FilmThe Cold Light of Day, FilmWarrior, Film
Entertainment revenue increase
+21%

Entertainment One Ltd.Business and Financial Review
17
Annual Report & Accounts 2012
Entertainment
The Entertainment division comprises the Film and Television businesses. On a reported basis revenue increased by 21% to £360.5 million and underlying EBITDA was up by 48% to £50.4 million.
FilmThe Film business comprises operations in the UK, Canada, the US, Benelux and Australia. Revenue increased by 13% in the year to £273.3 million due to continuing growth in the UK and a strong performance in Australia. This drove an increase in underlying EBITDA of 41% to £34.9 million (2011: £24.7 million).
Investment in content was £64.2 million (2011: £55.0 million) and increased by 17% as the business continues to expand the slate to support future earnings.
2012 Reported (audited)
2011 Reported (audited)
2012 Proforma, Constant Currency
(unaudited)
2011 Proforma, Constant Currency
(unaudited)
£m £m % £m £m %
Revenue 272.3 232.2 17.3% 273.3 242.7 12.6%Underlying EBITDA 35.0 23.4 49.6% 34.9 24.7 41.3%Investment in content
& programmes 63.8 52.3 22.0% 64.2 55.0 16.7%
Multiple territoriesThe Group continued to build its slate in 2011/12 with a number of high profile theatrical releases across more than one territory. These included Man on a Ledge, We Need to Talk About Kevin, Source Code, Ghost Rider: Spirit of Vengeance, The Rum Diary and the Academy Award nominated Tinker, Tailor, Soldier, Spy and Albert Nobbs.
The fourth instalment of the blockbuster Twilight Saga franchise, The Twilight Saga: Breaking Dawn – Part 1, was released theatrically in November 2011 and onto DVD, Blu-ray and digital download in March 2012. The franchise continued to perform strongly and in the UK had the highest grossing box office of the series so far. Global box office from the films released to date now stands at $2.5 billion and the highly anticipated final instalment, The Twilight Saga: Breaking Dawn – Part 2, is due for theatrical release in November 2012.
The multi-territory slate is expected to continue to grow in 2012/13 with forthcoming titles including comedy drama The Angels’ Share (directed by Ken Loach and the only British film in competition at the 2012 Cannes Film Festival), dark comedy Killer Joe (starring Matthew McConaughey and Emile Hirsch, which will open the Edinburgh Film Festival), action movie Bullet to the Head (Sylvester Stallone and Christian Slater), comedy The Big Wedding (Katherine Heigl, Robert De Niro, Dianne Keaton and Amanda Seyfried), David Cronenberg’s drama Cosmopolis (Robert Pattinson, Paul Giamatti and Juliette Binoche) and thriller Parker (starring Jason Statham).
DivisionalReviews

Entertainment One Ltd.Business and Financial Review
18
entertainmentonegroup.com
Divisional Reviews continued
The International Film Sales business, which was expanded in the year with the opening of an office in London and appointment of a managing director, is expected to enhance the Group’s presence in the industry and provide additional opportunities to extend the multi-territory slate. Recently acquired features Cut Bank and Freezing People is Easy were promoted at the 2012 Cannes film festival.
ukIn the UK revenue increased by more than 25% due in particular to digital sales resulting from the LOVEFiLM deal. This growth was partly offset by the impact of fewer releases, with 11 theatrical titles compared to 16 in the previous year. In addition to multi-territory films, other releases included The Three Musketeers, The Ides of March, Goon, and A Monster in Paris. Home video performed well, releasing 73 titles, supported by those with previous strong theatrical release such as The Twilight Saga: Breaking Dawn – Part 1 and The Ides of March. Other DVD releases included The Killing 2, TT: Closer to the Edge, Horrid Henry: The Movie and The Gruffalo’s Child. Sales to television increased significantly and at the end of the year a deal was signed with Channel 4 in the “free TV” window for titles such as The Twilight Saga: New Moon, The Twilight Saga: Eclipse, RED, Letters to Juliet, Remember Me, I Love You Philip Morris, Love Happens and Astroboy.
2012/13 will see an increase in the number of theatrical releases. In addition to multi-territory titles, UK releases will include a film adaptation of the popular 1970’s police drama The Sweeney (starring Ray Winstone and Plan B), a sequel to the 2010 Christmas hit Nativity (David Tennant, Pam Ferris, Jessica Hynes and Joanna Page), horror movie The Pact (Caity Lotz, Casper Van Dien), action sci-fi movie Looper (Joseph Gordon-Levitt, Bruce Willis and Emily Blunt) and thriller Now You See Me (Jesse Eisenberg, Woody Harrelson and Michael Caine).
In addition to theatrically released titles, DVD releases will include the second season of hit TV series The Walking Dead, Scandinavian TV show The Bridge, thriller movie Freelancers (starring Robert De Niro, Forest Whitaker and 50 Cent), action films Recoil (Steve Austin) and The Courier (Mickey Rourke and Jeffrey Dean Morgan) and Icelandic thriller Black’s Game.
CanadaIn Canada revenue increased by 3% with 54 theatrical releases compared to 56 in the prior year. The business continued to consolidate its position, focusing on films with higher average box office. 12 titles generated box office in excess of $2 million in 2011/12 compared to nine in the prior year. In addition to the multi-territory titles, theatrical releases included The Grey, Starbuck, One for the Money and A Dangerous Method as well as Academy Award nominated films Tree of Life, Monsieur Lazhar and Chris Weitz’s A Better Life. There were 186 home video releases including films released theatrically such as The Twilight Saga: Breaking Dawn – Part 1, Source Code, The Lincoln Lawyer, Killer Elite and Starbuck and titles released directly to home video. These included Recoil, Halo, Hidden 3D, seasons three and four of TV show Heartland and the first two seasons of UK hit period drama Downton Abbey, which was one of the top selling TV shows on DVD in the year.

Entertainment One Ltd.Business and Financial Review
19
Annual Report & Accounts 2012
During the year the Group extended its long-term deal with Summit, signed output deals with Lava Bear, Wrekin Hill and Remstar, renewed its agreement with Christal and concluded a five year output deal with pay TV broadcasters. The second half of the year also benefited from the acquisition of Vivendi’s home entertainment business while a new digital deal has recently been signed with Netflix.
In addition to multi-territory titles major theatrical releases for 2012/13 will include comedy romance Seeking a Friend for the End of the World (starring Steve Carell and Keira Knightley), Wes Anderson’s Moonrise Kingdom (Bruce Willis, Bill Murray and Tilda Swinton), the fourth instalment of dance franchise Step Up Revolution, I Frankenstein (Aaron Eckhart) and Broken City (Mark Wahlberg, Catherine Zeta-Jones and Russell Crowe).
Straight to DVD releases in 2012/13 will include Universal Soldier 4, REC 3 and new seasons of TV shows Downton Abbey and eOne productions Haven and Rookie Blue.
beneluxThe Benelux business released 57 films theatrically compared to 49 in the prior year. Revenue was slightly behind with higher theatrical sales offset by lower sales in the home video and television windows. There is opportunity for growth in the digital window as there has been a delayed entry of video on demand and digital platforms into the Benelux market compared to other territories in which the Group operates, with iTunes only entering the video market in late 2011. Consequently the growth in these channels has only recently begun to mitigate the decline in the traditional home video segment.
Major theatrical releases included Insidious, the new release in the seasonal Sinterklaas (Santa Claus) family film series, local title Bende Van Oss, Scream 4 and Abduction. The business released 157 titles to home video including The Next Three Days, Source Code, The Lincoln Lawyer and the first season of The Walking Dead.
In addition to multi-territory titles the 2012/13 theatrical release slate includes dance movie StreetDance2, comedy drama Hope Springs (starring Meryl Streep, Steve Carell and Tommy Lee Jones), Bob Marley documentary Marley, action thriller Safe (Jason Statham), Dredd 3D and local title De Verbouwing. DVD releases will include Tinker, Tailor, Soldier, Spy, local television series Koen Kampioen, Ghostrider 3D and Chernobyl Diaries.
australiaThe Australian business, which was acquired in May 2011, was quickly integrated into the Group and performed strongly during the year. The business released 30 films theatrically following acquisition including Source Code, Woody Allen’s Oscar winning Midnight in Paris, Incendies, A Separation and We Need to Talk about Kevin.
Home video also performed well with a strong portfolio of theatrical titles, big brand TV franchises and straight to DVD movies. Over 70 titles were released including the theatrical releases, hit TV series The Slap and three series of the UK comedy show The Inbetweeners.
from left to rightRookie Blue, TVThe Rum Diary, FilmMoonrise Kingdom, FilmHaven, TV Marley, Film
Film underlying EBITDA
+41%
The Australian business, which was acquired in May 2011, was quickly integrated into the Group and performed strongly during the year.
Film investment in content
£64m(2011: £52m)

Entertainment One Ltd.Business and Financial Review
20
entertainmentonegroup.com
Divisional Reviews continued
Tangible benefits from the acquisition were achieved quickly with the extension of the Group’s output deals with Summit and Lakeshore to Australia while more recently the business has participated in multi-territory film acquisitions and in developing the rapid growth of Peppa Pig in the local market. In November an agreement was reached with Twentieth Century Fox Home Entertainment to take over distribution of the Group’s Home Entertainment product across Australia and New Zealand.
The theatrical slate for 2012/13 is expected to continue to grow with highlights including The Sapphires based on the hugely successful Australian stage musical of the same name, Bachelorette (starring Isla Fisher and Kirsten Dunst), Woody Allen’s latest comedy To Rome with Love (Alec Baldwin, Penelope Cruz and Jesse Eisenberg) and Ron Howard’s Formula 1 biography of Niki Lauda Rush (Daniel Bruhl and Olivia Wilde). The DVD slate is also expected to expand in particular with the release of popular TV series including new seasons of hit shows The Walking Dead and Hustle, the first two seasons of the US version of hit UK series The Inbetweeners, Hunted and the first season of Real Humans.
uSThe US Film business released over 100 home video titles in the year, which was similar to the comparative period. However the closure of Borders and impact of Blockbuster’s store closure programme impacted on revenues which were 17% below the prior year. Major titles included season one of eOne’s television production Haven, the classic NBC series It Takes a Thief, season three of Syfy TV series Sanctuary, the first season of the US version of Being Human and movies The Bang Bang Club and Age of Heroes.
The Group has commenced its expansion of the US Film business with an increase in future release commitments. 10 limited release theatrical titles are planned for 2012/13 including Jesus Henry Christ (starring Jason Spevack, Toni Collette and Michael Sheen), sci-fi comedy Iron Sky, action thriller Special Forces (Diane Kruger and Djimon Hounsou), French language comedy Starbuck (Patrick Huard), Wish You Were Here (Joel Edgerton) and multi-territory title Cosmopolis.
DVD releases in 2012/13 are expected to include popular comedian and actor Katt Williams’ comedy special Kattpacalypse, Joan Rivers’ comedy special Don’t Start With Me, season one of AMC’s hit eOne-produced series Hell on Wheels, season two of Being Human, second seasons of eOne’s hit Television series Rookie Blue and Haven and the first season of Showtime’s comedy series Web Therapy (starring Lisa Kudrow). In addition, the US will launch several children’s brands on home video including eOne’s Peppa Pig as well as Babar and the Adventures of Badou and Guess How Much I Love You (both airing on Disney Jr.) and Poppy Cat (PBS Sprout’s highest-rated programme).
Film also incorporates the results of the US music label business. Revenue from the label, which represents less than 4% of the Group’s revenues and EBITDA, was up 7% compared to the prior year following a good release schedule and new genre signings. Major releases on the label during 2011/12 included the first new album in 10 years from Bush and new albums from Chickenfoot, William McDowell and Jim Jones. 2012/13 will see releases from Ashanti, Bishop Paul Morton and Cassandra Wilson. Digital revenue continues to grow and is now 53% of total music label revenues (2011: 50%).
from left to rightKiller Elite, FilmSaving Hope, TVMan on a Ledge, FilmWhiskey Business, TV
Television revenue
+42%
Entertainment One Ltd.Business and Financial Review
21
Annual Report & Accounts 2012
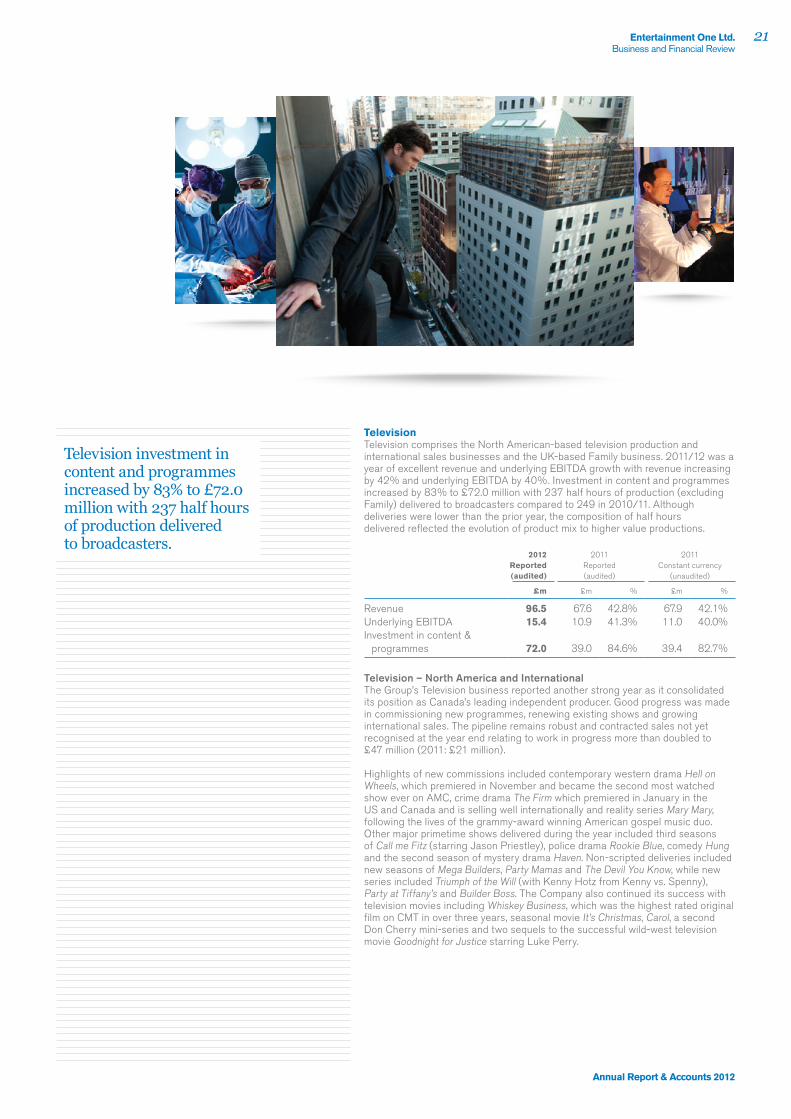
TelevisionTelevision comprises the North American-based television production and international sales businesses and the UK-based Family business. 2011/12 was a year of excellent revenue and underlying EBITDA growth with revenue increasing by 42% and underlying EBITDA by 40%. Investment in content and programmes increased by 83% to £72.0 million with 237 half hours of production (excluding Family) delivered to broadcasters compared to 249 in 2010/11. Although deliveries were lower than the prior year, the composition of half hours delivered reflected the evolution of product mix to higher value productions.
2012 Reported (audited)
2011 Reported (audited)
2011 Constant currency
(unaudited)
£m £m % £m %
Revenue 96.5 67.6 42.8% 67.9 42.1%Underlying EBITDA 15.4 10.9 41.3% 11.0 40.0%Investment in content &
programmes 72.0 39.0 84.6% 39.4 82.7%
Television – north america and internationalThe Group’s Television business reported another strong year as it consolidated its position as Canada’s leading independent producer. Good progress was made in commissioning new programmes, renewing existing shows and growing international sales. The pipeline remains robust and contracted sales not yet recognised at the year end relating to work in progress more than doubled to £47 million (2011: £21 million).
Highlights of new commissions included contemporary western drama Hell on Wheels, which premiered in November and became the second most watched show ever on AMC, crime drama The Firm which premiered in January in the US and Canada and is selling well internationally and reality series Mary Mary, following the lives of the grammy-award winning American gospel music duo. Other major primetime shows delivered during the year included third seasons of Call me Fitz (starring Jason Priestley), police drama Rookie Blue, comedy Hung and the second season of mystery drama Haven. Non-scripted deliveries included new seasons of Mega Builders, Party Mamas and The Devil You Know, while new series included Triumph of the Will (with Kenny Hotz from Kenny vs. Spenny), Party at Tiffany’s and Builder Boss. The Company also continued its success with television movies including Whiskey Business, which was the highest rated original film on CMT in over three years, seasonal movie It’s Christmas, Carol, a second Don Cherry mini-series and two sequels to the successful wild-west television movie Goodnight for Justice starring Luke Perry.
Television investment in content and programmes increased by 83% to £72.0 million with 237 half hours of production delivered to broadcasters.

Entertainment One Ltd.Business and Financial Review
22
entertainmentonegroup.com
Divisional Reviews continued
2012/13 will see continued progress. Production has commenced on Saving Hope, a new medical drama that will premiere on NBC in the US and CTV in Canada in June 2012. Filming is also due to begin in August 2012 on suspense drama Rogue, starring award winning actress Thandie Newton, which will be broadcast on DirecTV and HBO Canada. A number of existing series have been renewed including a fourth season of Call Me Fitz, third season of Haven and second season of Hell on Wheels. New seasons of non-scripted shows include The Devil You Know and Mary Mary while the television movie Tom, Dick and Harriet has been ordered by Hallmark channel. A deal was also signed with award winning producer Steven Bochco to develop and produce a futuristic new drama, Evolution.
During the year the International television sales business expanded its activities in the UK and, as well as selling the Group’s own productions, is also increasing investment in third-party content. Programmes acquired for distribution include the North American spin off of the hit UK television series, Primeval: New World, comedy Mr D and the third season of international hit The Walking Dead.
Television – FamilyThe Family business had another good year with strong licence renewals and the continued success of Peppa Pig. Viewing figures in the US have been strong and growing, with Peppa Pig broadcasting seven days a week on Nick Jr. This underpins the Company’s expectations for a strong launch of licensing and merchandising later this year. Fisher-Price, the Company’s US master-toy partner, has made excellent progress to ensure that a range of toys will feature prominently on retail shelves nationwide at Toys R Us for the 2012 holiday season. This rollout will be complemented by books, following significant agreements with two major US publishers, as well as a DVD and iTunes launch. Following the success of the broadcasting launches in Spain, Italy and Australia, Peppa Pig licensing and merchandising programmes are now in place with leading partners in all three territories. In addition Peppa Pig is expanding further internationally with plans being accelerated to enter the Far East and Latin American markets. In the UK, Peppa has consolidated its position as the UK’s leading pre-school toy property for the second year in a row, continues to be the UK’s number one pre-school property overall and remains the number one pre-school show on FIVE’s Milkshake and Nick Jr. Despite tough retail conditions, licensing and merchandising revenue remained strong. 26 new episodes were delivered to broadcasters in the year and season six episodes are scheduled for delivery in 2012.
Elsewhere in the Family business, Ben & Holly’s Little Kingdom continued its good progress in the UK and has recently moved to a higher profile 7.20am daily slot on FIVE’s Milkshake. Season two, consisting of 52 episodes, is due for delivery in 2012/13. The development slate also remains extremely strong with properties in development with all major Canadian broadcasters (YTV, Teletoon, Family Channel, CBC and TVO) as well as major European terrestrial broadcasters and a major US platform. The Company expects to commence full production on at least two series by the end of the year and a further two to three series next year.
The Family business had another good year with strong licence renewals and the continued success of Peppa Pig.

Entertainment One Ltd.Business and Financial Review
23
Annual Report & Accounts 2012
Distribution
The Distribution division combines the Group’s physical home entertainment wholesale business in Canada and the music and DVD distribution business in the US. Overall revenue at £189.8 million was 16% lower than the prior year following challenging market conditions in Canada.
2012 Reported (audited)
2011 Reported (audited)
2011 Constant currency
(unaudited)
Distribution £m £m % £m %
Revenue 189.8 227.3 -16.5% 225.2 -15.7%Underlying EBITDA 6.5 13.0 -50.0% 12.9 -49.6%
The Canadian business is predominantly a distributor of DVDs and Blu-ray discs, representing both the Group’s Entertainment division and also third party producers including the major US studios. 2011/12 was a difficult year for the business with the overall Canadian market experiencing double digit decline in the demand for DVDs. In addition the business was impacted by changes to the Canadian operations and infrastructure of several major US studios.
While this may create consolidation opportunities in the future the business is managing the current changes in the market through extending the product offering beyond the Group’s traditional product range of DVDs and CDs and continuing to focus on reducing costs where possible. In particular the Company has continued to improve its inventory management resulting in a 24% reduction in inventory levels at 31 March 2012 compared to the prior year.
The US business distributes for the Group’s in-house video and music labels as well as representing other third party producers. Despite the declining market in the US, sales remained broadly flat with strong digital sales offsetting some of the general market weakness. The outlook is positive going forward with the planned expansion of the US Film business from both increased investment in content and new labels expected to bring benefits to the US distribution business.
from left to rightSeeking a Friend for the End of the World, FilmGoon, FilmBeginners, FilmThe Angels’ Share, FilmMelancholia, Film

Entertainment One Ltd.Business and Financial Review
24
entertainmentonegroup.com
Group underlying EBITDA
62%27%
11%
FilmTelevisionDistribution
51%
23%
26%
2011
2012
FinancialReview
Group costsGroup costs at £4.4 million (2011: £4.7 million) before one-off items were broadly in line with the prior year.
Other financial informationA summary of adjusted financial information is presented in order to provide useful information to investors. It comprises results from continuing operations and excludes the following: one-off items, amortisation of acquired intangible assets, share-based payment charges and non-recurring items within net finance charges and taxation.
Adjusted operating profit increased 25% to £50.1 million (2011: £40.1 million) reflecting the growth in underlying EBITDA. Adjusted profit before tax increased 33% to £43.0 million reflecting the increased operating profit and lower finance charges.
Adjusted (audited) Reported (audited)
Continuing operations2012
£m2011
£m2012
£m2011
£m
Underlying EBITDA 52.6 42.5 52.6 42.5
One-off items – – (3.8) (2.7)Amortisation of intangible assets (1.0) (0.7) (16.4) (15.3)Depreciation (1.5) (1.7) (1.5) (1.7)Share-based payment charge – – (1.4) (2.5)
Operating profit 50.1 40.1 29.5 20.3Net finance charges (7.1) (7.8) (6.4) (8.9)
Profit before tax 43.0 32.3 23.1 11.4Taxation (11.2) (8.8) (6.9) (4.0)
Profit after tax 31.8 23.5 16.2 7.4
One-off itemsOne-off items totalled £3.8 million and included £3.1 million relating to the Group’s strategic review. The remaining one-off items comprise other deal costs including the acquisition of Hopscotch in Australia which completed in May 2011.
Amortisation of intangible assets and depreciationAmortisation of intangible assets increased £1.1 million to £16.4 million, mainly as a result of the increase in intangible assets acquired as part of the Hopscotch acquisition. Depreciation decreased by £0.2 million to £1.5 million. Share-based payment chargeThe share-based payment charge of £1.4 million decreased by £1.1 million. The charge includes new grants in the year relating to the Hopscotch acquisition and ongoing charges relating to prior grants.
Film and television share of Group underlying EBITDA
89%(2011: 74%)
Adjusted profit before tax increased 33% to £43.0 million

Entertainment One Ltd.Business and Financial Review
25
Annual Report & Accounts 2012
Net finance chargesReported net finance charges decreased from £8.9 million to £6.4 million. Excluding the impact of foreign exchange and the conversion of exchangeable notes in the prior year, finance charges were £0.7 million lower in the current year, reflecting lower average net debt levels and lower average interest rates.
The weighted average interest cost was 5.5% compared to 6.1% in the prior year, giving a cash interest cover of 9.2 times underlying EBITDA (2011: 8.2 times).
TaxThe tax charge for the year was £6.9 million (2011: £4.0 million) giving an effective tax rate of 29.9% (2011: 35.1%). The effective rate in 2011/12 was higher than the average of the statutory rates in the jurisdictions in which the Group operates mainly due to the impact of costs incurred that are not deductible for tax purposes such as acquisition costs, provisions and share-based payment charges.
On an adjusted basis, excluding operating one-off items, amortisation of intangible assets, share-based payment charges and one-off items in net finance costs and taxation, the effective tax rate was 26.0% (2011: 27.2%). This is lower than the simple average of tax rates of the countries in which the Group operates mainly due to benefits in some jurisdictions from recognising historic tax losses.
Earnings per shareReported profit after tax was £16.2 million (2011: £7.4 million). Reported diluted earnings per share from continuing operations was 7.8 pence (2011: 4.1 pence). The increase reflects the strong trading performance in the year. On an adjusted basis profit after tax was £31.8 million, 35.3% ahead of the prior year. The adjusted diluted earnings per share was 15.4 pence (2011: 13.0 pence), up 18.5% and incorporates the impact of the increase in the number of dilutive shares following the strong share price performance in the year.
Financing and cash flowThe net debt balances at 31 March 2012 comprise the following:
2012 £m
2011 £m
Cash and other items (excl. TV Production) (11.6) (27.8)JP Morgan – Senior Revolving Credit Facility 55.7 66.4
Adjusted Net Debt 44.1 38.6Television Production Net Debt 46.1 22.1
90.2 60.7
The increase in net debt comprises an increase in adjusted net debt of £5.5 million and increase of £24.0 million in the Television Production business.
from left to rightMidnight in Paris, FilmThe Firm, TV
Adjusted diluted earnings per share1
15.4p(2011: 13.0p)
1 Adjusted diluted earnings per share is adjusted for operating one-off items, share-based payment charges, amortisation of acquired intangible assets and one-off items within net finance charges and taxation

Entertainment One Ltd.Business and Financial Review
26
entertainmentonegroup.com
Financial Review continued
31 March 2012
Adjusted net debt
£m
TV Prod’n
£mTotal
£m
31 March 2011
£m
Net debt at 31 March b/f (38.6) (22.1) (60.7) (86.0)Net cash from operating activities 74.6 49.5 124.1 104.9Investment in content rights and TV
programmes (66.2) (69.6) (135.8) (91.3)
Purchase of other non-current assets* (1.9) (0.1) (2.0) (1.6)
Free cash flow 6.5 (20.2) (13.7) 12.0Acquisition of subsidiaries (6.3) – (6.3) (3.1)Net interest paid (4.9) (0.8) (5.7) (5.2)Net proceeds from issue of ordinary shares – – – 16.3Other items (including foreign exchange) (0.8) (3.0) (3.8) 5.3
Net debt at 31 March c/f (44.1) (46.1) (90.2) (60.7)
* Other non-current assets comprise property, plant and equipment and intangible software
Cash flows from operating activities at £124.1 million were 18.3% ahead of the previous year reflecting the improved underlying EBITDA and strong cash generation from the Group’s investment and production activities.
The Group invested £135.8 million in content rights and television programmes in the year (2011: £91.3 million) and incurred cash costs of £6.3 million relating to the May 2011 acquisition of the Hopscotch business.
Adjusted Net DebtThe Adjusted Net Debt balance was £44.1 million, up £5.5 million from the previous year end. The increase is driven primarily by the acquisition of Hopscotch (£6.3 million) and a significant increase in investment in content rights. Adjusted net debt leverage (defined as adjusted net debt divided by underlying EBITDA) further reduced year on year and was 0.8 times at 31 March 2012 (2011: 0.9 times).
During the year the Company signed an extension to its existing senior credit facility, setting a new maturity date of October 2014 and increasing the amount available from September 2012. At 31 March 2012, using prevailing exchange rates, the total available facility was US$224 million and in September 2012 this will reduce to US$198 million.
(2011: £104.9m)
Net cash from operating activities
£124.1m

Entertainment One Ltd.Business and Financial Review
27
Annual Report & Accounts 2012
Television Production Net DebtTelevision Production net debt increased by £24.0 million year on year to £46.1 million reflecting the large number of high value productions in progress at the year end. This financing is independent of the Group’s senior credit facility. It is excluded from the calculation of Adjusted Net Debt as it is secured over the assets of individual production companies within the Television business and represents shorter-term working capital financing that is arranged and secured on a production-by-production basis.
Financial Position and Going Concern BasisThe Group’s net assets increased £20.8 million to £211.7 million at 31 March 2012 (2011: £190.9 million). The increase reflects the strong trading in the year.
The directors acknowledge guidance issued by the Financial Reporting Council relating to going concern. The directors consider it appropriate to prepare the accounts on a going concern basis, as set out in note 2 to the financial statements.
from left to rightThe Samaritan, FilmOceans, FilmSleeping Beauty, Film

Entertainment One Ltd.Business and Financial Review
28
entertainmentonegroup.com
Risks and Uncertainties
The Board considers that the principal risks to achieving its objectives are set out below. The Board recognises that the nature and scope of the risks can change and so regularly reviews the risks faced by the Group as well as the systems and processes to mitigate them.
The Corporate Governance Statement on pages 39 to 40 describes the systems and processes through which the directors manage and mitigate risks.
Key personnel The performance of the Group is dependent on its ability to attract, recruit and retain quality staff in a highly competitive labour market. We continue to invest in our people, ensuring that we recruit and retain the right calibre of staff with the skills, experience and talent to grow the business. We seek to ensure we have appropriate management development programmes to assess, manage and develop our people’s leadership skills, talents and experiences throughout the organisation.
Strategy execution
The entertainment industry is constantly changing and developing, for example the increasing shift in consumption from physical DVDs to digital downloads and streaming. The Group seeks to identify and anticipate risks regarding our assumptions and understanding of the industry and economic environment, in order to ensure the strategy remains appropriate. Corporate planning processes are in place to ensure that the strategies of the individual businesses within the Group are aligned and contribute to the delivery of shareholder value.
Acquisition effectiveness
Our strategy includes growth through acquisitions in new territories around the world and consolidation opportunities in the markets in which we operate. The risks associated with this approach are mitigated through clearly defined investment criteria, detailed due diligence by the Company and its professional advisers, the requirement (where appropriate) for management to remain with the target business post acquisition and robust financial and operational post acquisition and integration plans.
Content investment opportunities
Investment in content rights is fundamental to achieving the Group’s aim of providing shareholders with improving and sustainable returns. The availability of good quality content is considered as part of the corporate planning process. The Group mitigates the risk of reduced availability of content through the continual development of relationships with producers and other key stakeholders across the entertainment industry. In addition, as the business grows it is becoming an ever more attractive partner for the sellers of entertainment rights.
Financial risk management
The Board considers that the main risks arising from the Group’s financial instruments are interest rate risk, foreign currency risk, credit risk, liquidity risk and covenant risk. The Group’s Treasury Department is principally responsible for managing financial risks to which the Group is exposed. The use of financial derivatives is governed by the Group’s policies approved by the Board of Directors. The Group does not use derivative financial instruments for speculative purposes.

Entertainment One Ltd.Business and Financial Review
29
Annual Report & Accounts 2012
Interest rate risk The Group has an exposure to interest rate risk arising principally from changes in US Dollar, Canadian Dollar, Sterling and Euro interest rates. The exposure to fluctuating interest rates is managed by capping portions of debt using interest rate collars and fixing portions of debt using interest rate swaps, which aims to optimise net finance expense and reduce excessive volatility in reported earnings. At 31 March 2012 the longest term of any debt held by the Group was until October 2014.
Foreign exchange risk
The Group’s operating activities expose it to the financial risks of changes in foreign currency exchange rates. These risks comprise translation risk, resulting from the requirement to present the results from different territories in the Group’s reporting currency, and transactional risk. Transactional risk arises where business units enter into contracts denominated in a currency other than their local reporting currency. These include Minimum Guarantee payments to film studios, which are often denominated in US Dollars. The Group uses foreign exchange forward contracts when appropriate, and otherwise uses natural hedging methods where possible, to minimise exposure in these areas.
Credit risk Credit risk arises from cash and cash equivalents, deposits with banks and financial institutions, as well as credit exposures to customers, including outstanding receivables and committed transactions. The Group controls credit risk by entering into arrangements only with highly credit-rated counterparties. The Group has no significant concentrations of credit risk, with exposure spread over a large number of counterparties and customers.
Liquidity risk In order to maintain liquidity to ensure that sufficient funds are available for ongoing operations and future developments, the Group uses a mixture of long-term and short-term debt finance. As at 31 March 2012 the Group had £17.4 million of cash and net debt of £90.2 million. The Group’s policy throughout the year has been to minimise risk by paying down debt with surplus funds when available. The Group meets its day to day working capital requirements and funds its investment in content through a revolving credit facility (“Facility”) which matures in October 2014 and is secured on assets in the Group. The amounts drawn down by currency at 31 March 2012 are shown in note 21 to the financial statements.
Covenant risk The Group must comply with a number of financial covenants as part of its Facility. The covenants under the Facility include, inter alia, net debt/underlying EBITDA, fixed interest cover and net worth. The Group monitors actual and forecast compliance with these covenants and reports regularly to its bankers. At the date of this report the Group has operated within its covenants and at 31 March 2012 had undrawn amounts of £82.2 million under the Facility. The directors consider that should the covenants be adversely impacted by the risks set out above there are a number of mitigating actions which would enable it to continue in compliance with the terms of its Facility.
from left to rightVirginia, FilmLa delicatesse, FilmComic-Con Episode IV: A Fan’s Hope, Film

Entertainment One Ltd.Corporate Governance
30
entertainmentonegroup.com
Board of Directors
Corporate Governance
1 James Corsellis ■ ■ ■ ■non-executive Chairman (42)James founded one of the earliest strategic technology consultancies in 1994 and was chief executive officer of icollector plc, a leading provider of live auction trading platforms. He is currently a managing partner of Marwyn Capital LLP and Marwyn Investment Management LLP, and a director of Marwyn Management Partners plc.
2 Darren ThroopChief executive officer (47)Darren has over 20 years of executive management experience in the entertainment industry. Darren has been Chief Executive Officer of Entertainment One since July 2003 and has been in the Group since 1999. Previously Darren was the owner of Urban Sound Exchange between 1991 and 1999 when it was acquired by the Group.
3 Patrice TherouxPresident Global Filmed entertainment (49)Patrice has over 25 years of experience in the motion picture distribution industry and until June 2006 was president and chief executive officer of the Toronto stock exchange listed Motion Picture Distribution LP, a leading independent film distribution company with operations in Canada, the UK and Spain. Patrice is a member of the Producers’ Guild of America, the British Academy of Film & Television Arts, as well as chairman of the Canadian Association of Film Distributors and Exporters.
4 Giles WillitsChief Financial officer (45)Giles joined the Executive Board of Entertainment One in May 2007. He was formerly director of Group Finance at J Sainsbury plc from 2005 to 2007 and group corporate development director and interim group finance director at Woolworths Group plc. Before this Giles held a number of finance and general management positions within Kingfisher plc and Sears Plc. Giles is a chartered accountant having qualified with PricewaterhouseCoopers.
1 2
43

Entertainment One Ltd.Corporate Governance
31
Annual Report & Accounts 2012
5 Clare Copeland ■ ■ ■Senior independent director (76)Clare is currently the chief executive officer of Falls Management Company, a commercial development and casino in Niagara Falls, Ontario, Canada. Clare is also chairman of Toronto Hydro Corporation, a Canadian electricity provider. Between 2000 and 2002 Clare was chairman and chief executive of OSF Inc., a manufacturer of retail store interiors. Between 1993 and 1999, he was chief executive officer of People’s Jewellers Corporation, a jewellery retailer. Clare is also currently a trustee of Chesswood Group Limited, RioCan Real Estate Investment Trust, Danier Leather Inc., Telesat Canada and MDC Corporation.
6 Bob Allan ■non-executive director (65)Between 1997 and 2006, Bob was vice-president of MDS Capital Corp, a North American venture capital company engaged in health and life science investments. Previously, Bob was vice-president of financial operations at the laboratory services division of MDS Inc., a public health and life sciences company. Prior to joining MDS, Bob was a vice-president of Unitel Communications Inc. Bob is a chartered accountant and a member of the Canadian Institute of Chartered Accountants.
7 Ronald Atkey ■non-executive director (70)Ron is a lawyer who was a partner at Osler, Hoskin & Harcourt LLP in Toronto for over 30 years until 2007. He has extensive experience in government regulation of Canadian cultural industries and corporate transactions in the arts, entertainment and media sectors. In 1984 Ron was appointed by the federal government as the first chair of the Security Intelligence Review Committee and remains active in the security intelligence field both as a university professor and in other public roles. He served as a Member of the Canadian Parliament for two terms between 1972 and 1980 and was Minister of Employment and Immigration in 1979-80.
8 Garth Girvan ■ ■non-executive director (63)Garth is currently a partner at the Canadian law firm McCarthy Tétrault LLP having joined the firm in 1978. Garth is currently a non-executive director of the Canadian entertainment company Imax Corporation and was previously a director of the Canadian beverage distributor Corby Distilleries Limited and Silcorp Limited. Garth is called as a barrister in Ontario (1978), Alberta (1982) and New York (1986).
9 Robert Lantos ■non-executive director (63)Robert has more than 35 years’ experience in the motion picture and television industry. He is the producer of Cannes and Golden Globe winning and Academy Award nominated films including Barney’s Version, Being Julia, Eastern Promises, and The Sweet Hereafter. He currently owns Serendipity Point Films, a film and television production company based in Toronto and Los Angeles. Prior to 1998, Robert was chairman and chief executive officer of Alliance Communications Corporation.
10 Mark Opzoomer ■non-executive director (54)Mark is a founder and CEO of Zattikka plc, an LSE AIM listed social and casual games entertainment company, and a partner in Bond Capital Partners. Mark is a non-executive director of Blinkx plc and Forward Internet Group Limited. He was previously non-executive director, then CEO of Rambler Media Limited. Prior to this Mark was the managing director and regional vice-president of Yahoo! Europe. Prior to joining Yahoo! Europe, Mark was deputy chief executive of Hodder Headline plc, an LSE listed book publishing company, and previously commercial and finance director of Sega Europe Ltd and commercial director of Virgin Communications Ltd. Mark is a chartered accountant, a member of the Canadian Institute of Chartered Accountants, and has an MBA from IMD, Lausanne, Switzerland.
11 Mark Watts ■ ■non-executive director (38)Mark has been advising the boards of UK public companies since 1998. Mark is currently a managing partner in Marwyn Capital LLP and Marwyn Investment Management LLP. He is also a director of Marwyn Management Partners plc, Silverdell plc, Fulcrum Utility Services Limited, and Advanced Computer Software plc.
10 11
7 8
9
5 6
key■ Audit Committee■ Remuneration Committee■ Nominations Committee■ Special Committee

Entertainment One Ltd.Corporate Governance
32
entertainmentonegroup.com
CorporateResponsibility
PeopleThe Group recognises that the skills, motivation and energy of our workforce are key drivers for success. The Group’s structure ensures that our staff are aware of our goals and are clear on how their roles help the Group succeed. Entertainment is fundamentally a people business and the ability to attract, recruit and retain quality staff is key to our success.
We seek to ensure we have appropriate processes to assess, manage and develop our people’s leadership skills, talents and experiences throughout the organisation. The Group has numerous initiatives to promote the engagement of our employees including:
■ regular “Town Hall” broadcasts to staff from our CEO; ■ our internal intranet site which also offers discounts on Group
and other products; ■ regular newsletters and global updates; ■ team building events and an annual management retreat; and ■ frequent film screenings/premieres and access to DVD libraries.
Through our annual succession review we also aim to nurture talent and provide our employees with a framework to advance their careers thereby providing Entertainment One with its future leaders.
Charity and communityThe Group and its employees sponsored or supported many charitable initiatives involving both professional and non-profit organisations in all of our main territories during the year.
In Canada, over 80 staff members volunteered in a project called Habitat for Humanity. As a major sponsor, our employees went on site to help build homes for low income communities. Volunteers worked in teams on various projects: building stud framed walls, exterior wall framing and insulation, draining a flooded basement, framing interior walls and securing porch covers.
The Group is particularly proud of Peppa Pig’s exclusive partnership in the UK with the charity Tommy’s. Tommy’s funds research into pregnancy problems and provides information to parents. Since 2005, this partnership has raised over £1 million through a variety of engaging events benefiting children, their parents and the charity. Through its association with Peppa, Tommy’s is now the official charity partner of Peppa Pig World and Paultons Park in the UK.
The Group recognises that the performance of its business is reliant on close relationships with a range of stakeholders, including customers, suppliers, investors, employees, the wider community and the environment. The following is a summary of the many corporate responsibility activities in which we are involved.
Ethical and responsible practices and a commitment to minimise our impact on the environment are key motivators behind the Group’s corporate responsibility framework.
Building close relationships

Entertainment One Ltd.Corporate Governance
33
Annual Report & Accounts 2012
In 2012 Ben and Holly will be the ambassadors for Jeans for Genes the UK charity which encourages people to leave their suits and uniforms at home and wear their jeans to work or school in return for a donation. Jeans for Genes Day raises money for Genetic Disorders UK. The target for this year’s Jeans for Genes Day is £2.5 million.
We are also proud of the success of the Entertainment One Golf FORE Charity Tournament which has been held in Canada since 2007. The tournament is an annual event sponsored by our vendors and is attended by our major customers and partners. Last year the event raised funds in excess of C$100,000 for the SickKids Foundation.
EnvironmentOur activities are mainly office-based but also include warehousing and television production operations. We do not physically manufacture DVDs, CDs or merchandise but use third party suppliers. As such, our main environmental impacts come from the running of our businesses around the world, through the consumption of gas and electricity, transport activities and commuting as well as office-based waste such as paper and printer toners.
We take our responsibilities seriously and work hard to minimise our impact on the environment. In all of our locations we have a recycling, conservation and usage policy. We monitor our supplier relationships and wherever possible make use of suppliers with consistent environmental aims.
The Group does not cause significant pollution and the Board is committed to further improving the way in which its activities affect the environment by:
■ minimising the extent of the impact of operations within the Company’s areas of influence;
■ conserving energy through reducing consumption and increasing efficiencies;
■ minimising emissions that may cause environmental impacts; and
■ promoting efficient purchasing and encouraging materials to be recycled where appropriate.
Health and safety The Group has implemented a health and safety policy across all of its operations which meets at least the minimum legal requirements of the countries in which it operates and emphasises the principles of good safety management. The Group is committed to providing a safe working environment and to caring for the health and safety of its employees, visitors and contractors.
Regular health and safety reviews are carried out on the offices and warehouses of the Group. Each location has a nominated individual responsible for health and safety and for ensuring a safe environment for our colleagues.
We recognise that health and safety is an integral part of our workforce. Our services do not pose great risk to either our employees or our customers. However, we work to maintain a safe environment at all times.
Entertainment One Ltd.Corporate Governance
34
entertainmentonegroup.com
The directors present their report and audited financial statements for the year ended 31 March 2012.
Principal activitiesEntertainment One is a leading independent entertainment group focused on the acquisition, production and distribution of film and television content rights across all media throughout the world.
Business reviewThe Business Review sets out a comprehensive review of the development and performance of the business for the year ended 31 March 2012 and is set out on pages 12 to 29.
Results and dividendDuring the year the Group made a profit after tax of £16.2 million (2011: £7.4 million) on a continuing basis. The Company did not pay out an interim dividend during the year ended 31 March 2012 and the directors are not recommending the payment of a final dividend in respect of 2012.
Risk management and internal controlsDisclosures can be found in note 34 to the financial statements and the Corporate Governance section on pages 39 to 40.
Capital structureThe Company has common shares and preferred variable voting shares which carry no right to income.
Common shares carry the right to one vote at general meetings of the Company. They have no par value and the authorised number of common shares is unlimited. There are no specific restrictions on the size of a holding nor on the transfer of shares, which are both governed by the general provisions of the Articles of the Company and prevailing legislation. Further information regarding the capital structure, together with details of new share issues during the year are shown in note 23 to the financial statements.
The Company also has preferred variable voting shares in order to meet certain Canadian regulatory requirements for film and television distribution companies under the Investment Canada Act. The preferred variable voting shares, which are not transferable without the consent of the Board, are held by the Company’s Chief Executive Officer Darren Throop. The preferred variable voting shares carry no rights to income.
DirectorsAll directors served throughout the year under review and details for all present directors are listed, together with their biographical details, on pages 30 to 31. The Company has agreed to indemnify the directors as permitted by law against liabilities they may incur in the execution of their duties as directors of the Company. The Company may by ordinary resolution appoint or remove a director to the Board. The responsibilities of the directors are detailed in the Corporate Governance Statement on pages 39 to 40.
Directors’ Report
Directors’ interestsThe beneficial interests of the directors and their families in the shares of the Company are shown below. Options granted under the Company’s employee share plans are shown in the Directors’ Remuneration Report on pages 36 to 38.
At 31 March 2012 Number of
common shares
Darren Throop 4,786,818Patrice Theroux 430,457Giles Willits 320,000Robert Lantos 3,126,828Mark Watts 1,000
In addition to the above, on 27 March 2012 Darren Throop and Patrice Theroux each exercised 1,453,744 share options in the Company. The common shares in Entertainment One Ltd were issued subsequent to 31 March 2012.
Directors’ interests (if any) in contracts of significance to the Group’s business are set out in note 31 to the financial statements.
Substantial shareholdingsAs at 1 May 2012 the Company was aware of the following holdings representing 3% or more in its issued common shares:
Number of common shares held as at 1 May
2012
Percentage of voting rights and
issued shares
Marwyn Value Investors L.P. 75,424,894 38.6%Employee Benefit Trust 7,510,286 3.8%Capital Research and Mgt 7,456,282 3.8%Slater Investments 7,425,428 3.8%Darren Throop 6,240,562 3.3%
Creditor payment policyThe Group’s policy is to agree terms of payment prior to commencing trade with a supplier and to abide by those terms on the timely submission of satisfactory invoices. Trade creditors of the Group at 31 March 2012 were equivalent to 81 days’ purchases (31 March 2011: 84 days’), based on the average daily amount invoiced by suppliers during the year.
Charitable donationsThe Group made charitable donations of £0.2 million in the year (2011: £0.2 million).
Corporate responsibility The Group has an open, honest and responsible approach towards its stakeholders which include employees, suppliers, customers, investors and the wider community. Ethical and responsible practices and a commitment to minimise our impact on the environment are key motivators behind the Group’s corporate responsibility framework. Further details on the Group’s approach to such matters are set out in the Corporate Responsibility section on pages 32 to 33.

Entertainment One Ltd.Corporate Governance
35
Annual Report & Accounts 2012
Disabled employeesApplications for employment by disabled persons are always fully considered, bearing in mind the aptitudes of the applicant concerned. In the event of members of staff becoming disabled every effort is made to ensure that their employment with the Group continues and that appropriate training is arranged. It is the policy of the Group that the training, career development and promotion of disabled persons should, as far as possible, be identical to that of other employees.
Going concernThe directors continue to adopt the going concern basis in preparing the Annual Report and Accounts. Further details are set out in note 2 to the financial statements.
AuditorsA resolution to reappoint Deloitte LLP as auditors will be proposed at the forthcoming Annual General Meeting.
Annual General MeetingThe Annual General Meeting of the Company will be held in September 2012, notice of such meeting will be sent under separate cover.
By order of the Board
Giles WillitsChief Financial Officer and Company Secretary
28 May 2012

Entertainment One Ltd.Corporate Governance
36
entertainmentonegroup.com
Remuneration CommitteeThe Remuneration Committee is chaired by Clare Copeland, and also includes James Corsellis and Garth Girvan. It is formally constituted with written terms of reference and meets at least twice a year.
The Remuneration Committee reviews the performance of executive directors and sets the scale and structure of their remuneration and the basis of their service agreements with due regard to the interests of shareholders. To ensure that the Company’s remuneration practices are market competitive, the Committee takes advice from various independent sources.
The Board determines the remuneration of the non-executive directors with the support of external professional advice if required. No director participates in any discussion regarding his or her own remuneration.
Policy on executive directors’ remunerationThe policy of the Board is to provide executive remuneration packages designed to attract, motivate, reward and retain executive directors. The aim of the Group’s remuneration policy is to ensure that these key executives are appropriately rewarded for their individual contributions to the Group’s performance, commensurate with their duties and responsibilities.
The Remuneration Committee believes that shareholders’ interests are best served by providing executives with remuneration packages which have a significant emphasis on performance related pay, through long-term share incentive schemes. The Board considers that packages of this nature are consistent with prevailing practice and are necessary to retain and reward executives of the calibre the Group requires.
The main components of executive directors’ remuneration, which can be mirrored with senior executives, are basic salary, annual performance related bonus and long-term incentive plans.
Basic annual salaryEach executive director’s basic salary is reviewed annually by the Committee. In deciding upon appropriate levels of remuneration the Committee believes that the Company should offer levels of base pay that reflect individual responsibilities compared to similar jobs in comparable companies.
Annual bonus paymentsThe Committee establishes personal and financial targets at the beginning of the year which must be met for an annual cash bonus to be paid. The executive bonus scheme normally has the following principal features: (i) the potential bonus opportunity is restricted to 100% of basic salary; (ii) 70% of the bonus opportunity is determined by reference to stretching profit targets, with the remaining 30% being determined by reference to clear objectives set for each executive director. For the year ended 31 March 2012, executive directors earned a bonus of 100% of basic salary.
Directors’ Remuneration Report
Long-term incentive plansThe Company operates a number of employee share option schemes (note 33 to the financial statements) and the Committee has responsibility for supervising the schemes and the grant of share options under these schemes.
Executive Share Plan (“ESP”)Under the ESP share-based awards are made to selected employees of the Group. Awards take the form of options to acquire a certain number of Common Shares at a particular time in the future, subject to certain conditions, including performance targets.
Employee Benefit Trust (“EBT”)The EBT provides for share awards to be made for the benefit of selected UK employees of the Group, subject to certain performance conditions. Any common shares required to fulfil entitlements under the EBT are provided by the Treasury Shares.
Management Participation Scheme (“MPS”)The MPS was implemented on 31 March 2010 for the executive directors. Under the MPS, participants are only rewarded if shareholder value is created, thereby aligning the interests of the participants directly with those of shareholders. The executive directors have subscribed for shares in a subsidiary of the Company that are exchangeable for common shares of an equivalent value upon satisfaction of certain conditions. The exchange for Common Shares under the MPS is conditional, amongst other things, on the performance of the Company’s share price exceeding a compound annual growth rate of at least 12.5%. Further details can be found in note 33.
On introduction of the MPS, no further grants of options to the executive directors have been made under the ESP or EBT.
Out-performance incentive planThe Company also has an out-performance incentive plan that allocates up to £5 million in total to an incentive pool to be paid to executive directors in the future, conditional on the sale of the Company for no less than £2.25 per share or the Company’s share price reaching £2.25 per share.
Additional benefitsAdditional benefits include provision of a car allowance, medical and life insurance and a pension allowance based on basic salary.
Outside directorshipsNo executive director may accept a non-executive directorship without prior approval of the Board to ensure they do not give rise to a conflict of interest. Patrice Theroux is non-executive director and chairman of the Canadian Association of Film Distributors and Exporters. He does not receive any fee for this directorship.
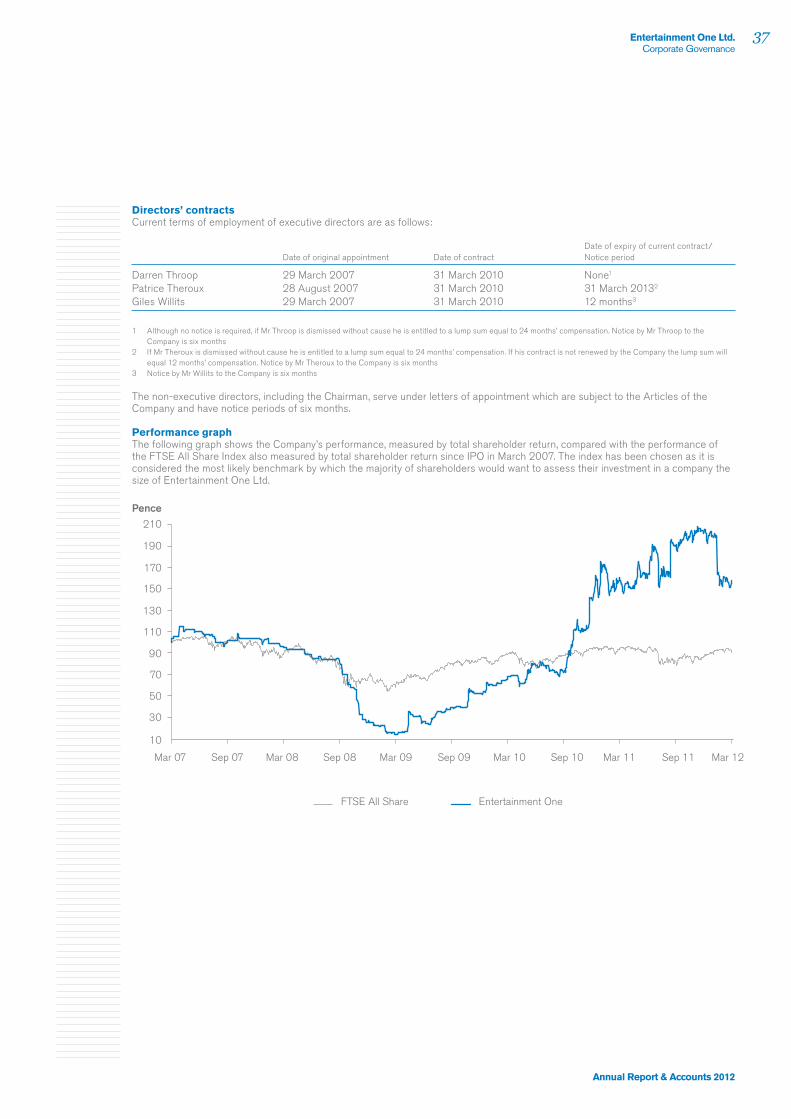
Entertainment One Ltd.Corporate Governance
37
Annual Report & Accounts 2012
210
Pence
170
190
150
130
110
90
70
50
30
10
Mar 07 Sep 07 Mar 08 Sep 08 Mar 09 Sep 09 Mar 10 Sep 10 Mar 11 Sep 11 Mar 12
FTSE All Share Entertainment One
Directors’ contracts Current terms of employment of executive directors are as follows:
Date of original appointment Date of contractDate of expiry of current contract/Notice period
Darren Throop 29 March 2007 31 March 2010 None1
Patrice Theroux 28 August 2007 31 March 2010 31 March 20132
Giles Willits 29 March 2007 31 March 2010 12 months3
1 Although no notice is required, if Mr Throop is dismissed without cause he is entitled to a lump sum equal to 24 months’ compensation. Notice by Mr Throop to the Company is six months
2 If Mr Theroux is dismissed without cause he is entitled to a lump sum equal to 24 months’ compensation. If his contract is not renewed by the Company the lump sum will equal 12 months’ compensation. Notice by Mr Theroux to the Company is six months
3 Notice by Mr Willits to the Company is six months
The non-executive directors, including the Chairman, serve under letters of appointment which are subject to the Articles of the Company and have notice periods of six months.
Performance graph The following graph shows the Company’s performance, measured by total shareholder return, compared with the performance of the FTSE All Share Index also measured by total shareholder return since IPO in March 2007. The index has been chosen as it is considered the most likely benchmark by which the majority of shareholders would want to assess their investment in a company the size of Entertainment One Ltd.

Entertainment One Ltd.Corporate Governance
38
entertainmentonegroup.com
Directors’ emolumentsThe remuneration of each of the directors for the year ended 31 March 2012 is set out as follows:
Salary and fees
£000Bonus
£000
Additional benefits
£000Total £000
2011 £000
ExecutiveDarren Throop1 431 431 37 899 853Patrice Theroux1 398 398 16 812 1,105Giles Willits 289 289 69 647 613Non-executiveJames Corsellis (Chairman) 69 – – 69 60Clare Copeland (Senior Independent Director) 66 – – 66 44Bob Allan 54 – – 54 42Ronald Atkey2 57 – – 57 18Sir George Bain3 – – – – 22Garth Girvan 57 – – 57 40Robert Lantos 57 – – 57 40Mark Opzoomer 35 – – 35 35Mark Watts 35 – – 35 35
Total 1,548 1,118 122 2,788 2,907
1 Canadian executive director remuneration has been translated at the CAD:GBP rate 1.5844 (2011: 1.5823)2 Appointed 12 November 20103 Resigned 12 November 2010
Salary and fees shown above include fees paid in respect of duties as directors. Other benefits relate mainly to the provision of company cars, pension allowances and private medical insurance. The basic fee for a non-executive director based in the UK was £35,000 pa and for Canadian based directors C$75,000 pa. Additional fees are payable to the Chairmen of Committees (other than the Chairman of the Company), to the Senior Independent Director and members of the Special Committee.
Directors’ interests in long-term incentive plansThe interests in long-term incentive plans of the current executive directors at 31 March 2012 were as follows. There were no grants during the year.
Executive Share Plan and Employee Benefit Trust
Executive Director Scheme
Number of shares at
31 March 2012
Number of shares at
31 March 2011
Darren Throop Executive Share Plan 825,000 2,278,744 Patrice Theroux Executive Share Plan 825,000 2,278,744 Giles Willits Employee Benefit Trust 2,125,744 2,125,744
Total executive share awards 3,775,744 6,683,232
Grants under the ESP and EBT are fully vested. The closing market price of the Company’s common shares at 31 March 2012 was £1.58 and the range during the year was £1.46 to £2.09. The exercise price of the ESP is £0.01 and there is no exercise price on the EBT. On 27 March 2012 Darren Throop and Patrice Theroux each exercised 1,453,744 ESP options prior to their lapse date of 29 March 2012.
Management Participation Scheme
Executive Director Scheme
Number of shares at
31 March 2012
Number of shares at
31 March 2011
Darren Throop Management Participation Scheme 3,163,039 1,863,152 Patrice Theroux Management Participation Scheme 2,779,640 1,637,316 Giles Willits Management Participation Scheme 1,725,294 1,016,265
Total executive share awards 7,667,973 4,516,733
If the vesting and growth conditions had been met at 31 March 2012 the total number of awards outstanding but not yet exercisable based on the average share price for the year of £1.78 would be as per the table above. Using the closing share price at 31 March 2012 of £1.58 the total award would be 6,845,510.
Directors’ Remuneration Report continued
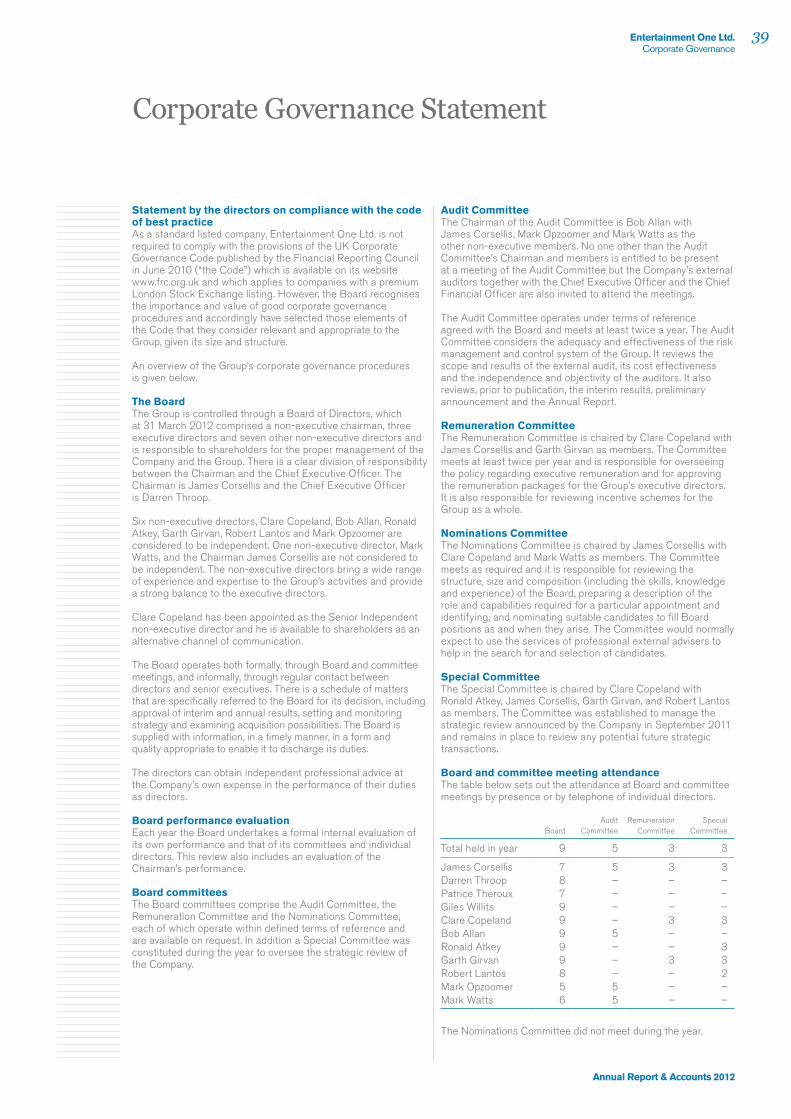
Entertainment One Ltd.Corporate Governance
39
Annual Report & Accounts 2012
Corporate Governance Statement
Statement by the directors on compliance with the code of best practiceAs a standard listed company, Entertainment One Ltd. is not required to comply with the provisions of the UK Corporate Governance Code published by the Financial Reporting Council in June 2010 (“the Code”) which is available on its website www.frc.org.uk and which applies to companies with a premium London Stock Exchange listing. However, the Board recognises the importance and value of good corporate governance procedures and accordingly have selected those elements of the Code that they consider relevant and appropriate to the Group, given its size and structure.
An overview of the Group’s corporate governance procedures is given below.
The BoardThe Group is controlled through a Board of Directors, which at 31 March 2012 comprised a non-executive chairman, three executive directors and seven other non-executive directors and is responsible to shareholders for the proper management of the Company and the Group. There is a clear division of responsibility between the Chairman and the Chief Executive Officer. The Chairman is James Corsellis and the Chief Executive Officer is Darren Throop.
Six non-executive directors, Clare Copeland, Bob Allan, Ronald Atkey, Garth Girvan, Robert Lantos and Mark Opzoomer are considered to be independent. One non-executive director, Mark Watts, and the Chairman James Corsellis are not considered to be independent. The non-executive directors bring a wide range of experience and expertise to the Group’s activities and provide a strong balance to the executive directors.
Clare Copeland has been appointed as the Senior Independent non-executive director and he is available to shareholders as an alternative channel of communication.
The Board operates both formally, through Board and committee meetings, and informally, through regular contact between directors and senior executives. There is a schedule of matters that are specifically referred to the Board for its decision, including approval of interim and annual results, setting and monitoring strategy and examining acquisition possibilities. The Board is supplied with information, in a timely manner, in a form and quality appropriate to enable it to discharge its duties.
The directors can obtain independent professional advice at the Company’s own expense in the performance of their duties as directors.
Board performance evaluationEach year the Board undertakes a formal internal evaluation of its own performance and that of its committees and individual directors. This review also includes an evaluation of the Chairman’s performance.
Board committeesThe Board committees comprise the Audit Committee, the Remuneration Committee and the Nominations Committee, each of which operate within defined terms of reference and are available on request. In addition a Special Committee was constituted during the year to oversee the strategic review of the Company.
Audit CommitteeThe Chairman of the Audit Committee is Bob Allan with James Corsellis, Mark Opzoomer and Mark Watts as the other non-executive members. No one other than the Audit Committee’s Chairman and members is entitled to be present at a meeting of the Audit Committee but the Company’s external auditors together with the Chief Executive Officer and the Chief Financial Officer are also invited to attend the meetings.
The Audit Committee operates under terms of reference agreed with the Board and meets at least twice a year. The Audit Committee considers the adequacy and effectiveness of the risk management and control system of the Group. It reviews the scope and results of the external audit, its cost effectiveness and the independence and objectivity of the auditors. It also reviews, prior to publication, the interim results, preliminary announcement and the Annual Report.
Remuneration CommitteeThe Remuneration Committee is chaired by Clare Copeland with James Corsellis and Garth Girvan as members. The Committee meets at least twice per year and is responsible for overseeing the policy regarding executive remuneration and for approving the remuneration packages for the Group’s executive directors. It is also responsible for reviewing incentive schemes for the Group as a whole.
Nominations CommitteeThe Nominations Committee is chaired by James Corsellis with Clare Copeland and Mark Watts as members. The Committee meets as required and it is responsible for reviewing the structure, size and composition (including the skills, knowledge and experience) of the Board, preparing a description of the role and capabilities required for a particular appointment and identifying, and nominating suitable candidates to fill Board positions as and when they arise. The Committee would normally expect to use the services of professional external advisers to help in the search for and selection of candidates.
Special CommitteeThe Special Committee is chaired by Clare Copeland with Ronald Atkey, James Corsellis, Garth Girvan, and Robert Lantos as members. The Committee was established to manage the strategic review announced by the Company in September 2011 and remains in place to review any potential future strategic transactions.
Board and committee meeting attendanceThe table below sets out the attendance at Board and committee meetings by presence or by telephone of individual directors.
BoardAudit
CommitteeRemuneration
CommitteeSpecial
Committee
Total held in year 9 5 3 3
James Corsellis 7 5 3 3Darren Throop 8 – – –Patrice Theroux 7 – – –Giles Willits 9 – – –Clare Copeland 9 – 3 3Bob Allan 9 5 – –Ronald Atkey 9 – – 3Garth Girvan 9 – 3 3Robert Lantos 8 – – 2Mark Opzoomer 5 5 – –Mark Watts 6 5 – –
The Nominations Committee did not meet during the year.

Entertainment One Ltd.Corporate Governance
40
entertainmentonegroup.com
Corporate Governance Statement continued
Shareholder communicationThe Board is committed to maintaining good communications with shareholders. The executive directors maintain a regular dialogue with analysts and institutional shareholders to discuss the Company’s performance and future prospects. This includes presentations of the preliminary and interim results.
The Board is informed on a regular basis of key shareholder issues, including share price performance, the composition of the shareholder register and analyst expectations.
The Company responds formally to all queries and requests for information from existing and prospective shareholders. In addition, the Company seeks to regularly update shareholders through stock exchange announcements and wider press releases on its activities. It publishes regular trading updates as well as a full Annual Report.
The Annual General Meeting will provide an opportunity for shareholders to address questions to the Chairman or the Board directly. Shareholders can access further information on the Group via the Company’s website at www.entertainmentonegroup.com.
Risk management and internal controlsThe directors are responsible for the Group’s system of internal control and for reviewing its effectiveness whilst the role of management is to implement Board policies on risk management and control. It should be recognised that the Group’s system of internal control is designed to manage, rather than eliminate, the risk of failure to achieve the Group’s business objectives and can only provide reasonable, and not absolute, assurance against material misstatement or loss.
The Group operates a series of controls to meet its needs. These controls include, but are not limited to, a clearly defined organisational structure, written policies, a comprehensive annual strategic planning and budgeting process and detailed monthly reporting.
The annual budget is approved by the Board as part of its normal responsibilities. In addition, the budget figures are regularly re-forecast to facilitate the Board’s understanding of the Group’s overall position throughout the year and this re-forecasting is reported to the Board in addition to the reporting of actual results during the year.
The Audit Committee receives reports from management and the external auditors concerning the system of internal control and any material control weaknesses. Any significant risk issues are referred to the Board for consideration.
When acquisitions are made, the Group’s controls and accounting policies are implemented during the first full year of ownership.
At least annually the Board conducts a review of the effectiveness of the Group’s system of internal controls, covering all material controls, including financial, operational and compliance controls and risk management systems. To assist with this the Board appoints a firm of external consultants to undertake a number of specific reviews and report back to the Audit Committee in the process making recommendations to help strengthen the risk management framework and internal control processes within the Group.
The Board has considered the need for an internal audit function, but has concluded that at this stage in the Group’s development the internal control systems in place including use of external consultants are appropriate for the size and complexity of the Group.
The independence and objectivity of the external auditors is considered on a regular basis, with particular regard to non-audit fees. The split between audit and non-audit fees for the year under review appears in note 4 to the financial statements. The external auditors have in place processes to ensure their independence is maintained including safeguards to ensure that where they provide non-audit services their independence is not threatened. In this context, the Audit Committee considers that it is appropriate for the external auditors to provide tax advice and other accounting services to the Group, including those in connection with supporting and reporting on financial representations in public documentation and due diligence on acquisitions.
Compliance with the CodeAt 31 March 2012, the Group complies with the principles set out in the Code, other than the following matters:
■ the Chairman, James Corsellis, is not an independent director, due to his relationship with Marwyn as further outlined in note 31;
■ the Nominations Committee comprises James Corsellis, Mark Watts and Clare Copeland. Neither James Corsellis nor Mark Watts are considered to be independent directors due to their relationships with Marwyn and accordingly the Nominations Committee does not comprise a majority of independent non-executive directors. In addition, James Corsellis is a member of the Remuneration Committee but is not considered independent;
■ the Code recommends that directors should have notice periods of one year or less. Darren Throop and Patrice Theroux have notice periods in excess of one year; and
■ shareholders are not required to approve new or long-term incentive schemes or significant changes to existing schemes.

Entertainment One Ltd.Corporate Governance
41
Annual Report & Accounts 2012
Directors’ Responsibility Statement
The directors are responsible for preparing the Annual Report and the financial statements in accordance with applicable law and regulations.
Directors are required to prepare the Group financial statements in accordance with International Financial Reporting Standards (“IFRSs”) as adopted by the European Union and Article 4 of the IAS Regulation. The directors must not approve the accounts unless they are satisfied that they give a true and fair view of the state of affairs of the Group and of the profit or loss of the Group for that period. In preparing these financial statements, International Accounting Standard 1 requires that directors:
■ properly select and apply accounting policies; ■ present information, including accounting policies, in a
manner that provides relevant, reliable, comparable and understandable information;
■ provide additional disclosures when compliance with the specific requirements in IFRSs are insufficient to enable users to understand the impact of particular transactions, other events and conditions on the entity’s financial position and financial performance; and
■ make an assessment of the Group’s ability to continue as a going concern.
The directors are responsible for keeping adequate accounting records that are sufficient to show and explain the Group’s transactions and disclose with reasonable accuracy at any time the financial position of the Group. They are also responsible for safeguarding the assets of the Group and hence for taking reasonable steps for the prevention and detection of fraud and other irregularities.
The directors are responsible for the maintenance and integrity of the corporate and financial information included on the Group’s website. Legislation in the United Kingdom governing the preparation and dissemination of financial statements may differ from legislation in other jurisdictions.
Responsibility statement We confirm that to the best of our knowledge:
■ the financial statements, prepared in accordance with IFRSs as adopted by the European Union, give a true and fair view of the assets, liabilities, financial position and profit or loss of the Group as a whole; and
■ the management report, which is incorporated into the directors’ report, includes a fair review of the development and performance of the business and the position of the Group, together with a description of the principal risks and uncertainties that they face.
By order of the Board
Giles WillitsChief Financial Officer
28 May 2012
Entertainment One Ltd.Financial Statements
42
entertainmentonegroup.com
We have audited the financial statements of Entertainment One Ltd. for the year ended 31 March 2012 which comprise the Consolidated Income Statement, the Consolidated Statement of Comprehensive Income, the Consolidated Balance Sheet, the Consolidated Cash Flow Statement, the Consolidated Statement of Changes in Equity and the related notes 1 to 35. The financial reporting framework that has been applied in their preparation is applicable law and International Financial Reporting Standards (“IFRSs”) as adopted by the European Union.
This report is made solely to the Company’s members, as a body, in accordance with Disclosure and Transparency Rule 4.1. Our audit work has been undertaken so that we might state to the Company’s members those matters we are required to state to them in an auditor’s report and for no other purpose. To the fullest extent permitted by law, we do not accept or assume responsibility to anyone other than the Company and the Company’s members as a body, for our audit work, for this report, or for the opinions we have formed.
Respective responsibilities of directors and auditorAs explained more fully in the Directors’ Responsibilities Statement, the directors are responsible for the preparation of the financial statements and for being satisfied that they give a true and fair view. Our responsibility is to audit and express an opinion on the financial statements in accordance with applicable law and International Standards on Auditing (UK and Ireland). Those standards require us to comply with the Auditing Practices Board’s Ethical Standards for Auditors.
Independent Auditors’ ReportTo the Members of Entertainment One Ltd.
Scope of the audit of the financial statementsAn audit involves obtaining evidence about the amounts and disclosures in the financial statements sufficient to give reasonable assurance that the financial statements are free from material misstatement, whether caused by fraud or error. This includes an assessment of: whether the accounting policies are appropriate to the Group’s and the Parent Company’s circumstances and have been consistently applied and adequately disclosed; the reasonableness of significant accounting estimates made by the directors; and the overall presentation of the financial statements. In addition, we read all the financial and non-financial information in the annual report to identify material inconsistencies with the audited financial statements. If we become aware of any apparent material misstatements or inconsistencies we consider the implications for our report.
Opinion on financial statementsIn our opinion:
■ the financial statements give a true and fair view of the state of the Group’s affairs as at 31 March 2012 and of the Group’s profit for the year then ended; and
■ the Group financial statements have been properly prepared in accordance with IFRSs as adopted by the European Union.
Deloitte LLPChartered Accountants and Statutory AuditorsLondon, United Kingdom
28 May 2012

Entertainment One Ltd.Financial Statements
43
Annual Report & Accounts 2012
Notes
Year ended 31 March 2012
£m
Year ended 31 March 2011
£m
Continuing operationsRevenue 3 502.7 469.7Cost of sales (378.5) (357.6)
Gross profit 124.2 112.1Administrative expenses (94.7) (91.8)
Operating profit 4 29.5 20.3
Analysed as:Underlying EBITDA 52.6 42.5Amortisation of intangible assets 12, 13 (16.4) (15.3)Depreciation 14 (1.5) (1.7)Share-based payment charge 33 (1.4) (2.5)One-off items 5 (3.8) (2.7)
29.5 20.3
Finance income 6 0.7 0.7Finance costs 6 (7.1) (9.6)
Profit before tax 23.1 11.4Income tax charge 7 (6.9) (4.0)
Profit for the year from continuing operations 16.2 7.4Loss for the year from discontinued operations 8 – (3.8)
Profit for the year attributable to equity holders of the Parent Company 16.2 3.6
Continuing earnings per share (pence)Basic 11 8.8 4.5Diluted 11 7.8 4.1
Earnings per share (pence)Basic 11 8.8 2.2Diluted 11 7.8 2.0
Consolidated Income StatementFor the year ended 31 March 2012
Consolidated Statement of Comprehensive IncomeFor the year ended 31 March 2012
Year ended 31 March 2012
£m
Year ended 31 March 2011
£m
Profit for the year 16.2 3.6Exchange differences on foreign operations (3.7) (1.9)Fair value movements on cash flow hedges 0.5 (0.1)Reclassification adjustments for movements on cash flow hedges (0.3) (1.2)Tax related to components of other comprehensive income – 0.3
Total comprehensive income for the year attributable to equity holders of the Parent Company 12.7 0.7
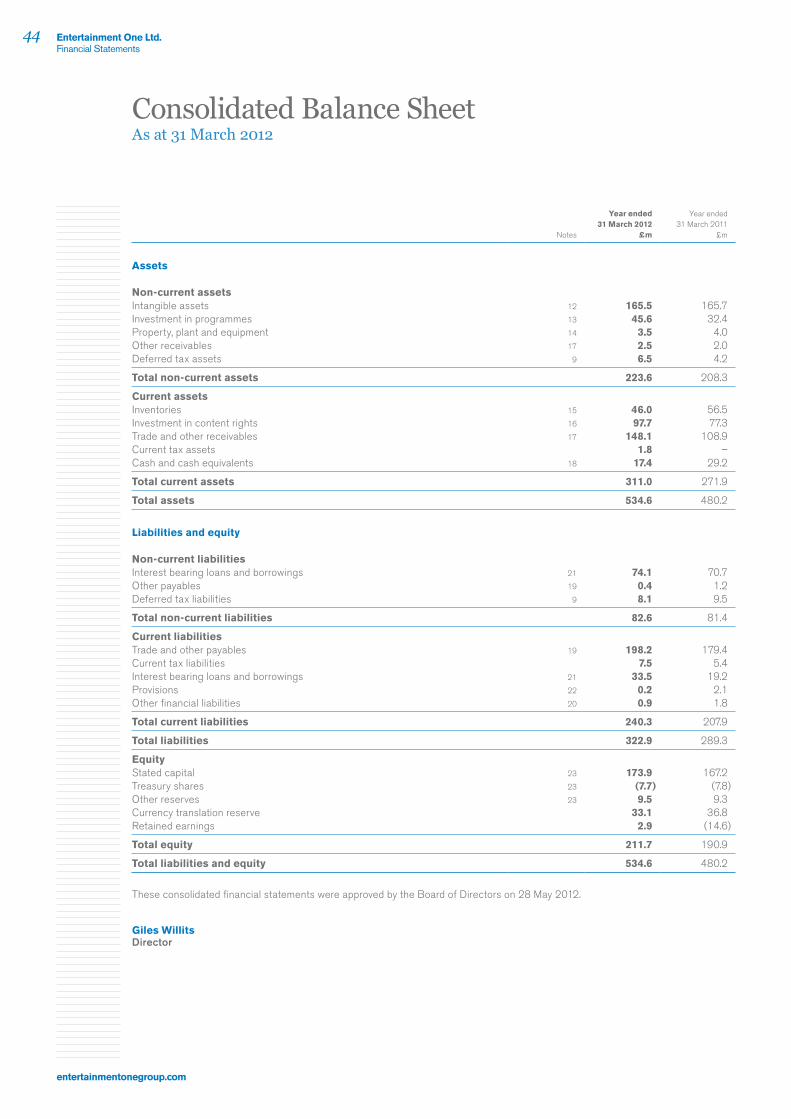
Entertainment One Ltd.Financial Statements
44
entertainmentonegroup.com
Notes
Year ended 31 March 2012
£m
Year ended 31 March 2011
£m
Assets
Non-current assetsIntangible assets 12 165.5 165.7Investment in programmes 13 45.6 32.4Property, plant and equipment 14 3.5 4.0Other receivables 17 2.5 2.0Deferred tax assets 9 6.5 4.2
Total non-current assets 223.6 208.3
Current assetsInventories 15 46.0 56.5Investment in content rights 16 97.7 77.3Trade and other receivables 17 148.1 108.9Current tax assets 1.8 –Cash and cash equivalents 18 17.4 29.2
Total current assets 311.0 271.9
Total assets 534.6 480.2
Liabilities and equity
Non-current liabilitiesInterest bearing loans and borrowings 21 74.1 70.7Other payables 19 0.4 1.2Deferred tax liabilities 9 8.1 9.5
Total non-current liabilities 82.6 81.4
Current liabilitiesTrade and other payables 19 198.2 179.4Current tax liabilities 7.5 5.4Interest bearing loans and borrowings 21 33.5 19.2Provisions 22 0.2 2.1Other financial liabilities 20 0.9 1.8
Total current liabilities 240.3 207.9
Total liabilities 322.9 289.3
EquityStated capital 23 173.9 167.2Treasury shares 23 (7.7) (7.8)Other reserves 23 9.5 9.3Currency translation reserve 33.1 36.8Retained earnings 2.9 (14.6)
Total equity 211.7 190.9
Total liabilities and equity 534.6 480.2
These consolidated financial statements were approved by the Board of Directors on 28 May 2012.
Giles WillitsDirector
Consolidated Balance SheetAs at 31 March 2012

Entertainment One Ltd.Financial Statements
45
Annual Report & Accounts 2012
Notes
Year ended 31 March 2012
£m
Year ended 31 March 2011
£m
Operating activitiesOperating profit – continuing operations 29.5 20.3Operating loss – discontinued operations – (5.4)
Operating profit – total Group 29.5 14.9Adjustments for:Depreciation 14 1.5 1.7Amortisation of other intangible assets 12 16.0 14.9Amortisation of content rights 16 51.8 43.0Amortisation of television programmes 13 46.3 31.4Foreign exchange movements 0.1 (0.5)Share-based payment charge 33 1.4 2.5Loss on disposal of property, plant and equipment – 0.4Decrease/(increase) in inventories 9.7 (9.0)(Increase)/decrease in trade and other receivables (27.3) 6.9Increase in trade and other payables 7.3 1.2(Decrease)/increase in provisions (1.9) 1.6
Net cash inflow from trading activities 134.4 109.0Income tax paid (10.3) (4.1)
Net cash from operating activities 124.1 104.9
Investing activitiesAcquisition of subsidiaries 24 (6.3) (3.1)Investment in content rights (64.4) (52.4)Investment in television programmes (net of grants received) (71.4) (38.9)Purchases of property, plant and equipment 14 (0.8) (1.0)Purchases of intangible software assets (1.2) (0.6)
Net cash used in investing activities (144.1) (96.0)
Financing activitiesProceeds on issue of shares (net of costs) – 16.3Increase in interest bearing loans and borrowings 53.5 63.8Repayment of interest bearing loans and borrowings (64.1) (71.3)Net drawdown/(repayment) of production financing 24.8 (1.6)Interest paid (5.7) (5.2)
Net cash from financing activities 8.5 2.0
Net (decrease)/increase in cash and cash equivalents (11.5) 10.9Cash and cash equivalents at beginning of the year 29.2 18.6Effects of exchange rate fluctuations on cash held (0.3) (0.3)
Cash and cash equivalents at end of year 18 17.4 29.2
Consolidated Cash Flow StatementFor the year ended 31 March 2012
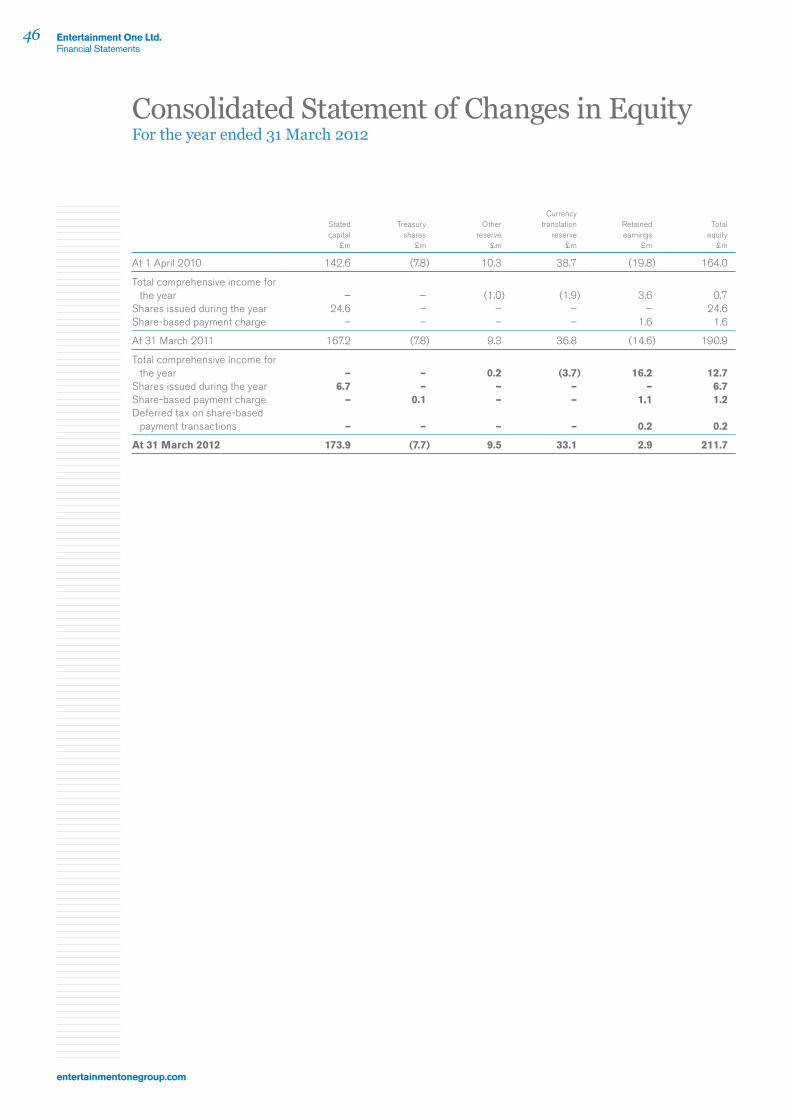
Entertainment One Ltd.Financial Statements
46
entertainmentonegroup.com
Stated capital
£m
Treasury shares
£m
Other reserve
£m
Currency translation
reserve £m
Retained earnings
£m
Total equity
£m
At 1 April 2010 142.6 (7.8) 10.3 38.7 (19.8) 164.0
Total comprehensive income for the year – – (1.0) (1.9) 3.6 0.7
Shares issued during the year 24.6 – – – – 24.6Share-based payment charge – – – – 1.6 1.6
At 31 March 2011 167.2 (7.8) 9.3 36.8 (14.6) 190.9
Total comprehensive income for the year – – 0.2 (3.7) 16.2 12.7
Shares issued during the year 6.7 – – – – 6.7Share-based payment charge – 0.1 – – 1.1 1.2Deferred tax on share-based
payment transactions – – – – 0.2 0.2
At 31 March 2012 173.9 (7.7) 9.5 33.1 2.9 211.7
Consolidated Statement of Changes in EquityFor the year ended 31 March 2012
Entertainment One Ltd.Financial Statements
47
Annual Report & Accounts 2012
1. Nature of operations and general informationEntertainment One Ltd. and subsidiaries (“the Group”) is a leading independent entertainment group focused on the acquisition, production and distribution of film and television content rights across all media throughout the world. Entertainment One Ltd. is the Group’s ultimate Parent Company and is incorporated and domiciled in Canada. The Company has a standard listing on the London Stock Exchange. Segmental information is disclosed in note 3.
Entertainment One Ltd. presents its consolidated financial statements in Pounds Sterling (£), which is also the functional currency of the Parent Company. These consolidated financial statements were approved for issue by the Board of Directors on 28 May 2012.
2. Accounting policiesBasis of presentationThe financial statements have been prepared under the historical cost convention, on the going concern basis and in accordance with applicable International Financial Reporting Standards as adopted by the EU and IFRIC interpretations (“IFRS”). The Group financial statements comply with Article 4 of the EU IAS Regulation.
Accounting standardsAt the date of authorisation of these financial statements, the following Standards and Interpretations, which have not been applied in these financial statements, were in issue but not yet effective:
IFRS 9 – Financial Instruments (effective for annual periods beginning on or after 1 January 2015)IFRS10 – Consolidated Financial Statements (effective for annual periods beginning on or after 1 January 2013)IFRS11 – Joint Arrangements (effective for annual periods beginning on or after 1 January 2013)IFRS12 – Disclosures of Interests in Other Entities (effective for annual periods beginning on or after 1 January 2013)IFRS13 – Fair Value Measurement (effective for annual periods beginning on or after 1 January 2013)IAS 27 – Separate Financial Statements (effective for annual periods beginning on or after 1 January 2013)IAS 28 – Investments in Associates and Joint Ventures (effective for annual periods beginning on or after 1 January 2013)IAS 1 (amended 2011) – Presentation of Items of Other Comprehensive Income (effective for annual periods beginning on or after 1 July 2012)IAS 19 (amended 2011) – Employee Benefits (effective for annual periods beginning on or after 1 January 2013)IFRS 7 (amended 2011) – Disclosures – Offsetting Financial Assets and Financial Liabilities (effective for annual periods beginning on or after 1 January 2013)IAS 32 (amended 2011) – Offsetting Financial Assets and Financial Liabilities (effective for annual periods beginning on or after 1 January 2014)
The Group has not adopted early the requirements of the following accounting standards and interpretations, which have an effective date after the start date of these financial statements:
IAS 12 (amended) – Deferred tax: Recovery of underlying assets (effective for annual periods beginning on or after 1 January 2012)IFRS 1 (amended 2010) – Severe Hyperinflation and Removal of Fixed Dates for First-Time Adopters (effective for annual periods beginning on or after 1 July 2011)IFRS 7 (amended) – Transfers of financial assets (effective for annual periods beginning on or after 1 July 2011)
The directors do not anticipate that the adoption of these standards and interpretations will have a material impact on the Group’s financial statements in the period of initial application.
Implementation of new accounting standardsIn the current financial year, the Group has adopted the following new accounting standards, amendments to accounting standards and interpretations, which are either mandatory for the first time for the annual period ending 31 March 2012 or have been early adopted. The following have no material impact on the Group:
Improvements to IFRSs (May 2010)IFRS 1 (amended 2010) – Limited Exemption from Comparative IFRS 7 Disclosures for First-time AdoptersIFRS 7 – Disclosures for First-time AdoptersIAS 24 (revised 2009) – Related Party DisclosuresIFRIC 14 (amended) – Prepayments of a Minimum Funding RequirementIFRIC 19 – Extinguishing Financial Liabilities with Equity Instruments
Use of additional performance measuresThe Group presents underlying EBITDA, one-off items, adjusted profit before tax and adjusted earnings per share information. These measures are used by the Group for internal performance analysis and incentive compensation arrangements for employees. The terms “one-off items”, “underlying” and “adjusted” may not be comparable with similarly titled measures reported by other companies. The term “underlying EBITDA” refers to operating profit or loss excluding operating one-off items, share-based payment charges, depreciation and amortisation of intangible assets. The terms “adjusted profit before tax” and “adjusted earnings per share” refer to the reported measures excluding operating one-off items, amortisation of intangible assets arising on acquisitions, one-off items relating to the Group’s taxation and financing arrangements and share-based payment charges.
Notes to the Financial StatementsFor the year ended 31 March 2012

Entertainment One Ltd.Financial Statements
48
entertainmentonegroup.com
2. Accounting policies continuedGoing concernThe Group’s activities, together with the factors likely to affect its future development are set out in the Business and Financial Review on pages 12 to 29.
The Group meets its day to day working capital requirements and funds its investment in content through a revolving credit facility (“Facility”) which matures in October 2014 and is secured on assets held in the Group. Under the terms of the Facility the Group is able to draw down in the local currencies of its operating businesses. The amounts drawn down by currency at 31 March 2012 are shown in note 21 to the accounts.
The Facility is subject to a series of covenants including fixed charge cover, net debt against EBITDA and capital expenditure. The Group has a track record of cash generation and is in full compliance with its existing bank facility covenant arrangements. As at 31 March 2012 the Group had £17.4 million of cash, £90.2 million of net debt and undrawn amounts under the Facility of £82.2 million.
As explained in the risks section on pages 28 to 29 the Group is exposed to uncertainties arising from the economic climate and also in the markets in which it operates. Market conditions could lead to lower than anticipated demand for the Group’s products and services and exchange rate volatility could also impact reported performance. The directors have considered the impact of these and other uncertainties and factored them into their financial forecasts and assessment of covenant headroom. The Group’s forecasts and projections, taking account of reasonable possible changes in trading performance (and available mitigating actions), show that the Group will be able to operate within the expected limits of the Facility and provide headroom against the covenants for the foreseeable future. For this reason the directors continue to adopt the going concern basis in preparing the financial statements.
Basis of consolidationThe consolidated financial statements comprise the financial statements of Entertainment One Ltd. and its subsidiaries. The financial statements of the subsidiaries are prepared for the same reporting periods as the Parent Company, using consistent accounting policies.
Subsidiaries are consolidated in accordance with the requirements of IAS 27 and are fully consolidated from the date of acquisition and continue to be consolidated until the date of disposal.
Jointly controlled entities are those entities over whose activities the Group has joint control, established by contractual agreement and are accounted for using proportional consolidation from the date that joint control commences. Contractual arrangements establish joint control over each joint venture classified as such. No single venturer is in a position to control the activity unilaterally.
All intra-group balances, transactions, income and expenses and unrealised profits and losses resulting from intra-group transactions that are recognised in assets, are eliminated in full.
GoodwillGoodwill represents the excess of the cost of acquisition over the fair value of the Group’s share of the net identifiable assets of the acquired subsidiary at the date of acquisition.
Goodwill is stated at cost less any accumulated impairment losses. Goodwill is allocated to cash generating units (“CGUs”) which are tested for impairment annually or more frequently if there are indications that goodwill might be impaired. The CGUs identified are the smallest identifiable group of assets that generate cash inflows that are largely independent of the cash inflows from other groups of assets. Gains or losses on the disposal of an entity include the carrying amount of goodwill relating to the entity sold.
Investment in programmesInvestment in programmes that are in development and for which the realisation of expenditure can be reasonably determined, are classified and capitalised in accordance with IAS 38 “Intangible assets” as productions in progress within investment in programmes. On completion of production the cost of investment is reclassified as investment in programmes. Also included within investment in programmes are programmes acquired on acquisition of subsidiaries.
Amortisation of investment in programmes, including government grants credited, is charged to cost of sales unless it arises from revaluation on acquisition of subsidiaries in which case it is charged to administrative expenses. The maximum useful life is considered to be 10 years.
Borrowing costsBorrowing costs directly attributable to the acquisition or production of a qualifying asset (such as investment in programmes) form part of the cost of that asset and are capitalised.
Government grantsA government grant is recognised and credited as part of investment in programmes when there is reasonable assurance that any conditions attached to the grant will be satisfied and the grants will be received and programme has been delivered. Government grants are recognised at fair value.
Other intangible assetsOther intangible assets acquired by the Group are stated at cost less accumulated amortisation. Amortisation is charged to administrative expenses in the income statement on a straight-line basis over the estimated useful life of intangible fixed assets unless such lives are indefinite.
Other intangible assets mainly comprise amounts arising on consolidation of acquired subsidiaries such as exclusive content agreements and libraries, customer relationships, exclusive distribution rights, brands and trade names and non-compete agreements. They also include amounts arising in relation to costs of software.
Notes to the Financial Statements continuedFor the year ended 31 March 2012
Entertainment One Ltd.Financial Statements
49
Annual Report & Accounts 2012
2. Accounting policies continuedOther intangible assets are generally amortised over the following periods:Exclusive content agreements and libraries 5 to 20 years depending on nature and life of the rights acquiredCustomer relationships 10 yearsExclusive distribution rights 5 yearsBrands and trade names 10 yearsNon-compete agreements 3 yearsSoftware 3 years
Property, plant and equipmentProperty, plant and equipment are stated at original cost less accumulated depreciation. Depreciation is charged to write off cost less estimated residual value of each asset over their estimated useful lives using the following methods and rates:
Leasehold improvements Over the term of the leaseFixtures, fittings and equipment 20%–30% reducing balance
The assets’ residual values and useful lives are reviewed, and adjusted if appropriate, at each balance sheet date. The gain or loss arising on the disposal or retirement of an asset is determined as the difference between the sales proceeds and the carrying amount of the asset and is recognised in income.
Impairment of assetsThe Group reviews the carrying amounts of its property, plant and equipment and intangible assets annually to determine whether there is any indication that those assets have suffered an impairment loss. If any such indication exists, the recoverable amount of the asset is estimated in order to determine the extent of the impairment loss (if any). Where the asset does not generate cash flows that are independent from other assets, the Group estimates the recoverable amount of the CGU to which the asset belongs.
Investment in content rightsInvestments in content rights are capitalised in the balance sheet if such amounts are considered recoverable against future revenues. These costs are amortised to cost of sales on a revenue forecast basis over a period not exceeding 10 years from the date of initial release. Acquired libraries are amortised over a period not exceeding 20 years. Amounts capitalised are reviewed at least quarterly and any portion of the unamortised amount that appears not to be recoverable from future revenues is written off to cost of sales during the period the loss becomes evident. Balances are included within current assets if they are expected to be realised within the normal operating cycle of the business. The normal operating cycle of the business can be greater than 12 months. In general 75% of film content is amortised within 12 months of theatrical release.
In the ordinary course of business the Group contracts with film producers to acquire rights to exploit films. Certain of these agreements require the Group to pay Minimum Guaranteed advances (“MGs”), the largest portion of which often becomes due when the film is received by the Group, usually some months subsequent to signing the contract. MGs are recognised in the balance sheet when a liability arises, usually on delivery of the film to the Group.
InventoriesInventories are valued at the lower of cost (including direct expenditure and other appropriate attributable costs incurred in bringing inventories to their present location and condition) and net realisable value. Cost is calculated using the weighted average method.
Financial instrumentsFinancial assets and financial liabilities are recognised on the Group’s balance sheet when the Group becomes a party to the contractual provisions of the instrument.
Trade and other receivablesTrade receivables are generally not interest bearing and are stated at their fair value as reduced by appropriate allowances for estimated irrecoverable amounts.
Trade and other payablesTrade payables are generally not interest bearing and are stated at their fair value.
Derivative financial instruments and hedgingThe Group uses derivative financial instruments to reduce its exposure to foreign exchange and interest rate movements. The Group does not hold or issue derivative financial instruments for financial trading purposes.
Derivative financial instruments are classified as held-for-trading and recognised in the balance sheet at fair value. Derivatives designated as hedging instruments are classified on inception as cash flow hedges, net investment hedges or fair value hedges.
Changes in the fair value of derivatives designated as cash flow hedges are recognised in equity to the extent that they are deemed effective. Ineffective portions are immediately recognised in the income statement. When the hedged item affects profit or loss then the amounts deferred in equity are recycled to the income statement.
For net investment hedges, to the extent that movements in the fair values of these instruments effectively offset the underlying risk being hedged, they are recognised in the translation reserve until the period during which a foreign operation is disposed of or partially disposed of, at which point the cumulative gain or loss is recognised in the income statement, offsetting the cumulative difference recognised on the translation of the net investment.

Entertainment One Ltd.Financial Statements
50
entertainmentonegroup.com
2. Accounting policies continuedFair value hedges record the change in the fair value in the income statement, along with the changes in the fair value of the hedged asset or liability.
Changes in the fair value of any derivative instruments that do not qualify for hedge accounting are immediately recognised in the income statement.
Embedded derivativesDerivatives embedded in other financial instruments or other host contracts are treated as separate derivatives when their risks and characteristics are not closely related to those of the host contracts and the host contracts are not measured at fair value with changes in fair value recognised in profit or loss.
Equity instrumentsEquity instruments issued by the Company are recorded at the proceeds received, net of direct issue costs.
Treasury sharesThe Entertainment One Ltd. shares held in the Employee Benefit Trust are classified in shareholders’ equity as “treasury shares” and are recognised at cost. Consideration received for the sale of such shares is also recognised in equity, with any difference between the proceeds from sale and the original cost being taken to revenue reserves. No gain or loss is recognised on the purchase, sale, issue or cancellation of equity shares.
Interest bearing loans and borrowingsAll interest bearing loans and borrowings are initially recognised at the fair value of the consideration received less directly attributable transaction costs. After initial recognition, interest bearing loans and borrowings are subsequently measured at amortised cost using the effective interest method. Gains and losses are recognised in the income statement when the liabilities are derecognised as well as through the amortisation process.
Interim production financing relates to short-term financing for the Group’s television productions. Interest payable on interim production financing loans is capitalised and forms part of the cost of production of investment in programmes.
Cash and cash equivalentsCash and cash equivalents includes cash in hand, deposits held at call with banks, other short-term highly liquid investments with original maturities of three months or less and bank overdrafts. Bank overdrafts are shown within borrowings in current liabilities on the balance sheet.
ProvisionsProvisions are recognised when the Group has a present obligation (legal or constructive) as a result of a past event and it is probable that an outflow of resources embodying economic benefits will be required to settle the obligation and a reliable estimate can be made of the amount of this obligation. The expense relating to any provision is presented in the income statement.
If the effect of the time value of money is material, provisions are discounted using a current pre-tax rate that reflects, where appropriate, the risks specific to the liability. Where discounting is used, the increase in the provision due to the passage of time is recognised as a finance cost.
Operating leasesRentals payable under operating leases are charged to income on a straight-line basis over the term of the relevant lease.
Share-based paymentsThe Group issues equity-settled and cash-settled share-based payments to certain employees.
Equity-settled share-based payments are measured at fair value at the date of grant. The fair value determined at the grant date of equity-settled share-based payments is expensed on a straight-line basis over the vesting period, based on the Group’s estimate of shares that will eventually vest. Fair value is measured by means of a binomial valuation model. The expected life used in the model has been adjusted, based on management’s best estimate, for the effect of non-transferability, exercise restrictions, and behavioural considerations.
For cash-settled share-based payments a liability equal to the portion of the goods or services received is recognised at the current fair value determined at each balance sheet date.
Segmental reportingThe Group’s operating segments are identified on the basis of internal reports that are regularly reviewed by the chief operating decision maker in order to allocate resources to the segment and to assess its performance. The Chief Executive Officer has been identified as the chief operating decision maker. The Group has two reportable segments: Entertainment and Distribution, based on the types of products and services from which each segment derives its revenues.
Notes to the Financial Statements continuedFor the year ended 31 March 2012

Entertainment One Ltd.Financial Statements
51
Annual Report & Accounts 2012
2. Accounting policies continuedRevenue recognitionRevenue represents the amounts receivable for goods and services provided in the normal course of business, net of discounts and excluding value added tax (or equivalent). Revenue is derived from the licensing, marketing and distribution of feature films, television, video programming and music rights. Revenue is also derived from television production and licensing and merchandising sales.
■ Revenue from the exploitation of film and music rights is recognised based upon the contractual terms of each agreement. Revenue is recognised where there is reasonable contractual certainty that the revenue is receivable and will be received.
■ Revenue from television licensing represents the contracted value of licence fees which is recognised when the licence term has commenced, the production is available for delivery, substantially all technical requirements have been met and collection of the fee is reasonably assured.
■ Revenue from the sale of own or co-produced television productions is recognised when the production is available for delivery and there is reasonable contractual certainty that the revenue is receivable and will be received.
■ Revenue from the sale of DVD, video and audio inventory is recognised at the point at which goods are despatched. A provision is made for returns based on historical trends.
■ Revenue from licensing and merchandising sales represents the contracted value of licence fees which is recognised when the licence terms have commenced and collection of the fee is reasonably assured.
Pension costsPayments to defined contribution retirement benefit plans are charged as an expense as they fall due.
Foreign currenciesThe individual financial statements of each Group company are presented in the currency of the primary economic environment in which it operates (its functional currency). For the purpose of the consolidated financial statements, the results and financial position of each Group company are expressed in Pounds Sterling, which is the functional currency of the Company and the presentation currency for the consolidated financial statements.
In preparing the financial statements of the individual companies, transactions in currencies other than the entity’s functional currency (foreign currencies) are recorded at the rates of exchange prevailing on the dates of the transactions. Foreign exchange differences arising on the settlement of such transactions and from translating monetary assets and liabilities denominated in foreign currencies at year end exchange rates are recognised in the income statement.
For the purpose of presenting consolidated financial statements, the assets and liabilities of the Group’s foreign operations are translated at exchange rates prevailing on the balance sheet date. Income and expense items are translated at average exchange rates for the period. Foreign exchange differences arising, if any, are classified as equity and transferred to the Group’s translation reserve. Such translation differences are recognised as income or expenses in the period in which the operation is disposed of.
TaxationIncome tax expense represents the sum of the tax currently payable and deferred tax.
The tax currently payable is based on taxable profit for the year. Taxable profit differs from profit as reported in the income statement because it excludes items of income or expense that are taxable or deductible in other years and it further excludes items that are never taxable or deductible. The Group’s liability for current tax is calculated using tax rates that have been enacted or substantively enacted by the balance sheet date.
Deferred tax is the tax expected to be payable or recoverable on differences between the carrying amounts of assets and liabilities in the financial statements and the corresponding tax bases used in the computation of taxable profit, and is accounted for using the balance sheet liability method. Deferred tax liabilities are generally recognised for all taxable temporary differences and deferred tax assets are recognised to the extent that it is probable that taxable profits will be available against which deductible temporary differences can be utilised. Such assets and liabilities are not recognised if the temporary difference arises from the initial recognition of goodwill or from the initial recognition (other than in a business combination) of other assets and liabilities in a transaction that affects neither the tax profit nor the accounting profit.
Deferred tax liabilities are recognised for taxable temporary differences arising on investments in subsidiaries, except where the Group is able to control the reversal of the temporary difference and it is probable that the temporary difference will not reverse in the foreseeable future.
The carrying amount of deferred tax assets is reviewed at each balance sheet date and reduced to the extent that it is no longer probable that sufficient taxable profits will be available to allow all or part of the asset to be recovered. Deferred tax is calculated at the tax rates that are expected to apply in the period when the liability is settled or the asset is realised. Deferred tax is charged or credited in the income statement, except when it relates to items charged or credited directly to equity, in which case the deferred tax is also dealt within equity. The Group’s liability for deferred tax is calculated using tax rates that have been enacted or substantively enacted by the balance sheet date.
Deferred tax assets and liabilities are offset when there is a legally enforceable right to offset current tax assets against current tax liabilities. This applies when they relate to income taxes levied by the same taxation authority and the Group intends to settle its current tax assets and liabilities on a net basis.

Entertainment One Ltd.Financial Statements
52
entertainmentonegroup.com
2. Accounting policies continuedSignificant judgements and estimatesThe preparation of consolidated financial statements under IFRS requires the Group to make estimates and assumptions that affect the application of policies and reported amounts. Estimates and judgements are continually evaluated and are based on historical experience and other factors including expectations of future events that are believed to be reasonable under the circumstances. Actual results may differ from these estimates. The estimates and assumptions which have a significant risk of causing a material adjustment to the carrying amount of assets and liabilities are discussed below.
Intangible assetsThe Group recognises intangible assets acquired as part of business combinations at fair value at the date of acquisition. The determination of these fair values is based upon management’s judgement and includes assumptions on the timing and amount of future incremental cash flows generated by the assets and selection of an appropriate cost of capital. Furthermore, management must estimate the expected useful lives of intangible assets and charge amortisation on these assets accordingly.
Impairment of goodwillThe Group is required to test, at least annually, whether goodwill has suffered any impairment. The recoverable amount is determined based on value in use calculations. The use of this method requires the estimation of future cash flows and the choice of a suitable discount rate in order to calculate the present value of these cash flows (note 12). Actual outcomes could vary.
Investment in content rightsThe Group capitalises investment in content rights and amortises to cost of sales on a revenue forecast basis. Amounts capitalised are reviewed at least quarterly and any that appear to be irrecoverable from future revenues are written off to cost of sales during the period the loss becomes evident.
The estimate of future revenues depends on management judgement and assumptions based on the pattern of historical revenue streams and the remaining life of each contract.
Share-based paymentsThe charge for share-based payments is determined based on the fair value of awards at the date of grant by use of the binomial model which require judgements to be made regarding expected volatility, dividend yield, risk free rates of return and expected option lives. The list of inputs used in the binomial model to calculate the fair values is provided in note 33.
Deferred taxDeferred tax assets and liabilities require management’s judgement in determining the amounts to be recognised. In particular, judgement is used when assessing the extent to which deferred tax assets should be recognised with consideration to the timing and level of future taxable income.
Income taxThe actual tax on the result for the year is determined according to complex tax laws and regulations. Where the effect of these laws and regulations is unclear, estimates are used in determining the liability for tax to be paid on past profits which are recognised in the financial statements. The Group considers the estimates, assumptions and judgements to be reasonable but this can involve complex issues which may take a number of years to resolve. The final determination of prior year tax liabilities could be different from the estimates reflected in the financial statements.
3. Segmental analysisOperating segmentsFor internal reporting and management purposes, the Group is currently organised into two main reportable segments based on the types of products and services from which each segment derives its revenue – Entertainment and Distribution. These divisions are the basis on which the Group reports its operating segment information.
The types of products and services from which each reportable segment derives its revenues are as follows:
Entertainment – the acquisition and exploitation of filmed entertainment and music rights across all media and the production of television content.
Distribution – the ownership of physical distribution channels to retailers in territories and media where the Group can capture additional margin and improve delivery of products to consumers.
Notes to the Financial Statements continuedFor the year ended 31 March 2012

Entertainment One Ltd.Financial Statements
53
Annual Report & Accounts 2012
3. Segmental analysis continuedSegment information for the year ended 31 March 2012 is presented below on a continuing basis only. Inter-segment sales are charged at prevailing market prices.
Entertainment £m
Distribution £m
Eliminations £m
Consolidated £m
Segment revenuesExternal sales 313.0 189.7 – 502.7Inter-segment sales 47.5 0.1 (47.6) –
Total segment revenues 360.5 189.8 (47.6) 502.7
Segment resultsSegment underlying EBITDA 50.4 6.5 0.1 57.0Group costs (4.4)
Underlying EBITDA 52.6Depreciation and amortisation (17.9)Share-based payment charge (1.4)One-off items (3.8)
Operating profit 29.5Finance income 0.7Finance costs (7.1)
Profit before tax 23.1Tax (6.9)
Profit after tax from continuing operations 16.2
Profit for the year attributable to equity holders of the Parent Company 16.2
Segment assetsTotal segment assets 392.8 140.2 (0.4) 532.6Unallocated corporate assets 2.0
Consolidated total assets 534.6
Segment information for the year ended 31 March 2011 is presented below on a continuing basis only. Inter-segment sales are charged at prevailing market prices.
Entertainment £m
Distribution £m
Eliminations £m
Consolidated £m
Segment revenuesExternal sales 251.3 218.4 – 469.7Inter-segment sales 46.7 8.9 (55.6) –
Total segment revenues 298.0 227.3 (55.6) 469.7
Segment resultsSegment underlying EBITDA 34.1 13.0 0.1 47.2Group costs (4.7)
Underlying EBITDA 42.5Depreciation and amortisation (17.0)Share-based payment charge (2.5)One-off items (2.7)
Operating profit 20.3Finance income 0.7Finance costs (9.6)
Profit before tax 11.4Tax (4.0)
Profit after tax from continuing operations 7.4Loss for the year from discontinued operations (3.8)
Profit for the year attributable to equity holders of the Parent Company 3.6
Segment assetsTotal segment assets 317.1 164.4 (2.8) 478.7Unallocated corporate assets 1.5
Consolidated total assets 480.2
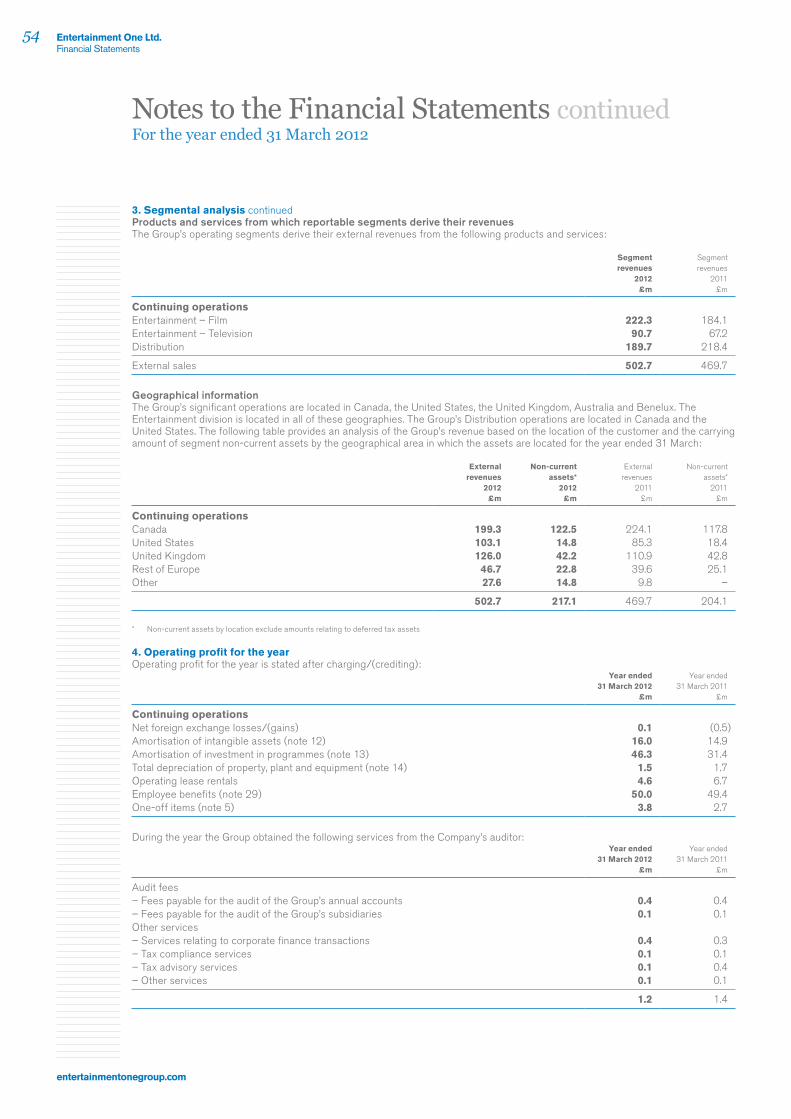
Entertainment One Ltd.Financial Statements
54
entertainmentonegroup.com
3. Segmental analysis continuedProducts and services from which reportable segments derive their revenuesThe Group’s operating segments derive their external revenues from the following products and services:
Segment revenues
2012 £m
Segment revenues
2011 £m
Continuing operationsEntertainment – Film 222.3 184.1Entertainment – Television 90.7 67.2Distribution 189.7 218.4
External sales 502.7 469.7
Geographical informationThe Group’s significant operations are located in Canada, the United States, the United Kingdom, Australia and Benelux. The Entertainment division is located in all of these geographies. The Group’s Distribution operations are located in Canada and the United States. The following table provides an analysis of the Group’s revenue based on the location of the customer and the carrying amount of segment non-current assets by the geographical area in which the assets are located for the year ended 31 March:
External revenues
2012 £m
Non-current assets*
2012 £m
External revenues
2011 £m
Non-current assets*
2011 £m
Continuing operationsCanada 199.3 122.5 224.1 117.8United States 103.1 14.8 85.3 18.4United Kingdom 126.0 42.2 110.9 42.8Rest of Europe 46.7 22.8 39.6 25.1Other 27.6 14.8 9.8 –
502.7 217.1 469.7 204.1
* Non-current assets by location exclude amounts relating to deferred tax assets
4. Operating profit for the yearOperating profit for the year is stated after charging/(crediting):
Year ended 31 March 2012
£m
Year ended 31 March 2011
£m
Continuing operationsNet foreign exchange losses/(gains) 0.1 (0.5)Amortisation of intangible assets (note 12) 16.0 14.9Amortisation of investment in programmes (note 13) 46.3 31.4Total depreciation of property, plant and equipment (note 14) 1.5 1.7Operating lease rentals 4.6 6.7Employee benefits (note 29) 50.0 49.4One-off items (note 5) 3.8 2.7
During the year the Group obtained the following services from the Company’s auditor:Year ended
31 March 2012 £m
Year ended 31 March 2011
£m
Audit fees– Fees payable for the audit of the Group’s annual accounts 0.4 0.4– Fees payable for the audit of the Group’s subsidiaries 0.1 0.1Other services– Services relating to corporate finance transactions 0.4 0.3– Tax compliance services 0.1 0.1– Tax advisory services 0.1 0.4– Other services 0.1 0.1
1.2 1.4
Notes to the Financial Statements continuedFor the year ended 31 March 2012

Entertainment One Ltd.Financial Statements
55
Annual Report & Accounts 2012
5. One-off itemsOne-off items are items of income and expenditure that are non-recurring and, in the judgement of management, should be disclosed separately on the basis that they are material, either by their nature or their size, to provide a further understanding of the Group’s financial performance and enable comparison of financial performance between periods. Items of income or expense that are considered by management for designation as one-off are as follows:
Notes
Year ended 31 March 2012
£m
Year ended 31 March 2011
£m
Strategic review (a) 3.1 –Acquisition-related costs (b) 0.7 0.8Other (c) – 1.9
3.8 2.7
(a) Strategic reviewDuring the year the Company undertook a strategic review including consideration of a sale of the business. Amounts incurred comprised legal and corporate advisory costs.
(b) Acquisition-related costsAcquisition-related costs in the current year include the final costs of acquiring the Hopscotch group of companies (“Hopscotch”) further detailed in note 24. Amounts in the financial year ended 31 March 2011 mainly relate to the initial costs of acquiring Hopscotch.
(c) OtherOther one-off items in the prior year comprised the final restructuring costs incurred as part of the step up to a standard listing on the Main Market of the London Stock Exchange and concurrent corporate reorganisation.
The tax impact of one-off items was £0.8 million (2011: £0.4 million).
6. Finance income and finance costsFinance income and finance costs comprise:
Notes
Year ended 31 March 2012
£m
Year ended 31 March 2011
£m
Finance incomeGain in fair value of derivative instruments (note 20) (a) 0.7 0.7
0.7 0.7
Finance costsInterest expense arising on bank loans and overdrafts (5.2) (5.5)Amortisation of deferred finance charges (1.7) (1.8)Net foreign exchange losses (0.2) –Interest expense arising on exchangeable notes – (0.5)Loss on exercise of exchangeable notes option (a) – (1.8)
(7.1) (9.6)
Net finance charges (6.4) (8.9)
(a) Items excluded from the calculation of adjusted earnings after tax in note 11
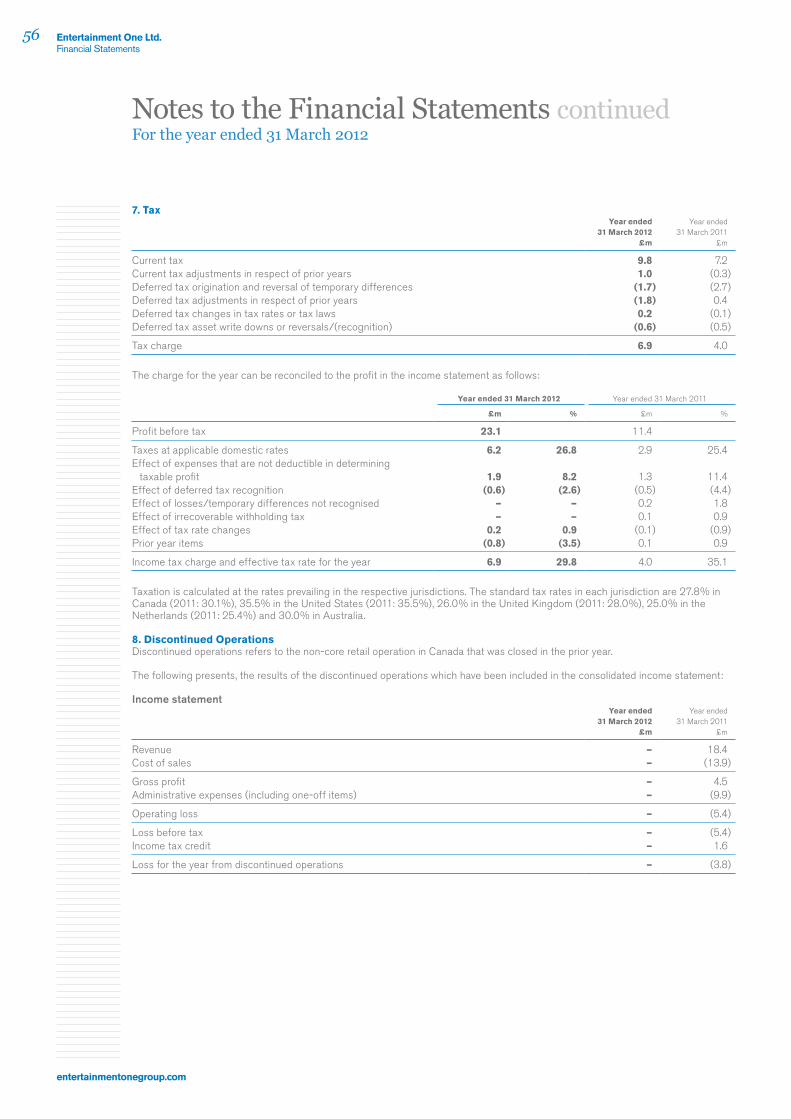
Entertainment One Ltd.Financial Statements
56
entertainmentonegroup.com
7. TaxYear ended
31 March 2012 £m
Year ended 31 March 2011
£m
Current tax 9.8 7.2Current tax adjustments in respect of prior years 1.0 (0.3)Deferred tax origination and reversal of temporary differences (1.7) (2.7)Deferred tax adjustments in respect of prior years (1.8) 0.4Deferred tax changes in tax rates or tax laws 0.2 (0.1)Deferred tax asset write downs or reversals/(recognition) (0.6) (0.5)
Tax charge 6.9 4.0
The charge for the year can be reconciled to the profit in the income statement as follows:
Year ended 31 March 2012 Year ended 31 March 2011
£m % £m %
Profit before tax 23.1 11.4
Taxes at applicable domestic rates 6.2 26.8 2.9 25.4Effect of expenses that are not deductible in determining
taxable profit 1.9 8.2 1.3 11.4Effect of deferred tax recognition (0.6) (2.6) (0.5) (4.4)Effect of losses/temporary differences not recognised – – 0.2 1.8Effect of irrecoverable withholding tax – – 0.1 0.9Effect of tax rate changes 0.2 0.9 (0.1) (0.9)Prior year items (0.8) (3.5) 0.1 0.9
Income tax charge and effective tax rate for the year 6.9 29.8 4.0 35.1
Taxation is calculated at the rates prevailing in the respective jurisdictions. The standard tax rates in each jurisdiction are 27.8% in Canada (2011: 30.1%), 35.5% in the United States (2011: 35.5%), 26.0% in the United Kingdom (2011: 28.0%), 25.0% in the Netherlands (2011: 25.4%) and 30.0% in Australia.
8. Discontinued OperationsDiscontinued operations refers to the non-core retail operation in Canada that was closed in the prior year.
The following presents, the results of the discontinued operations which have been included in the consolidated income statement:
Income statementYear ended
31 March 2012 £m
Year ended 31 March 2011
£m
Revenue – 18.4Cost of sales – (13.9)
Gross profit – 4.5Administrative expenses (including one-off items) – (9.9)
Operating loss – (5.4)
Loss before tax – (5.4)Income tax credit – 1.6
Loss for the year from discontinued operations – (3.8)
Notes to the Financial Statements continuedFor the year ended 31 March 2012
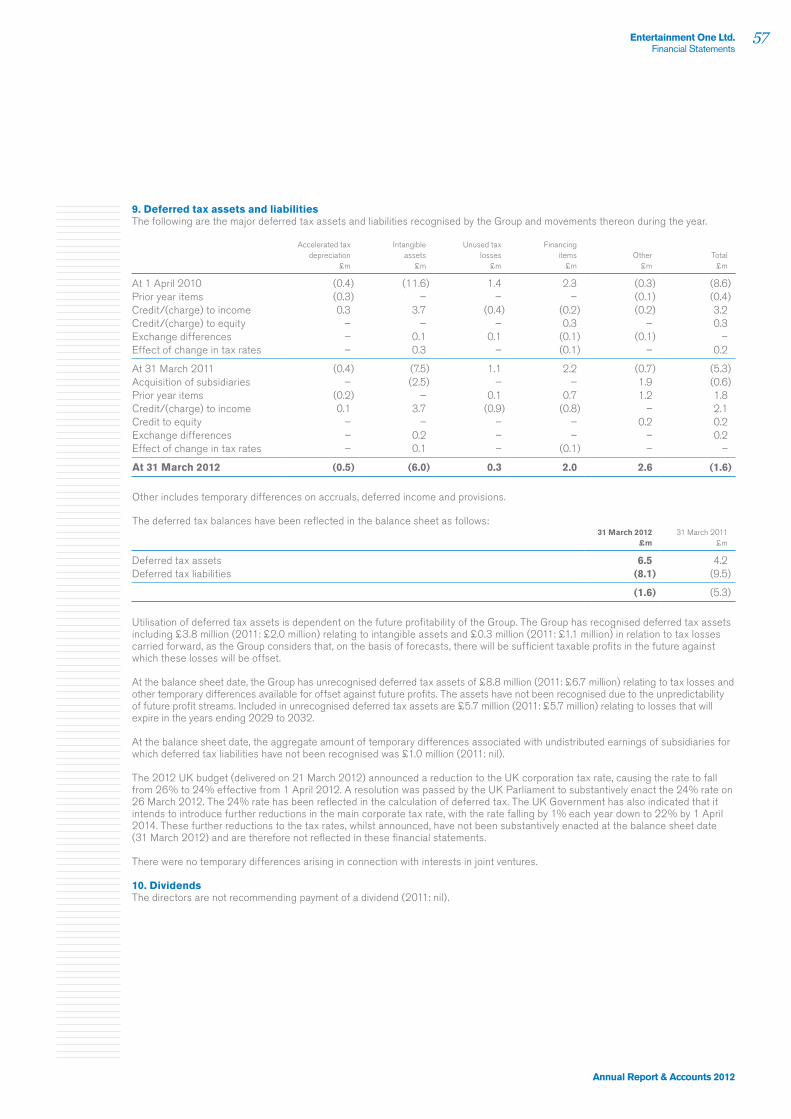
Entertainment One Ltd.Financial Statements
57
Annual Report & Accounts 2012
9. Deferred tax assets and liabilitiesThe following are the major deferred tax assets and liabilities recognised by the Group and movements thereon during the year.
Accelerated tax depreciation
£m
Intangible assets
£m
Unused tax losses
£m
Financing items
£mOther
£mTotal
£m
At 1 April 2010 (0.4) (11.6) 1.4 2.3 (0.3) (8.6)Prior year items (0.3) – – – (0.1) (0.4)Credit/(charge) to income 0.3 3.7 (0.4) (0.2) (0.2) 3.2Credit/(charge) to equity – – – 0.3 – 0.3Exchange differences – 0.1 0.1 (0.1) (0.1) –Effect of change in tax rates – 0.3 – (0.1) – 0.2
At 31 March 2011 (0.4) (7.5) 1.1 2.2 (0.7) (5.3)Acquisition of subsidiaries – (2.5) – – 1.9 (0.6)Prior year items (0.2) – 0.1 0.7 1.2 1.8Credit/(charge) to income 0.1 3.7 (0.9) (0.8) – 2.1Credit to equity – – – – 0.2 0.2Exchange differences – 0.2 – – – 0.2Effect of change in tax rates – 0.1 – (0.1) – –
At 31 March 2012 (0.5) (6.0) 0.3 2.0 2.6 (1.6)
Other includes temporary differences on accruals, deferred income and provisions.
The deferred tax balances have been reflected in the balance sheet as follows:31 March 2012
£m31 March 2011
£m
Deferred tax assets 6.5 4.2Deferred tax liabilities (8.1) (9.5)
(1.6) (5.3)
Utilisation of deferred tax assets is dependent on the future profitability of the Group. The Group has recognised deferred tax assets including £3.8 million (2011: £2.0 million) relating to intangible assets and £0.3 million (2011: £1.1 million) in relation to tax losses carried forward, as the Group considers that, on the basis of forecasts, there will be sufficient taxable profits in the future against which these losses will be offset.
At the balance sheet date, the Group has unrecognised deferred tax assets of £8.8 million (2011: £6.7 million) relating to tax losses and other temporary differences available for offset against future profits. The assets have not been recognised due to the unpredictability of future profit streams. Included in unrecognised deferred tax assets are £5.7 million (2011: £5.7 million) relating to losses that will expire in the years ending 2029 to 2032.
At the balance sheet date, the aggregate amount of temporary differences associated with undistributed earnings of subsidiaries for which deferred tax liabilities have not been recognised was £1.0 million (2011: nil).
The 2012 UK budget (delivered on 21 March 2012) announced a reduction to the UK corporation tax rate, causing the rate to fall from 26% to 24% effective from 1 April 2012. A resolution was passed by the UK Parliament to substantively enact the 24% rate on 26 March 2012. The 24% rate has been reflected in the calculation of deferred tax. The UK Government has also indicated that it intends to introduce further reductions in the main corporate tax rate, with the rate falling by 1% each year down to 22% by 1 April 2014. These further reductions to the tax rates, whilst announced, have not been substantively enacted at the balance sheet date (31 March 2012) and are therefore not reflected in these financial statements.
There were no temporary differences arising in connection with interests in joint ventures.
10. DividendsThe directors are not recommending payment of a dividend (2011: nil).

Entertainment One Ltd.Financial Statements
58
entertainmentonegroup.com
11. Earnings per share
Continuing operations31 March 2012
Pence31 March 2011
Pence
Basic earnings per share 8.8 4.5Diluted earnings per share 7.8 4.1Adjusted basic earnings per share 17.3 14.3Adjusted diluted earnings per share 15.4 13.0
Total operations
Basic earnings per share 8.8 2.2Diluted earnings per share 7.8 2.0
Basic earnings per share has been calculated by dividing the earnings attributable to shareholders by the weighted average number of shares in issue during the year, after deducting Treasury shares.
The adjusted basic earnings per share calculation is based on the basic earnings per share calculation after allowing for adjusted items. It is shown in order to highlight the underlying performance of the Group.
Diluted and adjusted diluted earnings per share have been calculated after adjusting the weighted average number of shares used in the basic and adjusted basic calculation to assume the conversion of all potentially dilutive shares.
Reconciliations of the profit and loss used in the basic and diluted earnings calculations to profit and loss used in the adjusted earnings per share calculations are set out below.
Continuing operations31 March 2012
£m31 March 2011
£m
For basic and diluted earnings per shareProfit for the financial year 16.2 7.4
For adjusted basic and diluted earnings per shareProfit for the financial year 16.2 7.4Add back:One-off items 3.8 2.7Amortisation of acquired intangibles 15.4 14.6Share-based payment charge 1.4 2.5Financing net fair value movements (0.7) (0.7)One-off financing movements – 1.8Direct tax effect of above items (4.3) (4.8)
Adjusted earnings after tax 31.8 23.5
Weighted average number of shares in issue2012
Million2011
Million
Basic 183.8 163.9Dilution for share options 22.6 16.2
206.4 180.1
Notes to the Financial Statements continuedFor the year ended 31 March 2012
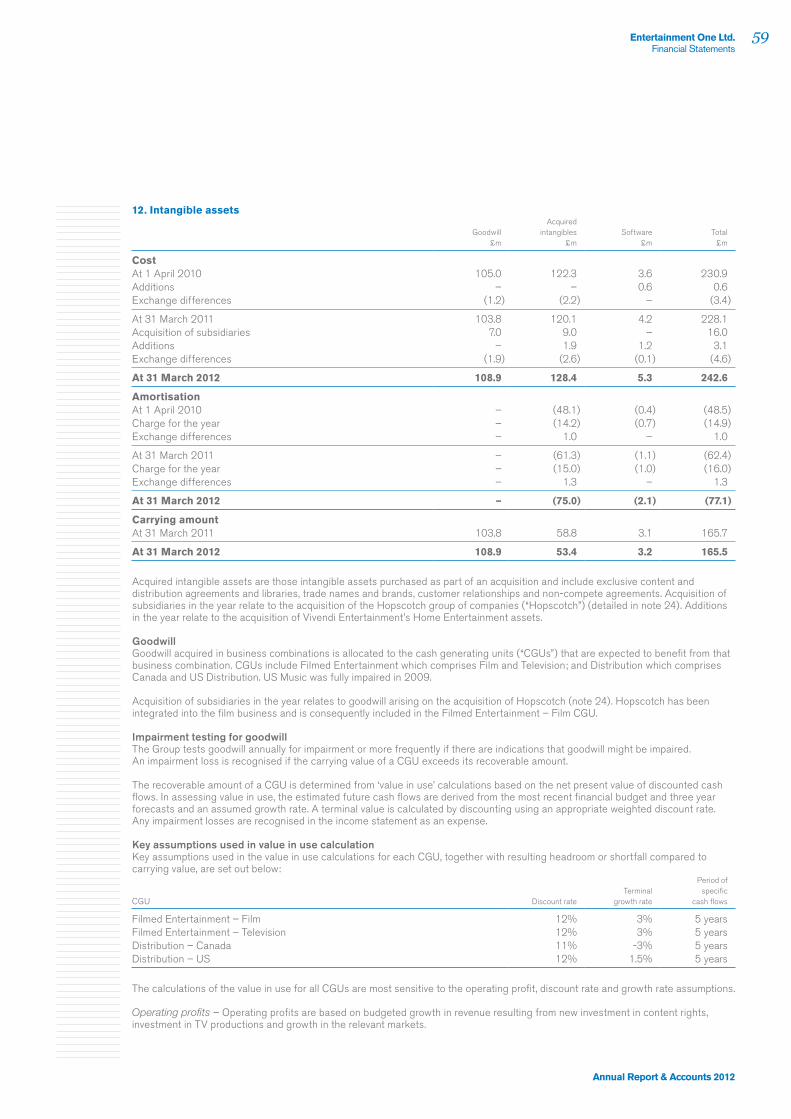
Entertainment One Ltd.Financial Statements
59
Annual Report & Accounts 2012
12. Intangible assets
Goodwill £m
Acquired intangibles
£mSoftware
£mTotal
£m
CostAt 1 April 2010 105.0 122.3 3.6 230.9Additions – – 0.6 0.6Exchange differences (1.2) (2.2) – (3.4)
At 31 March 2011 103.8 120.1 4.2 228.1Acquisition of subsidiaries 7.0 9.0 – 16.0Additions – 1.9 1.2 3.1Exchange differences (1.9) (2.6) (0.1) (4.6)
At 31 March 2012 108.9 128.4 5.3 242.6
AmortisationAt 1 April 2010 – (48.1) (0.4) (48.5)Charge for the year – (14.2) (0.7) (14.9)Exchange differences – 1.0 – 1.0
At 31 March 2011 – (61.3) (1.1) (62.4)Charge for the year – (15.0) (1.0) (16.0)Exchange differences – 1.3 – 1.3
At 31 March 2012 – (75.0) (2.1) (77.1)
Carrying amountAt 31 March 2011 103.8 58.8 3.1 165.7
At 31 March 2012 108.9 53.4 3.2 165.5
Acquired intangible assets are those intangible assets purchased as part of an acquisition and include exclusive content and distribution agreements and libraries, trade names and brands, customer relationships and non-compete agreements. Acquisition of subsidiaries in the year relate to the acquisition of the Hopscotch group of companies (“Hopscotch”) (detailed in note 24). Additions in the year relate to the acquisition of Vivendi Entertainment’s Home Entertainment assets.
GoodwillGoodwill acquired in business combinations is allocated to the cash generating units (“CGUs”) that are expected to benefit from that business combination. CGUs include Filmed Entertainment which comprises Film and Television; and Distribution which comprises Canada and US Distribution. US Music was fully impaired in 2009.
Acquisition of subsidiaries in the year relates to goodwill arising on the acquisition of Hopscotch (note 24). Hopscotch has been integrated into the film business and is consequently included in the Filmed Entertainment – Film CGU.
Impairment testing for goodwillThe Group tests goodwill annually for impairment or more frequently if there are indications that goodwill might be impaired. An impairment loss is recognised if the carrying value of a CGU exceeds its recoverable amount.
The recoverable amount of a CGU is determined from ‘value in use’ calculations based on the net present value of discounted cash flows. In assessing value in use, the estimated future cash flows are derived from the most recent financial budget and three year forecasts and an assumed growth rate. A terminal value is calculated by discounting using an appropriate weighted discount rate. Any impairment losses are recognised in the income statement as an expense.
Key assumptions used in value in use calculationKey assumptions used in the value in use calculations for each CGU, together with resulting headroom or shortfall compared to carrying value, are set out below:
CGU Discount rateTerminal
growth rate
Period of specific
cash flows
Filmed Entertainment – Film 12% 3% 5 yearsFilmed Entertainment – Television 12% 3% 5 yearsDistribution – Canada 11% -3% 5 yearsDistribution – US 12% 1.5% 5 years
The calculations of the value in use for all CGUs are most sensitive to the operating profit, discount rate and growth rate assumptions.
Operating profits – Operating profits are based on budgeted growth in revenue resulting from new investment in content rights, investment in TV productions and growth in the relevant markets.

Entertainment One Ltd.Financial Statements
60
entertainmentonegroup.com
12. Intangible assets continuedDiscount rates – A pre-tax discount rate is applied to calculate the net present value of the CGU. The pre-tax discount rate is based on the Group WACC of 11%. The discount rate is adjusted where specific country and operational risks are sufficiently significant to have a material impact on the outcome of the impairment test.
Terminal growth rate estimates – The terminal growth rates range from -3% to +3% (2011: -3% to +3%) beyond the end of year five and do not exceed the long-term projected growth rates for the relevant market.
Period of specific cash flows – Specific cash flows reflect the period of detailed forecasts prepared as part of the Group’s annual planning cycle.
The carrying value of goodwill, translated at year-end exchange rates is allocated as follows:
CGU31 March 2012
£m31 March 2011
£m
Filmed Entertainment – Film 53.3 47.2Filmed Entertainment – Television 20.6 21.1Distribution – Canada 22.4 22.9Distribution – US 12.6 12.6
108.9 103.8
Sensitivity to changes in assumptionsFilmed Entertainment. With regard to the assessment of value in use of the CGUs, the Film and Television calculations show that there is at least £60 million headroom when compared to current carrying values and consequently management believes that no reasonable change in the above key assumptions would cause the carrying value of the units to materially exceed their recoverable amount. Underlying EBITDA used in the terminal value calculations would need to decrease by more than 50% before headroom is eliminated.
Distribution – Canada. In the year to 31 March 2012 the Canada Distribution business saw profits approximately halve. Based on management’s updated forecasts, the headroom in the value in use calculation is now approximately £5 million and consequently if the underlying EBITDA used in the terminal value calculation were to reduce by more than 10% it may result in the value in use of the CGU being approximately equal to its carrying value. The discount rate used for the Distribution – Canada CGU increased from 10% to 11% in the year reflecting the increased volatility and risk in the business.
Distribution – US was impaired in March 2009 and the latest calculations show an increase in value in use at 31 March 2012. Management continues to keep the recovery in this CGU under review. Underlying EBITDA used in the terminal value calculation would need to reduce by more than 30% before a reassessment of the carrying value of goodwill would need to be carried out.
13. Investment in programmesInvestment in programmes
31 March 2012 £m
Productions in progress
31 March 2012 £m
Total 31 March 2012
£m
Total 31 March 2011
£m
CostAmounts brought forward 88.5 10.2 98.7 60.8Acquisition of subsidiaries 3.7 – 3.7 –Additions – 56.7 56.7 37.8Transfers 53.8 (53.8) – –Exchange differences (2.5) (0.1) (2.6) 0.1
Amounts carried forward 143.5 13.0 156.5 98.7
AmortisationAmounts brought forward (66.3) – (66.3) (34.8)Charge for the year (46.3) – (46.3) (31.4)Exchange differences 1.7 – 1.7 (0.1)
Amounts carried forward (110.9) – (110.9) (66.3)
Net carrying amount 32.6 13.0 45.6 32.4
Included in amortisation above is £0.4 million (2011: £0.4 million) attributable to programmes valued on acquisition of subsidiaries and charged to administrative expenses.
Borrowing costs of £1.3 million (2011: £0.7 million) on the Canadian Television interim production financing were included in the cost of investment in programmes during the year.
Notes to the Financial Statements continuedFor the year ended 31 March 2012
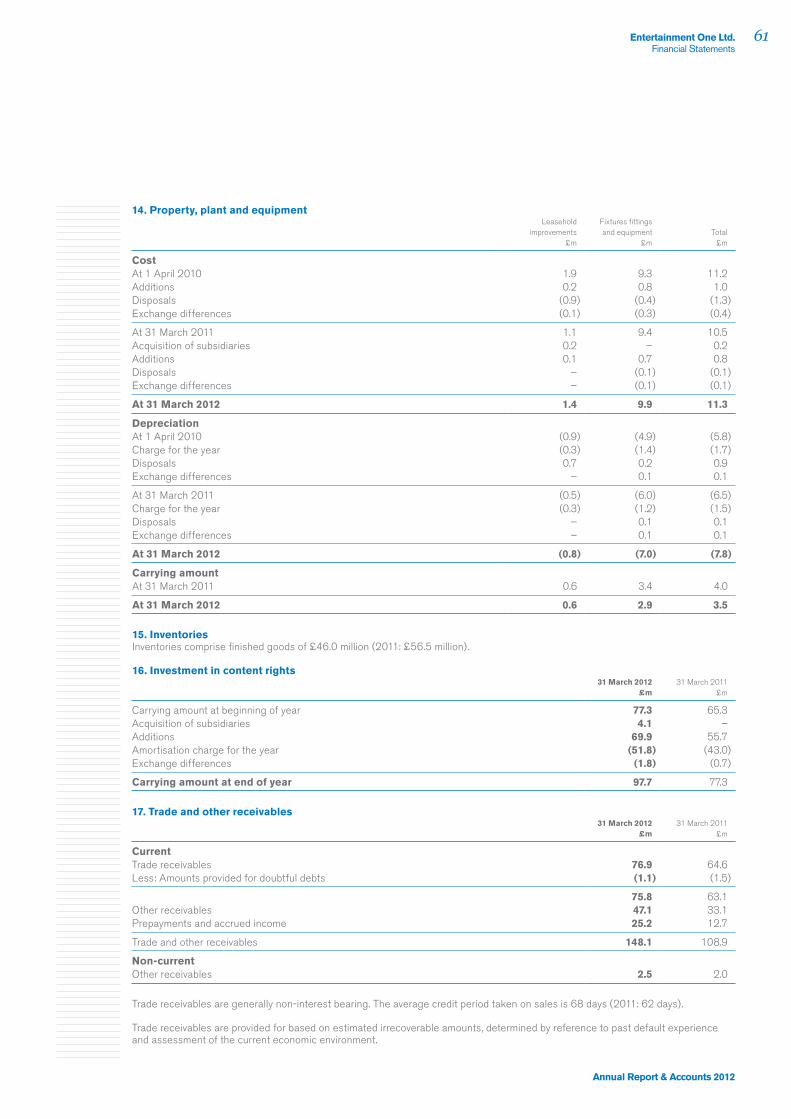
Entertainment One Ltd.Financial Statements
61
Annual Report & Accounts 2012
14. Property, plant and equipmentLeasehold
improvements £m
Fixtures fittings and equipment
£mTotal
£m
CostAt 1 April 2010 1.9 9.3 11.2Additions 0.2 0.8 1.0Disposals (0.9) (0.4) (1.3)Exchange differences (0.1) (0.3) (0.4)
At 31 March 2011 1.1 9.4 10.5Acquisition of subsidiaries 0.2 – 0.2Additions 0.1 0.7 0.8Disposals – (0.1) (0.1)Exchange differences – (0.1) (0.1)
At 31 March 2012 1.4 9.9 11.3
DepreciationAt 1 April 2010 (0.9) (4.9) (5.8)Charge for the year (0.3) (1.4) (1.7)Disposals 0.7 0.2 0.9Exchange differences – 0.1 0.1
At 31 March 2011 (0.5) (6.0) (6.5)Charge for the year (0.3) (1.2) (1.5)Disposals – 0.1 0.1Exchange differences – 0.1 0.1
At 31 March 2012 (0.8) (7.0) (7.8)
Carrying amountAt 31 March 2011 0.6 3.4 4.0
At 31 March 2012 0.6 2.9 3.5
15. InventoriesInventories comprise finished goods of £46.0 million (2011: £56.5 million).
16. Investment in content rights31 March 2012
£m31 March 2011
£m
Carrying amount at beginning of year 77.3 65.3Acquisition of subsidiaries 4.1 –Additions 69.9 55.7Amortisation charge for the year (51.8) (43.0)Exchange differences (1.8) (0.7)
Carrying amount at end of year 97.7 77.3
17. Trade and other receivables31 March 2012
£m31 March 2011
£m
CurrentTrade receivables 76.9 64.6Less: Amounts provided for doubtful debts (1.1) (1.5)
75.8 63.1Other receivables 47.1 33.1Prepayments and accrued income 25.2 12.7
Trade and other receivables 148.1 108.9
Non-currentOther receivables 2.5 2.0
Trade receivables are generally non-interest bearing. The average credit period taken on sales is 68 days (2011: 62 days).
Trade receivables are provided for based on estimated irrecoverable amounts, determined by reference to past default experience and assessment of the current economic environment.

Entertainment One Ltd.Financial Statements
62
entertainmentonegroup.com
17. Trade and other receivables continuedIncluded in the Group’s trade receivable balance are debtors with a carrying amount of £15.8 million (2011: £15.8 million) which are past due at the reporting date for which the Group has not provided as there has not been a significant change in credit quality and the amounts are still considered recoverable.
Ageing of past due but not impaired receivables:31 March 2012
£m31 March 2011
£m
Less than 60 days 10.9 9.4Between 60–90 days 1.6 2.4More than 90 days 3.3 4.0
Total 15.8 15.8
The Group does not hold any collateral over these balances.
Movement in the amounts provided for doubtful debts:31 March 2012
£m31 March 2011
£m
Balance at beginning of year (1.5) (1.4)Impairment losses recognised (0.4) (0.7)Impairment losses reversed – 0.1Amounts written off as uncollectable 0.8 0.5
Balance at end of year (1.1) (1.5)
In determining the recoverability of a trade receivable the Group considers any change to the credit quality of the trade receivable from the date credit was initially granted up to the reporting date.
Management has credit policies in place and the exposure to credit risk is monitored by individual operating divisions on an ongoing basis. The Group has no significant concentration of credit risk, with exposure spread over a large number of counterparties and customers.
Ageing of impaired receivables:31 March 2012
£m31 March 2011
£m
Less than 60 days (0.1) (0.1)Between 60–90 days – –More than 90 days (1.0) (1.4)
Total (1.1) (1.5)
Trade and other receivables are held in the following currencies as at 31 March, with those balances held in currencies other than Pounds Sterling converted at the exchange rate at the balance sheet date:
Pounds Sterling
£mEuros
£m
Canadian Dollars
£m
US Dollars
£mOther
£mTotal
£m
Current 12.7 8.8 63.9 22.9 0.6 108.9Non-current – – 1.6 0.4 – 2.0
At 31 March 2011 12.7 8.8 65.5 23.3 0.6 110.9
Current 32.1 11.9 66.4 34.9 2.8 148.1Non-current – – 2.0 0.5 – 2.5
At 31 March 2012 32.1 11.9 68.4 35.4 2.8 150.6
The directors consider that the carrying amount of trade and other receivables approximates to their fair value.
Included within other receivables is £34.1 million (2011: £20.9 million) relating to government assistance owing to the TV production businesses. During the year £10.1 million (2011: £16.0 million) in government assistance was received relating to Canadian tax credits.
Notes to the Financial Statements continuedFor the year ended 31 March 2012
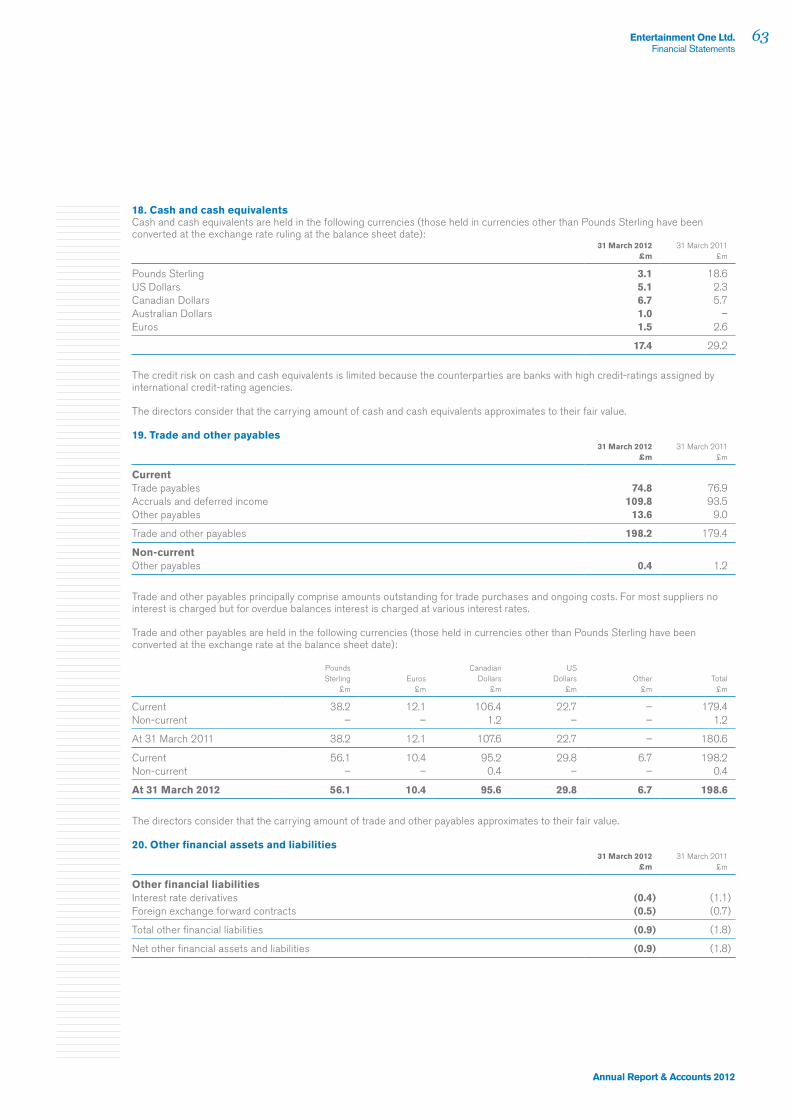
Entertainment One Ltd.Financial Statements
63
Annual Report & Accounts 2012
18. Cash and cash equivalentsCash and cash equivalents are held in the following currencies (those held in currencies other than Pounds Sterling have been converted at the exchange rate ruling at the balance sheet date):
31 March 2012 £m
31 March 2011 £m
Pounds Sterling 3.1 18.6US Dollars 5.1 2.3Canadian Dollars 6.7 5.7Australian Dollars 1.0 –Euros 1.5 2.6
17.4 29.2
The credit risk on cash and cash equivalents is limited because the counterparties are banks with high credit-ratings assigned by international credit-rating agencies.
The directors consider that the carrying amount of cash and cash equivalents approximates to their fair value.
19. Trade and other payables31 March 2012
£m31 March 2011
£m
CurrentTrade payables 74.8 76.9Accruals and deferred income 109.8 93.5Other payables 13.6 9.0
Trade and other payables 198.2 179.4
Non-currentOther payables 0.4 1.2
Trade and other payables principally comprise amounts outstanding for trade purchases and ongoing costs. For most suppliers no interest is charged but for overdue balances interest is charged at various interest rates.
Trade and other payables are held in the following currencies (those held in currencies other than Pounds Sterling have been converted at the exchange rate at the balance sheet date):
Pounds Sterling
£mEuros
£m
Canadian Dollars
£m
US Dollars
£mOther
£mTotal
£m
Current 38.2 12.1 106.4 22.7 – 179.4Non-current – – 1.2 – – 1.2
At 31 March 2011 38.2 12.1 107.6 22.7 – 180.6
Current 56.1 10.4 95.2 29.8 6.7 198.2Non-current – – 0.4 – – 0.4
At 31 March 2012 56.1 10.4 95.6 29.8 6.7 198.6
The directors consider that the carrying amount of trade and other payables approximates to their fair value.
20. Other financial assets and liabilities31 March 2012
£m31 March 2011
£m
Other financial liabilitiesInterest rate derivatives (0.4) (1.1)Foreign exchange forward contracts (0.5) (0.7)
Total other financial liabilities (0.9) (1.8)
Net other financial assets and liabilities (0.9) (1.8)

Entertainment One Ltd.Financial Statements
64
entertainmentonegroup.com
20. Other financial assets and liabilities continuedInterest rate derivativesIncluded in interest rate derivatives above, are interest rate collars (“collars”) and interest rate swaps (“swaps”) which the Group puts in place to limit interest rate risk.
The notional principal amount of the outstanding collar at 31 March 2012 was £10.0 million (2011: £10.0 million). The collar carries cap rates of 7.00% and floor rates of 4.87%. The collar incorporates a kick-in rate of 6.25% should the interest rate on the quarterly settlement dates fall below the floor rate of 4.87%. The collar is recognised at fair value which is determined using the discounted cash flow method based on market data. The marked to market value of the collar was (£0.3) million (2011: (£0.7) million).
The notional principal amounts of the outstanding swaps at 31 March 2012 were US$7.4 million, €6.9 million, £3.7 million and C$12.2 million (2011: US$8.8 million, €8.3 million, £6.4 million and C$30.5 million). The swaps carry fixed rates of 1.84%, 3.49%, 2.83% and 1.70% respectively. These swaps are recognised at fair value which is determined using the discounted cash flow method based on market data. The currency split of the marked to market values of the swaps was (£0.0) million (US Dollars), (£0.1) million (Euros), (£0.0) million (Pounds Sterling) and £0.0 million (Canadian Dollars) (2011: (£0.1) million (US Dollars), (£0.2) million (Euros), (£0.1) million (Pounds Sterling) and (£0.0) million (Canadian Dollars)).
Foreign exchange forward contractsThe Group uses forward currency contracts to hedge transactional exposures. The majority of these contracts are denominated in US Dollars and primarily cover minimum guarantee payments in Canada, the UK, Australia and Benelux. At 31 March 2012, the total notional principal amount of outstanding currency contracts was €3.1 million, C$37.7 million, A$7.2 million and £28.7 million (2011: €5.9 million, C$12.2 million, A$nil and £14.1 million).
21. Interest bearing loans and borrowings31 March 2012
£m31 March 2011
£m
Bank borrowings 57.7 67.8Interim production financing 49.9 22.1
Total borrowings 107.6 89.9
Amount due for settlement within 12 months 33.5 19.2
Amount due for settlement after 12 months 74.1 70.7
The carrying amounts of the Group’s borrowings as at 31 March are denominated in the following currencies:
Pounds Sterling
£mEuros
£m
Canadian Dollars
£m
US Dollars
£mTotal
£m
Bank borrowings 10.6 9.2 33.3 14.7 67.8Interim production financing – – 19.0 3.1 22.1
At 31 March 2011 10.6 9.2 52.3 17.8 89.9
Bank borrowings 1.9 9.3 31.8 14.7 57.7Interim production financing – – 31.9 18.0 49.9
At 31 March 2012 1.9 9.3 63.7 32.7 107.6
The directors consider that the carrying amount of interest bearing loans and borrowings approximates to their fair value.
The principal features of the Group’s borrowings are as follows:
(i) The Group has a multi-currency secured revolving credit facility with a syndicate of banks managed by JP Morgan Chase Bank N.A. The facility may be funded in US Dollars, Canadian Dollars, Sterling or Euros. On 9 November 2011 the facility was increased from US$175 million to US$239 million and maturity date extended from 19 September 2012 to 1 October 2014. These interest bearing loans and borrowings are secured by the assets of the Group. On 29 December 2011, the facility was reduced from US$239 million to US$222 million per the agreement. The facility at 31 March 2012 at closing exchange rates was US$224 million.
(ii) At 31 March 2012, the Group had available £82.2 million (2011: £40.4 million) of undrawn committed borrowings under the revolving credit facility in respect of which all conditions precedent had been met.
(iii) The TV production businesses have Canadian Dollar and US Dollar interim production credit facilities with various Banks bearing interest at Bank prime rate plus a margin. Amounts drawn down under these facilities at 31 March 2012 were £49.9 million (2011: £22.1 million). These facilities are secured by the future revenue of the individual television production businesses.
The weighted average interest rates on all bank borrowings are not materially different from their nominal interest rates. The weighted average interest rate on all interest bearing loans and borrowings is 5.5% (2011: 6.1%).
Notes to the Financial Statements continuedFor the year ended 31 March 2012

Entertainment One Ltd.Financial Statements
65
Annual Report & Accounts 2012
22. ProvisionsDiscontinued
operations£m
Other£m
Total£m
At 31 March 2011 1.7 0.4 2.1Utilised in the year (1.7) (0.2) (1.9)
At 31 March 2012 – 0.2 0.2
At 31 March 2012, provisions consist of amounts relating to onerous lease costs from warehouse closures in prior years. In the prior year provisions primarily related to the Retail store closure and include termination payments and onerous lease costs. All amounts are due for settlement within 12 months.
23. Capital and other reservesStated capitalChanges to the number of issued shares since 31 March 2011 are as follows:
Common shares
At 31 March 2011 187,457,513Shares issued on exercise of share options 395,717Issue of new shares for cash 4,126,636
At 31 March 2012 191,979,866
Changes to the Company’s capital since 31 March 2011 are as follows:
Stated capital £m
Other reserves £m
Total capital and other reserves
£m
At 31 March 2011 167.2 9.3 176.5Shares issued on exercise of share options 0.4 – 0.4Issue of new shares for cash 6.3 – 6.3Movements in other reserves – 0.2 0.2
At 31 March 2012 173.9 9.5 183.4
The Company has common shares and preferred variable voting shares which carry no right to income.
During the year, 395,717 common shares were issued to employees exercising share options granted under various schemes. The total consideration received by the Company on the exercise of these options was £0.4 million. In May 2011 the Company issued 4,126,636 common shares at 153 pence per share (£6.3 million net of costs) as part of the consideration for the acquisition of Hopscotch as detailed in note 24.
Treasury sharesAt 31 March 2012, 7,510,286 (2011: 7,595,286) of the issued capital was held as Treasury Shares by the Employee Benefit Trust to satisfy the exercise of options under the Group’s share option schemes (note 33), with a book value of £7.7 million (2011: £7.8 million).
Other reservesOther reserves include a permanent restructuring reserve of £9.3 million which arose on completion of the Scheme of Arrangement in 2010 and represents the difference between the net assets and share capital and share premium in the ultimate Parent Company immediately prior to the Scheme. Other items include four million share warrants issued to Marwyn Value Investors L.P. on the completion of the acquisition of the Entertainment One Income Fund in 2007, accounted for as a share-based payment under IFRS 2 with a fair value of £0.6 million (note 33) and a cash flow hedging reserve (£0.4) million. Movements in other reserves in the year relate to the cash flow hedging reserve.
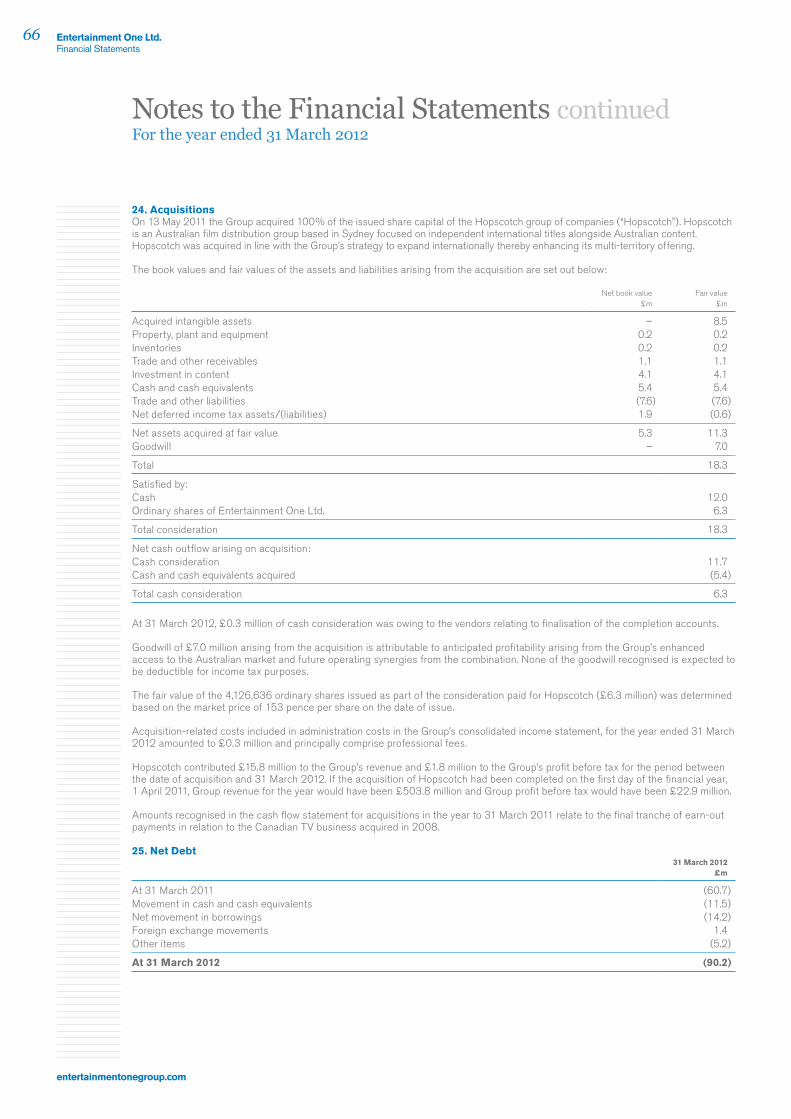
Entertainment One Ltd.Financial Statements
66
entertainmentonegroup.com
24. AcquisitionsOn 13 May 2011 the Group acquired 100% of the issued share capital of the Hopscotch group of companies (“Hopscotch”). Hopscotch is an Australian film distribution group based in Sydney focused on independent international titles alongside Australian content. Hopscotch was acquired in line with the Group’s strategy to expand internationally thereby enhancing its multi-territory offering.
The book values and fair values of the assets and liabilities arising from the acquisition are set out below:
Net book value £m
Fair value £m
Acquired intangible assets – 8.5Property, plant and equipment 0.2 0.2Inventories 0.2 0.2Trade and other receivables 1.1 1.1Investment in content 4.1 4.1Cash and cash equivalents 5.4 5.4Trade and other liabilities (7.6) (7.6)Net deferred income tax assets/(liabilities) 1.9 (0.6)
Net assets acquired at fair value 5.3 11.3Goodwill – 7.0
Total 18.3
Satisfied by:Cash 12.0Ordinary shares of Entertainment One Ltd. 6.3
Total consideration 18.3
Net cash outflow arising on acquisition:Cash consideration 11.7Cash and cash equivalents acquired (5.4)
Total cash consideration 6.3
At 31 March 2012, £0.3 million of cash consideration was owing to the vendors relating to finalisation of the completion accounts.
Goodwill of £7.0 million arising from the acquisition is attributable to anticipated profitability arising from the Group’s enhanced access to the Australian market and future operating synergies from the combination. None of the goodwill recognised is expected to be deductible for income tax purposes.
The fair value of the 4,126,636 ordinary shares issued as part of the consideration paid for Hopscotch (£6.3 million) was determined based on the market price of 153 pence per share on the date of issue.
Acquisition-related costs included in administration costs in the Group’s consolidated income statement, for the year ended 31 March 2012 amounted to £0.3 million and principally comprise professional fees.
Hopscotch contributed £15.8 million to the Group’s revenue and £1.8 million to the Group’s profit before tax for the period between the date of acquisition and 31 March 2012. If the acquisition of Hopscotch had been completed on the first day of the financial year, 1 April 2011, Group revenue for the year would have been £503.8 million and Group profit before tax would have been £22.9 million.
Amounts recognised in the cash flow statement for acquisitions in the year to 31 March 2011 relate to the final tranche of earn-out payments in relation to the Canadian TV business acquired in 2008.
25. Net Debt31 March 2012
£m
At 31 March 2011 (60.7)Movement in cash and cash equivalents (11.5)Net movement in borrowings (14.2)Foreign exchange movements 1.4Other items (5.2)
At 31 March 2012 (90.2)
Notes to the Financial Statements continuedFor the year ended 31 March 2012

Entertainment One Ltd.Financial Statements
67
Annual Report & Accounts 2012
26. Contingent liabilities and commitmentsOperating lease commitmentsThe Group operates from properties in respect of which commercial operating leases have been entered into.
At the balance sheet date, the Group had outstanding commitments for future minimum lease payments under non-cancellable operating leases, which fall due as follows:
31 March 2012 £m
31 March 2011 £m
Within one year 5.2 4.8In the second to fifth years inclusive 15.1 9.9After five years 0.8 1.1
21.1 15.8
Future capital expenditure31 March 2012
£m31 March 2011
£m
Investment in content rights contracted for but not provided 96.3 45.0
27. SubsidiariesDetails of the Company’s principal subsidiary undertakings at 31 March 2012 are as follows:
Name Country of incorporation Principal activity
Entertainment One UK Limited England and Wales Content ownershipEntertainment One Benelux BV Holland Content ownershipEntertainment One Limited Partnership Canada Content ownership & distributionSeville Pictures Inc. Canada Content ownershipEntertainment One Films Canada Inc. Canada Content ownershipEntertainment One Australia Pty Ltd. Australia Content ownershipVideoglobe 1 Inc. Canada DistributionEntertainment One US LP US Content ownership & distribution7508999 Canada Inc. Canada Holding company4384768 Canada Inc. Canada Holding companyEarl Street Capital Inc. US Holding companyEntertainment One UK Holdings Limited England and Wales Holding companyEntertainment One Holding Holland BV Holland Holding companyEntertainment One Australia Holdings Pty Ltd. Australia Holding companyEntertainment One Television BAP Ltd. Canada TV ProductionEntertainment One Television International Ltd. Canada Film & TV sales & distributionEntertainment One Television Productions Ltd. Canada TV Production
All companies above are 100% owned and, other than 7508999 Canada Inc., are owned through intermediate holding companies.
The proportion held is equivalent to the percentage of voting rights held.
All of the above subsidiary undertakings have been consolidated in the Group financial statements under the acquisition method of accounting.
28. Investment in joint venturesDetails of the Company’s significant joint ventures at 31 March 2012 are as follows:
Name Country of incorporation Proportion held Principal activity
One Voice Media Inc. Canada 51% AdvertisingHOW Productions Season One Inc. Canada 49% TV ProductionHOW S2 Productions Inc. Canada 49% TV Production7552980 Canada Inc. Canada 49% TV Production7757310 Canada Inc. Canada 49% TV ProductionHope Zee One Inc. Canada 51% TV Production
Contractual arrangements establish joint control over each joint venture listed above. No single venturer is in a position to control the activity unilaterally.

Entertainment One Ltd.Financial Statements
68
entertainmentonegroup.com
28. Investment in joint ventures continuedEffect of proportional consolidation of joint venturesThe following presents, on a condensed basis, the effect of including joint ventures in the Group financial statements using proportional consolidation:
Income statement
Year ended 31 March 2012
£m
Year ended 31 March 2011
£m
Revenue 2.6 6.2Cost of sales (1.8) (3.5)Administrative expenses (0.6) (0.1)
Profit before tax 0.2 2.6Income tax expense (0.1) (0.1)
Profit after tax 0.1 2.5
Balance sheet31 March 2012
£m31 March 2011
£m
Investment in programmes 2.2 2.4Trade and other receivables 7.1 12.2Cash and cash equivalents 1.2 0.4
Total assets 10.5 15.0
Trade and other payables 11.0 13.3Equity shareholders’ funds (0.5) 1.7
Total equity and liabilities 10.5 15.0
29. Employee benefitsThe average monthly number of employees (including executive directors) on a continuing basis was:
Year ended 31 March 2012
Year ended 31 March 2011
Canada 720 762United States 222 214United Kingdom 100 86Australia 25 –Rest of Europe 41 42
1,108 1,104
Their aggregate remuneration comprised:Year ended
31 March 2012 £m
Year ended 31 March 2011
£m
Wages and salaries 43.4 41.9Share-based payment charge 1.4 2.5Social security costs 4.1 4.0Termination costs 0.4 0.1Pension costs 0.7 0.9
50.0 49.4
30. Directors and key management compensationThe remuneration of the executive directors, who are the key management personnel of the Group, is set out below:
Year ended 31 March 2012
£m
Year ended 31 March 2011
£m
Short-term employee benefits 2.4 2.6Share-based payment charge 0.4 0.4
2.8 3.0
Further details of directors emoluments (unaudited) can be found in the Directors’ Remuneration Report on pages 36 to 38.
Notes to the Financial Statements continuedFor the year ended 31 March 2012

Entertainment One Ltd.Financial Statements
69
Annual Report & Accounts 2012
31. Related party transactionsTransactions between the Company and its subsidiaries, which are related parties, have been eliminated on consolidation and are not disclosed in this note.
Marwyn Value Investors L.P. held 75,424,894 common shares in the Company as at 31 March 2012 (2011: 75,424,894), amounting to 39.3% (2011: 40.2%) of the issued capital of the Company. In addition, Marwyn Value Investors L.P. holds warrants over four million common shares (2011: four million). Marwyn Value Investors L.P. is deemed to be a related party of Entertainment One Ltd. by virtue of this significant shareholding.
James Corsellis and Mark Watts are partners of Marwyn Capital LLP, partners of Marwyn Investment Management LLP, directors of Marwyn Partners Limited and directors of Marwyn Investments Group Limited and are therefore deemed to be related parties of Entertainment One Ltd. by virtue of a common director or member.
During the year the Company paid fees of £0.4 million (2011: £0.5 million) to Marwyn Capital LLP for corporate finance advisory services under the terms of their advisory agreement pursuant to which Marwyn Capital LLP agreed to provide general strategic and corporate financial services to the Company for a fixed monthly fee of £15,000 (2011: £15,000) plus expenses up to July 2011. From August 2011 to support increased corporate activities this was temporarily increased to £25,000 with additional fees for each corporate transaction to be agreed.
At 31 March 2012 the Group owed Marwyn Capital LLP £0.1 million (2011: £0.1 million). The amounts outstanding are unsecured and will be settled in cash. No guarantees have been given or received.
Robert Lantos is owner of Serendipity Point Films (“Serendipity”). The Group has an output agreement with Serendipity covering distribution of all Serendipity titles within the Canadian market. Serendipity also co-produces a number of TV productions with the Group. The Group owed Serendipity £43,000 at 31 March 2012 (2011: £0.7 million).
During the year payments of £1.0 million (2011: £0.9 million) were made to One Voice Media Inc., a joint venture of the Group (note 28). The Group owed £0.1 million (2011: £0.2 million) to One Voice Media Inc. as at 31 March 2012.
The Group owed £1.4 million (2011: £0.4 million) to its joint venture television production companies and was owed £0.8 million (2011: £2.1 million) by its joint venture television production companies as at 31 March 2012.
32. Events after the balance sheet dateThere were no events subsequent to the balance sheet date that require additional disclosure in these financial statements.
33. Share-based paymentsEquity-settled share schemesThe Group has a number of equity-settled share-based payment schemes for its employees and directors. These are the Executive Share Plan (“ESP”), the Employee Benefit Trust (“EBT”) and the Management Participation Scheme (“MPS”). The total charge in the year relating to the three schemes was £1.4 million (2011: £2.5 million). Details of grants to directors during the year are given in the Directors’ Remuneration Report on pages 36 to 38.
Executive share plan
2012 Number Million
2012 Weighted
average exercise price
Pence
2011 Number
Million
2011 Weighted
average exercise price
Pence
Outstanding at beginning of year 9.1 10.2 10.7 19.2Granted 0.3 1.0 2.2 1.0Lapsed (0.2) 5.8 (1.4) 51.8Exercised (3.6) 8.2 (2.4) 41.4
Outstanding at end of year 5.6 11.6 9.1 10.2
Exercisable 4.1 8.9 5.9 4.8
Employee Benefit Trust
2012 Number Million
2012 Weighted
average exercise price
Pence
2011 Number
Million
2011 Weighted
average exercise price
Pence
Outstanding at beginning of year 4.1 – 5.1 –Distributed (0.1) – – –Lapsed – – (1.0) –
Outstanding at end of year 4.0 – 4.1 –
Exercisable 4.0 – 4.1 –
The contractual life of an option under these schemes is between three and five years. The weighted average contractual life remaining of the ESP options in existence at the end of the year was 2.1 years (2011: 2.2 years) and their weighted average exercise price was 11.6 pence (2011: 10.2 pence). The weighted average share price at the date of exercise for share options exercised during the year was 155 pence (2011: 108 pence).

Entertainment One Ltd.Financial Statements
70
entertainmentonegroup.com
33. Share-based payments continuedThere are certain performance criteria to be met before share options are exercisable. Prior to 31 March 2010 the majority of options granted had performance conditions with 33.3% of the options vesting in tranches over a three year performance period, 33.3% vesting dependent on performance against annual underlying EBITDA targets and the remainder vesting dependent on share price targets. The options granted in both the current and prior year had a performance condition of 50% vesting over a three year performance period and 50% vesting dependent on performance against annual underlying EBITDA targets.
Fair value of share optionsEquity-settled share-based payments are measured at fair value at the date of grant. The fair value of share options granted during the year was calculated using the Binomial model. The assumptions used in the model were:
Year ended 31 March 2012 Year ended 31 March 2011
Executive Share Plan
Employee Benefit Trust
Executive Share Plan
Employee Benefit Trust
Fair value at measurement date 155.0 pence – 110.0 pence –Weighted average share price 155.0 pence – 110.0 pence –Weighted average exercise price 1.0 pence – 1.0 pence –Expected volatility 30.0% – 30.0% –Expected life 3.0 years – 3.0 years –Dividend yield – – – –Risk free interest rate 1.93% – 1.82% –
The expected volatility is based on the Company’s share price from the period since trading first began adjusted where appropriate for unusual volatility. The expected life used in the model is based on management’s best estimate of the average expected time period for the exercise of an option by its holder.
Management Participation SchemeThe Group operates a MPS for executive directors which was granted on 31 March 2010. The extent to which rights vest will depend upon the Company’s performance over a three year period from 31 March 2010. Participants are only rewarded if shareholder value is created, thereby aligning the interests of the participants directly with those of shareholders. The number of shares that would be issued under this scheme if the performance criteria is met is calculated based on the increase in market capitalisation of the Company since 31 March 2010. Any new equity issued is adjusted for so that the participants of the scheme do not benefit from the increased market capitalisation.
The executive directors have subscribed for shares in a subsidiary of the Company. Subject to growth, vesting and good leaver/bad leaver conditions, the shares can be converted to common shares of the Company for a value equivalent to the sum of 6.4% of the increase in shareholder value based on the shares in issue on 31 March 2010 and 10% of the increase in shareholder value on any additional common shares issued subsequent to 31 March 2010 reflecting an increase in the Group’s market capitalisation following any adjustments deemed necessary by the Board.
The growth condition to be met is that the compound annual growth of the Company’s share price from 31 March 2010 must be at least 12.5% per annum. The growth condition will be measured on the earlier of 31 March 2013 or a change of control of the Company. If the growth condition has not been satisfied on that date, it shall be measured at any point up to and including 31 March 2015. If the growth condition has not been satisfied by this date, the holders of the shares must sell those shares to the Company for a nominal amount.
At 31 March 2012 if the vesting and growth conditions had been met the number of awards outstanding but not yet exercisable based on the average share price for the year would be 7.7 million (2011: 4.5 million).
There have been no new grants under this scheme this year. The fair value of the award was measured by using a binomial model. Key assumptions used in the model were, share price on date of grant 67.5 pence, volatility of 30%, expected life of three years and the risk free interest rate of 1.83%.
Cash-settled share-based paymentsThe carrying amount of the liability relating to the cash-settled options under the Canadian deferred bonus scheme at 31 March 2012 is nil (2011: £0.1 million). Until this liability is settled it is remeasured at each reporting date with changes in fair value recognised in the income statement.
Other share-based payment awardsOn completion of the acquisition of Entertainment One Income Fund in 2007, four million share warrants were issued to Marwyn Value Investors L.P. (formerly Marwyn Neptune Fund). The conditions for exercising these are 50% when the share price reaches £1.25 and the remaining 50% when the share price reaches £1.50.
On 24 May 2010, in association with the ongoing commercial relationship with Summit Entertainment LLC (“Summit”), 2,500,000 warrants were issued to Summit at an exercise price of £0.50 per common share. These warrants are subject to time related vesting criteria.
The fair value of the share warrants was determined using a binomial option pricing model. Awards have been valued using an assumed exercise behaviour that recognises the exercise restrictions (note 23).
Notes to the Financial Statements continuedFor the year ended 31 March 2012

Entertainment One Ltd.Financial Statements
71
Annual Report & Accounts 2012
33. Share-based payments continuedOut-performance planThe Company also has an out-performance incentive plan that allocates up to £5 million in total to an incentive pool to be paid to executive directors in the future, conditional on the sale of the Company for no less than £2.25 per share or the Company’s share price reaching an average of £2.25 per share.
34. Financial risk managementThe Group’s overall risk management programme seeks to minimise potential adverse effects on its financial performance and focuses on mitigation of the unpredictability of financial markets as they affect the Group.
The Group’s activities expose it to certain financial risks including interest rate risk, foreign currency risk, credit risk and liquidity risk. These risks are managed by the Chief Financial Officer under policies approved by both the Board and the Audit Committee, which are summarised below.
Interest rate risk managementThe Group is exposed to interest rate risk from its borrowings and cash deposits. The exposure to fluctuating interest rates is managed by capping portions of debt using interest rate collars and fixing portions of debt using interest rate swaps, which aims to optimise net finance costs and reduce excessive volatility in reported earnings. Interest rate hedging activities are monitored on a regular basis. At 31 March 2012 the longest term of any debt held by the Group was until 2014.
Interest rate sensitivityA simultaneous 1% increase in the Group’s variable interest rates in each of Pounds Sterling, Euros, US Dollars and Canadian Dollars at the end of 31 March 2012 would result in a £0.4 million (2011: £0.3 million) decrease to the Group’s profit before tax and a decrease of 1% would result in a £0.4 million (2011: £0.3 million) increase to the Group’s profit before tax.
Foreign currency risk managementThe Group is exposed to exchange rate fluctuations because it undertakes transactions denominated in foreign currency and it is exposed to foreign currency translation risk through its investment in overseas subsidiaries.
The Group manages transaction foreign exchange exposures by undertaking foreign currency hedging using forward foreign exchange contracts for significant transactions (principally USD Minimum Guarantee payments). The implementation of these forwards is based on highly probable forecast transactions and qualifies for cash flow hedge accounting. Further detail is disclosed in note 20.
The majority of the Group’s operations are domestic within their country of operation. The Group seeks to create a natural hedge of this exposure through its policy of aligning approximately the currency composition of its net borrowings with its forecast operating cash flows. The Group undertakes net investment hedging where appropriate.
Foreign exchange rate sensitivityThe following table illustrates the Group’s sensitivity to foreign exchange rates on its financial instruments. Sensitivity is calculated on financial instruments as at 31 March 2012 denominated in non-functional currencies for all operating units within the Group. The sensitivity analysis includes only outstanding foreign currency denominated monetary items including external loans.
The percentage movement applied to each currency is based on management’s measurement of foreign exchange rate risk.
31 March 2012 Income
statement +/– £m
31 March 2011 Income
statement +/– £m
10% appreciation of the US Dollar (0.8) (0.1)10% appreciation of the Canadian Dollar (0.2) –10% appreciation of the Australian Dollar 0.1 –10% appreciation of the Euro 0.7 (0.2)
Credit risk managementCredit risk arises from cash and cash equivalents, deposits with banks and financial institutions, as well as credit exposures to customers, including outstanding receivables and committed transactions. The Group manages credit risk on cash and deposits by entering into financial instruments only with highly credit-rated authorised counterparties which are reviewed and approved regularly by the Board. Counterparties’ positions are monitored on a regular basis to ensure that they are within the approved limits and there are no significant concentrations of credit risk. Trade receivables consist of a large number of customers spread across diverse geographical areas. Ongoing credit evaluation is performed on the financial condition of counterparties.

Entertainment One Ltd.Financial Statements
72
entertainmentonegroup.com
34. Financial risk management continuedThe carrying amount of cash and cash equivalents and deposits recorded in the balance sheet represent the Group’s maximum exposure to credit risk.
The Group considers its maximum exposure to credit risk as follows:31 March 2012
£m31 March 2011
£m
Cash and cash equivalents 17.4 29.2Trade receivables 75.8 63.1
93.2 92.3
Liquidity risk managementThe Group maintains a prudent liquidity risk management position by having sufficient cash and availability of funding through an adequate amount of committed credit facilities. Management continuously monitors rolling forecasts of the Group’s liquidity reserve on the basis of expected cash flows in the short, medium and long-term. At 31 March 2012 the undrawn uncommitted facility amount was £82.2 million (2011: £40.4 million). The facility was refinanced in November 2011 and matures in October 2014.
Analysis of the maturity profile of the Group’s financial liabilities, which will be settled on a net basis at the balance sheet date, is shown below.
Trade and other payables
£m
Interest bearing borrowings
£mTotal
£m
Amount due for settlement at 31 March 2012:Within one year 88.4 33.5 121.9One to two years 0.2 18.4 18.6Two to five years – 55.7 55.7
88.6 107.6 196.2
Amount due for settlement at 31 March 2011:Within one year 85.9 19.2 105.1One to two years – 73.2 73.2Two to five years – – –
85.9 92.4 178.3
Capital risk managementThe Group’s objectives when managing capital are to safeguard its ability to continue as a going concern in order to grow the business and provide returns for shareholders and benefits for other stakeholders and to optimise the weighted average cost of capital and tax efficiency subject to maintaining sufficient financial flexibility to undertake its investment plans. There are no externally imposed capital requirements. The management of the Group’s capital is performed by the Board.
In order to maintain or adjust the capital structure, the Group may issue new shares or sell assets to reduce debt.
35. Financial instrumentsFinancial instruments at fair valueFair value measurements are grouped into the following levels: Level 1 fair value measurements derived from unadjusted quoted prices in active markets for identical assets or liabilities; Level 2 fair value measurements derived from inputs, other than quoted prices included within level 1, that are observable for the asset or liability, either directly (as prices) or indirectly (derived from prices); and Level 3 fair value measurements derived from valuation techniques that include inputs for the asset or liability that are not based on observable market data. At 31 March 2012 the Group had £0.9 million (2011: £1.8 million) financial liabilities grouped into Level 2.
The carrying value of the Group’s financial instruments approximate their fair value.
Notes to the Financial Statements continuedFor the year ended 31 March 2012
Registered office175 Bloor Street EastSuite 1400, North TowerToronto, OntarioM4W 3RBCanada
BankersJPMorgan Chase125 London WallLondonEC2Y 5AJUnited Kingdom
Legal advisers to the Company (Canada)Osler, Hoskin & Harcourt LLP 100 King Street West1 First Canadian PlaceToronto, OntarioM5X 1B8Canada
Legal advisers to the Company (UK & US)Mayer Brown International LLP201 BishopsgateLondonEC2M 3AFUnited Kingdom
Financial adviser to the CompanyMarwyn Capital LLP11 Buckingham StreetLondonWC2N 6DFUnited Kingdom
Company Information
Joint broker Singer Capital Markets LimitedOne Hanover StreetLondonW1S 1AX United Kingdom
Joint brokerCenkos Securities plc6.7.8 Tokenhouse Yard LondonEC2R 7ASUnited Kingdom
RegistrarsCapita Registrars (Jersey) LimitedVictoria Chambers, Liberation Square1/3 The EsplanadeSt. HelierJE4 0FF Jersey
AuditorDeloitte LLP2 New Street SquareLondonEC4A 3BZ United Kingdom

Entertainm
ent One Ltd. A
nnual Report &
Accounts 2012
Entertainment One Ltd.175 Bloor Street East
Suite 1400, North TowerToronto, ON, M4W 3R8
CanadaT: +1 416 646 2400F: +1 416 979 9255
www.entertainmentonegroup.com