Results-Based Accountability in the Annie E. Casey ... · 2 ACKNOWLEDGMENTS Since the Annie E....
46
Results-Based Accountability in the Annie E. Casey Foundation’s Education Program
Transcript of Results-Based Accountability in the Annie E. Casey ... · 2 ACKNOWLEDGMENTS Since the Annie E....

Results-Based Accountability in
the Annie E. Casey Foundation’s Education Program

AUTHOR:
Bruno V. Manno, Senior Associate, The Annie E. Casey Foundation,
with assistance from Bryan C. Hassel and Amy Way, Public Impact
©2006, The Annie E. Casey Foundation, Baltimore, Maryland
About the Annie E. Casey Foundation
The Annie E. Casey Foundation is a private charitable organization dedicated to helping build better futures for disadvantaged
children in the United States. It was established in 1948 by Jim Casey, one of the founders of UPS, and his siblings, who named
the Foundation in honor of their mother. The primary mission of the Foundation is to foster public policies, human-service
reforms, and community supports that more effectively meet the needs of today’s vulnerable children and families. In pursuit
of this goal, the Foundation makes grants that help states, cities, and neighborhoods fashion more innovative, cost-effective
responses to these needs. For more information and a copy of this report, visit the Foundation’s website at www.aecf.org.

TA B L E O F C O N T E N T S
2 Acknowledgments
3 Executive Summary
5 Introduction
5 Background
8 Establishing a Value Context
16 Identifying Investment Strategies
19 Measuring Results
32 Conclusions and Lessons Learned
35 Endnotes
36 Appendix A: The Annie E. Casey
Foundation’s 2004 Education Investments
42 Appendix B: Education Partnerships by
Type of Program Support

2
A C K N O W L E D G M E N T S
Since the Annie E. Casey Foundation began its “results-based accountability” (RBA) initiative four years ago, many
individuals have assisted me in clarifying my thoughts on this topic. Moreover, different venues at the Foundation
and in other settings have allowed me the opportunity to develop and test the ideas and approach presented in this
report. In short, too many colleagues to name from inside and outside the Foundation have endured more than their
fair share of presentations and updates on my odyssey through RBA. I thank them all. In particular, I thank Mark
Friedman, a Foundation consultant, who first introduced me to this approach and Patrick McCarthy, Casey’s Vice
President for System and Service Reform, who encouraged me at every turn and approved my slew of requests for pro-
fessional development programs paid for by the Foundation. I also want to thank Bryan C. Hassel and Amy Way of
Public Impact for their assistance in preparing this manuscript. Finally, a special thanks to the Foundation’s education
grantees who bore the brunt of my attempts to develop and pilot this framework. Their cooperation and comments
have greatly improved the approach.
Bruno V. Manno
Senior Associate for Education
The Annie E. Casey Foundation
January 2006

E X E C U T I V E S U M M A R Y
This report details the Annie E. Casey Foundation’sfour-year effort to develop a “results-based accounta-bility” (RBA) approach to its K-12 education portfo-lio. Though still a work in progress, the Foundation’sexperience with RBA can help other philanthropicorganizations and individual donors develop their ownapproaches to producing and documenting the results oftheir investments. It can also assist Foundation granteesin their quest to clarify and communicate more clearlyto donors and other interested parties the results theywant to achieve and their progress in achieving them.
In January 2002, the Casey Foundation’s leaders beganthinking anew about how results-based accountabilitycould help Casey better achieve its mission. RBAbegins with ends—conditions of well-being for chil-dren, families, and communities—and works back-wards to identify the best means to achieve those endsor results. Rather than immediately undertake aFoundation-wide initiative, Casey leadership decidedto develop and pilot a framework in a few programareas, including K-12 education. This began an itera-tive process in which program staff would involvegrantees in the development of the framework, imple-ment a set of ideas, see how it worked, adapt it, andfeed back the results into the organization’s broaderthinking about RBA. The outcome of this four-yeareffort is a comprehensive, but developing, RBA frame-work and process being implemented throughout theCasey Foundation.
Foundation Investment Summary (FIS): This is theheart of the Foundation’s RBA work. This narrativedocument drives the RBA process for program areas. Itprovides a framework that explains the program’sapproach to grant investments—including the resultsthe investments will achieve—and how success will bedetermined. This framework contains seven key items:
Vision: The vision statement describes the program’sdesired future for a population. This population resultis succinct and free from jargon. It is a result that canbe achieved only with effective alliances with otherpartners. The education program’s vision for K-12education is:
One day—all young people in tough neighborhoodswill achieve the aspiration their families have for them:to graduate prepared for adult success and well-beingin the worlds of work, family, and citizenship.
Indicators and Trendlines: These are the best popula-tion measures and data over time that signal progressor lack of progress in achieving the vision. The educa-tion FIS describes three indicators and trends thathighlight dogged problems that need to be addressed ifthe population result is to be achieved: the large gapsin achievement, persistence/graduation, and teacherquality between young people from low-income fami-lies in disadvantaged neighborhoods—many of whomare young people of color—and their counterpartsfrom other families and neighborhoods.
Story Behind the Trendlines: This discussion describesCasey’s perspective on what key forces are barriers toachieving the vision. For example, families in distressedneighborhoods lack quality educational options thatmeet young people’s needs. Families also have few strongconnections with schools and other community supportsand services. Finally, policymakers and the wider civiccommunity have insufficient political will and lackgood information on effective policies and practices toovercome the challenges associated with the achieve-ment, persistence/graduation, and teacher quality gaps.
Casey’s Theory of Change: This defines what worksand what must be done to turn the curve in a positivedirection on the indicators and trendlines so barriers toprogress can be overcome. The Foundation’s theory ofchange in education involves creating neighborhood-based systems and organizations that link families toschools and community institutions. These schoolsand institutions provide supports and services so thatincentives, autonomy, and capacity are aligned to ensurethat organizations and individuals perform at high levels.
Casey’s Core Values: These significant and enduringpreferences underlie the FIS and drive the theory ofchange. They are fundamental criteria or tenets thatinform the decisions made about the Foundation’seducation strategies and investments. The three corevalues for the education portfolio are: strong results,quality educational options, and robust connections tocommunity supports and services.
3

Casey’s Role in Investment Strategies: For each barrierto achieving the core result, the Foundation identifiedinvestment opportunities for overcoming the barrier.Within these broad opportunities, the Foundation hasthree investment areas that serve as leverage points toimprove outcomes for young people so they are pre-pared for adult success and well-being. They are thecategories that organize Casey’s education investments:
l Investments in Schools—Demonstrate and Replicate:Increase quality educational options and improveoutcomes for young people by demonstrating andreplicating how creating new schools or improvingexisting schools strengthen and connect families toschools and community institutions.
l Investments in Networks—Scale-up and Sustain:Increase quality educational options and improveoutcomes for young people by scaling up and sus-taining networks of schools, systems of schools, andother system-level efforts that strengthen and con-nect families to schools and community institutions.
l Investments in Organizations—Disseminate andInfluence: Develop knowledge and disseminate infor-mation on lessons learned, thereby influencing oth-ers on what effective policies and practices createquality options for young people and robust connec-tions, alliances, and partnerships between families,schools, and community institutions.
Casey’s Approach to Measuring Results: The Foundationmodel for measuring its performance and that of itsgrantees poses three questions: What was done by agrantee with the support it received from the CaseyFoundation? How well was that work done? What dif-ference does that work make in terms of the three waysthe Foundation defines results:
l Impact: Improvements in the success and well-beingof children, families, or communities directly servedby the grants, programs, or services of the CaseyFoundation.
l Influence: Changes in policies, systems, practices,and/or opinions that support Casey’s role instrategies that work.
l Leverage: New or increased investment (public orprivate) in initiatives, programs, or areas in strategiesthat Casey believes will lead to results for childrenand families.
The Foundation signs a letter of agreement—a per-formance agreement—with each grantee that details ascope of work and the performance measures to beused in assessing the grant’s results. These measures arethe basis of reports to the Foundation that when aggre-gated provide a programwide progress report on thesuccess and limitations of its investments, helping torefine grant making over time. In addition to performancemeasures, the Foundation collects other information onthe effects of its investments, including anecdotes, stories,and other types of qualitative information.
In short, the FIS is a comprehensive narrative thatestablishes the Foundation’s investment parametersand describes the value context within which theFoundation does its work—its vision, key indicatorsand trendlines, perspective on the barriers to achievingthe vision, theory of change, enduring tenets or princi-ples, investment strategies, and approach to measuringperformance. This context guides the Foundation’sinvestment value chain—a series of related activitiesthat link the Foundation’s proposed work with itsaccomplishments and results.
This pilot activity in RBA has helped the Foundation’seducation program to refine its strategic intent, guidethe selection of investments, evaluate both specificinvestments and its portfolio as a whole, and helpgrantees sharpen their focus. It also has led to severalvaluable lessons learned. Perhaps the most essential ofthese is the importance of creating a learning agendafor the Foundation’s work. This lesson serves as areminder of why results-based accountability is, in theend, so vital in philanthropy. In the midst of the tediumof performance measures, reporting requirements, andstatistics, it is easy to lose sight of the ultimate purposeof all of this activity: helping the Foundation and itspartners maximize the amount of social value they createthrough their work together.
4

I N T R O D U C T I O N
Foundations everywhere are eager to do a better job ofunderstanding how well their investments are workingand what results they are producing. Perhaps nowhereis this interest more intense than in education philan-thropy.1 Foundations and individual donors in this sec-tor are increasingly asking questions like: What is ourvision for the future of education and K-12 schools?What changes need to happen in education to achievethat vision? What role can we play as a donor to promotethose changes? What counts as success? And how willwe know if our investments are paying off for children,families, and society?2
This report is about a concerted effort to answer suchquestions within one philanthropic organization: theAnnie E. Casey Foundation. After some backgroundinformation, it describes in detail how the Foundationhas come to think about the results of its investmentsin general and in its K-12 education portfolio in par-ticular. It is important to remember that this effort toincorporate a results-based accountability approach toits investments is a work in progress, four years in themaking. By shedding light on how one foundation hastackled this challenge, this publication aims to helpother philanthropic organizations, individual donors, andgrantees develop their own approaches to producingand documenting the results of their investments.
B A C K G R O U N D
The Annie E. Casey Foundation is a private charitableorganization established in 1948 by Jim Casey, one ofthe founders of UPS, and his siblings, who named thephilanthropy in honor of their mother. The first grantsprovided support to a camp for disadvantaged childrenin Seattle, Washington, the home of the Casey family.When Jim Casey gave up his administrative responsibil-ities as chief executive officer of UPS in the 1960s, heturned his attention to sharpening the programmaticfocus of the Foundation. In the course of his personalresearch with experts in the field of child welfare, heconcluded that many troubled adults had grown upunhappily in foster care, often moving from one fosterfamily to another. In 1966, his interest in long-termfoster care led him to establish Casey Family Programs,
now an independent operating foundation in Seattle.In 1967, a similar program was established inConnecticut as the direct services operation of theAnnie E. Casey Foundation. Headquartered in NewHaven, Casey Family Services now has eight operatingdivisions offering an array of foster care and other serv-ices in New England and Maryland.
With the death of Jim Casey in 1983 and the increasedresources from his estate, the Foundation’s Board ofTrustees began to explore opportunities to expand theFoundation’s work on behalf of disadvantaged children.The Trustees committed the Foundation to an ambi-tious mission: to help build better futures and improveoutcomes for disadvantaged children and families whoare at risk of poor educational, economic, social, andhealth outcomes. It does this by fostering public policies,human-service reforms, and community supports thatmore effectively meet the needs of today’s vulnerablechildren and families. Today, the Casey Foundation isthe 13th largest private foundation in the United States.
K-12 education has long been one of Casey’s majorareas of focus. In 2004, for example, the Foundationmade nearly $5.8 million in grants to K-12 activities(see Appendix A). The Foundation also geared up tomake several program-related investments, or PRIs, inwhich it would put Casey’s corpus to work in support ofachieving educational results. Most of the Foundation’sK-12 investments targeted its Making Connectionscommunities around the country.3 Making Connectionsis a ten-year investment by the Foundation to improveoutcomes for families and children in a limited numberof disadvantaged or isolated neighborhoods nationwide.By combining K-12 investments with other kinds ofyouth and family strengthening activities in these targetneighborhoods, the Foundation is aiming to sparkdramatic improvements in the well-being of childrenand families.
In January 2002, the Foundation’s leaders began think-ing anew about how results-based accountability couldhelp the Foundation better achieve its mission. Part ofthe impetus was external: foundations and the non-profit world as a whole are increasingly focused onmeasuring outcomes in order to judge the success ofprograms. But Casey’s unique history and connections
5

were also powerful forces. In the words of FoundationPresident Douglas W. Nelson as he reflected on JimCasey’s life:
In his seven decades of active leadership at UPS,Jim consistently advocated some core values andhabits and attitudes . . . He believed, for example,that efficiency and productivity were the primemakers of profit. To achieve these attributes, Jimencouraged the measurement of everything . . .Given this, it shouldn’t be surprising that Annie E.Casey’s Board of Trustees—most of whom are life-long UPS’ers [and top executives at the company]—are tireless in their advice to us that we measureeverything we can in our efforts to improve thelives of young people, families, and communities.There is a reason Casey has spent so much [money]on evaluation . . . ; there is a reason [we] talk sooften about the power of data-based advocacy . . .and that reason goes back to Jim Casey’s conviction
that measurement improves accountability; itimproves quality; and it improves effectiveness.4
Rather than launch a new RBA initiative Foundation-wide, leadership decided to develop and pilot a frame-work within a small set of program areas, including K-12 education. They set in motion a now four-yeariterative process in which program area staff wouldimplement a set of ideas, see how it worked, adapt it,and feed back the results into the organization’s broaderthinking about results-based accountability. The pilotinitiative had the following aims from the outset:
l Create a framework to describe and trackinvestment results
l Develop results-based letters of agreement andgrant reporting formats
l Engage grantees in shaping this RBA strategy
The Foundation’s leaders wanted the pilot to moveCasey closer to a shared vocabulary and common wayof thinking about and collecting information on resultsat the grant level, and to better equip the Foundation toexpand the RBA approach to the entire organization.It would also help the Foundation aggregate informa-tion at a Foundation-wide level and communicate theresults of its work and lessons learned to key audiences.Most importantly, they hoped the effort would moreclosely align the Foundation’s work—and the work ofits grantees and partners—around priority outcomesfor children and families.
To launch the pilot initiative, the Foundation drewupon several pioneering schools of thought aboutresults-based accountability in philanthropy andbeyond. The Foundation began by working with theRensselaerville Institute, an organization with well-developed expertise in results-based accountability.Foundation staff worked closely with staff from theInstitute to develop Casey’s initial ideas about how toinfuse a results-based approach into the Foundation’swork. The Foundation also found Mark Friedman’sresults accountability materials useful. Friedman tookon a consulting role, presenting workshops to theFoundation and offering insight on the development ofa results framework. The framework began to takeshape as a merging of the Rensselaerville Institute and
6
In his seven decades of active leadership at
UPS, Jim Casey consistently advocated some
core values and habits and attitudes . . .
[including] Jim’s conviction that measurement
improves accountability; it improves quality;
and it improves effectiveness.
Douglas W. Nelson, President
The Annie E. Casey Foundation

Friedman schools of thought. Additional insight camefrom Peter Frumkin’s work on strategic grant making.5
In developing this framework, the Foundation involvedgrantees in various ways. Initially, selected granteesattended day-long meetings at the Foundation’s offices.Foundation staff traveled to grantees’ sites to make pre-sentations and discuss the evolving model. Workingwith grantees to develop more results-based letters ofagreement also helped hone the process. As Foundationstaff asked grantees to develop performance measuresand provided assistance to them in doing so, we wereable to refine Casey’s RBA approach in response to thisearly grantee experience. Later, the education programconducted a pilot survey asking grantees for feedbackabout the entire Casey grant-making process. Granteeinvolvement helped make the results-based accounta-bility system one that would work well in practice, notjust in theory.
The Foundation Investment Summary
The Casey Foundation adapted these sources to developits own unique approach to results-based accountabil-ity. At the core of the approach is the development ofa Foundation Investment Summary, or FIS. The FIS isa narrative that describes an investment portfolio for abody of work. The FIS includes:
1. A vision statement defining the population to whichthe Foundation’s work is directed and the result orcondition of well-being that the Foundation hopesto improve for that group.
2. Indicators and trendlines summarizing the best avail-able measures that provide information on progresstoward achieving the vision, including a summaryof the problem to which these data point.
3. The story behind the trendlines, including the keybarriers that hinder progress toward the vision.
4. A theory of change about what works to overcome thekey barriers that hinder progress toward the vision.
5. A description of the Foundation’s key strategies forand contributions to turning the curve in a positivedirection on the population result so that the visioncan be achieved.
6. A list of what results the Foundation expects to achievein terms of impact, influence, and leverage (see Figure1) and the partners needed to achieve these results.
7. A progress report on the results achieved to date.
In the process of creating a Foundation InvestmentSummary, each program area must go through a care-ful process of thinking through with its grantees thecore set of questions that defines a results-based approachto accountability: What problems are we trying toaddress? How do we think the problems can be solved?What kinds of Casey investments and partnershipscontribute to that solution? And how will we know ifwe are successful?
7
FIGURE 1
DEFINING RESULTS AT CASEY
The Foundation defines results in terms of impact, influence,and leverage:
Impact: Improvements in the success and well-being of chil-dren, families, or communities directly served by the grants,programs, or services of the Casey Foundation.
Influence: Changes in policies, systems, practices, and/oropinions that support Casey’s role in strategies that work.
Leverage: New or increased investment (public or private) ininitiatives, programs, or areas in strategies that Casey believeswill lead to results for children and families.

The Foundation’s education program was one of theinitial program areas selected for the RBA pilot. Therest of this publication summarizes the results of thepilot work in education, organized in the followingsections:
Establishing a Value Context: The Foundation’svision, evidence about the problem, barriers to achiev-ing the vision, theory of change, and core values.
Identifying Investment Strategies: The Foundation’srole in the theory of change, investment areas andpurposes, investment types, and grant-making tactics.
Measuring Results: The Foundation’s approach todetermining what difference its investments are makingin terms of impact, influence, and leverage
Conclusions and Lessons Learned: The knowledgegenerated from the RBA pilot initiative shouldstrengthen the Foundation’s work and future efforts toimprove its investment results.
One important topic that is not addressed in this docu-ment: the infrastructure within the Foundation requiredto administer the process. The RBA system describedin these pages requires such mechanisms as reportingstructures; data-gathering and analysis systems; capacitybuilding for both grantees and Foundation staff onperformance measurement; ways of rolling up resultsdata from grantee to program area to Foundation-wide;a board-level system for using the performance meas-urement system; and other tools and processes. All thisis critical but is not discussed in this report.
E S TA B L I S H I N G A VA L U E C O N T E X T
The education program’s approach to RBA is rooted ina value context—a set of enduring ideas, beliefs, andprinciples that forms the basis for the Foundation’swork in education. The key elements of this value con-text are a vision statement; detailed indicator and trend-line evidence about the problems it is addressing; anunderstanding of barriers to achieving the vision; atheory of change that defines what needs to be donein order to overcome those barriers; and a set of corevalues.
Vision of a Core Result
The Foundation’s results-based accountability systemfor education begins with a vision:
One day—all young people in tough neighborhoods will
achieve the aspiration their families have for them: to
graduate prepared for adult success and well-being in
the worlds of work, family, and citizenship.
One feature of this vision statement jumps out: it is avision for a population (young people in distressedneighborhoods), not for a program, an agency, or evenfor the Foundation itself. The vision states a broad aimthat the Foundation hopes will be achieved for all youngpeople who live in disadvantaged neighborhoods, notjust young people who experience direct impact fromCasey-funded programs. Progress toward achieving thevision is measured by a set of indicators that informs usabout how well this population of young people isbeing prepared for adult success and well-being.
The implications for the Foundation are twofold. First,achieving the vision requires partners—organizationsthat will take on specific responsibilities aimed at thesame purpose, but distinct from Casey’s own activities.Partners can include grantees, but also other organiza-tions that bring their own resources into the mix.Partners can be local organizations, or national. Theycan be for-profit firms or nonprofit organizations, orthey can be governmental agencies ranging fromschool districts and cities to state and federal agencies.They can be other funders who share Casey’s aims andvalues. The challenges the Foundation is tackling aresimply too large for the Foundation to accomplish alone.
Second, results-based accountability within that broadvision requires the Foundation to establish perform-ance measures that help determine how well theFoundation, its grantees, and its partners are doing intheir work. In contrast with the indicators of the targetpopulation’s well-being, these performance measurestrack how well a grant, initiative, agency, organization,individual program, or unit/department is working.No doubt, these measures must be aligned with indi-cators of the broad vision for the population, but theyare different.
8

Indicators of the Core Problems
After the vision comes the reality: There are achieve-ment, persistence/graduation, and teacher quality gapsbetween young people from low-income families indistressed neighborhoods and their counterparts fromother families and neighborhoods. This is a statementof the core problem—again at the population level—that the Foundation aims to address with this part ofits grant making.
The Achievement Gap: The National Assessment ofEducational Progress (NAEP, often known as “thenation’s report card”) documents a large and continu-ing achievement gap between the percentage of whitestudents and students of color who score at the basiclevel or higher on the nation’s report card (Figures 2-5).6 The Foundation began tracking this indicator in1999. Prior to that, in the early 1990s, gaps in highschool reading scores were increasing for both African-American and Hispanic students. By 1994, improve-ments varied a great deal, showing African-Americanand Hispanic students gaining ground one year andlosing ground the next.
Since 1999, the outlook has improved in some ways.While there are still significant gaps in achievementbetween white and non-white students, the past fiveyears have seen an improvement in minority test scoresand a narrowing of the gap in most subjects. Thelargest gains have been made in elementary school,where reading and math scores have improved forAfrican-American and Hispanic students. In reading,the difference in scores has narrowed nine points forAfrican Americans and seven points for Hispanics. Inmath, the difference in scores has decreased by fivepoints for African-American students and nine pointsfor Hispanic students. In high school, the gap betweenwhite students and African Americans has closed twopoints in reading and four points in math. ForHispanic students, however, the gap has increased fivepoints in reading and two points in math.
Even with this progress the gaps remain large. Acrossall subjects, grades, and ethnic groups in Figures 2-5,the smallest gap is still 17 points.
For High School Students:
9
0
10
20
30
40
50
60
FIGURE 2Trends in High School Reading Scores 1971-2004
Gaps between Whites, African Americans, and Hispanics
YEARS TESTED
DIF
FER
EN
CE
IN
SC
ALE
SC
OR
ES
African American Hispanic
1971 1988 1990 1992 1994 1996 1999 2004
52
21
30
36
30 28
31 29 29
24 22
26
33 30
24
0
5
10
15
20
25
30
35
40
FIGURE 3Trends in High School Math Scores 1973-2004
Gaps between Whites, African Americans, and Hispanics
DIF
FER
EN
CE
IN
SC
ALE
SC
OR
ES
YEARS TESTED
1973 1990 1992 1994 1996 1999 2004
African American Hispanic
40
33
20 20
25 26 26
21
27
21
32
22
28
24

For Elementary School Students:
The Persistence/Graduation Gap: Data analyzedby the Education Trust show that high school and col-lege graduation rates are much lower for poor andminority children than for other groups. Althoughattrition from school often begins much earlier, theresult is significantly lower high school graduationrates among African-American, Hispanic, and NativeAmerican youth.7
10
0
10
20
30
40
50
DIF
FER
EN
CE
IN
SC
ALE
SC
OR
ES
FIGURE 4Trends in Elementary Reading Scores 1971-2004
Gaps between Whites, African Americans, and Hispanics
YEARS TESTED
1971 1988 1990 1992 1994 1996 1999 2004
African American Hispanic44
29
24
35
28
33
26
33 32 29
25
35
28 26
21
0
5
10
15
20
25
30
35
DIF
FER
EN
CE
IN
SC
ALE
SC
OR
ES
FIGURE 5Trends in Elementary Math Scores 1971-2004
Gaps between Whites, African Americans, and Hispanics
YEARS TESTED
1973 1990 1992 1994 1996 1999 2004
African American Hispanic
35
23
27
21
27
23 25
27 25
22
28 26
23
17
0
20
40
60
80
100
ASIAN WHITE AFRICAN HISPANIC NATIVEAMERICAN AMERICAN
NU
MB
ER
OF
HIG
H S
CH
OO
L G
RA
DU
ATE
S
FIGURE 6Gap in High School Graduation Rates
Out of 100 Kindergartners
9491
87
6258
0
20
40
60
80
100
ASIAN WHITE AFRICAN HISPANIC NATIVEAMERICAN AMERICAN
NU
MB
ER
WH
O A
TTE
ND
ED
SO
ME
CO
LLE
GE
FIGURE 7Gap in College Attendance Rates
Out of 100 Kindergartners
*NAT
IVE
AM
ER
ICA
N D
ATA
NO
T AV
AIL
AB
LE80
62
54
29
0
20
40
60
80
100
ASIAN WHITE AFRICAN HISPANIC NATIVEAMERICAN AMERICAN
NU
MB
ER
OF
CO
LLE
GE
GR
AD
UAT
ES
FIGURE 8Gap in College Graduation Rates
Out of 100 Kindergartners
49
30
16
6 7

The Teacher Quality Gap: Poor and minority childrenhave fewer well-qualified teachers than other children.8
For example, Figure 9 shows that 44 percent of middlegrade classes in core academic subjects nationwide areassigned to teachers who lack a college degree in thesubject being taught. That number rises to 53 percentin high poverty schools and 49 percent in high minor-ity schools. Figure 10 shows that in high school class-es, nearly one-fourth (24 percent) of all courses in coreacademic subjects are taught by someone lacking anundergraduate or graduate major in the subject, withthe proportion reaching 29 percent in high povertyschools and 28 percent in high minority schools. Thepercent of secondary school core academic classestaught by a teacher without at least a minor in the sub-ject has grown from 1994 to 1999, with the situationfor high poverty and high minority schools being theworst among the comparison groups.
Indicators Summary
Taken together, these indicators suggest that too manylow-income students and their families are routinelyshortchanged by the schools they attend. Many stu-dents in urban schools face low expectations for learn-ing and have less-qualified teachers. They often lackbasic supplies, including textbooks, and are frequentlycrowded into deteriorating buildings. There also arefewer financial resources in these schools, raising ques-tions of equity in state and local funding. Many low-income families lack connections with the supportsthey need to assist their children and do not participatein the schools their children attend.
This confluence of problems produces a variety of poorresults for students—and their families—in low-income neighborhoods, including lower academicachievement; limited economic opportunities and lifechances for young people; frayed relationships betweenschools and the families and communities they serve;and missed opportunities to revitalize and strengthenboth neighborhoods and families. Many schoolstoday—especially those in disadvantaged neighbor-hoods—neither adequately support the aspirations offamilies and communities for their children, nor pre-pare these young people for success in the worlds ofwork, family, and citizenship.
11
% O
F C
LAS
SE
S T
AU
GH
T B
Y A
TE
AC
HE
RW
ITH
OU
T AT
LE
AS
T A
MIN
OR
IN
TH
E S
UB
JEC
T
ALL SCHOOLS POVERTY MINORITY
High Low High Low
FIGURE 9Out of Field Teaching in Middle Grades
0
20
40
60
80
100
44
53
38
49
40
% O
F C
LAS
SE
S T
AU
GH
T B
Y A
TE
AC
HE
R
WIT
HO
UT
A M
AJO
R I
N T
HE
SU
BJE
CT
0
20
40
60
80
100
FIGURE 10 Out of Field Teaching in High School Grades
ALL SCHOOLS POVERTY MINORITY
High Low High Low
24 29
21
28
21
NOTE: High poverty and high minority schools are those where
50 percent or more of the student body qualify for the federal
free and reduced price lunch program, with low poverty and
low minority schools defined as having 15 percent or fewer
students eligible for the free and reduced price lunch program.
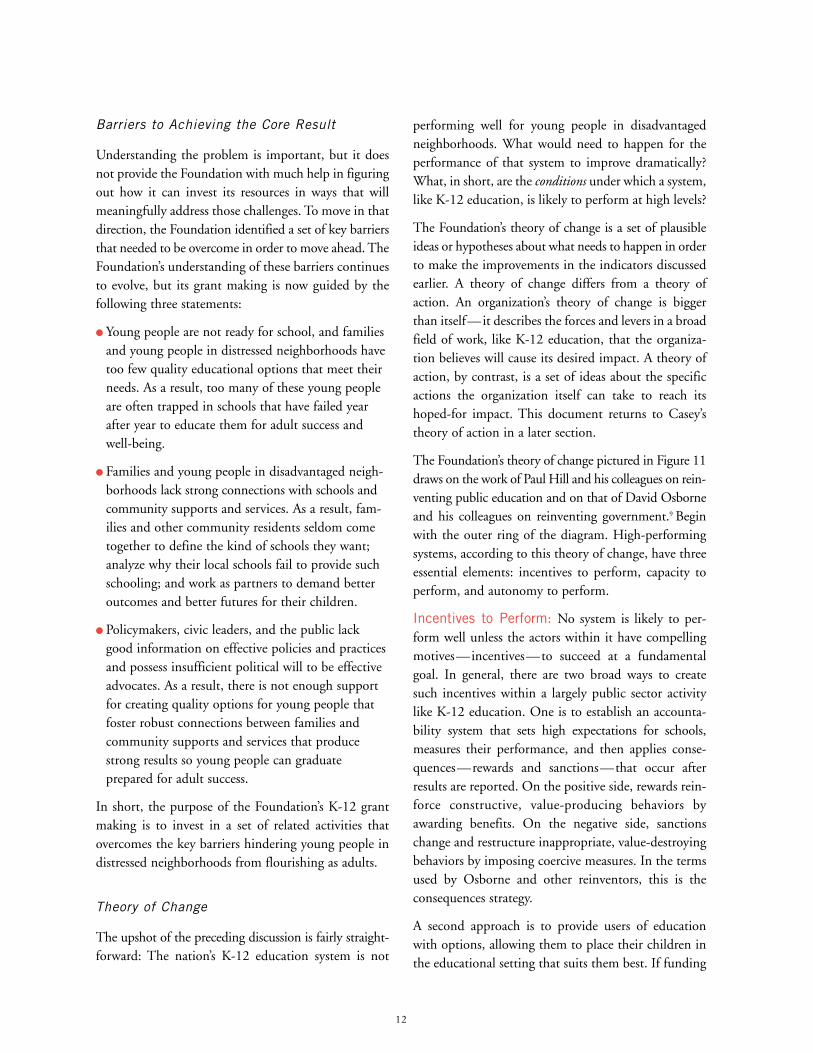
Barriers to Achieving the Core Result
Understanding the problem is important, but it doesnot provide the Foundation with much help in figuringout how it can invest its resources in ways that willmeaningfully address those challenges. To move in thatdirection, the Foundation identified a set of key barriersthat needed to be overcome in order to move ahead. TheFoundation’s understanding of these barriers continuesto evolve, but its grant making is now guided by thefollowing three statements:
l Young people are not ready for school, and familiesand young people in distressed neighborhoods havetoo few quality educational options that meet theirneeds. As a result, too many of these young peopleare often trapped in schools that have failed yearafter year to educate them for adult success andwell-being.
l Families and young people in disadvantaged neigh-borhoods lack strong connections with schools andcommunity supports and services. As a result, fam-ilies and other community residents seldom cometogether to define the kind of schools they want;analyze why their local schools fail to provide suchschooling; and work as partners to demand betteroutcomes and better futures for their children.
l Policymakers, civic leaders, and the public lackgood information on effective policies and practicesand possess insufficient political will to be effectiveadvocates. As a result, there is not enough supportfor creating quality options for young people thatfoster robust connections between families andcommunity supports and services that producestrong results so young people can graduateprepared for adult success.
In short, the purpose of the Foundation’s K-12 grantmaking is to invest in a set of related activities thatovercomes the key barriers hindering young people indistressed neighborhoods from flourishing as adults.
Theory of Change
The upshot of the preceding discussion is fairly straight-forward: The nation’s K-12 education system is not
performing well for young people in disadvantagedneighborhoods. What would need to happen for theperformance of that system to improve dramatically?What, in short, are the conditions under which a system,like K-12 education, is likely to perform at high levels?
The Foundation’s theory of change is a set of plausibleideas or hypotheses about what needs to happen in orderto make the improvements in the indicators discussedearlier. A theory of change differs from a theory ofaction. An organization’s theory of change is biggerthan itself—it describes the forces and levers in a broadfield of work, like K-12 education, that the organiza-tion believes will cause its desired impact. A theory ofaction, by contrast, is a set of ideas about the specificactions the organization itself can take to reach itshoped-for impact. This document returns to Casey’stheory of action in a later section.
The Foundation’s theory of change pictured in Figure 11draws on the work of Paul Hill and his colleagues on rein-venting public education and on that of David Osborneand his colleagues on reinventing government.9 Beginwith the outer ring of the diagram. High-performingsystems, according to this theory of change, have threeessential elements: incentives to perform, capacity toperform, and autonomy to perform.
Incentives to Perform: No system is likely to per-form well unless the actors within it have compellingmotives—incentives—to succeed at a fundamentalgoal. In general, there are two broad ways to createsuch incentives within a largely public sector activitylike K-12 education. One is to establish an accounta-bility system that sets high expectations for schools,measures their performance, and then applies conse-quences—rewards and sanctions—that occur afterresults are reported. On the positive side, rewards rein-force constructive, value-producing behaviors byawarding benefits. On the negative side, sanctionschange and restructure inappropriate, value-destroyingbehaviors by imposing coercive measures. In the termsused by Osborne and other reinventors, this is theconsequences strategy.
A second approach is to provide users of educationwith options, allowing them to place their children inthe educational setting that suits them best. If funding
12

follows children to the schools their families choose,then schools have powerful incentives to be responsiveand meet their needs. In Osborne’s terms, this kind ofmanaged competition is the customer strategy.
Capacity to Perform: Incentives only work if actorsin the system have—or can obtain—the capabilitiesthey need to respond to them with high performance.Capacity building develops the abilities of individuals,enterprises, and systems to act by enhancing or devel-oping knowledge and skills and investing in ideas andactivities. Capacity-building challenges include thethree fundamental issues faced by leaders: how to envi-sion and define public value—the mission challenge;how to build sustainable support—the legitimacychallenge; and how to organize to deliver public value—the operational challenge.10
In education, building capacity to perform couldinvolve numerous strands of activity. One is ensuringthat the best and brightest individuals bring their talents
to the educational system and, more specifically, to theeducation of young people in disadvantaged neigh-borhoods. Given the demonstrated importance ofhigh-quality teaching, for example, one imperative isrecruiting better teachers into the profession and over-coming the now-well-documented propensity ofschool districts to assign the most inexperienced teachersto schools with the highest concentrations of poorchildren.11 Another is recruiting talented leaders to runschools and systems of schools that serve large numbersof children from distressed neighborhoods.
As important as individual teachers and leaders are,capacity to perform is also a function of the strength oforganizations operating in the education sector.Whether they are traditional school districts, nonprofitnetworks of schools, organizations that supportschools, or organizations that help families get the besteducation for their children, a strong web of effectiveorganizations is an essential part of a high-performingeducational system.
13
FIGURE 11
The Casey Foundation’s Theory of K-12 Education Change
The reinventing government literature calls this kindof organizational capacity building developing anentrepreneurial culture strategy.12 Its three primaryactivities are defining the results—the public value—to be achieved; adapting to changing circumstances tomaintain support and legitimacy; and developing aviable operation within which value, support, andlegitimacy can thrive. As the reinventing literaturepoints out, without changes in the habits, hearts, andminds of employees—without changes in their mentalmodel—little long-term change will occur and littlepublic value will be added.
Autonomy to Perform: Autonomy creates thefreedom to act. Increased freedom of action leads toopportunities for initiative and entrepreneurship, espe-cially when it comes to using human and fiscal resourcesin new and innovative ways. In addition, freedom ofaction removes the excuses for failing. The reinventinggovernment literature calls this approach the control orempowerment strategy.13 It shifts the locus of manage-ment control away from the top of a hierarchy or centerof an organization to managers, frontline employees,and community-based organizations. But this increasedautonomy is always in exchange for greater accountabil-ity for performance.
In K-12 education, autonomy to perform has differentmanifestations. First, for example, existing schoolsneed greater freedom to act. State and federal educationcodes and district policies notoriously constrain thework of schools, preventing educators from exercisingtheir professional judgment to meet the needs of children.Second, the system as a whole needs space in whichaltogether new schools can form and thrive, what someadvocates call an open sector.14
The logic of this theory of change about how interven-tions lead to results is as follows: If incentives are pur-poseful and ample to motivate individuals; if capacityis developed so that individuals are competent andhave the ability to act; and if autonomy is decentralizedand creates adequate freedom of action—then thenecessary (though perhaps not sufficient) setting existsfor individuals to act diligently and create performancevalue. This framework provides three strategic questions
that leaders in organizations need to answer if theorganization is to grow and sustain value: Are theresufficient incentives to motivate employees to perform?Are there robust enough abilities to perform? Is thereadequate autonomy to perform?
All three elements of this outer ring are essential andwork together. A strategy that employs incentives butgives no freedom of action puts organizations (andindividuals) in a situation where they cannot reason-ably be held accountable. A strategy that gives organi-zations (and individuals) freedom but does not investin building capacity creates expectations for changewhile providing no means to meet those expectations.And a strategy that employs incentives and buildscapacity but does not provide freedom of action forcesorganizations (and individuals) to either find waysaround the rules or to rationalize inaction by blamingthe constraints. The danger of focusing on only one ortwo elements of this triad is what Hill and his colleaguescall the development of zones of wishful thinking—i.e., actions and events necessary to achieve a result buttoo often overlooked.15
The inner circle of the diagram is equally important.The incentives-capacity-autonomy framework is ageneric one—it can be applied to develop a theory ofchange to make any system a high-performing one.The inner circle of the diagram captures the Foundation’sunique point of view, which hinges on the importanceof social capital in the lives of young people. Thenotion of social capital in education, developed bysuch thinkers as James Coleman, emphasizes the roleplayed by families, communities, and other actors andinstitutions in creating an environment in whichyoung people thrive.16 Casey’s social capital point ofview places families and communities at the center inthe following ways:
Families as a Source of Competence: It would bepossible for a foundation to develop a strategy forimproving K-12 education that focused entirely onschools; indeed, many foundations have exactly thissort of strategy. One aspect of Casey’s approach that isdifferent is its focus on families as a source of compe-tence. The Foundation’s theory of change for education,
14

then, holds that a high-performing education system isone in which families are valued and engaged in a varietyof ways. Like educational systems themselves, familiesneed incentives, autonomy, and capacity to be effectivepartners in their children’s education. Incentives arethe easy part for families, since most of them have highaspirations and are already motivated to seek out whatis best for their children. Autonomy in this contextmay mean providing families with choices and optionsrather than requiring all of them to accept what is offered.And capacity may mean equipping families with theknowledge, skills, supports, and services they requireto understand their children’s needs and act on themeffectively.
Communities as a Source of Competence: Equallyimportant is Casey’s commitment to work intensivelyin certain communities. A central part of the Caseypoint of view is that strong communities provide thesupports and services families need in order to bestrong themselves. Accordingly, the Foundation’s theoryof change for education focuses on strengtheningcommunities so that they can provide these critical sup-ports and services. This is the capacity leg of the tripod.Like families, communities also need incentives to actin ways that strengthen education. Most communitymembers need little convincing about the importanceof education. But they may need inspiration, especiallyin communities where there is a legacy of failedattempts to bring about better schools. And communi-ties need freedom to act—e.g., to create new schoolswithin their neighborhoods to meet unmet needs.
Core Values
These two sets of ideas—the outer-ring’s theory ofhigh-performing systems and the inner-circle’s focuson the Foundation’s special emphasis on families andcommunities—generate a set of core values that guidesthe Foundation’s work in education:
Strong Results: Unwavering focus on achieving greatresults for families and young people. All children—including those “at risk” or from disadvantaged back-grounds—can learn to high standards that preparethem to graduate from school prepared for adult successand well-being in the worlds of work, family, and citi-zenship. Schools, individuals in schools, school systems,and others must be held accountable for the academicsuccess of all students, especially those students whohave traditionally had the least success. Schools—par-ticularly the least successful—and educators shouldhave the resources, organizational flexibility, and othersupports needed to use promising and proven practicesto achieve results for young people.
Quality Options: Creating effective educational optionsfor families and young people. Families have high aspira-tions for their children’s well-being and success. Theymust be empowered to engage appropriately in theirchildren’s learning, including being able to choose theirchildren’s schools. Schools and school systems aresocial enterprises that need forms of organization thatmix freedom of action for families, educators, andschool operators with regulated markets and some gov-ernment oversight.
Robust Connections: Ensuring that families havelasting partnerships with schools and community supports.Since social capital is such an important underpinningof child and family success, families must have strongconnections to schools, community institutions, andeach other that provide them with the services andsupports they need.
As the Casey education program considers and makesinvestments, these core values guide its thinking aboutwhat investments make sense and how to prioritizeamong competing demands. Each core value suggests aset of potential grant-making activities. Each of themalso suggests implications for a key set of public policyissues to which the Foundation should attend (seeFigure 12).
15
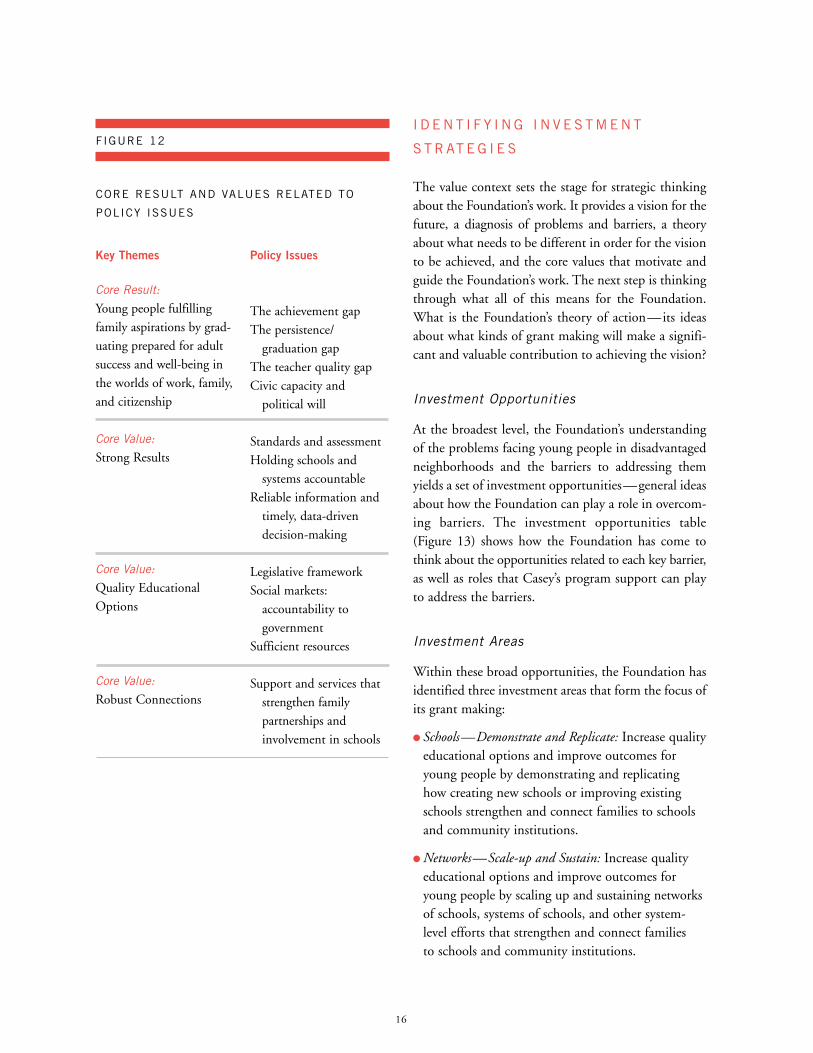
FIGURE 12I D E N T I F Y I N G I N V E S T M E N T
S T R AT E G I E S
The value context sets the stage for strategic thinkingabout the Foundation’s work. It provides a vision for thefuture, a diagnosis of problems and barriers, a theoryabout what needs to be different in order for the visionto be achieved, and the core values that motivate andguide the Foundation’s work. The next step is thinkingthrough what all of this means for the Foundation.What is the Foundation’s theory of action—its ideasabout what kinds of grant making will make a signifi-cant and valuable contribution to achieving the vision?
Investment Opportunities
At the broadest level, the Foundation’s understandingof the problems facing young people in disadvantagedneighborhoods and the barriers to addressing themyields a set of investment opportunities—general ideasabout how the Foundation can play a role in overcom-ing barriers. The investment opportunities table(Figure 13) shows how the Foundation has come tothink about the opportunities related to each key barrier,as well as roles that Casey’s program support can playto address the barriers.
Investment Areas
Within these broad opportunities, the Foundation hasidentified three investment areas that form the focus ofits grant making:
l Schools—Demonstrate and Replicate: Increase qualityeducational options and improve outcomes foryoung people by demonstrating and replicatinghow creating new schools or improving existingschools strengthen and connect families to schoolsand community institutions.
l Networks—Scale-up and Sustain: Increase qualityeducational options and improve outcomes foryoung people by scaling up and sustaining networksof schools, systems of schools, and other system-level efforts that strengthen and connect familiesto schools and community institutions.
16
Key Themes
Core Result:
Young people fulfillingfamily aspirations by grad-uating prepared for adultsuccess and well-being inthe worlds of work, family,and citizenship
Core Value:
Strong Results
Core Value:
Quality EducationalOptions
Core Value:
Robust Connections
Policy Issues
The achievement gapThe persistence/
graduation gapThe teacher quality gapCivic capacity and
political will
Standards and assessment
Holding schools and systems accountable
Reliable information and timely, data-drivendecision-making
Legislative frameworkSocial markets:
accountability to government
Sufficient resources
Support and services that strengthen family partnerships and
involvement in schools
CORE RESULT AND VALUES RELATED TO
POLICY ISSUES

17
FIGURE 13
l Organizations—Disseminate and Influence: Developknowledge and share information on lessons learned,thereby influencing others on what effective policiesand practices create quality options for youngpeople and strong connections, alliances, andpartnerships between families, schools, andcommunity institutions.
These three investment areas fit together into a frame-work for categorizing the Foundation’s educationinvestments. The first begins with schools, the placeswhere formal education happens for young people.Investments that improve the ones we have or createnew ones are the most direct way to improve outcomesfor young people in tough neighborhoods. But evenhere, the aim is beyond the individual school. The
Casey RoleProgram Investments
Young people in distressed neighbor-hoods are not ready for school andwhen they enter school their familieshave few quality educational optionsthat meet their needs and producestrong results so that they graduateprepared for adult success.
Families and young people indistressed neighborhoods lackstrong connections with schools andcommunity supports and servicesthat affiliate them with socialnetworks that nurture them asthey prepare for adulthood.
Policymakers, civic leaders, and thepublic lack good information oneffective policies and practices andpossess insufficient political will tobe effective advocates for creatingquality options and robustconnections to schools andcommunity institutions that producestrong results so young people cangraduate prepared for adult success.
Initiatives that prepare young peoplefor school and that do choice rightso as to create new educationaloptions in public education
Initiatives that create strategicalliances and partnerships of supportand services between families,schools, and community institutions
Initiatives that provide useful andtimely information on effectivepolicies and practices that influenceand build public will and civiccapacity to improve outcomesfor young people and families indisadvantaged neighborhoods
Start-up and planning support
Technical assistance support to
service providers
Capacity-building support to
community organizations
Network development support to
service and school providers
Documentation of lessons learned
Policy and data analysis support
Research and evaluation support
Advocacy support
Public will building support
Casey ViewpointKey Barriers to Core Result
Casey ViewpointKey Opportunities
ADDRESSING KEY BARRIERS: INVESTMENT OPPORTUNITIES FOR THE CASEY FOUNDATION

Foundation seeks to invest in schools in order todemonstrate what works, and to replicate what worksin multiple settings. Casey is open to numerous mech-anisms for creating and replicating schools, includingcharter schools, schools that contract with local dis-tricts, small schools forged from breakups of largerschools, or other kinds of community schools launchedat the impetus of communities. The Foundation willinvest in whatever organizational or structural arrange-ments that lead to the goal of creating quality schoolsfor young people and families.
To realize the promise of demonstrating and replicatingrequires strong networks—the next investment area.Networks enable what works in one school or place toscale-up and then sustain over time. Networks can takemany forms, but they all involve collections of schoolsor school-related organizations linked together in someway to enhance their impact. A network of schools, forexample, could be a set of schools using the sameschool design in different communities, perhaps man-aged by an umbrella group like a charter managementorganization. Or it could be a group of schools char-tered by a particular charter authorizer and then heldaccountable for the results they achieve. Or it could bea collection of schools with a similar curriculum orlearning design.
Expanding the horizon yet further is the third invest-ment area—organizations. Disseminating lessonslearned and influencing policy and practice beyond theFoundation’s direct grantees are the aims of this invest-ment area. Organizations in this category might becalled intermediaries because of the roles they play inthe middle of some value chain: recruiting great teach-ers or leaders, for example, and then connecting themwith schools in distressed neighborhoods. Or gleaninginformation from research and practice and translatingit into concrete help for policymakers and practitioners.
Examples of the three investment areas appear inFigure 14. The list of the Foundation’s 2004 grants inAppendix A at the end of this publication provides amore extensive inventory.
FIGURE 14
EXAMPLES OF GRANTEES IN THE THREE
INVESTMENT AREAS
18
(See Appendix A for a complete list.)
Schools: Demonstrate and Replicate
Indianapolis: Washington Community School SENSE Charter School
White Center: Central Heights Elementary School
Denver: Manual School Feeder Pattern; KIPP ColeCollege Prep Charter School
Networks: Scale-up and Sustain
DC: Voucher Program
Indianapolis/GIPC: Mayor’s Chartering Program
Atlanta: Project GRAD
Oakland: Bay Area Coalition of Equitable Schools:Creating New Schools in Lower San Antonio
Organizations: Disseminate and Influence
Black Alliance for Educational Options
National Council of La Raza
National Urban League
Progressive Policy Institute
National Charter School Research Center
Teach for America

Programmatic and Grant-Making Tactics
Peter Frumkin has developed ways of categorizing thetactics foundations use to carry out their strategies.17
One kind of tactic is programmatic—the programsthat a foundation supports with its grants. Casey hasidentified the following investment types that repre-sent the programmatic tactics it uses:
l Start-up and planning support
l Technical assistance support to service providers
l Capacity-building support for communityorganizations
l Network development support to service and schoolproviders
l Documentation of lessons learned
l Policy and data analysis support
l Research and evaluation support
l Advocacy support
l Public will building support
Another way of thinking about tactics relates to grantmaking. Does the foundation focus on a certaingeographic area or aim more broadly? Does it providegeneral operating support or just fund projects? Doesit work solely through grants or does it use program-related investments (PRIs)? A PRI is a different mech-anism by which a foundation can seek to achieve itspurposes. Instead of granting money, a foundationusing a PRI invests a portion of its corpus in someactivity. That investment could be a loan that is paidback over time; it could be an equity investment in anenterprise; or it could be a guarantee or some otherform of security offered.
The Foundation’s education grant-making tactics arediverse, customized to meet the needs it encounters.While it clearly has certain geographical areas of focus,it also makes investments in organizations with nationalreach and scope. It provides operating support in somecases, project support in others. The Foundation pri-marily makes grants, but it has a growing portfolio ofprogram-related investments, including two in the
education area. Casey’s approach to grant making, then,is guided much more by programmatic considerations—the kinds of programs that it aims to support—thanby restrictive ideas about the kinds of support it wantsto provide. See Appendix B for a list of 2004 investmentscategorized by investment type of program support.
M E A S U R I N G R E S U LT S
In light of its value context and investment strategies, howhas the Foundation’s education program come to thinkabout measuring the results of its work? In developingits results-measurement approach, Casey draws heavilyon Mark Friedman’s work.18 At the core of Friedman’smodel is the matrix shown in Figure 15.
The matrix includes four questions that an organiza-tion can ask in measuring its performance. In the leftcolumn are two questions about how much (quantity)the organization produced. One, in the top row, con-cerns inputs: how much service did we deliver? Theother quantity concerns outputs: how much did weproduce? Moving to the right column, the questionsshift from how much to how well (quality). Again, thefirst row measures inputs: how well did we deliverservice? The bottom row focuses on outputs: how goodwere our products?
As Friedman notes, the four quadrants are not equallyimportant. The most important is the lower right—what the organization produces (effectiveness). The leastimportant is the upper left—the quantity of inputs.When choosing performance measures, Friedman advises,organizations ought to focus their selections accordingly.
In addition, Friedman recommends that organizationsselect measures that have power, by which he means:
l Communication power: does the measure communi-cate with internal and external constituencies abouthow the Foundation is doing?
l Proxy power: does the measure match the directionof other important measures?
l Data power: do we have quality data that allow usto see progress on a regular basis?
19

F O U R T Y P E S O F P E R F O R M A N C E M E A S U R E S( w i t h e x a m p l e s )
WHAT WE DO
# Customers served# of children served by
school/district/other organization
# Activities# of workshops presented
# WITH IMPROVEMENT IN:
SKILLS # of students meeting
targets for annual progress
ATTITUDE# of families satisfied
with their schools
BEHAVIOR# of students pursuing
post-secondary education
CIRCUMSTANCE # of new schools approved/opened
HOW WELL WE DO IT
% Customers served well% of families served by
school/district/other organization
% Activities performed well% of people trained
% WITH IMPROVEMENT IN:
SKILLS % of students meeting
targets for annual progress
ATTITUDE% of families satisfied
with their schools
BEHAVIOR% of students pursuing
post-secondary education
CIRCUMSTANCE % of new schools approved/opened
effort
effect
M O S T I M P O R T A N T
I S A N Y O N E B E T T E R O F F ?
QUANTITY QUALITY
20
The Casey Approach
Based on this model, the Foundation developed anapproach for measuring the performance of its granteesand, when grantee information is collected and ana-lyzed, the individual programs as a whole. But as
Figure 16 shows, there are two distinct kinds of per-formance being measured: (1) the performance ofgrants and direct services provided, and (2) the organi-zational performance of the Foundation itself. Forboth kinds of performance, though, the questionsposed by the model are the same.
FIGURE 15
Friedman’s Performance Measurement Matrix

FIGURE 16
The Casey Foundation’s Results Model
Grants & Direct Services Performance Performance measures for each initiative, program, organization, or service funded or
operated by the Casey Foundation.
IMPACT INFLUENCE LEVERAGE
Reach Commitment
Action
Change in policies, systems,
practices, and opinions that
support strategies that work.
Investments by public and
private funders in strategies that
work.
Improvement in the success and well-being of the
families and children we
serve.
What did we do?
How well did we do it?
What difference does it make?
POPULATION LEVEL INDICATORS
Organizational Performance Performance measures for the management
of the Casey Foundation.
What did we do?
How well did we do it?
What difference does it make?
STRATEGIES(These produce a result on the indicators)
CASEY’S ROLE (The investments made that contribute to the strategies)
RESULTS
21

22
The first question—what did we do?—combinesboth of Friedman’s quantity quadrants in one. Thisquestion asks grantees to indicate the number of indi-viduals and organizations they are serving, organizedby audiences (e.g., families, students, educators, poli-cymakers, funders, etc.). It also asks them to specifythe number and types of products they have developedand disseminated and/or the types of services provid-ed, again organized by audience.
The second question—how well did we do it?—matches Friedman’s upper-right quadrant, focusing onthe quality of the grantee’s work. For example, whatpercent of the target audience evaluate the organiza-tion’s work favorably on dimensions of quality such asusefulness, timeliness, accessibility, accuracy, respon-siveness, effectiveness, respectfulness, and the like?
The third question—what difference does it make?—goes to Friedman’s lower-right quadrant, the mostimportant of the four in that it focused on effectiveness.Here is where the framework gets to results. As notedabove, Casey defines results in the three categoriesindicated across the bottom of the diagram:
l What impact are you having? Number/percentof target audience(s) that show improvement inknowledge, skill, attitude, behavior, circumstance.
l What influence are you having? Number/percentof target audience(s) influenced by products andservices advocating recommended policies, adoptingeffective practices, changing beliefs, etc.
l What leverage are you having? Percentage of Caseyfunding/non-Casey funding of total grant or projectoperating costs; amount of other resources devotedto work that supports the Foundation’s point ofview.
Figure 17 shows examples of performance measureswithin these different questions that have been developedfor the Foundation’s education investments.
FIGURE 17
EXAMPLE PERFORMANCE MEASURES
What are you doing?Number (e.g., individuals, organizations) served throughthe activities and/or services (e.g., technical assistance,training), organized by audience(s) (e.g., families,students, educators, policymakers, funders).Number and/or types of products developed and dis-seminated (e.g., reports, toolkits) and/or types of servicesprovided (e.g., training, technical assistance), organizedby audience(s) (e.g., families, students, educators,
policymakers, community organizations, funders).
How well are you doing?Percent of target audience(s) evaluating products, activi-ties, and/or services on dimensions of quality (e.g., Isthe product/activity/service accurate, timely, useful,accessible, affordable, helpful, responsive, effective,respectful, etc.?).
What impact are you having? Number/percent of target audience(s) (e.g., families, stu-
dents, educators, policymakers) that show improvement
in knowledge, skill, attitude, behavior, circumstance.
What influence are you having? Number/percent of target audience(s) influenced byproducts and services advocating recommended policies,
adopting effective practices, changing beliefs, etc.,
including evidence.
What leverage are you having?Percentage of Casey funding/non-Casey funding of totalgrant or project operating costs.
Other accomplishments and successes, including storiesand anecdotes.

One important distinction related to performancemeasures is the difference between lay and technicaldefinitions of those measures. Lay definitions are usefulbecause they can be easily grasped by a wide audience.For example, increased graduation rates could be a laydefinition of a performance measure for a programdesigned to keep young people in school. But to makethis a useful measure for accountability purposes, theFoundation and the grantee may need to agree upon amore technical definition, such as “change in the esti-mated proportion of students enrolled in the fall of 9thgrade who graduate four years later.”
Putting the Approach into Practice
When Casey makes a grant to an organization, it entersinto a grant agreement with the grantee that includes ascope of work and performance measures organizedwithin this framework. This grant agreement is legallybinding and governs the relationship between theFoundation and its grantees.
When the grantee reports back to the Foundation (usu-ally twice per year), these performance measuresbecome central organizing categories for their reports.They report to the Foundation, in essence, by explain-ing what they have done, how well they have done it,and what difference it has made in terms of impact,influence, and leverage. Not every grant will addressimpact, influence, and leverage, but grantees shouldaccount for those measures that do apply to their grant.While grantees may report other accomplishments,products, anecdotes about individuals who benefit fromtheir services, and the like, the performance frameworkis the guiding system for reporting. Figures 18-23 showsix examples of what this looks like in practice, each rep-resenting different grant-making approaches.
23

24
RESULTS EXAMPLE
The Mayor’s Chartering Effort in Indianapolis, which falls into the “scale-up and sustain” area, is an example ofthe Foundation playing a catalytic role—stimulating an activity that then yields a great deal of other activity in the city.Since 2004, the Foundation has invested nearly $570,000 in this initiative. Moreover, in 2005, Casey and the LocalInitiatives Support Corporation (LISC) have made a combined $2 million contribution to back charter school facilitiesfinancing through the Indianapolis Bond Bank, which will leverage up to $20 million from J.P. Morgan Bank inaffordable loans.
Develop and disseminate widely third annual Accountability Report
Further enhance the value-added achievement analysis of charter schools
Complete protocols for school self-study in third year and develop site visit protocols for fourth-year schools
Refine expert site visit, survey, and accountability planning processes
Finalize handbooks for all application review and accountability systems
What are you doing? Number of schools created and students served; percentage of disadvantaged students; number andtypes of tools produced for holding schools accountable
How well are you doing? Satisfaction of parents, teachers, and students; evaluations of accountability tools
What impact are you having? Impact of charter schools on academic success, using value-added measures
What influence are you having? Degree of dissemination of information about charter school performance to the publicand schools, and dissemination of tools to a national audience
What leverage are you having? Number and types of community organizations engaged in starting/operating charterschools; amount of public/private funds flowing to schools; amount of financing provided through facilities fund;amount of additional funds received by Mayor’s Office and affiliates in support of the initiative
15 new schools chartered since 2000; 10 open in 2004-05
1,967 students have new school options in 2004-05, vast majority are from low-income families in disadvantagedneighborhoods
In 2003-04, students gained ground versus peers nationally in 77% of elementary-middle subjects and grades
88% of parents satisfied with charter schools in 2003-04
Numerous key Indianapolis community organizations and leaders have become more deeply involved in publiceducation by starting and supporting charter schools
Leading national school models are operating Indianapolis charter schools, including KIPP, Big Picture Company,Outward Bound, and Lighthouse Academies
Increasing interest nationally in mayoral role in public education, including Progressive Policy Institute and NationalLeague of Cities meetings in Indianapolis in 2004
$16 million in public funds automatically flowing to charter schools in 2005-06
$11.3 million from Bill & Melinda Gates Foundation to create new high schools and break up large high schools
$1.6 million from Fairbanks Foundation to stimulate supply of new schools
$3 million + in federal charter school start-up funds to Indianapolis charter schools
$20 million in private capital loan funds now available to charter schools, backed by $1 million Casey PRI loan guarantee
Extensive private philanthropy supporting individual charter schools
Scope of Work
PerformanceMeasures and
AnticipatedAccomplishments
Results to DateImpact
Influence
Leverage
FIGURE 18

25
RESULTS EXAMPLE
Project GRAD Atlanta, which falls into the “scale-up and sustain” investment area, is an example of a wider effort towhich Casey has made a contribution. Since 2002, the Foundation has invested $950,000 in this initiative with over60 additional local and national foundations participating in this funding consortium, raising over $20 million.
Continue expansion of the Project GRAD program in the Atlanta Public Schools
Hire two college support coordinators to enhance work with Project GRAD high school seniors and past graduates
Support enhancements to the mentoring program along with visits to college campuses and the Scholars RecognitionDinner
What are you doing? Number of high school students visiting colleges and colleges visited; number of mentors and studentsmentored; number of past graduates contacted and tracked, organized by appropriate categories
How well are you doing? Percent of target audiences evaluating Project GRAD activities and services on differentdimensions of quality (e.g., usefulness, cultural appropriateness, effectiveness, etc.)
What impact are you having? Number/percent of high school graduates and post-secondary entrants; number andpercent of target audience(s) (e.g., families, students, educators, etc.) that show improvement in knowledge, skill,attitude, behavior, circumstance, etc.
What influence are you having? Number/percent of target audience(s) influenced by products and services, includingevidence of how they have been influenced (e.g., changes in policy, beliefs, practices, etc.)
What leverage are you having? Percentage of Casey funding/non-Casey funding of total grant or project operating costs
16,000 + students and 1,300 + teachers in 31 Atlanta Public Schools
274 students graduate from Booker T. Washington in 2004—largest graduating class in the past 15 years; 121 studentsenroll in post-secondary education fall 2004
18 seniors in the SAT 1000 + Club
153 graduates receive Brumley Scholarships of $4,000
117 receive Hope Scholarships
$6 million + in scholarship aid
Double passing rates from 2000 to 2003 on Georgia state tests
4th grade reading scores in cluster schools up by an average of 35 percentage points from 2000 to 2003 on state tests
6th grade reading scores in cluster schools up by an average of 20 percentage points from 2000 to 2003 on state tests
Project GRAD expanded to Carver and South Atlanta cluster of 18 schools
Project GRAD now being implemented in 12 districts across the United States
60 + national and local foundations are part of Project GRAD funding consortium, raising over $20 million
Atlanta Public School System integrating Project GRAD costs into its operational budget
Scope of Work
PerformanceMeasures and
AnticipatedAccomplishments
Results to DateImpact
Influence
Leverage
FIGURE 19

26
RESULTS EXAMPLE
Center for Policy Studies, which falls into the “disseminate and influence” area. Since Minnesota has shown his-toric leadership on bringing more options for families, the Foundation’s investment in Minnesota has the potential toinfluence what happens nationally. Since 1999, the Foundation has invested nearly $1 million in two projects of theCenter: the current Education Evolving (since 2003) and the former Charter Friends National Network, now theNational Alliance for Public Charter Schools (from 1999 to 2003).
Provide capacity-building assistance and support advocacy efforts that influence improved practices for creating an opensector of new schools, especially in Foundation sites
Plan and conduct national meetings on public education’s growing open sector of new schools, and producingpublications on the subject
Produce policy briefs, analysis, and documentation of lessons and provide models and technical assistance that influencethe national discussion on creating new schools
Support advocacy and information campaigns to influence public policies that create supportive environments for newschooling options, especially in Foundation sites
What are you doing? Number of individuals, organizations, states, districts served and/or reached through Casey-supported open sector products, activities, and/or services, organized by audiences; number of Casey-supported opensector products developed and disseminated and/or types of services provided, organized by audiences
How well are you doing? Percent of customers/target audiences evaluating Casey-supported open sector products,activities, and/or services on different dimensions of quality
What influence are you having? Number/percent of Casey-supported customers/target audiences that show improvementin knowledge and opinions about the open sector; number/percent of individuals and/or target audiences influenced
What leverage are you having? Percent of Casey/non-Casey funding of total grant or project operating dollars
11 publications, 3 mass e-communications to 1,500 + policymakers and practitioners
15 presentations by project leaders reach 2,000 + policymakers and practitioners
100 + policymakers and practitioners attend four open sector meetings (two national, two in MN)
80 + teachers, teacher organizations, and districts get help creating teacher professional practice schools
Partnership with Harvard Business School’s Clay Christensen results in his:– Lead participation in two national forums for 30 top education leaders– Commitment to co-author reports applying his research on innovation to education– Appearance at major national venues such as ECS National Forum in July 2005
Minnesota policy influence:– Number, range, and quality of charter school sponsors expand in Minnesota– Quality Teaching Coalition launched to create interdisciplinary teaching license – Broad coalition of charter/new school supporters assisted in framing initiatives on facilities, transport, special
education, extra-curriculars, and other issues
Three funders commit nearly $400,000 to the open sector initiative for 2005
Minnesota Department of Education commits $175,000 to charter sponsorship
Scope of Work
PerformanceMeasures
and Anticipated
Accomplishments
Results to DateInfluence
Leverage
FIGURE 20

27
RESULTS EXAMPLE
The DC Public Charter School Cooperative is a “demonstration” investment designed to help charter schoolsdeliver services for children with disabilities in a new way. Since 2000, the Foundation has invested $525,000. It isalso an example of a project with great leverage: the cooperative has been able to arrange Medicaid reimbursement forthe schools, a feat no one school would likely have accomplished alone.
Provide technical assistance, professional development, and direct service programs to member charter schools, theirstudents, and families in Washington, DC
Implement year two of the Parent Involvement Initiative and the Student Voice Project
Assist charter schools in the application process that leads to eligibility for Medicaid reimbursement
Implement next phase of the information management and billing system that gathers data for schools involved inMedicaid reimbursement program
Continue to develop relationships with the Office of Special Education in DC district schools, especially as this relatesto cooperative training for both charter and district special education issues
Document the work of the Cooperative and disseminate lessons learned, thereby expanding its influence as a successfulmodel of how to deliver special education services to charter school students and families
What are you doing? Number of students, teachers, and families participating in activities, organized by type of activity;number and types of products developed and disseminated and/or types of services provided (e.g., training, technicalassistance, etc.), organized by audiences (e.g., families, students, educators, policymakers, community organizations,funders, etc.)
How well are you doing? Percent of target audience(s) evaluating products, activities, and/or services on differentdimensions of quality (e.g., usefulness, cultural appropriateness, effectiveness, etc.)
What impact are you having? Number/percent of target audience(s) (e.g., families, students, educators, policymakers,etc.) that show improvement in knowledge, skill, attitude, behavior, circumstance, etc.
What influence are you having? Number/percent of target audiences influenced by Foundation-supported products andservices, including evidence of how they have been influenced (e.g., changes in policy, beliefs, practices, etc.)
What leverage are you having? Percentage of Casey funding/non-Casey funding of total grant or project operating costs
300 + general education teachers in charter schools trained to better serve students with special needs
20 + special educators in charter schools receive support and technical assistance
21 students in three charter schools participate in best practice projects
Cooperative merges with the newly formed DC Public Charter School Association, increasing number of charterschools served from 17 to 42
42 charter schools have an advocate representing them on the DC State Education Office Special Education Task Force
Cooperative model replicated in at least six other jurisdictions
Cooperative model presented at National State Directors of Special Education Summit
$25,000 to develop and replicate a mentoring program for students with disabilities
Cooperative represents all DC charter schools in the development of the state improvement grant; receives $150,000over five years
Eight schools receive Medicaid numbers giving them access to tens of thousands of dollars in Medicaid reimbursements
Scope of Work
PerformanceMeasures
and Anticipated
Accomplishments
Results to Date Impact
Influence
Leverage
FIGURE 21

28
RESULTS EXAMPLE
The Washington Scholarship Fund, is a “scale-up” investment in support of the District of Columbia’sOpportunity Scholarship Program, a publicly funded voucher program that is part of a “three-sector” school improvementapproach that involves increased financial support for district, charter, and private schools. It is helping to determineon the ground how to create quality options for families at scale—i.e., how to do choice right. Moreover, as part of athree-sector initiative, it holds promise as a method of maximizing family options in other cities. The Foundation hasinvested $450,000 since 2004.
Create a scholarship program team to manage outreach to families, students, and schools in the program
Provide information, advice, support, and assistance to families applying to the program, using a variety of methodsand approaches including information and application sessions and school fairs
Work with DC Public Schools to inform families of their school choice options under the program
Conduct a media outreach and information campaign for the program
Expand the role of the program website
Oversee counseling and other support services to participating students and families, creating the partnerships neededto provide these services
What are you doing? Number of individuals served through the program, including number and types of schools in theprogram
How well are you doing? Percent of customers/target audiences evaluating Casey-supported open sector products, activities,and/or services on different dimensions of quality, including usefulness, cultural appropriateness, effectiveness, etc.
What impact are you having? Number/percent of Casey-supported customers/target audiences (e.g., families, students,educators, policymakers, etc.) that show improvement in knowledge and opinions about the open sector
What influence are you having? Number/percent of individuals and/or target audiences influenced by open sector productsand services, including evidence of how they have been influenced (e.g., changes in policy, beliefs, practices, etc.)
What leverage are you having? Percent of Casey/non-Casey funding of total grant or project operating dollars
1,000 + students enrolled in 53 schools for 2004-2005, with average household income less than $19,000
2,800 + applications accepted for 2005-2006, nearly 1,000 from schools “in need of improvement”
66 participating schools in 2005: 17 independent schools, 22 Catholic schools, 13 other faith based, 14 non affiliated;up from 53 schools in 2004
How others do choice right: partnerships with DC State Education Office, DC Public Charter School Association, DC Public Schools, Greater Washington Urban League to publicize the program and raise awareness of new K-12 optionsfor low-income families
Advocacy: created Parent Empowerment Group, support and advocacy group for families of scholarship recipients
Recruitment: 60 + neighborhood meetings and two citywide meetings; thousands of flyers; two mailings to DCPS stu-dents (77,000 + pieces); two mailings to charter school students (33,000 + pieces); mailing to all TANF recipients;radio ad campaigns (400,000 + listeners); movie screen ads (3,000 times at theaters)
Family Support: new staff hires; developed parent resource groups; monitoring students having difficult transition;special targeted support for 51 8th graders who will graduate; hotline for any questions
School Support: daily, individualized outreach to DC non-public schools on many issues, including ensuring paymentsare made on time and fee processes work smoothly
$12.1 million from US Department of Education for scholarships and $375,000 for operations and family support
$900,000 from Walton Family Foundation
$10,000 from Alliance for School Choice
Scope of Work
PerformanceMeasures
and Anticipated
Accomplishments
Results to Date Impact
Influence
Leverage
FIGURE 22

29
RESULTS EXAMPLE
Foundations Inc./Philadelphia Charter Schools, which falls into the “scale-up” category, is an investment thatsupports many different types of technical assistance to Philadelphia’s public charter schools and to the NeighborhoodSchools Network of the School District of Philadelphia. Since 1998, the Foundation has invested $2.625 million inthis work.
Provide technical assistance, business, and finance services to charter schools
Further develop accountability and planning tools for charter schools
Increase supports for students, parents, and communities in charter and other schools
Continue to expand Foundations’ geographic reach for services and tools
What are you doing? Number of charter and other school planning grant applications written and approved byPennsylvania Department of Education; number of charter applications written and approved by charter authorizers
How well are you doing? Percent of target audience(s) evaluating activities and services on different dimensions of quality
What impact are you having? Number/percent of target audience(s) that show improvement in knowledge, skill, attitude,behavior, circumstance, etc. (e.g., percent increase from 2004 of high school seniors graduating from schools managedby Foundations)
What influence are you having? Number/percent of target audience(s) influenced by products and services, includingevidence of how they have been influenced
What leverage are you having? Percentage of Casey funding/non-Casey funding of total grant or project operating costs
Philadelphia Charter Schools33 new charter schools, 15,000 + students, 1,300 + teachersManage $45 million combined budget of 13 schools
School District of Philadelphia “Neighborhood School Network” 4,400 + students, 400 + teachers and staffFour of the seven schools reached annual yearly progress (AYP) in 2004Significant increase from 2002–2005, in the aggregate, of students scoring above the national
average in all grades tested and in all areas on the TerraNovaSteady decrease from 2002–2005, in the aggregate, of the percent of students scoring in the bottom
quartile on all areas tested on the TerraNova8% increase in daily student attendance at M.L. King High School (2004–2005)Significant decrease in serious incidents/student arrests at M.L. King High School
42 planning grants awarded to Philadelphia charter school founders in seven years29 charter applications approved over the past eight years500 + teachers and administrators enrolled in Foundations’ programs over four years Innovative hybrid management model for M.L. King High School with Philadelphia Federation
of Teachers and School District of Philadelphia
Leadership and teacher coaching to 20 underperforming high schools under the Pennsylvania High School Coaching Initiative, funded by the Annenberg Foundation
Assist in the start up of state charter school research centers and state charter school associationsin three states through public and private funding
Start-up and ongoing technical assistance to more than 50 charter schools nationally
Scope of Work
Performance
Measures and Anticipated
Accomplishments
Results to DateImpact
Influence
Leverage
FIGURE 23
30
There are challenges associated with measuringimpact, influence, and leverage. Impact is often hard todiscern, especially when a program or service is one ofmany factors that affect a result. In these cases, whichare typical, it is perhaps best to think about the contri-bution a program or activity made to the overallimpact observed, since the overall impact cannot beattributed to any one agent. Leverage, too, can be com-plicated to measure. It is relatively easy to total upother public and private dollars flowing to a givenactivity, but how much of that was truly leveraged bythe Foundation’s investment? In other words, howmuch of that additional money would not have flowedin without Casey’s investment? These questions aredifficult to answer with precision.
Of the three results categories, influence is arguably themost difficult to measure. Casey has developed severaltools to make this easier. One is a way of breaking downthe idea of influence into three levels or components:
l Reach: How many people did we contact?
l Commitment: Are people convinced and dedicated?
l Action: Did people do something positive as a resultof our activities?
Another is a toolkit developed by OrganizationalResearch Associates for the Foundation on measuringinfluence and leverage.19 One central part of the hand-book is a typology of influence-related outcome areas,including:
– Changes in visibility of issue
– Changes in community norms
– Changes in partnerships
– Changes in public will
– Changes in political will
– Changes in policies
– Changes in regulations
– Changes in service practice(s)
– Changes in business practices
Each of these outcome areas could include specificmetrics that grantees could use to measure the influ-ence they are having. For example, changes in visibilityof an issue could be measured by the number, placement,and length of articles about the issue appearing duringsome time frame. Changes in public will could bemeasured by changes in voters’ responses to a set of rel-evant questions on an annual telephone survey.
Value of the Results-Based AccountabilityFramework
How is this framework helpful, and how can it be evenmore helpful as it develops and matures? Here aresome of the emerging benefits for the Foundation andits grantees:
l Refining the strategic focus of the education program.This framework has required the education pro-gram to think very carefully about the entire valuechain, from vision through barriers to theory ofchange to investment strategies to what counts assuccess. This systematic thinking forces decisions,prioritization, and the like, sharpening the focus ofgrant making over time.
l Guiding selection of investments. Knowing what theprogram wants to achieve helps staff decide whetherparticular candidates for investment fit. This doesnot necessarily mean that something that does notfit, is never considered for an investment. There arealways exceptions to the rules. But good reasons areneeded for doing this.
l Helping grantees sharpen their focus. By askinggrantees to develop plans for measuring perform-ance and results in this framework, the processengenders the same kind of careful thinking ingrantees that the Foundation itself has had to do.The result is more focused planning on the partof grantees.
l Evaluating specific investments. Perhaps the mostobvious use, this is clearly a core purpose of thesystem. Investment-specific evaluation can spurimprovement in grantee performance and help theFoundation decide whether and how to continueinvesting in particular grantees.

31
l Evaluating the portfolio as a whole:
– Completeness and coverage. Investments can be cat-egorized by the various category schemes outlinedhere (what barriers they address, how they fit intothe theory of change, what investment areas/purposes they fall into, what types of investmentthey are, what results they aim to achieve) as wellas other categories (e.g., geography). Investmentscan also be categorized by whether they are smallinvestments or large ones, whether they are riskyor more conventional, and along other importantdimensions. This sorting allows the Foundationto see what components of the overall frameworkare under- and overrepresented.
– Results. Rolling up individual grantee results tothe investment area level or to the portfolio levelallows the education program to hold itselfaccountable for overall performance and results.In addition, this approach makes it possible toreport results across multiple grants. One of thechallenges, however, lies in aggregating the resultsin a way that goes beyond just reporting on a
large number of individual grants. Still, theframework has value in its consistency ofreporting across all grants.
The education program describes the usefulness of theprocess as a value chain depicted in the diagram below(Figure 24). The chain illustrates the progression fromthe Foundation’s value context to its proposed work,leading to accomplishments and results that ultimatelyproduce social value. This social value is the way in whichthe world is made better by the investments that theFoundation makes in the education activities it supports.It is the public good added to society when an enterprisethat the Foundation supports makes a contribution topreparing young people for adult success and well-beingin the worlds or work, family, and citizenship. At thebottom of the chart, an arrow loops back: what theFoundation learns about its investments and invest-ment processes feeds back to inform its thinking aboutwhat to do next. This continuous learning cyclestrengthens the Foundation’s work over time, yieldingmore social value in the long term.
FIGURE 24
The Foundation Investment Value Chain
DefineValues & Beliefs
ResourcesProcesses
Interventions Doing What?
Assumptions Investments Activities Quantity Quality Effectiveness
VALUE CONTEXT PROPOSED WORK ACCOMPLISHMENTS & RESULTS
PARTNERS PERFORMANCE MEASURES
HowWell?
WhatDifference?
Perfomance Feedback Loop May Change
SocialValue

C O N C L U S I O N S A N D L E S S O N S
L E A R N E D
This pilot activity in results-based accountability hasled to several valuable lessons learned.
Begin at the End with Results
1. Start with results and a performance mantra. Creatinga Foundation Investment Summary forced clarityabout the relationship between investments, strategies,and results. The key starting point was the distinctionbetween a portfolio level result (population accounta-bility) and individual program results (program account-ability). In retrospect, this is more difficult than itseems but it is commonsensical. Performance measuresare numbers and/or percentages about a program,agency, or service that answer three questions: What dowe do? How well do we do it? What difference did wemake in terms of impact, influence, and leverage? Theclarity coming from this exercise leads to Foundationtransparency, structures all conversations between theFoundation and its grantees, creates a more lucid strategyand disciplined execution, and provides a frameworkfor reporting on investment results.
2. Not all investments achieve every type of result. It isoften the case that a portfolio has many small invest-ments from which a larger result may materialize. Donot seek major results from investments that involve alimited financial investment. That may happen.However, assuming that this is usually the case willfrustrate both the Foundation program officer and theinvestment partner grantee.
Process Matters
3. Relationships and context matter when seeking results.Involving investment partner grantees in results-basedaccountability takes far more time than going it alone.Context makes a difference in agreeing with invest-ment partners about what results are to be achieved.Working with them has led to important insights,anchored the process in reality, and kept carping andnon-cooperation to a minimum. Discussions withgrantees about the local context and the environment
32
USING LETTERS OF AGREEMENT TO
DRIVE RESULTS
In general, the Foundation uses a generic
reporting scheme for grantees. It usually asks
for a mid-year and final progress report on the
activities done to achieve the scope of work as
summarized in the letter of agreement and
what barriers the grantee encountered in trying
to achieve the scope of work. There was a
major problem with this approach: the informa-
tion provided by grantees reflected more what
they wanted to convey about the hard work
they were doing than what the Foundation
needed to know to make a fair judgment about
whether the investment we made was achieving
what we hoped for. Moreover, without some
sense of progress made on agreed-upon meas-
ures of performance, it was nearly impossible
to determine how the Foundation might help
the grantee succeed when it did encounter
problems in its work. Letters of agreement
that include a scope of work and mutually
agreed-upon performance measures lead to
common expectations from the start and a
basis for every conversation Foundation staff
members have with the grantee. It also makes
it easier to have some data that function as
leading indicators of possible implementation
problems in the agreed-upon scope of work.

33
help determine what results matter most at what time.It has made accountability a joint effort at being trans-parent in expectations, problems, disappointments,and results.
4. Communicating results is about more than numbers.Not everything a donor needs to know about aninvestment is a performance measure that produces anumerical metric. There are accomplishments, lessonslearned, and compelling good stories that communi-cate something about the results that are achieved andthat give life to results reporting. All this informationis important in communicating results and developinga compelling and focused message about the Foundation’sinvestment achievements.
SURVEYING GRANTEES TO IMPROVE
GRANT MAKING
In 2005, the Foundation’s education program
surveyed its grantees using an online survey.
Part of the instrument gathered information
from grantees on their activities and results. But
the survey also asked grantees to evaluate the
Foundation itself on a range of dimensions,
including:
l how well it communicates its vision and
results framework;
l how burdensome its reporting and monitoring
requirements are;
l how well the performance agreement specifies
both parties’ roles and responsibilities; and
l how accessible and useful the education
program’s staff and other resources have been.
DIFFERENT CONTEXTS, SIMILAR AIMS
In four different Making Connections sites
(Indianapolis, Oakland, White Center, Denver),
Casey has made planning grant investments.
The purpose of the investments across all four
sites was the same: to support a community
organizing effort that included an outreach
and recruitment effort to families in Making
Connections neighborhoods. The focus of this
activity was to inform families that their child
was eligible to enroll in the new school that
was to open or in the existing school that was
being restructured. The context in each of
these cities was different: different actors,
different public authorities overseeing schools,
different requirements for the processes they
were to use, and different approaches to com-
munity organizing, outreach, and recruitment.
For example, the effort in Indianapolis involved
a charter school process that included working
with the Mayor’s Office. The effort in Oakland
led to new district schools that have far less
autonomy than charters and involve close work-
ing relationships with the school district. The
effort in White Center involves a new school
that has a performance agreement with the
school district since there is no charter school
law in Washington State. The effort in Denver
involved a district school that was restructured
and is now under the control of the state, which
has reconstituted it as a charter school. The
context led to different expectations and different
performance measures, though there was some
similarity in some of the measures.

Improving the Investment Process
5. Sustainability is not a natural act and must includecapacity building. Not every investment produces a sus-tainable program or thought about how to sustainresults. But neither should the opposite be assumed: aninvestment will automatically produce a sustainableprogram, activity, or set of results. Thinking aboutresults as this relates to leveraging the Foundation’sinvestments includes talking with investment partnersabout program and results sustainability sooner ratherthan later. The Foundation’s ability to do results-basedaccountability in partnership with the Foundation’sinvestment partners requires assistance and feedbackfrom different sources—peers at the Foundation, con-sultants to the Foundation, and professional developmentinvestments and training for staff by the Foundation.In addition, it requires assistance—capacity develop-ment—for our investment partner grantees.
6. Create a learning agenda. Failure is a result. Someinvestments do not achieve the positive results thatwere sought. Some achieve mixed results. Admit thisand make the lessons learned part of the investmentprogram’s learning agenda.
This last lesson is in many ways the most importantbecause it serves as a reminder of why results-basedaccountability is, in the end, so vital in philanthropy.In the midst of the tedium of performance measuresand reporting requirements and statistics, it is easy tolose sight of the ultimate purpose of all of this activity,which is to help the Foundation and its partners max-imize the amount of social value they create throughtheir work together.
34
OUT OF FAILURE, HOPE
The community organizing work around Cole
Middle School in Denver is a good example of an
initial failure to reform a district school that now
may lead to a new charter school for the families
in the Making Connections neighborhood. The
purpose of the original grant nearly four years
ago was to mobilize parents to pressure the
Denver School District to improve the teaching
and learning conditions at Cole Middle School.
While there was partial success in improving
safety at the school, the academic program
showed only minor improvement over the course
of three years. This led the state to take over
Cole Middle School and reconstitute it as a
charter school. The families voted to adopt the
Knowledge in Power Program (KIPP) model for
the school, one of the most successful school
models in the country. The school will open in
2006, with 2005 serving as a transition year.
Casey is now supporting KIPP outreach and
school recruiting efforts to families that are in
the Making Connections neighborhood.

35
1American Enterprise Institute, for example, sponsored a major confer-
ence in spring 2005 on education philanthropy that resulted in the
book, With the Best of Intentions: How Philanthropy Is Reshaping K-12
Education, edited by Frederick Hess and published by Harvard
Education Press.
2For a recent example of this, see Grantmakers for Education’s (a
national network of 200 donors investing in education) Principles for
Effective Education Grantmaking, www.edfunders.org.
3For more information about the Making Connections initiative, see
www.aecf.org/initiatives/mc.
4Speech by Douglas W. Nelson, President of the Annie E. Casey
Foundation, at an All Staff Retreat held in the spring of 2002, p. 4.
5Williams, Harold S., Arthur Y. Webb, and William J. Phillips,
Outcome Funding: A New Approach to Targeted Grantmaking,
Rensselaerville Institute, NY: 1996. Friedman, Mark, A Guide to
Developing and Using Performance Measures in Results-Based Budgeting,
The Finance Project, Washington, DC: 1997. See Friedman’s website
for numerous publications and other tools: www.raguide.org or
www.resultsaccountability.com. Frumkin, Peter, Philanthropic
Strategies and Tactics for Change: A Concise Framework, The Aspen
Institute, Washington, DC: 2002.
6National Assessment of Educational Progress (NAEP) results can be
found at http://NCES.ed.gov/nationsreportcard/ltt/results2004/.
7“Achievement in America” presentation by the Education Trust Inc.,
2003, www2.edtrust.org/EdTrust/Product+Catalog/browse2.htm#k16.
8Ibid.
9Hill, Paul T., Christine Campbell, and James Harvey, It Takes a City:
Getting Serious About Urban School Reform, Brookings Institution
Press, Washington, DC: 2000; Osborne, David, and Peter Plastrik,
Banishing Bureaucracy: The Five Strategies for Reinventing Government,
Addison Wesley, Reading, MA: 1997.
10This version of the threefold perspective derives from the idea of the
strategic triangle for government managers. See the following: Mark
H. Moore, “Managing for Value: Organizational Strategy in For-
Profit, Nonprofit, and Governmental Organizations,” in Nonprofit
and Voluntary Sector Quarterly, Vol. 29, No. 1, Supplement 2000, 183-
204; L. David Brown and Mark H. Moore, “Accountability, Strategy,
and International Nongovernmental Organizations,” in Nonprofit and
Voluntary Sector Quarterly, Vol. 30, No. 3, September 2001, 569-587;
Mark H. Moore, The Public Value Scorecard, Harvard University
Hauser Center for Nonprofit Organizations, Working Paper 18, May
2003. For an application of this strategic triangle to charter schools,
see Peter Frumkin, Creating New Schools: The Strategic Management of
Charter Schools, The Annie E. Casey Foundation, Baltimore: 2003.
11Roza, Marguerite, and Paul T. Hill, How Within-District Spending
Inequities Help Some Schools Fail, working draft presented at the Brookings
Conference “The Teachers We Need,” Center for Reinventing Public
Education, Washington, DC: May 2003, www.crpe.org/workingpapers/
pdf/Roza-Hill.pdf.
12Osborne and Plastrik, 531-609.
13Osborne and Plasrik, 389-530.
14Open Sector: Creating a Positive Environment for Creating Schools New,
Education/Evolving, www.educationevolving.org/pdf/EEOpenSector.pdf.
15Paul T. Hill and Mary Beth Celio, Fixing Urban Schools, Brookings
Institution Press, Washington, DC: 1998, p. 17.
16James S. Coleman, “Social Capital in the Creation of Human Capital,”
American Journal of Sociology Supplement, 94, 1988, S95-S120.
17Frumkin, Peter, Philanthropic Strategies and Tactics for Change: A
Concise Framework, The Aspen Institute, Washington, DC: 2002.
18Friedman, Mark, A Guide to Developing and Using Performance
Measures in Results-Based Budgeting, The Finance Project, Washington,
DC: 1997; Friedman, Trying Hard Is Not Good Enough How to Produce
Measurable Improvements for Customers and Communities, Trafford
Publishing: 2005.
19A Practical Guide to Documenting Influence and Leverage in Making
Connections Communities, prepared by Organizational Research Services,
Seattle: 2004.
E N D N O T E S

36
A P P E N D I X A
The Annie E. Casey Foundation’s 2004 Education Investments
This list of the Foundation’s 2004 education investments is organized by the Foundation’s three investment funds.Much of the work is in support of the Foundation’s Making Connections initiative, discussed earlier in this report.
F U N D 1
INVESTMENTS IN SCHOOLS
PURPOSE: To increase quality educational options and improve outcomes for young people by creating new schoolsor by improving existing schools that strengthen and connect families to schools and community institutions.
Central Indiana Community Foundation for theCenter for Working Families at GeorgeWashington Community School
Indianapolis, Indiana
$25,000 To support the creation of a school-based prototypeCenter for Working Families
KIPP Foundation for the KIPP Key Academy inWashington, D.C.
San Francisco, California
$50,000 To support a family and community outreachcoordinator at KIPP Key Academy
Living Classrooms Foundation
Baltimore, Maryland
$40,000 To support a planning and implementation effort oncommunity outreach at Crossroads School
Marymount Academy
Santa Barbara, California
$15,000 To support a Casey Family Legacy studentscholarship
METRO Organizations for People
Denver, Colorado
$25,000 To support a parent organizing project in theManual school feeder pattern
New Song Urban Ministries for New SongAcademy Public School
Baltimore, Maryland
$85,000 To support the integration of the ExpeditionaryLearning Outward Bound school design with theCalvert curriculum
TECH High Foundation
Atlanta, Georgia
$100,000 To support planning and implementation activities,including a family and community outreachcoordinator
TOTAL $340,000

37
F U N D 2
INVESTMENTS IN NETWORKS AND SYSTEM-LEVEL REFORM EFFORTS
PURPOSE: To increase quality educational options and improve outcomes for young people through school networks,systems of schools, and other system-level efforts that strengthen and connect families to schools and communityinstitutions.
Bay Area Coalition for Equitable Schools(BayCES)
Oakland, California
$75,000 To support technical assistance to the schooldistrict’s small schools in Lower San Antonio inthe Oakland School District
DC Public Charter School Special EducationCooperative
Washington, D.C.
$75,000 To support special education services to childrenand families and the development of a Medicaidreimbursement system for services
Fight for Children
Washington, D.C.
$150,000 To support a planning and implementation effort oncreating a District of Columbia Parent ResourceCenter and network of supporting organizations
Foundations, Inc. Technical Assistance Center forPublic Charter Schools
Philadelphia, Pennsylvania
$350,000 To support technical assistance in the design,development, and operation of high-quality schoolsof choice in the Philadelphia School District
Fund for Educational Excellence
Baltimore, Maryland
$250,000 To support the redesign of neighborhood high schoolsand the creation of new Innovation High Schools inthe Baltimore School District
Greater Indianapolis Progress Committee
Indianapolis, Indiana
$125,000 To support the development of a comprehensivecharter school authorizing and accountabilitysystem administered by the City of IndianapolisMayor’s Office
Institute for Responsive Education
Boston, Massachusetts
$50,000 To support the Boston Parent Organizing Network
Marquette University
Milwaukee, Wisconsin
$300,000 To support a comprehensive school design anddevelopment center for schools of choice inMilwaukee
Project GRAD
Atlanta, Georgia
$250,000 To support implementation of the Project GraduationReally Achieves Dreams (GRAD) Program in theAtlanta School District
Robert W. Woodruff Arts Center
Atlanta, Georgia
$75,000 To develop resource materials for students andteachers using the High Museum’s collections
San Diego City Schools
San Diego, California
$200,000 To support the communications, engagement, andoutreach effort of the San Diego School District’sBlueprint for Student Success to families, staff, andthe community
TOTAL $1,900,000

38
F U N D 3
INVESTMENTS IN COMMUNITY AND NATIONAL INTERMEDIARIES
PURPOSE: To increase knowledge and share lessons learned, thereby influencing others on effective policies andpractices that create quality options and improved outcomes for young people by strengthening alliances, partner-ships, and connections between families, schools, and community institutions.
ACLU Foundation of Maryland
Baltimore, Maryland
$85,000 To support policy analysis and advocacy for theBaltimore City School District’s improvement efforts
Alianza Dominicana
New York, New York
$80,000 To support La Plaza as a Beacon demonstrationand technical assistance site
American Institutes for Research/New AmericanSchools
Washington, D.C.
$125,000 To support the documentation of the Foundation’seducation investments and development of a peerlearning network among the Foundation’s educationinvestments
Association of Baltimore Area Grantmakers
Baltimore, Maryland
$5,000 To provide staff support for the BaltimoreEducation Funders Affinity Group
Baltimore Education Network
Baltimore, Maryland
$60,000 To support family outreach activities within theBaltimore City School District
Black Alliance for Educational Options
Washington, D.C.
$35,000 To support the annual meeting of the Alliance
Brookings Institution
Washington, D.C.
$125,000 To support the National Working Commission onChoice in K-12 Education
California Tomorrow
Oakland, California
$50,000 To support technical assistance to Foundationgrantees on school readiness issues for immigrantfamilies
Center for Policy Studies
St. Paul, Minnesota
$150,000 To support policy analysis and capacity-buildingassistance to initiatives that create charter andother types of new schools
Charter School Leadership Council
Washington, D.C.
$100,000 To support planning, start-up, and implementationactivities of the Council
Civic Builders
New York, New York
$100,000 To support documentation of lessons learned byCivic Builders in nonprofit charter school facilitiesdevelopment
Council of the Great City Schools
Washington, D.C.
$10,000 To support the San Diego School District reviewprocess

39
Education Trust
Washington, D.C.
$75,000 To support activities that advance schoolimprovement efforts with parents and communitygroups
Fund for the City of New York
New York, New York
$250,000 To support technical assistance to the New York CityBeacons and to evaluate the Beacons program
Georgetown University Institute for Public Policy
Washington, D.C.
$150,000 To support a qualitative evaluation of the effects ofthe District of Columbia Opportunity Scholarship andParental Choice Program on families, students, andother community members
Grantmakers for Education
Portland, Oregon
$25,000 To support an institute on education grant making asthis relates to changing public policy and buildingpublic will
GreatSchools.net
San Francisco, California
$35,000 To support a pilot program that strengthens the abilityof low-income families to be involved in data-drivenschool improvement
Harlem Children’s Zone
New York, New York
$80,000 To support the Countee Cullen Community Centerand the Booker T. Washington Beacon School asdemonstration and technical assistance sites
Interfaith Education Fund
Austin, Texas
$250,000 To support school improvement activities in Texasschool districts
Jehl Consulting
Annapolis, Maryland
$26,000 To support the documentation of the Foundation’seducation investments and provide technicalassistance on implementing the Foundation’sStrengthening Families and StrengtheningSchools Toolkit
National Council of La Raza
Washington, D.C.
$125,000 To support technical assistance to and developresource materials for schools serving Latino studentsand their families
National Urban League
New York, New York
$100,000 To support the Campaign for African-AmericanAchievement and the Community and FamilyDevelopment Institute
NCB Development Corporation
Washington, D.C.
$21,500 To support the revision of Charter School Facilities:A Resource Guide on Development and Financing
New Leaders for New Schools
New York, New York
$85,000 To support a documentation and evaluation activityfor New Leaders for New Schools
NewSchools Venture Fund
San Francisco, California
$150,000 To support NewSchools documentation of lessonslearned and the NewSchools annual summit
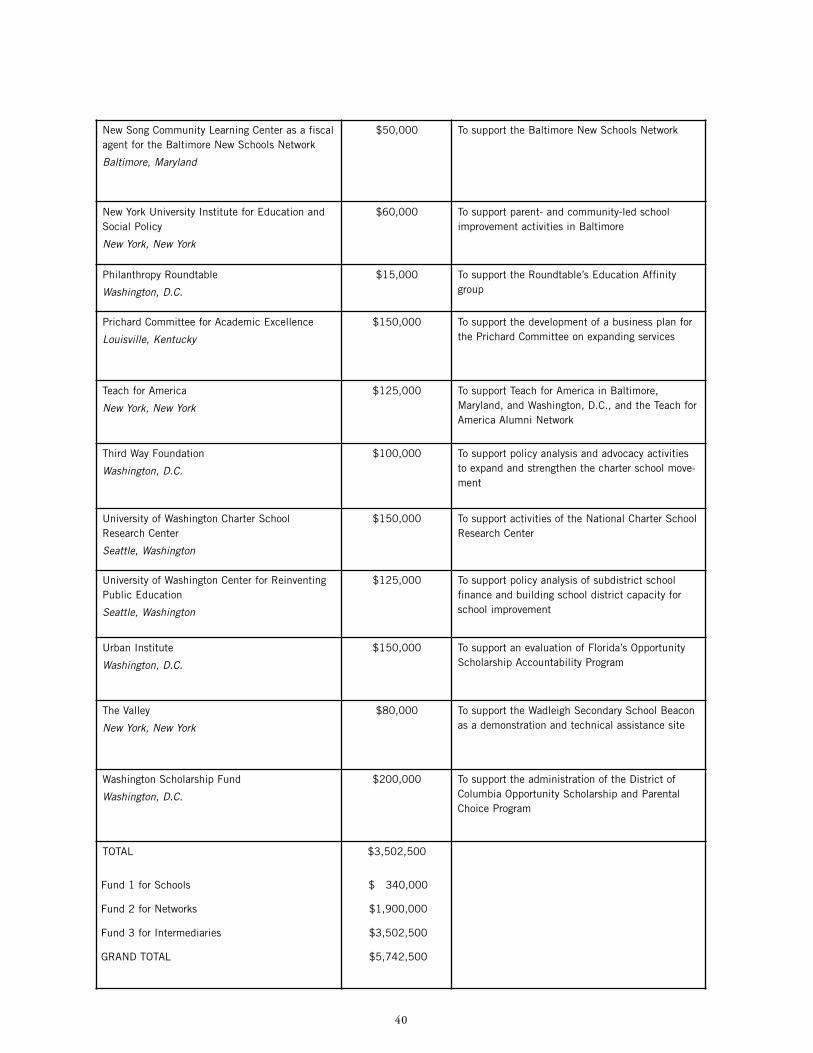
40
New Song Community Learning Center as a fiscalagent for the Baltimore New Schools Network
Baltimore, Maryland
$50,000 To support the Baltimore New Schools Network
New York University Institute for Education andSocial Policy
New York, New York
$60,000 To support parent- and community-led schoolimprovement activities in Baltimore
Philanthropy Roundtable
Washington, D.C.
$15,000 To support the Roundtable’s Education Affinitygroup
Prichard Committee for Academic Excellence
Louisville, Kentucky
$150,000 To support the development of a business plan forthe Prichard Committee on expanding services
Teach for America
New York, New York
$125,000 To support Teach for America in Baltimore,Maryland, and Washington, D.C., and the Teach forAmerica Alumni Network
Third Way Foundation
Washington, D.C.
$100,000 To support policy analysis and advocacy activitiesto expand and strengthen the charter school move-ment
University of Washington Charter SchoolResearch Center
Seattle, Washington
$150,000 To support activities of the National Charter SchoolResearch Center
University of Washington Center for ReinventingPublic Education
Seattle, Washington
$125,000 To support policy analysis of subdistrict schoolfinance and building school district capacity forschool improvement
Urban Institute
Washington, D.C.
$150,000 To support an evaluation of Florida’s OpportunityScholarship Accountability Program
The Valley
New York, New York
$80,000 To support the Wadleigh Secondary School Beaconas a demonstration and technical assistance site
Washington Scholarship Fund
Washington, D.C.
$200,000 To support the administration of the District ofColumbia Opportunity Scholarship and ParentalChoice Program
TOTAL $3,502,500
Fund 1 for Schools $ 340,000
Fund 2 for Networks $1,900,000
Fund 3 for Intermediaries $3,502,500
GRAND TOTAL $5,742,500

41
P R O G R A M - R E L AT E D
I N V E S T M E N T S
In addition to these grants, the Foundation pursuedvarious program-related investments, or PRIs, in 2004.A PRI is a different mechanism by which a foundationcan seek to achieve its purposes. Instead of grantingmoney, a foundation using a PRI invests a portion ofits corpus in some activity. That investment could be aloan that is paid back over time, it could be an equityinvestment in an enterprise, or it could be a guaranteeor some other form of security offered.
One example of a PRI that came to fruition in 2005was Casey’s investment in the Indianapolis CharterSchool Facilities Fund. Charter schools often havetrouble obtaining affordable facilities, and so capitalneeds have the potential to hinder initiatives like theCasey-supported charter school initiative inIndianapolis. Partnering with the city’s Bond Bank, theMayor’s Office, and Local Initiatives SupportCorporation, the Foundation has pledged a $1 millionguarantee that will allow a local bank to lend up to $20million to the city’s Bond Bank, which will in turnprovide financing to charter schools. Because of thebacking of Casey, LISC, and the city, the bank is will-ing to lend the funds at very favorable rates. The result:schools will save hundreds of thousands of dollars onfacilities that they can then invest in creating greatinstructional programs for their students.
The Annie E. Casey Foundation is working on a secondPRI in education, which will help charter schools withfacilities funding, primarily in the Oakland area.
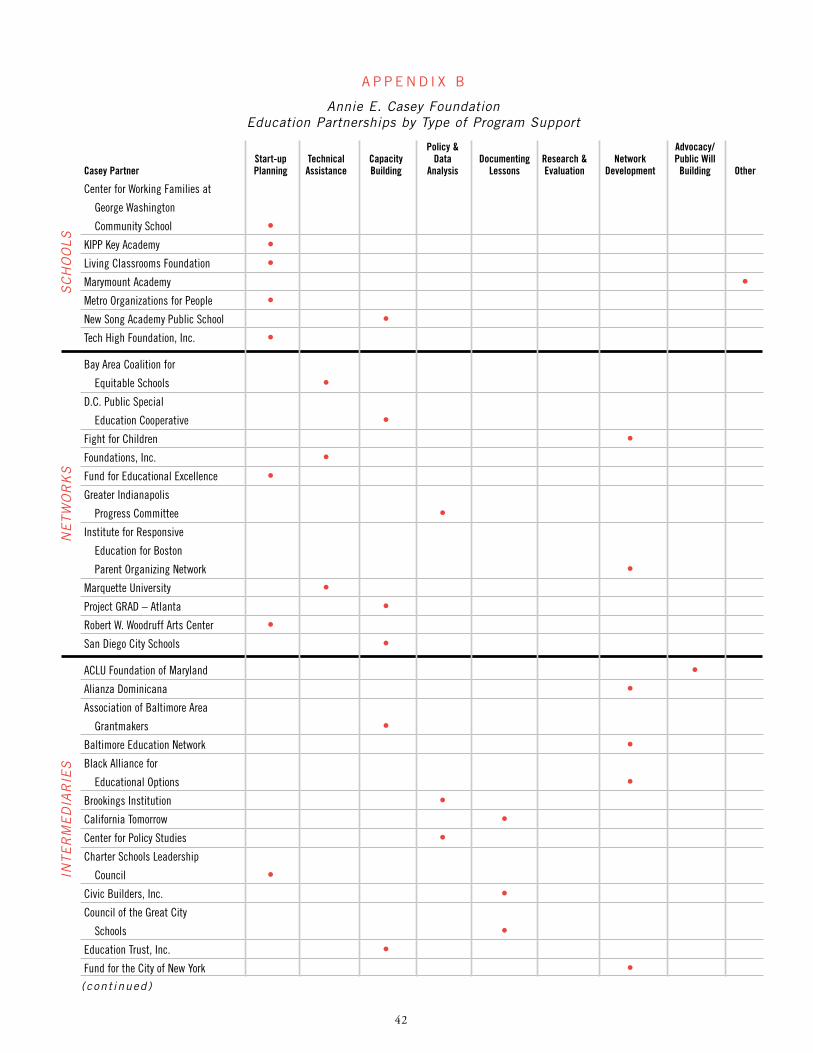
42
A P P E N D I X B
Annie E. Casey FoundationEducation Partnerships by Type of Program Support
Policy & Advocacy/Start-up Technical Capacity Data Documenting Research & Network Public Will
Casey Partner Planning Assistance Building Analysis Lessons Evaluation Development Building Other
Center for Working Families at
George Washington
Community School •KIPP Key Academy •Living Classrooms Foundation •Marymount Academy •Metro Organizations for People •New Song Academy Public School •Tech High Foundation, Inc. •
Bay Area Coalition for
Equitable Schools •D.C. Public Special
Education Cooperative •Fight for Children •Foundations, Inc. •Fund for Educational Excellence •Greater Indianapolis
Progress Committee •Institute for Responsive
Education for Boston
Parent Organizing Network •Marquette University •Project GRAD – Atlanta •Robert W. Woodruff Arts Center •San Diego City Schools •
ACLU Foundation of Maryland •Alianza Dominicana •Association of Baltimore Area
Grantmakers •Baltimore Education Network •Black Alliance for
Educational Options •Brookings Institution •California Tomorrow •Center for Policy Studies •Charter Schools Leadership
Council •Civic Builders, Inc. •Council of the Great City
Schools •Education Trust, Inc. •Fund for the City of New York •
SC
HO
OLS
NE
TW
OR
KS
INTE
RM
ED
IAR
IES
( cont inued)

43
Policy & Advocacy/Start-up Technical Capacity Data Documenting Research & Network Public Will
Casey Partner Planning Assistance Building Analysis Lessons Evaluation Development Building Other
Georgetown University •Grantmakers for Education •Greatschools.net •Harlem Children’s Zone •Interfaith Education Fund, Inc. •Jehl Consulting •National Council of La Raza •National Urban League •NCB Development Corporation •New Leaders for New Schools •NewSchools Venture Fund •NYU Institute for Education and
Social Policy •Philanthropy Roundtable •Prichard Committee for Excellence •Teach for America •The Third Way Foundation •University of Washington Charter
School Research Center •University of Washington Center for
Reinventing Public Education •The Urban Institute •The Valley •The Washington Scholarship Fund •TOTAL 8 5 12 5 6 4 7 3 2
INTE
RM
ED
IAR
IES
( cont inued)

701 St. Paul Street
Baltimore, MD 21202
410.547.6600
410.547.6624 fax
www.aecf.org
The Annie E. Casey Foundation