The Annie E. Casey Foundation -...
37
The Annie E. Casey Foundation 1 CEELO Results-Based Leadership Invitational Results Based Accountability 1 Using Data to Achieve Better Results 1 Friedman, Mark (2006). Trying Hard is Not Good Enough
Transcript of The Annie E. Casey Foundation -...

TheAnnieE.CaseyFoundation
1
CEELOResults-BasedLeadershipInvitational
ResultsBasedAccountability1UsingDatatoAchieveBetterResults
1 Friedman,Mark(2006).TryingHardisNotGoodEnough

2
ResultsBasedLeadershipApproach
Beliefs
1. Peoplewanttomakeadifference.
2. PeoplewanttoKNOWthattheyaremakingadifference.
3. PeopleneedtheResultsAccountabilityandRace,ClassCulturecompetenciestohelpthemknowandtrackthattheyaremakingadifference.
KeyPrinciple
Ifweperformbetterinourrolesandifwealignouractionsaspartners,thenwehavegreaterimpactwiththepeopleweserveinourprogramsandinthecommunity

TheTheoryofAlignedContributions2
• TheCalltoAction:Leadersplacepopulationresultsatthecenteroftheirworkwithasenseofurgency
• TheContainer:Theplace,timeandtoolstoaccelerateresults• TheCapacitytoCollaborate:Leadersusecompetenciesto
holdindividualandcollectiveaccountabilityforpopulationresultsandtheircontributiontoresults
3Theory of Aligned Contributions, Jolie Bain Pillsbury

ThePersonRoleSystemFramework2
Person
Role
System
4
2Kathleen Pogue White, Person Role System Framework Briefing Note

All children are reading proficiently by 3rd Grade
© Jolie Bain Pillsbury 5Result in The Center: Theory of Aligned Contributions
HealthcareH
ousing

© Jolie Bain Pillsbury 6Result in The Center: Theory of Aligned Contributions

Boundary,AuthorityRoleandTask(BART)
7
• FormalRole• InformalRole
• Primarytask(group’smission)
• Processtasks(drawattentiontoworkavoidance)
• Formal• Personal
• Resources,rolesandresponsibilities
Boundary(time,territoryandtask)
Authority(therighttodowork)
Role(functionof
theperson/entit
y)
Task(theworkofthegroup)

What’sYourBART?1. Whataretheresultsyourorganizationcontributesto?
2. Whatisyourroleinyourorganization?
3. Whatareyouauthorizedtodo?
4. Whatisyourprimarytaskinroletocontributetoresults?
1. Howwillyouexerciseyourauthoritytomakeacontributiontoameasurableimprovementtoresults?
8

ApplyingResultsAccountability:UsingDatatoDotheWork
FourCoreSkillsofResultsAccountability:
1. DifferentiatingbetweenWhole PopulationandProgramPopulation
2. UsingTrendLinestodeepenFactorAnalysis
3. UsingFactorAnalysistoINFORMthedevelopmentofStrategies
4. UsingPerformanceMeasurestotrackprogress• Howmuch?• Howwell?• Whatdifferencediditmake?
AdaptedfromtheworkofMarkFriedman.See:Friedman’sTryingHardisNotGoodEnough(2006).
9

CORESKILL1:POPULATIONANDPERFORMANCEACCOUNTABILITYDifferentiatingbetweenpopulationandperformanceaccountability
10
11
RBAFocusesonTwoDifferentPopulations
ProgramPopulations• Childrenservedbyortargetedbya
particular“programorstrategy”
WholePopulations• Allschool-agedchildreninWashington
• Allschool-agedchildreninPierceCounty
HousingPublic School
HealthcareFaith
Government
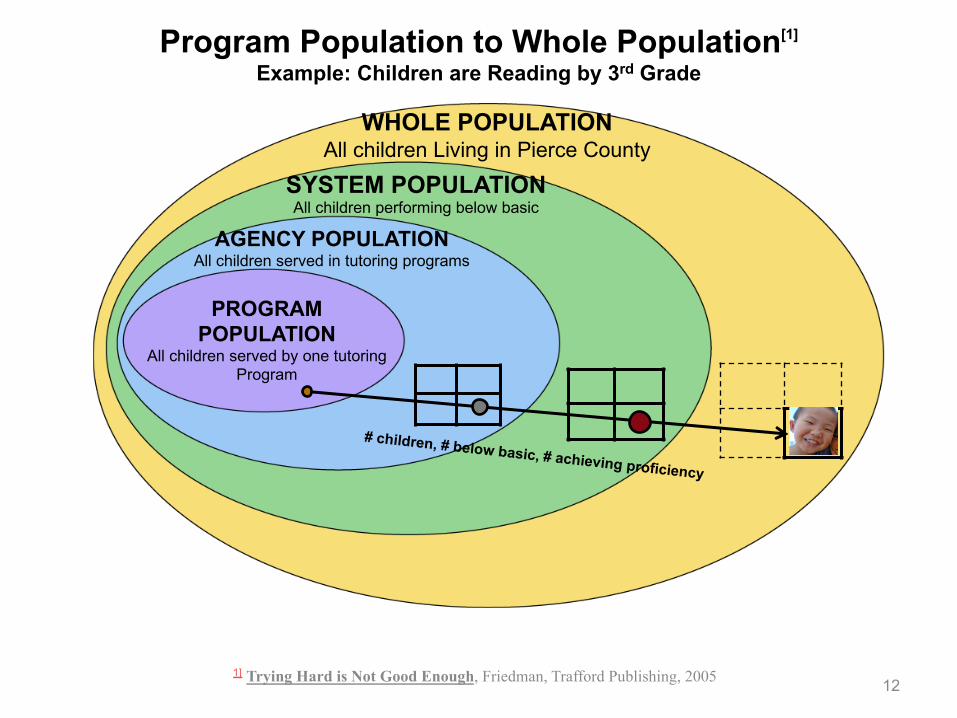
WHOLE POPULATION All children Living in Pierce County
SYSTEM POPULATIONAll children performing below basic
AGENCY POPULATIONAll children served in tutoring programs
PROGRAM POPULATION
All children served by one tutoring Program
1] Trying Hard is Not Good Enough, Friedman, Trafford Publishing, 2005 12
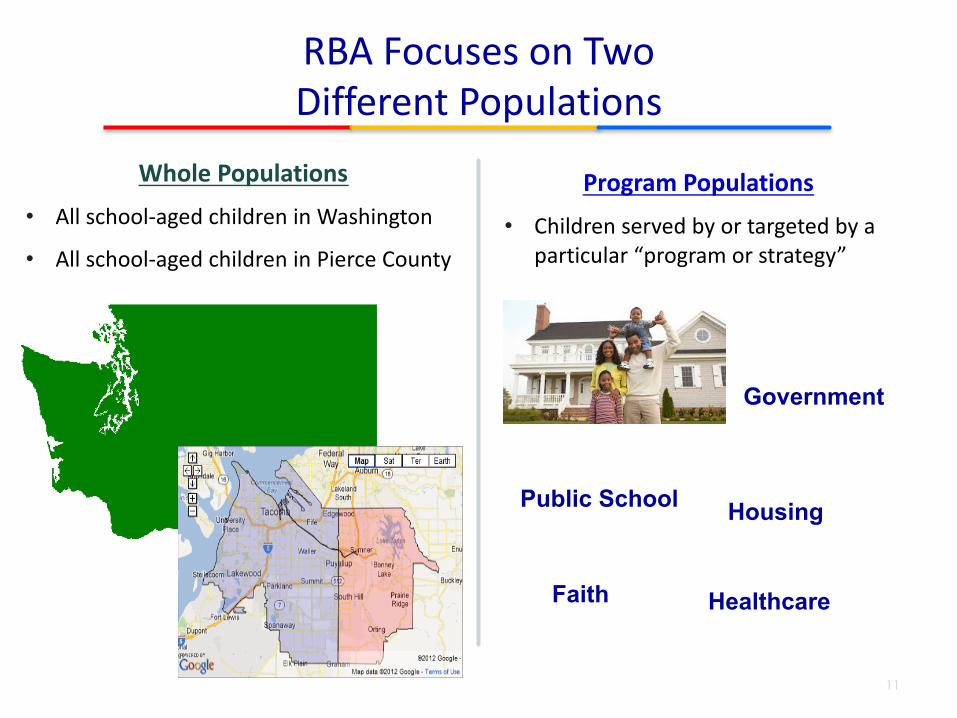
Program Population to Whole Population[1]
Example: Children are Reading by 3rd Grade

WHOLE POPULATION
PROGRAM POPULATION
1] Trying Hard is Not Good Enough, Friedman, Trafford Publishing, 2006 13
Mapping Your Population(s)
14
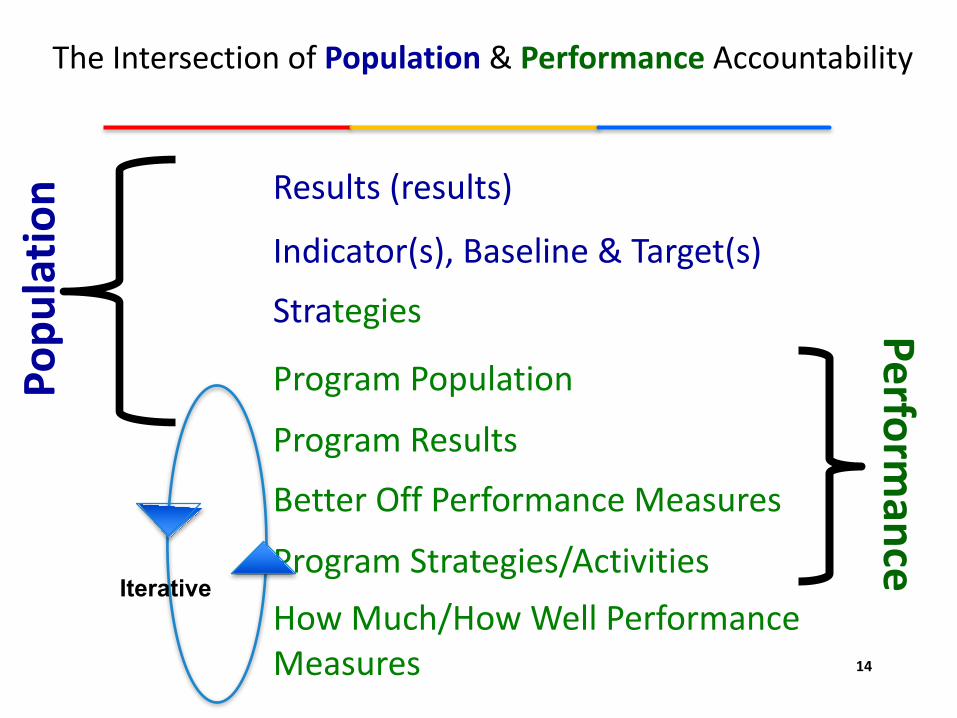
Results(results)
Indicator(s),Baseline&Target(s)Strategies
ProgramPopulation
ProgramResultsBetterOffPerformanceMeasures
ProgramStrategies/ActivitiesHowMuch/HowWellPerformanceMeasures
Performance
TheIntersectionofPopulation & Performance AccountabilityPo
pulatio
n
Iterative

CORESKILL2:TRENDLINESTODEEPENFACTORANALYSIS
Deepeningunderstandingofdatabyanalyzingcontributingfactors
15

16
Current
History Forecast
Whatdoesdatatellusaboutthetrendline?IsitBetter? Same? Worse?
Whole Population
Where will we go if nothing changes?
Where do we want to be? Where are we?

17
Current
History Forecast
Whole Population
Targeted Universalism: Mapping and Closing the Gap
Targeted Sub-Population

18
Story behind the data and story behind the gap
To analyze the factors that affect the trendline
To inform the change ideas
To inform selection of strategies(based on evidence & best practice)
StoryBehindtheData

19
Factorsincreasingtrend(contributing)
Current
History Forecast
Factorsdecreasingtrend
(restricting)
FactorAnalysisIsitBetter? Same? Worse? Storybehinddata?
Whole Population
Targeted Sub-Population

20
ResultsAccountabilityPractice:TheImportanceofFactors
1. DiggingDeepontheFactors:Eachtimeweaskourselves“why”themorespecificweareontheunderlyingfactors.
2. Factorsshapeourtheoryofaction:Ifwetakespecificactionsthenweexpectspecificchangeswillhappen.
3. Factorsinformdecisionmaking:Wedecidewhattodo“moreof”andwhattodo“lessof”or“dodifferently”inouractionstotake.

MentalModels
• Ourexperiencesandidentityinfluencehowwethinkaboutthecausesofdisparities
• Wemovequicklyfromobjectivelyobservabledatatoaddingmeaningbasedonhowweunderstandtheworld
• Itishelpfultohavemultipleperspectivesatthetablewhenlookingatdatatounderstandwhythingsarethewaytheyare
• However,itiscrucialthatpeopleworkingtogetherunderstandwherethoseperspectivescomefromandtheextenttowhichtheyaregroundedindata,researchand/orexperience
• Whatpeoplebelieveshapeswhattheyarewillingtodo
21

FactorsContributingtoPopulationDisparities
Race/Ethnicity
Class/EconomicStatus
Culture
22

23
RBAPractice:CompletingaFactorAnalysis,Part1
1)Constructaturnthecurvegraph(choosingoneofyourmostpowerfulindicators).Addressthetrendsforboththewholepopulationandatleastonetargetedpopulation.
2)Completeaninitialfactoranalysis.Addressboththewholepopulationandtargetedpopulationcurves.
3)Balanceyourcontributingandrestrictivefactorsforboththewholeandtargetedpopulationcurves.

24
Current
History Forecast
WholePopulationFactorAnalysis:DIGDEEP

25
Current
History Forecast
TargetedPopulationFactorAnalysis:DIGDEEP

26
RBAPractice:CompletingaFactorAnalysis,Part2
.
1. Review your factor analysis and refine it, asking yourself the following questions:• How do I know these what are the contributing or restrictive
factors? (Evidence vs. Mental Models) • Do I have a differentiated understanding of targeted and
universal factors?2. Pick a contributing factor for a subpopulation and drill down:
• Why is this driving the trend? (Why, why, why, root causes) • If this factor shifted, how big an impact would that have and
what kind of contribution would that make?3. Pick a restrictive factor for a subpopulation and drill down:
• Why is this driving the trend? (Why, why, why, root causes) • If this factor shifted, how big an impact would that have and
what kind of contribution would that make?4. Review your factors and ask yourself: “Of all these factors what are
the 2 or 3 that is shifted would constructively disrupt systems, make a big contribution to population level change and close gaps, or help us understand the way forward in a powerful manner?

27
Current
History Forecast
Combined&RefinedFactorAnalysis

28
RBAPractice:CompletingaFactorAnalysis,Part3
.
1. Pick a contributing factor for a subpopulation and drill down:• Why is this driving the trend? (Why, why, why, root causes) • If this factor shifted, how big an impact would that have and
what kind of contribution would that make?
2. Pick a restrictive factor for a subpopulation and drill down:• Why is this driving the trend? (Why, why, why, root causes) • If this factor shifted, how big an impact would that have and
what kind of contribution would that make?
3. Review your factors and ask yourself: “Of all these factors what are the 2 or 3 that is shifted would constructively disrupt systems, make a big contribution to population level change and close gaps, or help us understand the way forward in a powerful manner?

CORESKILL3:USINGFACTORANALYSISTOINFORMSTRATEGIESANDPROGRAMS
29

Strategies
§ Theoverarching approach(asetofcoherentactions)thathasthepowertoaccelerateachievementofresults.Strategiesarethemeans,methodor“thehow.”Strategiescanimpactmorethanoneindicatororperformancemeasure.
§ StrategyCriteria(H/M/L---1. Tiedtoafactor2. Reach3. Scale4. Validity5. SuccessProbability6. CommunityFit7. Capacity
30
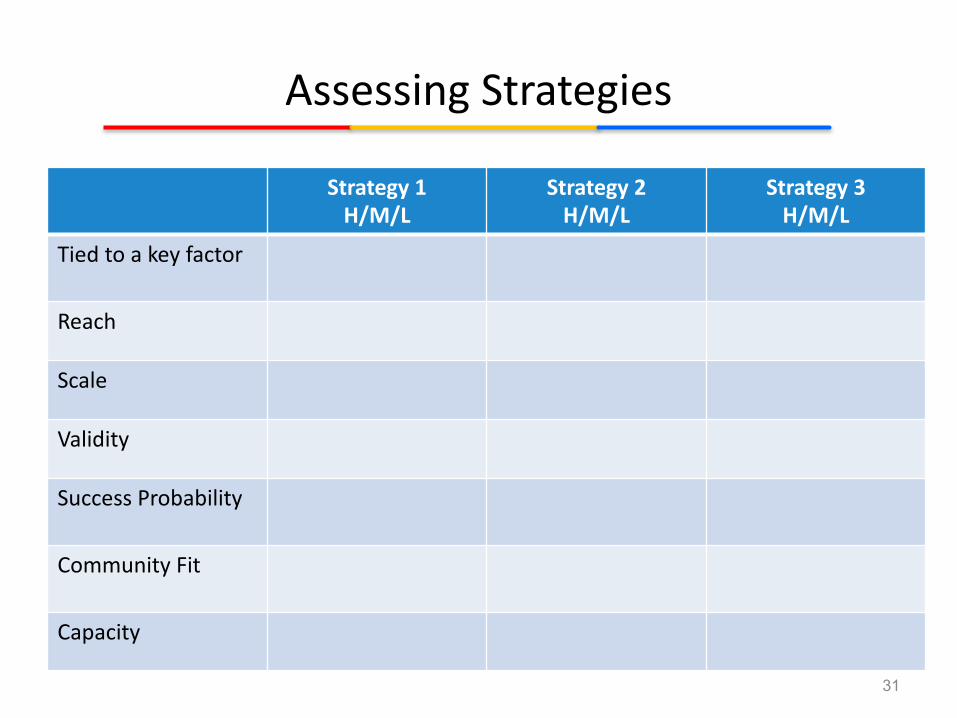
AssessingStrategies
Strategy1H/M/L
Strategy2H/M/L
Strategy 3H/M/L
Tiedtoakey factor
Reach
Scale
Validity
SuccessProbability
CommunityFit
Capacity
31

32
Six Steps to Action
1. Identify a disparity for a population2. Explore race, class, culture factors that contribute to the
disparity 3. Consider what works to address those factors and the
partners who can contribute 4. Develop a strategy that addresses the factors and
incorporates what works 5. Powerful ACTION/ALIGNMENT (come to one example
and get a set of team commitments)6. Make aligned commitments to take action to implement
the strategy (who will do what when and with whom)

CORESKILL4:PERFORMANCEMEASURESApplyingperformancemeasurestoaccelerateresults
33

34
Results(results)Indicator(s),Baseline&Target(s)
Strategies
ProgramPopulation
ProgramResultsBetterOffPerformanceMeasures
ProgramStrategies/ActivitiesHowMuch/HowWellPerformanceMeasures
Results“Playbook”

© Jolie Bain Pillsbury 35rying Hard is Not Good Enough, Friedman, Trafford Publishing, 2005
Quantity Quality
Inpu
tor
Effort
#offosterkidsserved
%offosterkidsexperiencing2+changesinplacement
Outpu
tor
Effect
#withoutrepeatabuse/neglect
%withoutrepeatabuse/neglect
ClientorCustomerResults
RESULT INDICATOR
HealthyBirths Rateoflowbirth-weightbabies
StableFamilies Ratesofchildabuseandneglect
ChildrenSucceedinginSchool PercentgraduatingfromhighschoolontimePerformanceMeasuresMeasures of agency or program effectiveness for which we are principal owners
ResultsandIndicatorsMeasures of Child, Adult, Family or Community Well-Being for which we
share responsibility with community partners
Example of how Results, Indicators and Measures align for stable families
What Difference?
How Much? How Well?

36
1. Howmuch didwedo?(Quantity)
2. Howwelldidwedoit?(Quality)
3. Whatdifferencedidwemake?(Impact)
PerformanceMeasuresAnswer3Questions

37
Isanyonebetteroff?aka:Whatdifferencewasmade?
1. What Behaviorschanged?(#/%ofparentswhonowusebehaviormanagementwiththeirchild)
2. WhatAttitudes(Opinions)changed?(#/%ofparentswhonowbelievethatreadingtotheirchildisneeded)
3. WhatCircumstancesarebetter?(#/%ofparentsinhomelessshelternowhavefulldayPre-Kforchild)
4. WhatKnowledge/Skillsareimproved?(#/%childrenwhoarereadyforschoolasmeasuredbytheWSS)