restructuring completed positive earnings momentum ...
36
restructuring completed positive earnings momentum restored record sales continue for 54 th consecutive year dividend increased for 27 th consecutive year RPM, Inc. 2001 Annual Report
Transcript of restructuring completed positive earnings momentum ...
restructuring completed
positive earnings momentum restored
record sales continue for 54th consecutive year
dividend increased for 27th consecutive year
RPM, Inc. 2001 Annual Report
Inside Front
Cover About the Company
1 Financial Highlights
2 Letter to Shareholders
4 Selected Financial Data
6 Management’s Discussion and Analysis
14 Financial Statements
17 Notes to Financial Statements
31 Independent Auditor’s Report
31 Quarterly Stock Price and Dividend Information
32 Shareholder Information
Inside Back
Cover Board of Directors and Officers
BackCover Operating Companies and
Plant Locations
About the Company
RPM, Inc. is a world leader in specialty coatings serving
both industrial and consumer markets. Of its $2.01 billion
in fiscal 2001 sales, 55 percent was generated by industrial
products, including roofing systems, sealants, corrosion
control coatings, polymer floor coatings and specialty
chemicals. Remaining sales were of consumer products
used by professionals and do-it-yourselfers for home,
automotive and boat maintenance and by hobbyists.
Leading businesses in RPM’s Industrial Division include
Tremco and Republic roofing systems, Carboline and
Plasite corrosion control coatings, Stonhard, Fibergrate
and Monile flooring systems, Vulkem and DYmeric
sealants, Euco concrete and masonry additives, Day-Glo
fluorescent pigments, Dryvit exterior insulation finishing
systems, Chemspec commercial carpet cleaning products,
Kop-Coat wood treatments, American Emulsions textile
specialties and the Pettit, Woolsey and Z-Spar brands of
marine coatings.
In its Consumer Division, RPM’s leading product lines are
Rust-Oleum rust-preventative and general purpose paints,
DAP caulks and sealants, Zinsser primer-sealers and
wallcovering preparation and removal products, Flecto
interior stains and finishes, Bondex and Plastic Wood
patch and repair products, Wolman deck coatings, Bondo
auto restoration products and Testor hobby products.
The company’s common shares are traded on the New
York Stock Exchange under the symbol RPM, and are
owned by some 285 institutional investors and
approximately 87,000 individual investors. RPM employs
approximately 7,900 people, not including hundreds of
independent sales and technical representatives; sells its
products in more than 130 countries; and manufactures at
62 locations in 17 countries.
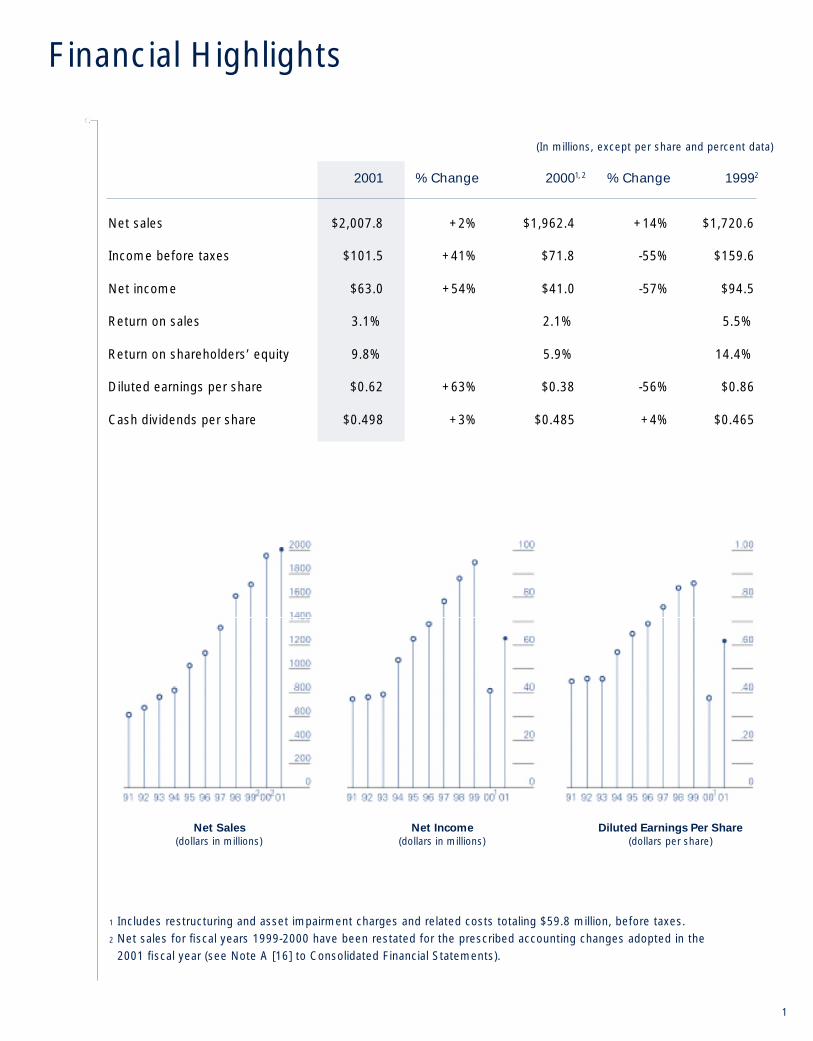
2001 % Change 2000 % Change 1999
Net sales $2,007.8 +2% $1,962.4 +14% $1,720.6
Income before taxes $101.5 +41% $71.8 -55% $159.6
Net income $63.0 +54% $41.0 -57% $94.5
Return on sales 3.1% 2.1% 5.5%
Return on shareholders’ equity 9.8% 5.9% 14.4%
Diluted earnings per share $0.62 +63% $0.38 -56% $0.86
Cash dividends per share $0.498 +3% $0.485 +4% $0.465
(In millions, except per share and percent data)
1
Financial Highlights
1, 2 2
1 Includes restructuring and asset impairment charges and related costs totaling $59.8 million, before taxes.2 Net sales for fiscal years 1999-2000 have been restated for the prescribed accounting changes adopted in the
2001 fiscal year (see Note A [16] to Consolidated Financial Statements).
Net Sales
(dollars in millions)Net Income
(dollars in millions)Diluted Earnings Per Share
(dollars per share)

We have thankfully concluded two verydifficult years, during which RPM completed ac o m p re h e n s i ve re s t ructuring program. We believe wehave emerged from this period as a much strongercompany, capable of once again outperforming ourindustry in terms of both sales and earnings growth.
For the 2001 fiscal year, we reported net income of$63.0 million, or $0.62 per diluted share, againstfiscal 2000 net income of $41.0 million, or $0.38 in diluted earnings per share. Fiscal 2000 resultsincluded restructuring, asset impairment and relatedcosts of $59.8 million pre-tax, or $0.35 per dilutedshare after tax. Net sales increased 2 percent, to$2.01 billion from $1.96 billion reported a year ago, representing RPM’s 54th consecutive year ofrecord sales.
Fiscal 2001 results were impacted by continuingrestructuring costs, much of which were associatedwith the Wood Finishes Group; higher interest costs due to higher interest rates and additionalborrowings to support both the purchase of DAPand the now-completed share repurchase program;unfavorable foreign currency exchange rates; andoverall deteriorating economic conditions.
Despite the adversity, operating earnings (prior tointerest, amortization, restructuring-related and other non-operating costs) of the Industrial Divisionwere up 9 percent on a 1 percent sales increase. The Consumer Division had a 10 percent decline inoperating earnings on a 4 percent increase in sales,due in part to significant inventory adjustments byits major customers.
Restructuring Program CompletedDuring the past two years, RPM’s restructuringprogram, which included a work force reduction of approximately 10 percent and closure of 17facilities, has consumed an extraordinary amount ofmanagement attention, both at the corporate and
operating levels. In hindsight, we attempted to dotoo much, too soon, and RPM’s performance overthe past two years suffered as a result, particularlywhen external conditions turned adverse as well.However, as a result of this two-year program, weare now much better positioned to regain our moretraditional growth posture.
Market Share BolsteredDespite the difficulties encountered in fiscal 2001,v i rtually all of RPM’s major product lines eithergained or maintained market share, with thee xception of the automotive aftermarket business.
Fourth Quarter Sharply ImprovedThe fourth quarter ended May 31, 2001 reflectedsome benefits of the restructuring program, with net income increasing to $24.3 million, or $0.24per diluted share, compared to $9.6 million, or$0.09 per diluted share, earned a year ago. Net salesduring the quarter were $548 million compared to$549 million in the final fiscal 2000 period.
Most recent business signs are also encouraging, andwe believe these fourth quarter results are indicativeof RPM’s performance potential going forward.
RPM’s fiscal 2002 results will also be aided through a prescribed accounting standard change intreatment of goodwill amortization, which willresult in approximately $20 million in additional net income. This benefit will be ongoing.
Debt Reduction Remains a PriorityDebt reduction continues as one of RPM’s toppriorities for the coming year. Aiding in debtreduction will be lower capital requirements for thenext few years. As a result, capital spending will bemore in line with depreciation levels.
Additionally, we expect to benefit from lowerinterest rates during the coming year. All of this,
2
To Our Shareholders

along with strong earnings, will result in cash flowfrom operations in excess of $150 million during the 2002 fiscal year. After allocating for dividends andcapital expenditures, we expect to have $60 millionin cash to pay down debt. Proceeds from any assetsales would be used to further reduce our debt levels.
Dividend Increased for 27th Consecutive YearIn October 2000, RPM’s Board of Directorsincreased the quarterly cash dividend to $0.125 from $0.1225 per share, marking the 27th consecutive year of cash dividend increases.
Joseph P. Viviano Elected to BoardWe are pleased to inform you that the company’sBoard of Directors has elected Joseph P. Viviano,retired vice chairman and director of Hershey Foods Corporation, to fill a vacancy in Class II of RPM’s Board, expiring at the company’s annualmeeting in 2003. During Mr. Viviano’s 40-yearcareer with Hershey Foods, he held a number ofsenior management positions, including president of Hershey Chocolate U.S.A. and president andchief operating officer of Hershey Foods. Hecurrently serves on the Board of Directors ofChesapeake Corporation, Harsco Corporation,Huffy Corporation and the R.J. Reynolds Tobacco Company.
Executives RetireCharles P. Brush, vice president of environmentalaffairs, retired May 31, 2001, following 10 years ofservice to RPM. Prior to joining the corporate office,Mr. Brush served as vice president of environmentaland risk management at our Kop-Coat, Inc.operating company and spent nearly 30 years withthe predecessor firm, Koppers Company, Inc.
Also retired during the past year was Mr. Robert D.Deitz, RPM’s first director of community affairs,
a position he held since January of 1997. Beforethat, Mr. Deitz was president of ConsolidatedCoatings, a position he held for over 20 years.Consolidated Coatings, which was merged into the Tremco Group, was acquired by RPM in 1989.
Both of these individuals were great ambassadors forRPM in their respective fields and will be missed.
Strategic Alternatives EvaluatedWe are confident that, with the restructuringprogram now behind us, RPM has regained itsforward momentum. As we enter the new fiscal year, we are examining strategic alternatives tosignificantly enhance shareholder value. Our goals in this process are:
• To significantly reduce debt;
• To re-create the financial flexibility to resumegrowth through strategic acquisitions thatcomplement our core competencies; and
• To re s t o re our capacity to generate RPM’straditional levels of double-digit earnings grow t h .
We do appreciate the patience of our shareholders as we have worked through this process and believe that the 2002 fiscal year will see welcomeimprovements in RPM’s operations that will enhanceshareholder value. We also appreciate the continuedsupport of our customers, suppliers and employees as we look forward to improved performance in2002 and beyond.
Sincerely,
Thomas C. SullivanChairman and Chief Executive Officer
James A. KarmanVice Chairman
August 27, 2001
3

4
Selected Financial Data
All financial data based on fiscal years ended May 31 2001 2000 1999
Results from Operations Net sales $ 2,007,762 $ 1,962,410 $ 1,720,628
Income before income taxes 101,487 71,7611 159,597
Net income 62,961 40,9921 94,546
Performance Measures Return on sales % 3.13 2.091 5.49
Return on shareholders’ equity % 9.8 5.91 14.4
Per Share Data Basic earnings per share 0.62 0.381 0.87
Diluted earnings per share 0.62 0.381 0.86
Cash dividends per share 0.498 0.485 0.465
Shareholders’ equity per share 6.26 6.021 6.83
Balance Sheet Highlights Shareholders’ equity 639,710 645,7241 742,876
Retained earnings 360,458 348,1021 359,011
Working capital 443,652 408,890 402,870
Total assets 2,078,490 2,099,203 1,737,236
Long-term debt 955,399 959,330 582,109
Other Data Average shares outstanding 102,202 107,221 108,731
Depreciation and amortization 81,494 79,150 62,135
1 Includes restructuring and asset impairment charges and related costs totaling $59.8 million, before taxes.2 Net sales for fiscal years 1997-2000 have been restated for the prescribed accounting changes adopted in the 2001 fiscal year
(see Note A [16] to Consolidated Financial Statements).
See Notes to Consolidated Financial Statements
Cash Dividends (dollars per share)
2 2
(In thousands, except per share and return data)

1998 1997 1996 1995 1994 1993 1992 1991
$ 1,623,326 $ 1,356,588 $ 1,136,396 $ 1,030,736 $ 825,292 $ 768,372 $ 680,091 $ 619,613
149,556 135,728 119,886 108,492 89,207 66,136 61,101 54,615
87,837 78,315 68,929 62,616 53,753 39,498 38,481 37,435
5.41 5.77 6.07 6.07 6.51 5.14 5.66 6.04
16.6 16.7 17.3 18.8 19.2 16.6 17.1 19.4
0.89 0.81 0.72 0.68 0.59 0.48 0.47 0.46
0.84 0.76 0.69 0.65 0.57 0.46 0.46 0.45
0.440 0.408 0.378 0.352 0.326 0.303 0.284 0.255
5.75 5.07 4.68 3.83 3.49 2.95 2.85 2.65
566,337 493,398 445,915 350,469 316,444 243,899 233,360 215,471
314,911 270,465 231,896 199,527 169,687 146,852 129,846 116,065
387,284 478,535 275,722 271,635 231,684 191,872 205,419 142,581
1,685,917 1,633,228 1,155,076 965,523 665,966 648,524 623,346 457,779
716,989 784,439 447,654 407,041 233,969 258,712 273,871 130,800
98,527 97,285 95,208 91,571 90,726 82,694 81,959 81,269
57,009 51,145 42,562 37,123 26,050 22,283 20,436 15,589
Stock Price Performance (dollars per share) 25% Stock Dividend 50% Stock Dividend
2 2
5
Acquisitions made by the Company during the periods presented may impact comparability from year to year.Refer to Note A of Consolidated Financial Statements for years 2001, 2000 and 1999.

Reportable Segment and
Geographic Area Information
The Company has determined that it has two operating
segments – Industrial and Consumer – based on the
nature of business activities, products and services;
the structure of management; and the structure of
information as presented to the Board of Directors.
Within each division, individual operating companies or
groups of companies generally address common markets,
utilize similar technologies, and can share manufacturing
or distribution capabilities. The Company evaluates the
profit performance of the two divisions based on earnings
before interest and taxes since interest expense is
essentially related to corporate acquisitions, as opposed
to segment operations.
The Industrial Division has operations throughout
North America and accounts for most of the Company’s
sales in Europe, South America, Asia, South Africa,
Australia and the Middle East. The Industrial product
line is primarily sold to distributors, contractors and
to end users, such as industrial manufacturing facilities,
educational and governmental institutions and
commercial establishments. Industrial Division products
reach their markets through a combination of direct
sales, sales representative organizations, distributor sales
and sales of licensees and joint ventures.
The Consumer Division’s products are sold throughout
North America by mass merchandisers, home centers,
hardware stores, paint stores, automotive supply stores
and craft shops. Major customers include Ace Hardware
Stores, Cotter & Company, The Home Depot, Kmart,
Lowe’s Home Centers, Sherwin-Williams and Wal-Mart.
Consumer Division products are sold to retailers through
a combination of direct sales, sales representative
organizations and distributor sales.
Sales to the seven largest customers represent
approximately 19%, 16% and 12% of consolidated
net sales for the years ended May 31, 2001, 2000 and
1999, respectively. These sales are predominantly within
the Consumer Division and comprise approximately
41%, 37% and 32% of the division’s sales for the
respective periods.
In addition to the two operating segments, there are
certain business activities, referred to as Corporate/Other,
that do not constitute an operating segment, including
corporate headquarters and related administrative
expenses, results of the Company’s captive insurance
company, gains or losses on the sales of certain assets
and other expenses not directly associated with either
operating segment. Related assets consist primarily of
investments, prepaid expenses, deferred pension assets,
and headquarters property and equipment. These
corporate and other assets and expenses reconcile
operating segment data to total consolidated net sales,
earnings before interest and taxes, identifiable assets,
capital expenditures, and depreciation and amortization,
as follows on page 7.
Sales for the years ended May 31, 2001, 2000 and
1999 do not include sales of Company products by joint
ventures and licensees, amounting to approximately
$37,000,000, $35,000,000, and $72,000,000,
respectively. The Company reflects income from joint
ventures on the equity method and receives royalties from
its licensees. Export sales were less than 10% of net sales
for each of the three years presented.
Management’s Discussion and Analysis
6
of Results of Operations and Financial Condition

7
Segment and Geographic Information
Segment Information
(In thousands)
Year Ended May 31, 2001 20001,2 19992
Net salesIndustrial Division $1,100,682 $1,092,976 $1,062,785Consumer Division 907,080 869,434 657,843Corporate/Other
Total $2,007,762 $1,962,410 $1,720,628
Earnings before interest and taxesIndustrial Division $ 122,034 $ 98,980 $ 135,632Consumer Division 62,662 47,907 71,294Corporate/Other (18,006) (23,333) (14,548)
Total $ 166,690 $ 123,554 $ 192,378
Identifiable assetsIndustrial Division $1,002,209 $ 993,239 $1,102,531Consumer Division 1,016,067 1,041,896 586,846Corporate/Other 60,214 64,068 47,859
Total $2,078,490 $2,099,203 $1,737,236
Capital expendituresIndustrial Division $ 30,123 $ 34,331 $ 35,779Consumer Division 23,629 27,929 26,648Corporate/Other 366 925 979
Total $ 54,118 $ 63,185 $ 63,406
Depreciation and amortizationIndustrial Division $ 38,579 $ 38,519 $ 32,668Consumer Division 41,627 39,862 28,387Corporate/Other 1,288 769 1,080
Total $ 81,494 $ 79,150 $ 62,135
Geographic Information
(In thousands)
Year Ended May 31, 2001 20002 19992
Net sales (based on shipping locations)United States $1,614,112 $1,572,919 $1,362,722
ForeignCanada 140,009 135,641 115,201Europe 164,517 172,662 171,825Other Foreign 89,124 81,188 70,880
Total Foreign 393,650 389,491 357,906
Total $2,007,762 $1,962,410 $1,720,628
Assets employedUnited States $1,732,238 $1,740,882 $1,445,599
ForeignCanada 128,159 130,064 88,965Europe 144,619 155,330 144,636Other Foreign 73,474 72,927 58,036
Total Foreign 346,252 358,321 291,637
Total $2,078,490 $2,099,203 $1,737,236
1 Includes restructuring and asset impairment charges and related costs totaling $59.8 million, before taxes.2 Net sales for fiscal years 1999-2000 have been restated for the prescribed accounting changes adopted in the 2001
fiscal year (see Note A [16] to Consolidated Financial Statements).

8
Results of Operations
Fiscal 2001 Compared to Fiscal 2000
Fiscal 2001 net sales were ahead of fiscal 2000 by
$45 million, or 2%, resulting in the 54th consecutive
year of business growth for RPM.
On August 3, 1999, RPM acquired DAP Products Inc.
and DAP Canada Corp. (collectively “DAP”). DAP, with
annual sales of approximately $220 million, is a leading
manufacturer and marketer of caulks and sealants,
spackling and glazing compounds, contact cements, and
other specialty adhesives. Brand names DAP, Alex Plus
and Kwik Seal are well known throughout the U.S.
and Canada.
On a consolidated basis, the extra two months of DAP
sales this year, reported within the Consumer Division,
offset the loss of sales from Industrial Division product
lines divested during fiscal 2000. On a segment basis,
comparable base sales, including small product line
additions, grew by 4% in the Industrial Division, while
base sales in the Consumer Division were flat year-over-
year. The Industrial growth of 4% reflects a combination
of greater unit volume [2-3%] and higher pricing [1-2%]
to counter increased raw material and packaging costs
during the year. In addition, foreign exchange differences
had a negative impact on primarily Industrial sales
between years, suppressing sales by approximately
$20 million, or 1%.
The general slowdown in the economy impacted sales in
both divisions during the past year, causing spending in
areas such as protective maintenance, which our products
and services provide, to be deferred. The severe cold this
past winter extended much further south than usual,
and Europe was hit hard as well, causing sales to those
regions to be much weaker than usual during our fiscal
third quarter, the seasonally slowest time of the year.
Furthermore, several of the Consumer Division’s major
accounts were aggressively de-stocking their inventories
this past year, especially impacting sales to those accounts
during the months of December and March. It is
management’s view that this de-stocking activity is now
largely completed and that sales to these accounts will
normalize, all other factors being equal, as we progress
through 2002.
Gross profit margin this year of 43.8% matches closely
with last year’s 44%. The Industrial Division margin
improved to 46.4% from 45.7%, from the divested
product lines during fiscal 2000, which carried lower
margins and, to a lesser extent, the leveraged benefits
from higher sales volume. Timely pricing initiatives in
this division successfully offset rising material costs,
principally oil-related, during the year, and these material
costs now appear to have stabilized. The Consumer
Division gross margin, in contrast, dipped to 40.7%
from 41.8%, reflecting principally this division’s less
timely ability to gain price relief during periods of rising
material costs, typically having servicing agreements with
their accounts that renew annually. As these agreements
are being renewed, pricing relief is generally being
successfully negotiated. There were also two more months
of lower-margin DAP this year than last in this division,
as well as premium costs incurred to outsource certain
products in order to seamlessly service customers during
brief periods of insufficient capacity during information
systems conversions. During 2000, this division had
incurred $7 million in inventory discontinuation costs
associated with the comprehensive restructuring program
initiated in August 1999.
Selling, general and administrative (“SG&A”) expenses
amounted to 35.5% of sales this year, compared with
35% last year. The Industrial Division expenses increased
to 35.3% from 34.7% a year ago, mainly as the divested
product lines during fiscal 2000 had carried relatively
much lower SG&A expenses, plus additional, related
costs of approximately $3 million were incurred this year
toward completion of the restructuring program. The
Consumer Division expenses increased to 33.8% from

9
33.4%, principally from incurring approximately
$5 million in additional costs related to the restructuring
program, tempered slightly by two more months of
DAP, with its comparatively lower SG&A expense
structure. This division also incurred higher freight costs
in the form of oil-driven fuel surcharges, premiums to
expedite certain shipments during restructuring, and
increased handling costs to service more frequent
shipments. Additional costs related to the conclusion
of the restructuring program initiated during 2000 are
scheduled to be fully incurred by the end of calendar
2001, and will be much lower than those incurred
during fiscal 2001.
Industrial and Consumer Division 2001 earnings before
interest and taxes (EBIT) were both well ahead of their
reported EBIT for 2000. Excluding the restructuring and
asset impairment charges and all related costs from 2000,
totaling $59.8 million, pro forma EBIT results [000s]
for Industrial, Consumer and Corporate/Other were
$121,312; $79,761; and ($17,672), respectively, or
$183,401 in total. On that basis, Industrial EBIT
year-over-year appears flat [$122,034 vs. $121,312],
but considering the loss of EBIT from the divestitures
during 2000 and the additional $3 million spent this
year toward completion of the restructuring program,
Industrial EBIT during 2001 would have been
$7 million ahead of 2000, or up 6% on the 4% higher
sales. On the same pro forma basis, Consumer EBIT was
off $17 million [$62,662 vs. $79,761], or 21%, for the
reasons discussed above. Lastly, on the same pro forma
basis, Corporate/Other costs were flat year-over-year
[($18,006) vs. ($17,672)] as certain lower costs offset
higher costs for e-commerce infrastructure development,
which is now completed.
In August 1999, the Company announced a
comprehensive restructuring program to generate
manufacturing, distribution and administrative
efficiencies, and to better position the Company for
increased profitability and long-term growth. Pre-tax
restructuring and asset impairment charges of
$45 million and $7 million were taken during the first
and fourth quarters of fiscal 2000, respectively. Through
year-end 2001, the Company had incurred all of these
charges (refer to Note I to the Consolidated Financial
Statements).
Net interest expense increased $13.4 million in 2001
(refer to Note A [12]), reflecting higher average interest
rates, year-over-year, on the variable rate portion
(approximately 80%) of outstanding borrowings (refer to
Note B), two additional months of indebtedness related
to the August 1999 DAP acquisition, and higher average
indebtedness associated with the repurchase of 8,970,100
RPM common shares between January 1999 and July
2000 (refer to Note D). The Federal Reserve Board cuts
in interest rates that began early in calendar 2001 are
now translating into lower rates on the variable portions
of the Company’s outstanding borrowings, resulting in
comparably lower interest costs.
The effective income tax rate this year of 38% compares
favorably with last year’s 42.9% rate. The 2000 rate had
been impacted by the restructuring and asset impairment
charges plus related costs that year. Excluding those
charges and costs, the pro forma tax rate for 2000 would
have been 40.3%, still higher than this year’s 38%. This
year’s rate reduction mainly reflects an improved mix of
foreign income, including fewer unusable foreign tax
losses this year than last, which management expects will
be sustainable.
This year’s net income of $63 million, or $.62 per diluted
share, compares favorably with last year’s $41 million,
or $.38 per diluted share. Excluding the $59.8 million
pre-tax restructuring and asset impairment charges plus
related costs, pro forma net income for 2000 would
have been $78.6 million, or $.73 per diluted share.
Against pro forma 2000, 2001 net income and EPS are
off 20% and 15%, respectively, as a result of the factors

10
discussed above. In addition, the difference in pro forma
decline year-over-year between net income and EPS
reflects the net benefit from the shares repurchased, which
added $.01 per diluted share to 2001 results.
Fiscal 2000 Compared to Fiscal 1999
Fiscal 2000 net sales were ahead of fiscal 1999 by $241.2
million, or 14%, representing the 53rd consecutive year
of business growth for RPM. The vast majority of this
increase came as a net result of the August 1999 DAP
acquisition plus several product line additions, net of
divestitures. DAP accounted for the majority of the year
2000 sales increase, adjusted for divestitures during 2000
and for unfavorable foreign exchange differences from
year-to-year. Growth within the Industrial and Consumer
Divisions’ base businesses, before acquisitions, divestitures,
and exchange differences, amounted to approximately 3%
and 4%, respectively. These growth rates included several
product line additions and are generally reflective of real
unit volume increases, as price levels year-to-year remained
fairly stable.
Gross profit margin in 2000 declined 2.1%, ending at
44%, compared to 1999’s 46.1% performance. The
Industrial Division margin of 45.7% compared with
46.5% in 1999. The key influence to this change was the
difficulties experienced in reorganizing to combine certain
businesses, most notably outside the U.S. Additionally,
there were sales mix differences and minor raw material
price increases during 2000. Management believes that
such cost increases can be effectively managed,
prospectively, as productive activities of its Purchasing
Action Group continue. This group focuses on purchasing
major common raw and packaging materials used across
multiple business units, and will continue its effort to
identify and expand into other select procurement
opportunities going forward. The Consumer Division year
2000 margin of 41.8% compared with 45.5% 1999.
The majority of this margin reduction resulted from the
DAP acquisition. DAP’s entire cost structure generally
differs among the Consumer Division companies, having
much lower gross margins, but requiring lower support
levels in the SG&A expense areas. The Consumer Division
also incurred $7 million in inventory discontinuation costs
during 2000 associated with the restructuring program.
In addition, the Consumer Division experienced raw
material cost movements similar to those described for the
Industrial Division.
SG&A expenses were essentially unchanged from 1999
to 2000 as a percentage of sales, ending both years at the
35% level. Industrial and Consumer expenses amounted
to 34.7% and 33.4% in 2000 compared with 33.7% and
34.7%, respectively, in 1999. The Industrial Division
increase was almost totally driven by the divestiture of
business units, which carried much lower SG&A expense
levels. Conversely, the Consumer Division, spending
difference was the result of the lower SG&A structure
of DAP.
Excluding the restructuring and asset impairment charges
of $52 million, and the related $7.9 million of additional
cost of sales, EBIT amounted to $183.4 million in fiscal
2000 (see above), compared with $192.4 million in fiscal
1999. As set forth, within the Industrial Division, the
earnings benefits of modest volume increases were
principally offset by costs incurred in reorganizing to
combine certain businesses and other cost increases not
recovered by price increases. The Consumer Division
year-over-year comparisons disclose similar occurrences;
however, the DAP acquisition helped to more than offset
the earnings reduction. Weaker performance at certain
business units, and general cost increases not timely
covered by pricing actions, drove a net cost increase
which exceeded the benefit from modest sales growth.
General corporate and other expenses increased just over
10%, with the investment initiative for e-commerce
infrastructure development driving the remainder of this
cost increase.

11
Two non-core product lines, with annual sales of
$65 million, were divested for a net gain during 2000.
Non-recurring expenses offset this net gain during
the year.
Net interest expense increased $19.0 million in 2000
(refer to Note A [12]), reflecting primarily the additional
indebtedness to acquire DAP and smaller acquisitions
throughout the year, and to repurchase RPM common
shares. These increases were partly offset by interest
expense saved from the August 10, 1998 redemption
of convertible debt securities, which reduced interest
expense by $1.3 million, and from debt paydowns during
2000. Fractionally higher interest rates in 2000 further
increased net interest expense.
The effective income tax rate in 2000 was 42.9%,
compared to a 1999 rate of 40.8%. The higher 2000
rate is totally attributable to the restructuring and asset
impairment charges and related costs referred to above,
totaling $59.8 million, pre-tax. Excluding those charges
and costs, the pro forma tax rate for 2000 would have
been 40.3%, or just slightly improved from the
1999 rate.
The much lower net income in the year 2000 than in
1999 was again largely attributable to the $59.8 million
of pre-tax restructuring and asset impairment charges
and related costs taken and incurred during 2000.
Excluding such costs, pro forma 2000 net income would
have been $78.6 million, or $0.73 per diluted share,
with this pro forma difference attributable to the lower
comparable performances in both operating segments,
higher corporate expenses and the higher interest costs
discussed above.
Liquidity and Capital Resources
Cash Provided From Operations
The Company generated $74.5 million in cash from
operations during 2001, $28.1 million less than during
2000. The major difference between years occurred
with working capitals, particularly accounts receivable
and inventory, where there was considerable, yet
temporary, net consumption of cash this past year tied
to the restructuring program and to certain information
systems conversions during the year. These levels will be
brought back in line now that these activities have been
essentially completed.
The Company expects to continue to generate strong free
cash flow from its operations, which remains its primary
source of financing internal growth with limited use of
short-term credit.
Investing Activities
The Company is not capital intensive, and capital
expenditures generally do not exceed depreciation and
amortization in a given year. Other than to make
ordinary repairs and replacements, capital expenditures
are made to accommodate the Company’s continued
growth through improved production and distribution
efficiencies and capacity, and to enhance administration.
Capital expenditures in 2001 of $54.1 million compare
with depreciation and amortization of $81.5 million.
Approximately $10 million of this year’s expenditures
were made to accommodate the restructuring program,
which is now completed, and $12 million were
information technology (IT) related, including the
completion of several major IT platform conversions.
As previously indicated, capital spending in the IT area
is expected to trend downward for the next several years.
The Company’s captive insurance company invests
in marketable securities in the ordinary course of
conducting its operations, and this activity will continue.
The differences between years are attributable to the
timing and performance of its investments.
During 2001, the Company sold or divested certain non-
core assets, generating total proceeds of $31.7 million.
12
Financing Activities
On January 22, 1999, the Company announced the
authorization of a share repurchase program, allowing
the repurchase of up to 5 million RPM common shares
over a period of 12 months. On October 8, 1999, the
Company announced the authorized expansion of this
repurchase program to a total of 10 million shares. As of
May 31, 2001, the Company had repurchased 8,970,100
of its common shares at an average price of $11.11 per
share. No further share repurchases under this program
are anticipated at this time.
On July 14, 2000, the Company had refinanced its
then-existing $300 million and $400 million revolving
credit facilities with a $200 million, 364-day revolving
credit facility and a $500 million, 5-year revolving credit
facility. These new facilities have been available to back
up the Company’s $700 million commercial paper
program to the extent these facilities are not drawn upon.
As of May 31, 2001, the Company had drawn $655.7
million against these facilities and had no outstanding
commercial paper. Due to the Company’s current public
debt ratings, access to the commercial paper market is
presently limited. Subsequent to year end, the Company
refinanced its $200 million facility with a one-year term
loan due July 12, 2002. The debt to capital ratio was
60% at May 31, 2000 and 2001.
The stronger dollar effect on the Company’s foreign net
assets reduced shareholders’ equity this past year, a trend
that could continue if the dollar strengthens further and
foreign net assets continue to grow.
The Company maintains excellent relations with its
banks and other financial institutions to support its
existing businesses and to provide access to financing
for future growth opportunities.
Other Matters
Environmental Matters
Environmental obligations continue to be appropriately
addressed and, based upon the latest available
information, it is not anticipated that the outcome of
such matters will materially affect the Company’s results
of operations or financial condition (refer to Note H to
the Consolidated Financial Statements).
Market Risk
The Company is exposed to market risk from changes
in interest rates and foreign currency exchange rates since
it funds its operations through long- and short-term
borrowings and denominates its business transactions
in a variety of foreign currencies. A summary of the
Company’s primary market risk exposures is presented
below.
Interest Rate Risk
The Company’s primary interest rate risk exposure
results from floating rate debt including various revolving
credit and other lines of credit. At May 31, 2001,
approximately 83% of the Company’s total long-term
debt consisted of floating rate debt. If interest rates were
to increase 100 basis points (1%) from May 31, 2001
rates, and assuming no changes in long-term debt from
the May 31, 2001 levels, the additional annual expense
would be approximately $8.0 million on a pre-tax basis.
The Company currently does not hedge its exposure to
floating interest rate risk.
Foreign Currency Risk
The Company’s foreign sales and results of operations
are subject to the impact of foreign currency fluctuations.
As most of the Company’s foreign operations are in
countries with fairly stable currencies, such as the
United Kingdom, Belgium and Canada, this effect
has not been material. In addition, foreign debt is
denominated in the respective foreign currency, thereby
eliminating any related translation impact on earnings.

13
If the dollar continues to strengthen, the Company’s
foreign results of operations will be negatively impacted,
but the effect is not expected to be material. A 10%
adverse change in foreign currency exchange rates would
not have resulted in a material impact in the Company’s
net income for the year ended May 31, 2001. The
Company does not currently hedge against the risk of
exchange rate fluctuations.
Euro Currency Conversion
On January 1, 1999, eleven of the fifteen members of
the European Union adopted a new European currency
unit (the “euro”) as their common legal currency.
The participating countries’ national currencies will
remain legal tender as denominations of the euro from
January 1, 1999 through January 1, 2002, and the
exchange rates between the euro and such national
currency units will be fixed. The Company has assessed
the potential impact of the euro currency conversion on
its operating results and financial condition. The impact
of pricing differences on country-to-country indebtedness
is not expected to be material. The Company converted
its European operations to the euro currency basis
effective June 1, 1999.
Forward-Looking Statements
The foregoing discussion includes forward-looking
statements relating to the business of the Company.
These forward-looking statements, or other statements
made by the Company, are made based on management’s
expectations and beliefs concerning future events
impacting the Company and are subject to uncertainties
and factors (including those specified below) which are
difficult to predict and, in many instances, are beyond
the control of the Company. As a result, actual results
of the Company could differ materially from those
expressed in or implied by any such forward-looking
statements. These uncertainties and factors include
(a) the price and supply of raw materials, particularly
titanium dioxide, certain resins, aerosols and solvents;
(b) continued growth in demand for the Company’s
products; (c) environmental liability risks inherent in the
chemical coatings business; (d) the effect of changes in
interest rates; (e) the effect of fluctuations in currency
exchange rates upon the Company’s foreign operations;
(f) the potential impact of the euro currency conversion;
(g) the effect of non-currency risks of investing in and
conducting operations in foreign countries, including
those relating to political, social, economic and regulatory
factors; (h) future acquisitions and the Company’s ability
to effectively integrate such acquisitions; (i) liability risks
and insurance coverage inherent in the Company’s EIFS
and asbestos litigation; and (j) the ability of the
Company to realize the projected pre-tax savings
associated with the restructuring and consolidation
program, and to divest non-core product lines.

14
May 31 2001 2000
Assets
Current Assets
Cash and short-term investments (Note A) $ 23,926 $ 31,340Trade accounts receivable (less allowances of
$17,705 in 2001 and $16,248 in 2000) 411,718 399,683Inventories (Note A) 277,494 244,559Prepaid expenses and other current assets 106,282 109,510
Total current assets 819,420 785,092
Property, Plant and Equipment, At Cost (Note A)
Land 21,713 24,055Buildings and leasehold improvements 188,590 190,658Machinery and equipment 412,751 384,966
623,054 599,679Less allowance for depreciation and amortization 261,018 233,451
Property, plant and equipment, net 362,036 366,228
Other Assets
Goodwill, net of amortization (Note A) 571,276 595,106Other intangible assets, net of amortization (Note A) 300,372 320,631Other 25,386 32,146
Total other assets 897,034 947,883
Total Assets $2,078,490 $2,099,203
Liabilities and Shareholders’ Equity
Current Liabilities
Notes and accounts payable $ 152,307 $ 154,256Current portion of long-term debt (Note B) 7,379 4,987Accrued compensation and benefits 74,888 76,314Accrued loss reserves (Note H) 55,416 64,765Accrued restructuring reserve (Note I) -0- 13,540Other accrued liabilities 75,022 61,326Income taxes payable (Notes A and C) 10,756 1,014
Total current liabilities 375,768 376,202
Long-Term Liabilities
Long-term debt, less current maturities (Note B) 955,399 959,330Other long-term liabilities 53,479 57,381Deferred income taxes (Notes A and C) 54,134 60,566
Total long-term liabilities 1,063,012 1,077,277
Total liabilities 1,438,780 1,453,479
Shareholders’ Equity
Common shares, stated value $.015 per share; authorized 200,000 shares; issued 111,153 and outstanding 102,211 in 2001; issued 110,947 and outstanding 103,134 in 2000 (Note D) 1,619 1,616
Paid-in capital 430,015 424,077Treasury shares, at cost (Note D) (99,308) (88,516)Accumulated other comprehensive loss (Note A) (53,074) (39,555)Retained earnings 360,458 348,102
Total shareholders’ equity 639,710 645,724
Total Liabilities and Shareholders’ Equity $2,078,490 $2,099,203
See Notes to Consolidated Financial Statements
Consolidated Balance Sheets RPM, Inc. and Subsidiaries(In thousands, except per share amounts)

Year Ended May 31 2001 2000 1999Net Sales $2,007,762 $1,962,410 $1,720,628Cost of sales 1,127,787 1,099,637 927,110Gross profit 879,975 862,773 793,518Selling, general and administrative expenses 713,285 687,249 601,140Restructuring and asset impairment charge (Note I) -0- 51,970 -0-Interest expense, net 65,203 51,793 32,781Income before income taxes 101,487 71,761 159,597Provision for income taxes (Note C) 38,526 30,769 65,051Net Income $ 62,961 $ 40,992 $ 94,546Average shares outstanding (Note D) 102,202 107,221 108,731Basic earnings per common share (Note D) $.62 $.38 $.87Diluted earnings per common share (Note D) $.62 $.38 $.86Cash dividends per common share $.498 $.485 $.465
See Notes to Consolidated Financial Statements
Consolidated Statements of Income RPM, Inc. and Subsidiaries(In thousands, except per share amounts)
15
Common Shares AccumulatedOther
Number ComprehensiveOf Shares Stated Paid-In Treasury Loss Retained(Note D) Value Capital Shares (Note A) Earnings Total
Balance at May 31, 1998 100,254 $1,460 $264,508 $ $(14,542) $314,911 $566,337Comprehensive income
Net income 94,546 94,546Reclassification adjustments (65) (65)Other comprehensive loss (9,301) (9,301)
Comprehensive income 85,180Dividends paid (50,446) (50,446)Debt conversion 10,135 148 156,896 157,044Business combinations (24) (417) (417)Repurchase of shares (1,296) (17,044) (17,044)Stock option exercises 281 4 2,218 2,222Restricted share awards 93 1 (1)
Balance at May 31, 1999 109,443 1,613 423,204 (17,044) (23,908) 359,011 742,876Comprehensive income
Net income 40,992 40,992Reclassification adjustments 738 738Other comprehensive loss (16,385) (16,385)
Comprehensive income 25,345Dividends paid (51,901) (51,901)Repurchase of shares (6,517) (71,472) (71,472)Stock option exercises 100 1 875 876Restricted share awards 108 2 (2)
Balance at May 31, 2000 103,134 1,616 424,077 (88,516) (39,555) 348,102 645,724
Comprehensive incomeNet income 62,961 62,961Reclassification adjustments 1,015 1,015Other comprehensive loss (14,534) (14,534)
Comprehensive income 49,442Dividends paid (50,605) (50,605)Repurchase of shares (1,157) (11,101) (11,101)Stock option exercises 59 1 101 309 411Restricted share awards 175 2 5,837 5,839
Balance at May 31, 2001 102,211 $1,619 $430,015 $(99,308) $(53,074) $360,458 $639,710
See Notes to Consolidated Financial Statements
Consolidated Statements of Shareholders’ Equity RPM, Inc. and Subsidiaries(In thousands)
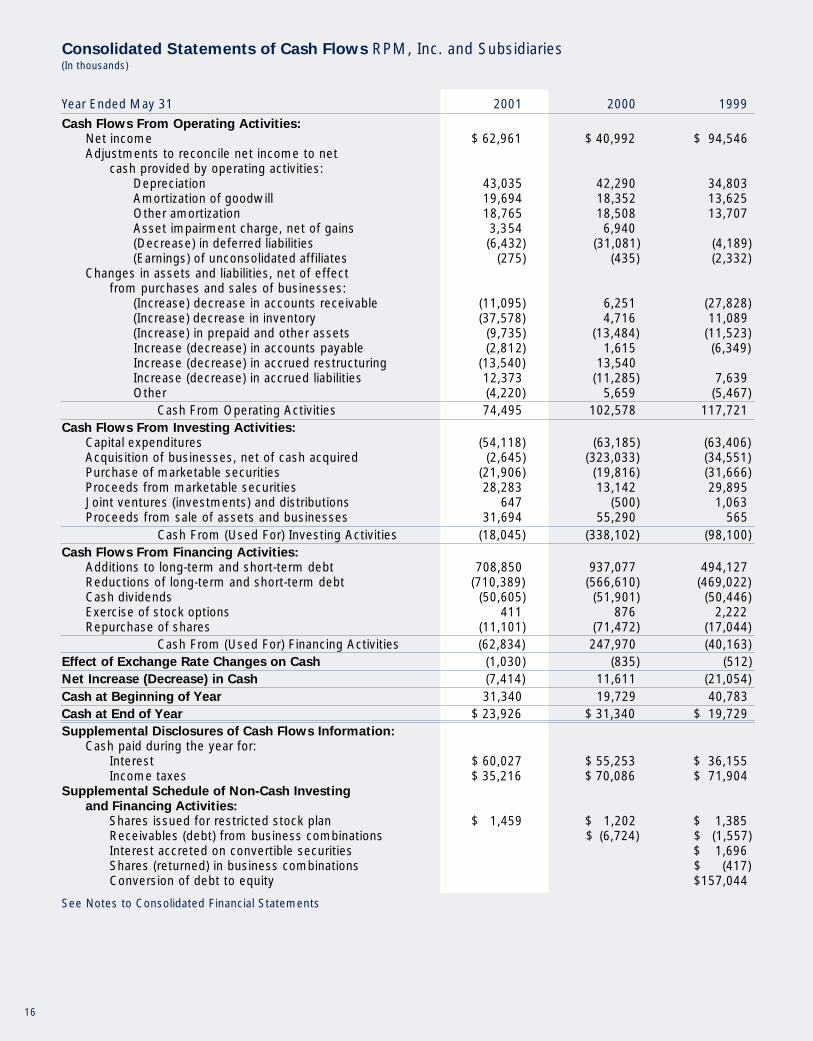
Year Ended May 31 2001 2000 1999
Cash Flows From Operating Activities:
Net income $ 62,961 $ 40,992 $ 94,546Adjustments to reconcile net income to net
cash provided by operating activities:Depreciation 43,035 42,290 34,803Amortization of goodwill 19,694 18,352 13,625Other amortization 18,765 18,508 13,707Asset impairment charge, net of gains 3,354 6,940(Decrease) in deferred liabilities (6,4 32) (31,081) (4,189)(Earnings) of unconsolidated affiliates (275) (435) (2,332)
Changes in assets and liabilities, net of effectfrom purchases and sales of businesses:
(Increase) decrease in accounts receivable (11,095) 6,251 (27,828)(Increase) decrease in inventory (37,578) 4,716 11,089(Increase) in prepaid and other assets (9,735) (13,484) (11,523)Increase (decrease) in accounts payable (2,8 12) 1,615 (6,349)Increase (decrease) in accrued restructuring (13,540) 13,540Increase (decrease) in accrued liabilities 12,373 (11,285) 7,639Other (4,2 2 0) 5,659 (5,467)
Cash From Operating Activities 74,495 102,578 117,721Cash Flows From Investing Activities:
Capital expenditures (54,118) (63,185) (63,406)Acquisition of businesses, net of cash acquired (2,645) (323,033) (34,551)Purchase of marketable securities (21,906) (19,816) (31,666)Proceeds from marketable securities 28,283 13,142 29,895Joint ventures (investments) and distributions 647 (500) 1,063Proceeds from sale of assets and businesses 31,694 55,290 565
Cash From (Used For) Investing Activities (18,045) (338,102) (98,100)Cash Flows From Financing Activities:
Additions to long-term and short-term debt 708,850 937,077 494,127Reductions of long-term and short-term debt (710,389) (566,610) (469,022)Cash dividends (50,605) (51,901) (50,446)Exercise of stock options 411 876 2,222Repurchase of shares (11,101) (71,472) (17,044)
Cash From (Used For) Financing Activities (62,834) 247,970 (40,163)Effect of Exchange Rate Changes on Cash (1,0 3 0) (835) (512)Net Increase (Decrease) in Cash (7,414) 11,611 (21,054)Cash at Beginning of Year 31,340 19,729 40,783Cash at End of Year $ 23,926 $ 31,340 $ 19,729Supplemental Disclosures of Cash Flows Information:
Cash paid during the year for:Interest $ 60,027 $ 55,253 $ 36,155Income taxes $ 35,216 $ 70,086 $ 71,904
Supplemental Schedule of Non-Cash Investing
and Financing Activities:
Shares issued for restricted stock plan $ 1,459 $ 1,202 $ 1,385Receivables (debt) from business combinations $ (6,724) $ (1,557)Interest accreted on convertible securities $ 1,696Shares (returned) in business combinations $ (417)Conversion of debt to equity $157,044
See Notes to Consolidated Financial Statements
Consolidated Statements of Cash Flows RPM, Inc. and Subsidiaries(In thousands)
16

Notes to Consolidated Financial Statements
Note A – A Summary of Significant
Accounting Principles
(1) Principles of Consolidation
The consolidated financial statements include the
accounts of RPM, Inc. and its majority owned
subsidiaries. The Company accounts for its investment
in less than majority owned joint ventures under the
equity method. Intercompany accounts, transactions
and unrealized profits and losses are eliminated
in consolidation.
Certain reclassifications have been made to prior year
amounts to conform with the current year presentation.
(2) Business Combinations
During the two year period ended May 31, 2001,
the Company completed several acquisitions which
have been accounted for by the purchase method of
accounting. The $199,435,000 difference between
the fair value of net assets acquired and the purchase
consideration of $354,810,000 has been allocated to
goodwill. The assets, liabilities and operating results
of these companies are reflected in the Company’s
financial statements from their respective dates of
acquisition forward.
The Company also completed several divestitures of
businesses and product lines during the past two years,
realizing proceeds of $74,262,000. The resulting net
gains of $823,000 for the year ended May 31, 2001 and
$11,993,000 for the year ended May 31, 2000, when
netted against non-recurring costs, had an immaterial
effect on net income.
Pro forma results of operations, reflecting the acquisitions
and divestitures for the years ended May 31, 2001 and
May 31, 2000, were not materially different from
reported results.
(3) Foreign Currency
The functional currency of foreign subsidiaries is their
local currency. Accordingly, for the periods presented,
assets and liabilities have been translated using exchange
rates at year end while income and expense for the
periods have been translated using an annual average
exchange rate. The resulting translation adjustments
have been recorded in other comprehensive loss, a
component of shareholders’ equity, and will be included
in net earnings only upon the sale or liquidation of
the underlying foreign investment, which is not
contemplated at this time. Transaction gains and losses
have been immaterial during the past three fiscal years.
May 31, 2001, 2000 and 1999
17

18
(5) Cash and Short-Term Investments
For purposes of the statement of cash flows, the
Company considers all highly liquid debt instruments
purchased with a maturity of three months or less to
be cash equivalents. The Company does not believe
it is exposed to any significant credit risk on cash and
short-term investments.
(6) Marketable Securities
Marketable securities, all of which are classified as
available for sale, total $24,480,000 and $29,277,000 at
May 31, 2001 and 2000, respectively. The estimated fair
values of these securities are included in other current
assets and are based on quoted market prices.
(7) Financial Instruments
The Company’s financial instruments recorded on the
balance sheet include cash and short-term investments,
accounts receivable, notes and accounts payable and
debt. The carrying amount of cash and short-term
investments, accounts receivable and notes and accounts
payable approximates fair value because of their
short-term maturity.
The carrying amount of the Company’s debt instruments
approximates fair value based on quoted market prices,
variable interest rates or borrowing rates for similar types
of debt arrangements.
(8) Inventories
Inventories are stated at the lower of cost or market, cost
being determined substantially on a first-in, first-out
(FIFO) basis and market being determined on the basis
of replacement cost or net realizable value. Inventory
costs include raw material, labor and manufacturing
overhead. Inventories were composed of the following
major classes:
May 31 2001 2000(In thousands)Raw material and supplies $ 89,071 $ 86,755Finished goods 188,423 157,804Total Inventory $277,494 $244,559
(4) Comprehensive Income
Accumulated other comprehensive loss (which is shown net of taxes) consists of the following components:
Foreign Minimum UnrealizedCurrency Pension Gain (Loss)
Translation Liability On(In thousands) Adjustments Adjustments Securities Total
Balance at May 31, 1998 $(13,821) $ (786) $ 65 $(14,542)Reclassification adjustments for
(gains) losses included in net income (65) (65)Other Comprehensive Loss (8,496) (67) (738) (9,301)
Balance at May 31, 1999 (22,317) (853) (738) (23,908)Reclassification adjustments for
(gains) losses included in net income 738 738Other Comprehensive Loss (16,223) 853 (1,015) (16,385)
Balance at May 31, 2000 (38,540) (1,015) (39,555)Reclassification adjustments for
(gains) losses included in net income 1,015 1,015Other Comprehensive Loss (14,552) (102) 120 (14,534)
Balance at May 31, 2001 $(53,092) $ (102) $ 120 $(53,074)

19
(9) Depreciation
Depreciation is computed over the estimated useful lives
of the assets primarily using the straight-line method.
Depreciation expense charged to operations for the
three years ended May 31, 2001 was $43,035,000,
$42,290,000 and $34,803,000, respectively. The annual
depreciation rates are based on the following ranges of
useful lives:
Land improvements 10 to 50 years
Buildings and improvements 5 to 50 years
Machinery and equipment 3 to 20 years
(10) Intangibles
The excess of cost over the underlying value of the
net assets of companies acquired is being amortized
on the straight-line basis, primarily over 40 years.
Amortization expense charged to operations for the
three years ended May 31, 2001 was $19,694,000,
$18,352,000 and $13,625,000, respectively. Goodwill is
shown net of accumulated amortization of $103,494,000
at May 31, 2001 ($88,060,000 at May 31, 2000).
Intangible assets also represent costs allocated to
formulae, trademarks and other specifically identifiable
assets arising from business acquisitions. These assets
are being amortized using the straight-line method
principally over periods of 7 to 40 years. The Company
assesses the recoverability of the excess of cost over the
assigned value of net assets acquired by determining
whether the amortization of the balance over its
remaining life can be recovered through undiscounted
future operating cash flows of the acquired operations.
Amortization expense charged to operations for the
three years ended May 31, 2001 was $16,602,000,
$17,084,000 and $12,504,000, respectively.
Other intangible assets consist of the following
major classes:
May 31 2001 2000(In thousands)Formulae $167,845 $170,146Trademarks 105,466 106,363Distributor networks 39,034 39,076Workforce 38,107 40,589Other 30,627 34,635
381,079 390,809Accumulated amortization 80,707 70,178Other Intangible Assets, Net $300,372 $320,631
(11) Research and Development
Research and development costs are charged to
operations when incurred and are included in operating
expenses. The amounts charged for the three years ended
May 31, 2001 were $21,841,000, $22,328,000 and
$18,022,000, respectively. The customer sponsored
portion of such expenditures was not significant.
(12) Interest Expense, Net
In t e rest expense is shown net of investment income which
consists of interest, dividends and capital gains. In ve s t-
ment income for the three years ended May 31, 2001 was
$3,682,000, $2,643,000 and $4,880,000, re s p e c t i ve l y.
(13) Income Taxes
The Company and its wholly owned domestic
subsidiaries file a consolidated federal income tax return.
The tax effects of transactions are recognized in the year
in which they enter into the determination of net
income, regardless of when they are recognized for tax
purposes. As a result, income tax expense differs from
actual taxes payable. The accumulation of these
differences at May 31, 2001 is shown as a noncurrent
liability of $54,134,000 (net of a noncurrent asset
of $74,268,000). At May 31, 2000, the noncurrent
liability was $60,566,000 (net of a noncurrent asset
of $72,323,000). The Company does not intend to

distribute the accumulated earnings of consolidated
foreign subsidiaries amounting to $102,847,000 at
May 31, 2001, and $92,706,000 at May 31, 2000,
and therefore no provision has been made for the taxes
which would result if such earnings were remitted to
the Company.
(14) Estimates
The preparation of financial statements in conformity
with generally accepted accounting principles requires
management to make estimates and assumptions that
affect the reported amounts of assets and liabilities,
disclosure of contingent assets and liabilities at the date
of the financial statements and the reported amounts
of revenues and expenses during the reporting period.
Actual results could differ from those estimates.
(15) Reportable Segments
Reportable segment information appears on pages 6
and 7 of this report.
(16) Changes in Accounting Policies
Derivatives
The Company adopted Statement of Financial
Accounting Standards No. 133 “Accounting for
Derivative Instruments and Hedging Activities” (“SFAS
No. 133”) beginning June 1, 2001. SFAS No. 133, as
amended by SFAS No. 138, establishes accounting and
reporting standards that require derivative instruments
to be recorded in the balance sheet as either an asset or
liability measured at its fair value. SFAS No. 133 also
requires that changes in the derivative’s fair value be
recognized currently in earnings unless specific hedge
accounting criteria are met. The Company has only
limited involvement with derivative financial instruments
and does not use them for trading purposes. The
adoption of SFAS No. 133 will not have a material
impact on the Company’s consolidated results of
operations, financial position or cash flows.
Revenue Recognition
The Company’s subsidiaries recognize revenue when title
and risk of loss passes to customers. Staff Accounting
Bulletin No. 101, “Revenue Recognition,” issued by the
Securities and Exchange Commission, did not have an
impact on the Company’s operating revenues for any of
the years presented.
The Financial Accounting Standards Board’s Emerging
Issues Task Force pronouncements issued during the
current year covering shipping and handling costs and
certain sales incentives have been adopted. The net
impact of these accounting changes resulted in modest
increases in net sales with offsets to selling, general and
administrative expenses. This change has no effect on the
dollar amount of the Company’s net income. Prior year
net sales and selling, general and administrative expenses
have been reclassified to conform to current period
presentation.
Shipping costs paid to third party shippers for
transporting products to customers are included in
selling, general and administrative expense. For the years
ended May 31, 2001, 2000 and 1999, shipping costs
were $75,400,000, $66,100,000 and $56,000,000,
respectively.
Goodwill and Other Intangibles
The Company adopted Statement of Financial
Accounting Standards No. 142 “Goodwill and Other
Intangible Assets” effective June 1, 2001. The Standard
replaces the requirement to amortize goodwill and
certain other intangible assets with an impairment test
requirement. The Company is in the process of
evaluating this Standard and its impact on net income.
20

21
Note B – Borrowings
A description of long-term debt follows:
May 31 2001 2000
(In thousands)
Revolving credit agreement for $500,000,000 with a syndicate of banks through July 14, 2005. Interest, which is tied to LIBOR, averaged 6.09% at May 31, 2001. The Chairman of the Board and Chief Executive Officer of the Company is a director of one of the banks providing this facility. $500,000 $ -0-
Revolving 364-day credit agreement for $200,000,000 with a syndicate of banks. Interest, which is tied to LIBOR, averaged 5.62% at May 31, 2001. 155,700 -0-
Commercial Paper refinanced with proceeds from the credit agreements described above. -0- 604,000
Short-term borrowings with a bank bearing interest of 5.63% at May 31, 2001. These obligations along with other short-term borrowings have been reclassified as long-term debt reflecting the Company’s intent and ability, through unused credit facilities, to refinance these obligations. 33,000 75,000
7.00% unsecured senior notes due June 15, 2005. 150,000 150,000
Unsecured notes due March 1, 2008, interest, which is tied to LIBOR, averaged 5.10% at May 31, 2001. 100,000 100,000
Revolving multi-currency credit agreement for $15,000,000 with a bank through December 31, 2002. Interest, which is tied to one of various rates, averaged 5.67% at May 31, 2001. 9,827 -0-
Revolving 364-day multi-currency credit agreement for $23,445,000 with a bank. Interest, which is tied to one of various rates, averaged 5.30% at May 31, 2000. -0- 17,553
6.75% unsecured senior notes due to an insurance company in annual installments through 2003. 5,143 6,857
Other notes and mortgages payable at various rates of interest due in installments through 2008, substantially secured by property. 9,108 10,907
962,778 964,317
Less current portion 7,379 4,987
Total Long-term Debt, Less Current Maturities $955,399 $959,330
Subsequent to year end, the Company refinanced the $200,000,000 credit agreement with a one-year term loan due July 12, 2002.
At May 31, 2001, the Company had additional
unused short-term lines of credit with several banks
totalling $51,600,000, in addition to the $44,300,000
available under the $200 million, 364-day revolving
credit agreement.
The aggregate maturities of long-term debt for the five
years subsequent to May 31, 2001 are as follows: 2002 -
$7,379,000; 2003 - $202,075,000; 2004 - $2,960,000;
2005 - $269,000; 2006 - $650,030,000.

22
Note C – Income Taxes
Consolidated income before taxes consists of the following:
Year Ended May 31 2001 2000 1999(In thousands)
United States $ 81,853 $ 41,424 $124,965Foreign 19,634 30,337 34,632
$101,487 $ 71,761 $159,597
Provision for income taxes consists of the following:
Current:U.S. federal $ 38,991 $ 43,174 $ 48,609State and local 3,829 3,547 7,448Foreign 2,138 15,129 13,183
44,958 61,850 69,240
Deferred:U.S. federal (4,831) (29,028) (6,238)Foreign (1,601) (2,053) 2,049
(6,432) (31,081) (4,189)Provision for Income Taxes $ 38,526 $ 30,769 $ 65,051
A reconciliation between the actual income tax expense provided and the income tax expense computed by applying
the statutory federal income tax rate of 35% to income before tax is as follows:
Income taxes at U.S. statutory rate $ 35,520 $ 25,116 $ 55,859Difference in foreign taxes versus the U.S. statutory rate (1,563) 2,458 1,032State and local income taxes net of federal income tax benefit 2,489 2,306 4,841Tax credits (676) (340) (660)Amortization of goodwill 4,530 4,285 3,326Tax benefits from foreign sales corporation (1,675) (1,725) (1,860)Other (99) (1,331) 2,513Actual Tax Expense $ 38,526 $ 30,769 $ 65,051Actual Tax Rate 37.96% 42.88% 40.76%
Deferred income taxes result from timing differences in recognition of revenue and expense for book and tax purposes,
primarily from the tax timing differences relating to business combinations.
Note D – Common Shares
There are 200,000,000 common shares authorized
with a stated value of $.015 per share. At May 31, 2001
and 2000, there were 102,211,000 and 103,134,000
shares outstanding, respectively, each of which is entitled
to one vote.
Basic earnings per share is computed by dividing income
available to common shareholders, the numerator, by the
weighted average number of common shares outstanding
during each year, the denominator (102,202,000 in
2001, 107,221,000 in 2000 and 108,731,000 in 1999).
In computing diluted earnings per share, the net income
was increased in 1999 by the add back of interest
expense, net of tax, on convertible securities assumed to
be converted. In addition, the number of common shares
was increased by common stock options with exercisable
prices lower than the average market prices of common
shares during each year and reduced by the number of
shares assumed to have been purchased with proceeds
from the exercised options. In 1999 the number of
common shares was also increased by additional shares
issuable assuming conversion of convertible securities.

23
In April 1997, the Company adopted a Restricted Stock
Plan. The Plan is intended to replace, over a period
of time, the Company’s existing cash based Benefit
Restoration Plan. Under the terms of the Plan, up to
1,563,000 shares may be awarded to certain employees
through May 2007. For the year ended May 31, 2001,
175,000 shares were awarded under this Plan, net of
forfeitures (108,000 shares in 2000). Substantially, none
of these awards, which generally are subject to forfeiture
until the completion of five years of service, were vested
at May 31, 2001 or 2000.
In 1999, the Company authorized the repurchase of up
to 10,000,000 of its common shares. The repurchase of
shares under this program were made in the open market
or in private transactions, at times and in amounts and
prices that management deemed appropriate. The
Company terminated the repurchase program in July
2000, through which time the Company had repurchased
8,970,000 shares (7,813,000 through May 31, 2000)
at an aggregate cost of $99,617,000 ($88,516,000 at
May 31, 2000). The Company has subsequently reissued
28,000 of these shares in connection with its Stock
Option program, bringing the balance to 8,942,000 in
treasury shares. Shares repurchased under this program
are held at cost and are included in Shareholders’ Equity
as treasury shares.
In April 1999, the Company adopted a Shareholder
Rights Plan and declared a dividend distribution of one
right for each outstanding common share. The Plan
provides existing shareholders the right to purchase shares
of the Company at a discount in certain circumstances
as defined by the Plan. The rights are not exercisable at
May 31, 2001 and expire in May 2009.
The Company has options outstanding under two
stock option plans, the 1989 Stock Option Plan and the
1996 Key Employees Stock Option Plan, which provide
for the granting of options for up to 9,000,000 shares
(4,500,000 shares in 2000 and 1999). These options
are generally exercisable cumulatively in equal annual
installments commencing one year from the grant date
and have expiration dates ranging from July 2001 to
April 2011. At May 31, 2001, 3,589,000 shares (291,000
at May 31, 2000) were available for future grant.
Transactions during the last two years are summarized
as follows:
Shares Under Option 2001 2000(In thousands)
Outstanding, beginning of year (weighted average price of $13.01 ranging from $5.84 to $17.25 per share) 6,243 4,708
Granted (weighted average price of $9.21 ranging from $8.69 to $9.26 per share) 1,202 1,843
Cancelled (weighted average price of $13.26 ranging from $8.81 to $17.25 per share) (369) (208)
Exercised (weighted average price of $6.92 ranging from $5.84 to $8.42 per share) (59) (100)
Outstanding, end of year (weighted average price of
$12.39 ranging from $8.42 to $16.35 per share) 7,017 6,243
Exercisable, end of year (weighted average price of
$13.17 ranging from $8.42 to $16.35 per share) 3,947 3,103
24
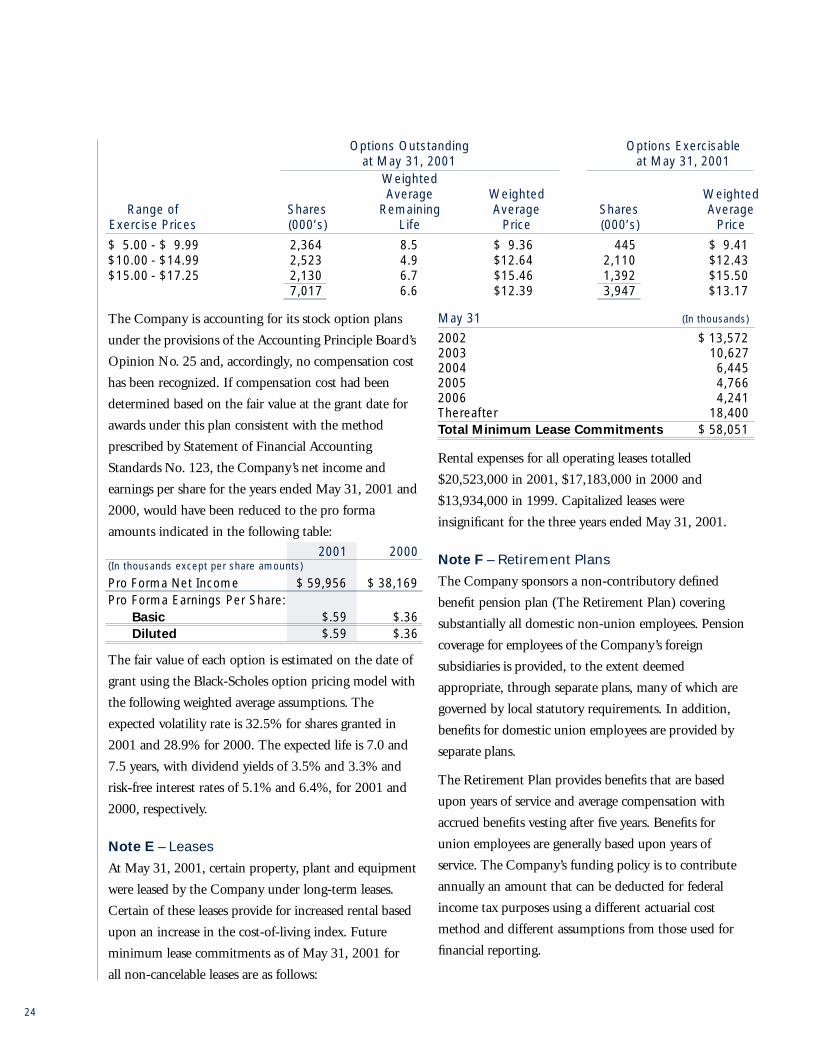
Options Outstanding Options Exercisableat May 31, 2001 at May 31, 2001
WeightedAverage Weighted Weighted
Range of Shares Remaining Average Shares AverageExercise Prices (000’s) Life Price (000’s) Price
$ 5.00 - $ 9.99 2,364 8.5 $ 9.36 445 $ 9.41$10.00 - $14.99 2,523 4.9 $12.64 2,110 $12.43$15.00 - $17.25 2,130 6.7 $15.46 1,392 $15.50
7,017 6.6 $12.39 3,947 $13.17
The Company is accounting for its stock option plans
under the provisions of the Accounting Principle Board’s
Opinion No. 25 and, accordingly, no compensation cost
has been recognized. If compensation cost had been
determined based on the fair value at the grant date for
awards under this plan consistent with the method
prescribed by Statement of Financial Accounting
Standards No. 123, the Company’s net income and
earnings per share for the years ended May 31, 2001 and
2000, would have been reduced to the pro forma
amounts indicated in the following table:
2001 2000(In thousands except per share amounts)
Pro Forma Net Income $ 59,956 $ 38,169Pro Forma Earnings Per Share:
Basic $.59 $.36Diluted $.59 $.36
The fair value of each option is estimated on the date of
grant using the Black-Scholes option pricing model with
the following weighted average assumptions. The
expected volatility rate is 32.5% for shares granted in
2001 and 28.9% for 2000. The expected life is 7.0 and
7.5 years, with dividend yields of 3.5% and 3.3% and
risk-free interest rates of 5.1% and 6.4%, for 2001 and
2000, respectively.
Note E – Leases
At May 31, 2001, certain property, plant and equipment
were leased by the Company under long-term leases.
Certain of these leases provide for increased rental based
upon an increase in the cost-of-living index. Future
minimum lease commitments as of May 31, 2001 for
all non-cancelable leases are as follows:
May 31 (In thousands)
2002 $ 13,5722003 10,6272004 6,4452005 4,7662006 4,241Thereafter 18,400Total Minimum Lease Commitments $ 58,051
Rental expenses for all operating leases totalled
$20,523,000 in 2001, $17,183,000 in 2000 and
$13,934,000 in 1999. Capitalized leases were
insignificant for the three years ended May 31, 2001.
Note F – Retirement Plans
The Company sponsors a non-contributory defined
benefit pension plan (The Retirement Plan) covering
substantially all domestic non-union employees. Pension
coverage for employees of the Company’s foreign
subsidiaries is provided, to the extent deemed
appropriate, through separate plans, many of which are
governed by local statutory requirements. In addition,
benefits for domestic union employees are provided by
separate plans.
The Retirement Plan provides benefits that are based
upon years of service and average compensation with
accrued benefits vesting after five years. Benefits for
union employees are generally based upon years of
service. The Company’s funding policy is to contribute
annually an amount that can be deducted for federal
income tax purposes using a different actuarial cost
method and different assumptions from those used for
financial reporting.

25
Net periodic pension cost (income) consisted of the following for the three years ended May 31, 2001:
U.S. Plans Non-U.S. Plans2001 2000 1999 2001 2000 1999
(In thousands)
Service cost $7,742 $6,650 $7,247 $1,112 $1,122 $1,041Interest cost 6,470 5,678 5,253 2,314 2,176 2,263Expected return on plan assets (9,157) (6,123) (6,071) (3,396) (3,026) (3,183)Amortization of:
Prior service cost 164 132 114Net gain on adoption of SFAS No. 87 (87) (96) (100)
Net actuarial (gains) losses recognized (62) 439 71 (85) 91 1Curtailment/settlement (gains) losses (722) 103 (1,728) (24) (308)Net Pension Cost $4,348 $6,783 $4,786 $ (55) $ 339 $ (186)
The changes in benefit obligations and plan assets, as well as the funded status of the Company’s pension plans at
May 31, 2001 and 2000 were as follows:
U.S. Plans Non-U.S. Plans2001 2000 2001 2000
(In thousands)
Benefit obligation at beginning of year $ 81,892 $ 76,328 $ 32,343 $ 33,006Service cost 7,742 6,650 1,112 1,122Interest cost 6,470 5,678 2,314 2,176Benefits paid (12,785) (3,820) (1,641) (1,376)Participant contributions 428 404Actuarial (gains) losses 4,156 (5,884) 2,219 (3,520)Currency exchange rate changes (2,600) 683Curtailment/settlement (gains) losses (721) (11,184) (152)Plan amendments 2,786Acquisitions 445 11,338Benefit Obligation at End of Year $ 87,199 $ 81,892 $ 34,175 $ 32,343
Fair value of plan assets at beginning of year $1 0 1,502 $ 61,715 $ 40,921 $ 36,469Actual return on plan assets (2,543) 22,675 186 4,138Employer contributions 7,202 9,772 500 421Participant contributions 428 404Benefits paid (12,785) (3,820) (1,641) (1,376)Currency exchange rate changes (2,837) 865Curtailment/settlement gains (losses) (6,092)Acquisitions 523 17,252Fair Value of Plan Assets at End of Year $ 93,899 $1 0 1,502 $ 37,557 $ 40,921
Excess of plan assets versus benefitobligations at end of year $ 6,700 $ 19,610 $ 3,382 $ 8,577
Contributions after measurement date 2,537 15 93 108Unrecognized actuarial (gains) losses 2,715 (13,191) 3,514 (1,811)Unrecognized prior service cost 1,568 1,732Unrecognized net transitional asset (198) (285)Net Amount Recognized $ 13,322 $ 7,881 $ 6,989 $ 6,874

26
U.S. Plans Non-U.S. Plans2001 2000 2001 2000
(In thousands)
Amounts recognized in the consolidated balance sheets consist of:
Prepaid benefit cost $ 14,057 $ 9,401 $ 7,973 $ 7,874Accrued benefit liability (781) (1,520) (1,041) (1,000)Accumulated other comprehensive loss 46 56Net Amount Recognized $ 13,322 $ 7,881 $ 6,988 $ 6,874
The following weighted average assumptions were used to determine the Company’s obligations under the plans:
U.S. Plans Non-U.S. Plans2001 2000 2001 2000
Discount rate 7.50% 8.00% 6.63% 6.17%Expected return on plan assets 9.00% 9.00% 8.25% 8.25%Rate of compensation increase 4.00% 4.50% 4.00% 4.25%
The plans’ assets consist primarily of stocks, bonds and fixed income securities.
The Company also sponsors an employee savings plan
under Section 401(k) of the Internal Revenue Code,
which covers substantially all non-union employees in the
United States. The Plan provides for matching
contributions in Company shares based upon qualified
employee contributions. Matching contributions
charged to income were $5,170,000, $4,925,000 and
$4,304,000 for years ending May 31, 2001, 2000 and
1999, respectively.
For domestic plans with accumulated benefit obligations
in excess of plan assets, the projected benefit obligation,
accumulated benefit obligation and fair value of assets
were $781,000, $781,000 and $ -0- , respectively, as of
May 31, 2001 and $1,243,000, $1,243,000 and $ -0- ,
respectively, as of May 31, 2000. For foreign plans with
accumulated benefit obligations in excess of plan assets,
the projected benefit obligation, accumulated benefit
obligation and fair value of assets were $1,145,000,
$1,042,000 and $ -0- , respectively, as of May 31, 2001
and $1,088,000, $944,000 and $ -0- , respectively, as of
May 31, 2000.

27
Note G – Postretirement Health Care Benefits
In addition to the defined benefit pension plan, the
Company also provides health care benefits to certain of
its retired employees through unfunded plans. Employees
become eligible for these benefits if they meet minimum
age and service requirements. The components of this
expense for the three years ended May 31, 2001 were
as follows:
2001 2000 1999(In thousands)
Service cost - Benefits earned during this period $ 81 $ 110 $ 99Interest cost on the accumulated obligation 918 890 784Amortization of unrecognized (gains) (124) (55) (40)Net Periodic Postretirement Expense $ 875 $ 945 $ 843
The changes in the benefit obligations of the plans at May 31, 2001 and 2000, were as follows:
2001 2000(In thousands)
Accumulated postretirement benefit obligation at beginning of year $11,928 $11,548Service cost 81 110Interest cost 918 890Settlement/curtailment (gains) losses (221)Acquisitions 1,629Benefit payments (972) (902)Actuarial (gains) losses 791 (1,238)Currency exchange rate changes (131) 112Accumulated postretirement benefit obligation at end of year 12,615 11,928Unrecognized actuarial gains (losses) 1,874 2,881Accrued Postretirement Health Care Benefits $14,489 $14,809
A 7.5% general discount rate was used in determining
the accumulated postretirement benefit obligation as of
May 31, 2001 (8.0% for May 31, 2000). A 7.0%
increase in the cost of covered health care benefits was
generally assumed for fiscal 2001 (8.0% for fiscal 2000).
This trend rate in all cases is assumed to decrease to 5.0%
after several years and remain at that level thereafter
except for various union plans which will cap at alternate
benefit levels. A 1.0% increase in the health care costs
trend rate would have increased the accumulated
postretirement benefit obligation as of May 31, 2001
by $1,275,000 and the net postretirement expense by
$113,000. A 1.0% decrease in the health care costs
trend rate would have decreased the accumulated
postretirement benefit obligation as of May 31, 2001
by $1,116,000 and the net postretirement expense
by $94,000.

28
Note H – Contingencies and Loss Reserves
Accrued loss reserves consisted of the following classes:
May 31 2001 2000(In thousands)
Accrued product liability reserves $ 39,054 $ 41,176Accrued warranty reserves - Current 5,170 7,908Accrued environmental reserves 9,557 14,116Accrued other 1,635 1,565Accrued loss reserves - Current 55,416 64,765Accrued warranty reserves - Long-term 11,959 13,740Total Accrued Loss Reserves $ 67,375 $ 78,505
The Company, through its wholly owned insurance
subsidiary, provides certain insurance coverage, primarily
product liability, to the Company’s other domestic
subsidiaries. Excess coverage is provided by outside
carriers. The reserves reflected above provide for these
potential losses as well as other uninsured claims.
Provision for estimated warranty costs is recorded at
the time of sale and periodically adjusted to reflect
actual experience.
In addition, the Company, like others in similar
businesses, is involved in several proceedings relating
to environmental matters. It is the Company’s policy
to accrue remediation costs when it is probable that
such efforts will be required and the related costs
can be reasonably estimated. These liabilities are
undiscounted and do not take into consideration
any possible recoveries of future insurance proceeds
or claims against third parties.
Due to the uncertainty inherent in the loss reserve
estimation process, it is at least reasonably possible that
actual costs will differ from estimates, but, based upon
information presently available, such future costs are not
expected to have a material adverse effect on the
Company’s competitive or financial position or its
ongoing results of operations. However, such costs could
be material to results of operations in a future period.

29
Note I – Restructuring and
Asset Impairment Charge
For the year ended May 31, 2000, the Company
recorded a restructuring charge of $51,970,000. Included
in this charge were severance and other employee related
costs of $21,986,000, contract exit and termination costs
of $2,059,000, facility closures and write-downs of
property, plant and equipment of $22,342,000 and
write-downs of intangibles of $5,583,000.
In addition to the $51,970,000 restructuring charge,
related costs were incurred during the May 31, 2000 year
primarily to account for inventory of certain product
lines that were being discontinued, totalling $7,876,000,
and these costs were charged to earnings and classified as
a component of cost of sales.
Through May 31, 2001, the Company has paid or
incurred all of the $51,970,000 restructuring charge as
reflected below:
Paid or Incurred inTotal Year Ended May 31
Charge 2001 2000(In thousands)
Severance costs $21,986 $12,058 $ 9,928Exit and termination costs 2,059 1,482 577Property, plant and equipment 22,342 22,342Intangibles 5,583 5,583Restructuring and Asset Impairment Charge $51,970 $13,540 $38,430
The severance and other employee related costs provided
for a reduction of approximately 780 employees related
to facility closures and streamlining of operations for cost
reduction initiatives. The costs of exit and contract
termination were comprised primarily of non-cancelable
lease obligations on the closed facilities. The charge for
property, plant and equipment represents write-downs to
net realizable value of less efficient and duplicate facilities
and machinery and equipment no longer needed in the
combined restructured manufacturing operations.

30
Note J – Interim Financial Information (Unaudited)
The following is a summary of the quarterly results of operations for the years ended May 31, 2001 and 2000:
Three Months EndedAugust 31 November 30 February 28 May 31
(In thousands except per share amounts)
2001
Net sales $554,923 $499,904 $405,400 $547,535Gross profit $249,252 $219,102 $167,537 $244,084Net income (loss) $ 28,850 $ 16,868 $ (7,018) $ 24,261Basic Earnings (Loss) Per Share $.28 $.17 $(.07) $.24Diluted Earnings (Loss) Per Share $.28 $.17 $(.07) $.24Dividends Per Share $.1225 $.1250 $.1250 $.1250
Three Months EndedAugust 31 November 30 February 29 May 31
(In thousands except per share amounts)
2000
Net sales $497,869 $502,450 $413,178 $548,913Gross profit $228,290 $216,309 $176,063 $242,111Net income $ 7,264 $ 20,364 $ 3,731 $ 9,633Basic Earnings Per Share $.07 $.19 $.04 $.09Diluted Earnings Per Share $.07 $.19 $.04 $.09Dividends Per Share $.1175 $.1225 $.1225 $.1225
Quarterly earnings per share do not total to the yearly earnings per share due to the weighted average number of
shares outstanding in each quarter.

31
Independent Auditor’s Report
Quarterly Stock Price and Dividend Information
RPM, Inc. common shares are traded on the New York Stock Exchange under the symbol RPM. The high and low
sale prices for the common shares, and the cash and stock dividends paid on the common shares, for each quarter
of the two most recent fiscal years is set forth in the table below.
Range of Market Prices
Fiscal 2001 High Low Dividends paid per share
1st Quarter $ 10.7500 $ 8.6250 $ 0.12252nd Quarter 10.2500 7.7500 0.12503rd Quarter 9.9375 8.2500 0.12504th Quarter 10.5000 8.2500 0.1250
Fiscal 2000 High Low Dividends paid per share
1st Quarter $ 15.0625 $ 13.1250 $ 0.11752nd Quarter 13.5000 11.1250 0.12253rd Quarter 11.8750 9.5000 0.12254th Quarter 11.3125 9.6875 0.1225
Source: The Wall Street Journal
The number of holders of record of RPM, Inc. Common Shares as of July 13, 2001 was 42,229.
To The Board of Directors and Shareholders
RPM, Inc. and Subsidiaries
Medina, Ohio
We have audited the accompanying consolidated balance
sheets of RPM, Inc. and Subsidiaries as of May 31, 2001
and 2000, and the related consolidated statements of
income, shareholders’ equity and cash flows for each of
the years in the three year period ended May 31, 2001.
These consolidated financial statements are the
responsibility of the Company’s management.
Our responsibility is to express an opinion on these
consolidated financial statements based on our audits.
We conducted our audits in accordance with auditing
standards generally accepted in the United States. Those
standards require that we plan and perform the audit to
obtain reasonable assurance about whether the financial
statements are free of material misstatement. An audit
includes examining, on a test basis, evidence supporting
the amounts and disclosures in the financial statements.
An audit also includes assessing the accounting principles
used and significant estimates made by management,
as well as evaluating the overall financial statement
presentation. We believe that our audits provide a
reasonable basis for our opinion.
In our opinion, the consolidated financial statements
referred to above present fairly, in all material respects,
the financial position of RPM, Inc. and Subsidiaries
at May 31, 2001 and 2000, and the results of their
operations and their cash flows for each of the years in
the three year period ended May 31, 2001, in conformity
with accounting principles generally accepted in the
United States.
Cleveland, Ohio
July 2, 2001
World HeadquartersRPM, Inc. 2628 Pearl Road P.O. Box 777Medina, OH 44258 Telephone: 330-273-5090 or 800-776-4488 Fax: 330-225-8743 Web site: http://www.rpminc.com E-mail: [email protected]
Annual Meeting Shareholders and friends are invited to attend RPM’s Annual Meeting, which will be held at theHoliday Inn Select, 15471 Royalton Rd. (Rt. 82 & I-71), Strongsville, Ohio, on Friday, October 12 at 2:00 p.m.
Form 10-K and Other Financial InformationShareholders may obtain a copy of the RPM AnnualReport to the Securities and Exchange Commission onForm 10-K, other investor information and a corporatevideo by writing to Kathie M. Rogers, Manager ofInvestor Relations, RPM, Inc., P.O. Box 777, Medina,OH 44258.
The Form 10-K, other public financial reports and newsreleases may also be obtained electronically through ourweb site, www.rpminc.com.
Stock Transfer Agent, Registrar and Dividend Disbursing AgentNational City Bank maintains the company’s shareholderrecords and is responsible for disbursing dividend checks.Questions concerning your account, change of address,transfer of ownership, lost certificates, safekeeping ofstock certificates, dividend payments and other relateditems, should be directed to:
National City Bank, Department 5352 Corporate Trust Operations P.O. Box 92301 Cleveland, OH 44193-0900 Telephone: 800-988-5238 or 800-622-6757 Fax: 216-257-8508 E-mail: [email protected]
Shareholders of record may access their accounts via the Internet to review account holdings and transactionhistory through National City Bank’s Stock Access at
www.ncstockaccess.com. Shareholders can downloadfrequently used forms, as well, from this web site. Forlog-in assistance, shareholders should contact NationalCity Bank at 800-622-6757 or 800-988-5238.
Direct Deposit of DividendsShareholders of record may have their dividendsdeposited directly into their checking or savings accountthrough the Direct Deposit Program at no charge. Forinformation regarding this service, please contactNational City Bank at the address above.
Dividend PaymentsCommon share dividends are payable quarterly, uponauthorization of the Board of Directors. Regular paymentdates are the 31st of July, October, January and the 30th of April.
Dividend Reinvestment PlanRPM maintains a Dividend Reinvestment Plan whereby cash dividends, and a maximum of an additional$5,000 per month, may be invested in RPM shares at nocommission cost. Approximately 88% of the shareholdersof record participate in the RPM Dividend ReinvestmentPlan. Details of the Plan are available by contactingRPM, Shareholder Services, at 800-776-4488.
Questions concerning your existing DividendReinvestment account should be directed to:
National City Bank, Department 5352 Corporate Trust Operations P. O. Box 94946 Cleveland, OH 44101-4946 Telephone: 800-988-5238 or 800-622-6757 Fax: 216-257-8367 E-mail: [email protected]
Common Share Symbol: RPM RPM, Inc. common share price is quoted on the New York Stock Exchange.
Independent Accountants Ciulla, Smith & Dale, LLP, Cleveland, Ohio
Counsel Calfee, Halter & Griswold LLP, Cleveland, Ohio
Shareholder Information
32
Dr. Max D. Amstutz (2): Elected 1995; Chairman, SGS – Societe Generale de Surveillance Holding Ltd.,Geneva Switzerland (world leader in verification,testing and certification); Chairman, Finter Bank Zurich(private banking); Former Managing Director,Holderbank Financiere Glaris Ltd., Glaris, Switzerland(cement); Former Chairman, Von Roll Holding Ltd.,Zurich, Switzerland (machinery); Former Chairman,Alusuisse-Lonza Holding Ltd., Zurich, Switzerland(aluminum, chemicals and packaging).
Edward B. Brandon (1), (3*): Elected 1989; RetiredChairman, National City Corporation; Director, NationalCity Corporation, Cleveland, Ohio.
Lorrie Gustin (2): Elected 1992; Director, NationalAssociation of Investors Corporation (NAIC) Trust,Madison Heights, Michigan; Secretary, WorldFederation of Investment Clubs, Krefeld, Germany;Past President of NAIC; Retired Vice President, FinanceIntegral Insurance Co., Milwaukee, Wisconsin.
E. Bradley Jones (1), (2): Elected 1990; RetiredChairman and Chief Executive Officer, Republic SteelCorporation, LTV Steel Company, Cleveland, Ohio, andGroup Vice President of the LTV Corporation, Dallas,Texas; Director, CSX Corporation, Richmond, Virginia;Trustee, Fidelity Charitable Gift Fund, Boston,Massachusetts.
James A. Karman (1): Elected 1963; Vice Chairman andChief Financial Officer; Director, Shiloh Industries, Inc.,Cleveland, Ohio; A. Schulman, Inc., Akron, Ohio;Metropolitan Financial Corporation, Cleveland, Ohio.
Donald K. Miller (2*): Elected 1972; Chairman, Axiom International Investor LLC, New York, New York (an international equity asset management firm);Director, Huffy Corporation, Dayton, Ohio; LayneChristensen Company, Mission Woods, Kansas.
William A. Papenbrock: Elected 1972; Retired partnerand past vice chairman of the executive committee,Calfee, Halter & Griswold LLP, Cleveland, Ohio(attorneys-at-law).
Albert B. Ratner (1), (3): Elected 1996; Co-Chairman of the Board of Forest City Enterprises, Inc., Cleveland, Ohio (a diversified real estate development corporation).
Frank C. Sullivan (1): Elected 1995; President.
Thomas C. Sullivan (1*): Elected 1963; Chairman of the Board and Chief Executive Officer; Director,Huffy Corporation, Dayton, Ohio; Pioneer-StandardElectronics, Inc., Cleveland, Ohio; National City Corporation, Cleveland, Ohio; Kaydon Corporation, Ann Arbor, Michigan.
Dr. Jerry Sue Thornton (1), (3): Elected 1999; Presidentof Cuyahoga Community College, Cleveland, Ohio;Director, American Greetings Corporation, Cleveland,Ohio; Applied Industrial Technologies, Inc., Cleveland,Ohio; National City Corporation, Cleveland, Ohio;OfficeMax, Inc., Shaker Heights, Ohio.
Joseph P. Viviano: Elected 2001; retired Vice Chairmanand Director, Hershey Foods Corporation; Director,Chesapeake Corporation, Richmond, Virginia; HarscoCorporation, Camp Hill, Pennsylvania; HuffyCorporation, Dayton, Ohio; R.J. Reynolds TobaccoCompany, Winston-Salem, North Carolina.
(1) Executive Committee (2) Audit Committee (3) Compensation Committee * Chairman
Directors and Officers
Board of Directors
Thomas C. Sullivan
Chairman and Chief Executive Officer
James A. Karman
Vice Chairman andChief Financial Officer
Frank C. Sullivan
President
Glenn R. Hasman
Vice President - Finance and Communications
Paul G. Hoogenboom
Vice President - Operations and Systems
Stephen J. Knoop
Vice President - CorporateDevelopment
Robert L. Matejka
Vice President - Controller
Ronald A. Rice
Vice President - Risk Management and Benefits
Keith R. Smiley
Vice President - Treasurer
P. Kelly Tompkins
Vice President, General Counsel and Secretary
Officers
B O N D E X®, BONDO®, CARBOLINE®,C H E M S P E C®, DAP®, DAY- G L O®,D RY V I T®, DYMERIC®, EUCO®,F I B E R G R AT E®, FLECTO®, KOP-COAT®, KWIK SEAL®, MAMECO®, MOHAW K®,M O N I L E®, PLASITE®, PLASTIC WOOD®,R U S T- O L E U M®, STONHARD®, TCI®,T E S T O R S®, THIBAUT®, TREMCO®,VA R AT H A N E®, VULKEM®, WAT C O®,W O O L S E Y®, Z I N S S E R® a n d Z - S PA R®
are registered trademarks of thesubsidiary corporations of RPM, Inc.
AMERICAN EMULSIONS™, CHEMICAL COATINGS™, PETTIT™,S TAR™, SENTRY™ a n d W E S T F I E L D ™are trademarks of the subsidiarycorporations of RPM, Inc.
WOLMAN is a registered trademarkowned by Beazer Materials andServices, Inc.
Industrial Division
Operating Companies
Printed on recycled paper.
Alteco Technik G.m.b.H.Twistringen, Germany
American Emulsions Co., Inc.Dalton, Georgia
APSA S. p. A.Milan, Italy
Carboline CompanySt. Louis, Missouri
Chemical Specialties Mfg. Corp.Baltimore, Maryland
Day-Glo Color Corp.Cleveland, Ohio
Dryvit Systems, Inc.West Warwick, Rhode Island
The Euclid Chemical CompanyCleveland, Ohio
Fibergrate Composite Structures Inc.Dallas, Texas
Kop-Coat, Inc.Pittsburgh, Pennsylvania
Multicor S.A. Argentina l.y C.Buenos Aires, Argentina
Nullifire LimitedCoventry, United Kingdom
RPM/Belgium N.V.Tielt, Belgium
Radiant Color N.V.Houthalen, Belgium
Republic Powdered Metals, Inc.Beachwood, Ohio
StonCor Africa (Pty.) Ltd.Johannesburg, South Africa
StonCor Benelux B.V.Brussels, Belgium
StonCor Group, Inc.Maple Shade, New Jersey
Stonhard South America Ltda.Sao Paulo, Brazil
TCI, Inc.Ellaville, Georgia
Tremco Asia Pte. Ltd.Singapore
Tremco CanadaToronto, Canada
Tremco IncorporatedCleveland, Ohio
Tremco LimitedSlough, United Kingdom
Consumer Division
Bondo CorporationAtlanta, GeorgiaCincinnati, Ohio
CPC Modern Masters, Inc.North Hollywood, California
Chemical Coatings, Inc.Hudson, North Carolina
DAP Products Inc.Baltimore, Maryland
The Flecto Company, Inc.Vernon Hills, Illinois
Guardian Products, Inc.Ceres, California
Mantrose-Haeuser Co., Inc.Westport, Connecticut
Martin Mathys N.V.Zelem, Belgium
Mohawk Finishing Products, Inc.Hudson, North Carolina
Rust-Oleum CorporationVernon Hills, Illinois
Rust-Oleum/EuropeParis, FranceRoosendaal, The Netherlands
The Testor CorporationRockford, Illinois
Richard E. Thibaut, Inc.Newark, New Jersey
Westfield Coatings Corp.Westfield, Massachusetts
Wm. Zinsser & Co. Inc.Somerset, New Jersey
Plant Locations
Argentina
Belgium
Brazil
Canada
China
Colombia
Germany
Italy
Malaysia
Mexico
The Netherlands
New Zealand
Poland
South Africa
United Arab Emirates
United Kingdom
United States of America
RPM, Inc. • 2628 Pearl Road • P.O. Box 777 • Medina, Ohio 44258Phone: 330-273-5090 • Fax: 330-225-8743 • Web: www.rpminc.com