Responses of European forest ecosystems to century climate ...
18
Research Article - doi: 10.3832/ifor0572-004 © iForest – Biogeosciences and Forestry Introduction Climate warming raises many questions about living organisms and ecosystems. Among these, there are considerable interest in species or biome distribution prediction, carbon cycling and impacts of droughts on ecosystems and forest fires. The problem of species distribution is mainly related to biodiversity protection. According to Thuiller et al. (2008), a gro- wing literature is bringing convincing proofs that changes in regional climates have already pushed species to adapt their ranges, that some species are altering their pheno- logy and that others are in danger of extinc- tion, or have become extinct. At the present time, biodiversity loss is mainly due to habi- tat loss in quantity and quality, excess of har- vest pressure and pollutants (Scholes & Biggs 2005). Nevertheless, Thuiller et al. (2008) point out recent calls to account for the climate change and the related dynamic nature of biodiversity in conservation mana- gement programs. The challenge of carbon cycling studies is double. On the one hand, it is important to determine how each one of the ecosystems acts, as a source or as a sink of greenhouse gases to produce a global picture of carbon cycling and refine projections (Ciais et al. 2005, Peng et al. 2009, Tagesson et al. 2009). In terrestrial ecosystems, climate change will affect primary production, respi- ration, soil carbon stocks and fire in contra- sted ways. According to model projections (Melillo et al. 1993, Coops & Waring 2001, Peng et al. 2009), temperature rise could in- crease net primary production by several tens of percents in various ecosystems but only when coupled with effective fertilizing effect of CO2 and precipitation increase; otherwise, only negative changes were ob- tained. On the other hand, farm lands but also natural habitats and semi-natural areas such as managed forests and savannahs fur- nish various services and goods including the source of natural productions (timbers, firewood, medicinal matters, fodder, genetic resources, etc.) in addition to their ecological functions (De Groot et al. 2002). Accurately quantifying their values would help to imple- ment sustainable practices and to promote the conservation of the ecological function of carbon sink and eventually of the bio- diversity. Here, models reveal contrasted re- sponses to future climate, from positive to negative effects on the services and goods but mainly increased vulnerability (Schröter et al. 2005). Climate projections also indicate changes in climate variability and frequency of extre- me events (Easterling et al. 2000, Giorgi et al. 2004a, 2004b, Rowell 2005). Since many biological processes undergo sudden shifts at particular thresholds for temperature or pre- cipitation, altered meteorological variability has long-term consequences for ecosystem composition, functioning and carbon storage (Medvigy et al. 2010). Changes in the fre- quency of droughts or extreme seasonal pre- cipitation might lead to physical and beha- vioural changes in a few species and to dra- © SISEF http://www.sisef.it/iforest/ 82 iForest (2011) 4: 82-99 (1) Unité de Modélisation du Climat et des Cycles Biogéochimiques, Université de Liège, Bat. B5c, Allée du Six Août 17, B-4000 Liège (Belgium); (2) Département des Sciences et de Gestion de l’Environnement, Université de Liège, Quai Van Beneden 22, B-4000 Liège (Belgium); (3) Laboratoire de Physique Atmosphérique et Planétaire, Université de Liège, Bat. B5c, Allée du Six Août 17, B-4000 Liège (Belgium). @ Marie Dury ([email protected]) Received: Jul 16, 2010 - Accepted: Dec 09, 2010 Citation: Dury M, Hambuckers A, Warnant P, Henrot A, Favre E, Ouberdous M, François L, 2011. Responses of European forest ecosystems to 21st century climate: assessing changes in interannual variability and fire intensity. iForest 4: 82-99 [online: 2011-04-07] URL: http://www.sisef.it/ iforest/show.php?id=572 Collection: IUFRO RG 7.01 (2010) - Antalya (Turkey) Adaptation of Forest Ecosystems to Air Pollution and Climate Change Guest Editors: Elena Paoletti, Yusuf Serengil Responses of European forest ecosystems to 21 st century climate: assessing changes in interannual variability and fire intensity Dury M (1) , Hambuckers A (2) , Warnant P (1) , Henrot A (3) , Favre E (1) , Ouberdous M (1) , François L (1) Significant climatic changes are currently observed and, according to projec- tions, will be strengthened over the 21 st century throughout the world with the continuing increase of the atmospheric CO2 concentration. Climate will be ge- nerally warmer with notably changes in the seasonality and in the precipitation regime. These changes will have major impacts on the biodiversity and the functioning of natural ecosystems. The CARAIB dynamic vegetation model dri- ven by the ARPEGE/Climate model under forcing from the A2 IPCC emission scenario is used to illustrate and analyse the potential impacts of climate change on forest productivity and distribution as well as fire intensity over Europe. The potential CO2 fertilizing effect is studied throughout transient runs of the vegetation model over the 1961-2100 period assuming constant and increasing atmospheric CO2 concentration. Without fertilisation effect, the net primary productivity (NPP) might increase in high latitudes and altitudes (by up to 40 % or even 60-100 %) while it might decrease in temperate (by up to 50 %) and in warmer regions, e.g., Mediterranean area (by up to 80 %). This strong decrease in NPP is associated with recurrent drought events occurring mostly in summer time. Under rising CO2 concentration, NPP increases all over Europe by as much as 25-75%, but it is not clear whether or not soils might sustain such an increase. The model indicates also that interannual NPP variability might strongly increase in the areas which will undergo recurrent water stress in the future. During the years exhibiting summer drought, the NPP might de- crease to values much lower than present-day average NPP even when CO 2 fer- tilization is included. Moreover, years with such events will happen much more frequently than today. Regions with more severe droughts might also be af- fected by an increase of wildfire frequency and intensity, which may have large impacts on vegetation density and distribution. For instance, in the Medi- terranean basin, the area burned by wildfire can be expected to increase by a factor of 3-5 at the end of the 21 st century compared to present. Keywords: Productivity, Soil water, Fire disturbance, Climate change, Model- ling
Transcript of Responses of European forest ecosystems to century climate ...

Research Article - doi: 10.3832/ifor0572-004 ©iForest – Biogeosciences and Forestry
IntroductionClimate warming raises many questions
about living organisms and ecosystems. Among these, there are considerable interest in species or biome distribution prediction, carbon cycling and impacts of droughts on ecosystems and forest fires.
The problem of species distribution is mainly related to biodiversity protection. According to Thuiller et al. (2008), a gro-wing literature is bringing convincing proofs that changes in regional climates have already pushed species to adapt their ranges, that some species are altering their pheno-logy and that others are in danger of extinc-tion, or have become extinct. At the present
time, biodiversity loss is mainly due to habi-tat loss in quantity and quality, excess of har-vest pressure and pollutants (Scholes & Biggs 2005). Nevertheless, Thuiller et al. (2008) point out recent calls to account for the climate change and the related dynamic nature of biodiversity in conservation mana-gement programs.
The challenge of carbon cycling studies is double. On the one hand, it is important to determine how each one of the ecosystems acts, as a source or as a sink of greenhouse gases to produce a global picture of carbon cycling and refine projections (Ciais et al. 2005, Peng et al. 2009, Tagesson et al. 2009). In terrestrial ecosystems, climate
change will affect primary production, respi-ration, soil carbon stocks and fire in contra-sted ways. According to model projections (Melillo et al. 1993, Coops & Waring 2001, Peng et al. 2009), temperature rise could in-crease net primary production by several tens of percents in various ecosystems but only when coupled with effective fertilizing effect of CO2 and precipitation increase; otherwise, only negative changes were ob-tained. On the other hand, farm lands but also natural habitats and semi-natural areas such as managed forests and savannahs fur-nish various services and goods including the source of natural productions (timbers, firewood, medicinal matters, fodder, genetic resources, etc.) in addition to their ecological functions (De Groot et al. 2002). Accurately quantifying their values would help to imple-ment sustainable practices and to promote the conservation of the ecological function of carbon sink and eventually of the bio-diversity. Here, models reveal contrasted re-sponses to future climate, from positive to negative effects on the services and goods but mainly increased vulnerability (Schröter et al. 2005).
Climate projections also indicate changes in climate variability and frequency of extre-me events (Easterling et al. 2000, Giorgi et al. 2004a, 2004b, Rowell 2005). Since many biological processes undergo sudden shifts at particular thresholds for temperature or pre-cipitation, altered meteorological variability has long-term consequences for ecosystem composition, functioning and carbon storage (Medvigy et al. 2010). Changes in the fre-quency of droughts or extreme seasonal pre-cipitation might lead to physical and beha-vioural changes in a few species and to dra-
© SISEF http://www.sisef.it/iforest/ 82 iForest (2011) 4: 82-99
(1) Unité de Modélisation du Climat et des Cycles Biogéochimiques, Université de Liège, Bat. B5c, Allée du Six Août 17, B-4000 Liège (Belgium); (2) Département des Sciences et de Gestion de l’Environnement, Université de Liège, Quai Van Beneden 22, B-4000 Liège (Belgium); (3) Laboratoire de Physique Atmosphérique et Planétaire, Université de Liège, Bat. B5c, Allée du Six Août 17, B-4000 Liège (Belgium).
@@ Marie Dury ([email protected])
Received: Jul 16, 2010 - Accepted: Dec 09, 2010
Citation: Dury M, Hambuckers A, Warnant P, Henrot A, Favre E, Ouberdous M, François L, 2011. Responses of European forest ecosystems to 21st century climate: assessing changes in interannual variability and fire intensity. iForest 4: 82-99 [online: 2011-04-07] URL: http://www.sisef.it/ iforest/show.php?id=572
Collection: IUFRO RG 7.01 (2010) - Antalya (Turkey)Adaptation of Forest Ecosystems to Air Pollution and Climate ChangeGuest Editors: Elena Paoletti, Yusuf Serengil
Responses of European forest ecosystems to 21st century climate: assessing changes in interannual variability and fire intensity
Dury M (1), Hambuckers A (2), Warnant P (1), Henrot A (3), Favre E (1), Ouberdous M (1), François L (1)
Significant climatic changes are currently observed and, according to projec-tions, will be strengthened over the 21st century throughout the world with the continuing increase of the atmospheric CO2 concentration. Climate will be ge-nerally warmer with notably changes in the seasonality and in the precipitation regime. These changes will have major impacts on the biodiversity and the functioning of natural ecosystems. The CARAIB dynamic vegetation model dri-ven by the ARPEGE/Climate model under forcing from the A2 IPCC emission scenario is used to illustrate and analyse the potential impacts of climate change on forest productivity and distribution as well as fire intensity over Europe. The potential CO2 fertilizing effect is studied throughout transient runs of the vegetation model over the 1961-2100 period assuming constant and increasing atmospheric CO2 concentration. Without fertilisation effect, the net primary productivity (NPP) might increase in high latitudes and altitudes (by up to 40 % or even 60-100 %) while it might decrease in temperate (by up to 50 %) and in warmer regions, e.g., Mediterranean area (by up to 80 %). This strong decrease in NPP is associated with recurrent drought events occurring mostly in summer time. Under rising CO2 concentration, NPP increases all over Europe by as much as 25-75%, but it is not clear whether or not soils might sustain such an increase. The model indicates also that interannual NPP variability might strongly increase in the areas which will undergo recurrent water stress in the future. During the years exhibiting summer drought, the NPP might de-crease to values much lower than present-day average NPP even when CO2 fer-tilization is included. Moreover, years with such events will happen much more frequently than today. Regions with more severe droughts might also be af-fected by an increase of wildfire frequency and intensity, which may have large impacts on vegetation density and distribution. For instance, in the Medi-terranean basin, the area burned by wildfire can be expected to increase by a factor of 3-5 at the end of the 21st century compared to present.
Keywords: Productivity, Soil water, Fire disturbance, Climate change, Model-ling
Dury M et al. - iForest 4: 82-99
matic changes in the distributions of many other species (Parmesan et al. 2000). In European regions already submitted to fire disturbance, burned area would increase un-der most of the scenarios owing to increased summer drought frequency (Schröter et al. 2005). Moreover, Flannigan et al. (2009) are inclined to conclude to a general increase in burned area and fire occurrence even in the temperate and boreal regions and that this trend should continue in a warmer world. To improve projections, they particularly sug-gest to take into account the role of policy, practices and human behaviour because most of the global fire activity is directly attribu-table to people.
Process-based dynamic vegetation models are tools of choice to address to the study of the above problems. They can simulate the growth of various levels of primary produ-cers, from species (Cheddadi et al. 2006, Kramer et al. 2010, Gielen et al. 2010, Hajar et al. 2010), to “plant functional types” (Sitch et al. 2003) or to “biological affinity groups of species” (BAGs - Laurent et al. 2004) and eventually of different parts of the plants (roots, branches, stems, leaves, etc.) which could be useful to compute goods and their reactions to the changing environment.
They could explicitly calculate the cycling of important environmental components like water or carbon (Gérard et al. 1999). They could be upgraded with additional processes as far as needed (seed dispersal, insect di-sease, etc.).
In this paper, a new version of the CARAIB (Carbon Assimilation in the Bio-sphere) process-based dynamic vegetation model (Warnant et al. 1994 with changes made notably by Otto et al. 2002 and Lau-rent et al. 2008) is used to investigate the im-pacts of climate change on European forest ecosystems and to assess, most specifically, the changes in the interannual variability of soil water and primary productivity as well as fire intensity. Transient runs (1961-2100) with an improved module for plant spatial dynamics (plant competition and biogeogra-phy module), coupled to a fire module, are performed to follow the future evolutions of forest productivity and fires. In the new competition and biogeography modules, the description of species/BAG establishment, competition and mortality due to stresses and disturbances has been improved and these processes are now explicitly represented. The Bioclimatic Affinity Groups (BAGs), classification based on vegetation groups’
climatic tolerances and requirements, are for the first time used for future projections. Thus, the improved modules allow to map future changes in biome distribution and to identify areas where stresses on vegetation, especially water stress, might increase in the future. As terrestrial ecosystems may be af-fected by changes in variability almost as much as by changes in mean climate (Jentsch & Beierkuhnlein 2008, Medvigy et al. 2010), how future climate variability will affect ecosystem functioning could become a central question. Many studies, at the local (Goulden et al. 1996, Dunn et al. 2007, Med-vigy et al. 2010), regional (Cao et al. 2003, Albani et al. 2006) and global scales (McGuire et al. 2001) looked into the res-ponses of terrestrial ecosystems (carbon ba-lance, etc.) to current climate variability but very few addressed the effects of future cli-mate variability change. Here, at the Euro-pean scale, we examine the consequences of future changes in climate interannual varia-bility on soil water, drought episodes and their impacts on primary productivity taking also into account the potential role of CO2
fertilization. Moreover, in relation to water stress, the expected change in wildfire is analysed with the model.
iForest (2011) 4: 82-99 83 © SISEF http://www.sisef.it/iforest/
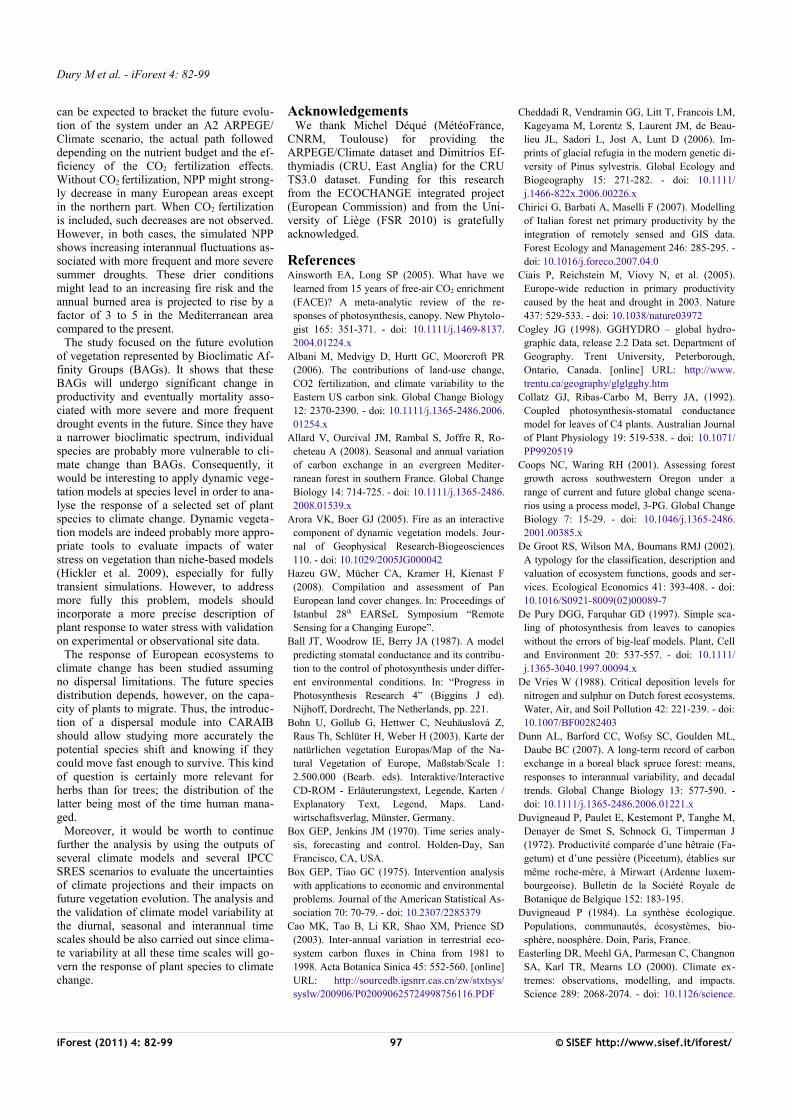
Fig. 1 - Diagram illustrating the structure of the CARAIB model and summarizing its
main input and output variables.
Responses of European forest ecosystems to 21st century climate
Material and methods
CARAIB modelThe CARAIB model (Warnant 1999, Otto
et al. 2002, Laurent et al. 2008, François et al. submitted) is a large-scale vegetation mo-del, originally designed to study the role of vegetation in the global carbon cycle at pre-sent (Warnant et al. 1994, Nemry et al. 1996, Gérard et al. 1999) or in the past (François et al. 1998, 1999, 2006, Galy et al. 2008). It is composed of several modules (Fig. 1) de-scribing respectively: (1) the hydrological budget; (2) canopy photosynthesis and sto-matal regulation; (3) carbon allocation and plant growth; (4) heterotrophic respiration and litter/soil carbon dynamics; (5) plant competition and biogeography; and (6) fire disturbance. In the present study, modules 2 and 5 have been improved and the fire mo-dule implemented.
The hydrological module (Hubert et al. 1998, François et al. 2006) evaluates the average soil water content in the root zone, the snow cover and all related water fluxes.
The canopy photosynthesis and stomatal regulation module. Canopy photosynthesis is based on Farquhar et al.’s (1980) model for C3 and Collatz et al. (1992) for C4 plants. Stomatal conductance (gs) is related to the net assimilation using the parameterization developed by Ball et al. (1987 - eqn. 1):
where g0 is the minimum conductance, g1 is a constant which can be dependent on plant type, An is the leaf net assimilation, RH is the relative humidity and ca is the CO2 concen-tration in the canopy air. Following Van Wijk et al. (2000), in this relationship, g1
was multiplied by a soil water dependent factor fs (eqn. 2):
where S = (SW-WP)/(FC-WP) with SW the soil water content, WP the wilting point and FC the field capacity. The constants in this relationship are calibrated in such a way that fs becomes equal to 0 at the wilting point and tends to 1 at the field capacity. In our model, fs was slightly modified to introduce a de-pendence on the plant type, i.e., S was re-placed by an effective soil water parameter, Seff (eqn. 3):
where Smin,spec is a species-dependent water threshold at which mortality occurs in the model (see below). The scaling of photosyn-thesis from leaves to canopy is now per-formed using the De Pury & Farquhar (1997) scheme. Since this scheme already integrates radiative transfer within the canopy, the mul-tiple layers computing for photosynthesis were suppressed and photosynthesis calcu-
lated once for each BAG taking into account the determined LAI. The incoming solar flux for the understorey is computed taking into account the absorption by the overstorey. This absorption results from the mean value due to each BAG present in the overstorey (cfr. plant competition and biogeography module).
The carbon allocation and plant growth module (Otto et al. 2002) allocates photosyn-thetic products to the metabolic (leaves and fine roots) and structural (wood and coarse roots) carbon reservoirs. This module also evaluates the autotrophic respiration and lit-ter production fluxes.
The heterotrophic respiration and litter/ soil carbon module (Nemry et al. 1996) cal-culates heterotrophic respiration rates, as well as the time evolution of metabolic litter, structural litter and soil carbon reservoirs.
The plant competition and biogeography module evaluates cover fraction of all Biocli-matic Affinity Groups (BAGs - Laurent et al. 2004) on each pixel of the studied area. BAGs are defined as plant taxa gathered on the basis of vegetation morphology (height of the plant (tree/shrub/herb) and shape of leaves (needle/broad leaf)), phenology (de-ciduous/evergreen), and climatic affinity. To define these groups, geographical ranges of
© SISEF http://www.sisef.it/iforest/ 84 iForest (2011) 4: 82-99
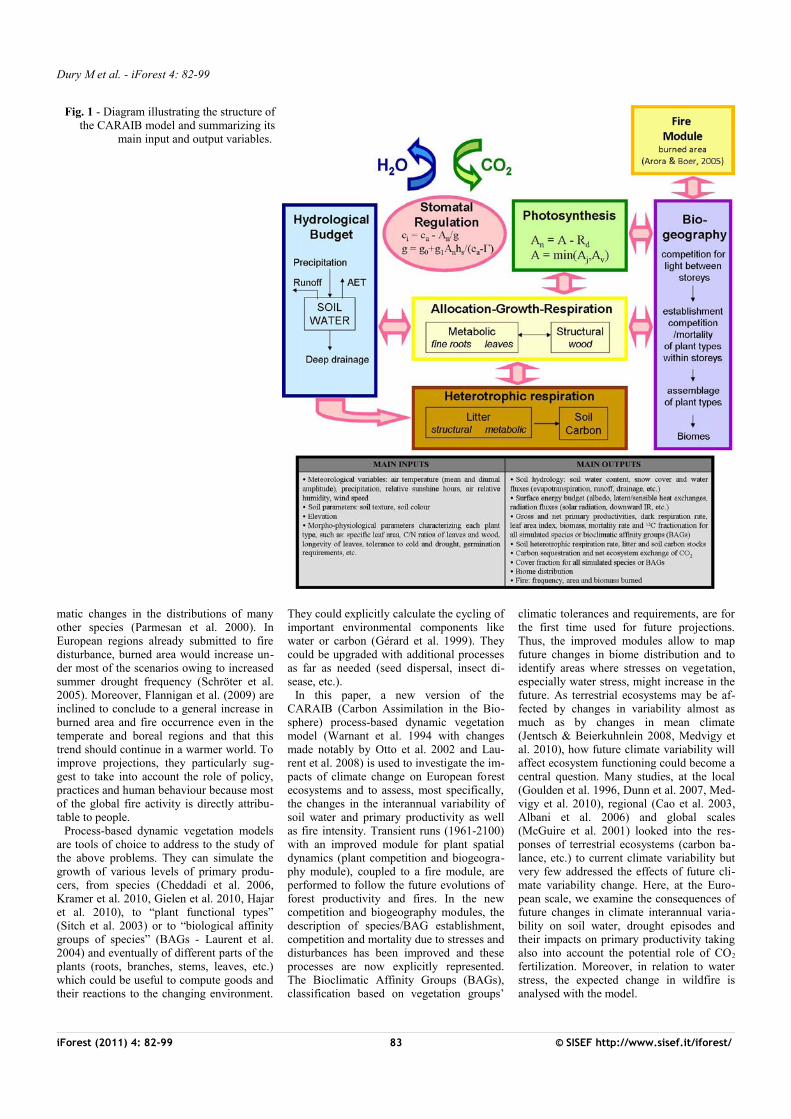
Tab. 1 - BAG-dependent parameters controlling plant stress and germination. Soil water thresholds SWmins and SWmaxg refer to available soil water in relative units, i.e., in terms of the variable (W-WP)/(FC-WC) where W, WP and FC are respectively the soil water content, the wilting point and the field capacity in mm - see Laurent et al. (2004) for a more detailed BAG list.
N BAG composition Tmins
(°C) Swmins GDD5ming
(°C day)Tmaxg
(°C) Swmaxg
1 Achillea, Alchemilla, Angelica, Campanula, etc.
-41.2 0.036 497 2.8 -
2 Brassicaceae, Ranunculaceae, etc. -40.7 0.098 519 2.6 -3 Anthemis, Artemisia, Bidens, Calystegia,
etc.-40.7 0.02 546 2.8 -
4 Asteroideae, Cichorioideae, Poaceae, etc.
-50 0.02 50 - -
5 Anemone, Gypsophila, Helleborus, etc. -41.6 0.042 443 2.9 -6 Ephedra, Ulex -25.9 0.127 1642 2 -7 Alnus viridis, Arctostaphyllos alpinus,
Betula nana, etc.-40.4 0.289 529 -2.2 -
8 Frangula alnus, Lonicera, Prunus, Rubus, Sorbus, Vaccinium, Viburnum
-41.3 0.074 497 2.7 -
9 Berberis vulgaris, Crataegus, Genista, Rhamnus, Sambucus, etc.
-29.2 0.085 1307 1.6 -
10 Arctostaphyllos uva-ursi, Calluna vulgaris, Daphne
-41.3 0.093 558 2.7 -
11 Buxus sempervirens, Hedera helix, Ilex aquifolium, Ligustrum vulgare, Viscum
-20.6 0.088 1458 2.2 -
12 Cistus, Myrtus communis -7.9 0.073 2677 - 0.38313 Betula, Salix -40.7 0.101 523 2.5 -14 Alnus, Alnus glutinosa, Corylus avellana,
Quercus, Quercus robur, Populus, etc.-38.6 0.085 583 3.5 -
15 Acer, Fraxinus, Fraxinus excelsior, Tilia cordata, Ulmus
-31.8 0.125 1153 1 -
16 Acer campestre, Carpinus betulus, Fagus sylvatica, Tilia platyphyllos
-21.9 0.116 1602 1.4 -
17 Castanea, Juglans, Ostrya, Quercus pubescens
-15.8 0.158 2006 1.5 -
18 Olea europaea, Pistacia, Phillyrea, Quercus ilex, Quercus suber
-7.8 0.07 2695 - 0.466
19 Larix decidua -39.8 0.344 808 -3.3 -20 Picea abies, Pinus, Pinus sylvestris -41.5 0.095 555 2 -21 Abies -38.8 0.29 1048 -4.1 -22 Cupressaceae, Juniperus, Juniperus
communis-39.8 0.107 512 2.2 -
23 Pinus cembra -22.4 0.522 550 -7.3 -24 Abies alba, Taxus baccata -19.5 0.183 1472 0.1 -25 Cedrus, Pinus halepensis, Pinus pinaster -8.3 0.084 2537 - 0.415
g s=g0+g1 An RH /ca
f s=1−0.016572⋅e4.1(1−S)
S eff =(S−0.5⋅Smin , spec)(1−0.5⋅Smin , spec)
Dury M et al. - iForest 4: 82-99
European plants were computed using dis-criminant analysis on monthly mean climatic data (monthly means of precipitation, wet-day frequency, mean and minimum tempe-ratures, diurnal temperature range, percen-tage of sunshine hours and ground frost fre-quency - New et al. 1999) and growing de-gree days above 5 °C (GDD5).
The establishment of a BAG on a grid cell depends on the availability of free space on this grid cell and on the BAG climatic re-quirements for germination. The relevant variables controlling germination are the yearly sum of the daily temperatures above 5 °C (GDD5), the coldest monthly mean night temperature (Tcm) and the minimum monthly soil water content (SW). For germination to be possible in a given year, the values of these variables must be either lower (Tcm and SW) or higher (GDD5) than respective thresholds (Tmaxg, SWmaxg and GDD5ming) de-fined for each BAG (Tab. 1). All these thre-sholds are derived by calculating given per-centiles in the observed BAG distributions (François et al. submitted). To avoid discon-tinuities, probability of germination is calcu-lated through a truncated error function (erf) centred on the threshold with a fixed width corresponding to a standard deviation of 5% (GDD5 and SW) or 3 °C (Tcm).
The initialisation of BAG cover fractions is performed assuming equal fractions for all germinated BAGs. An initial biomass of 5 g C m-2 for herb and shrub BAGs or 10 g C m-2
for tree BAGs. The cover fractions are estimated separately in each storey once a year after allocation of photosynthetic pro-ducts to plant reservoirs. BAG fraction de-creases are calculated daily and summed over the year. Mortality occurs owing to age-ing mortality, thermal stress, water deficit stress and fire disturbances. Ageing death rate is inversely proportional to the rough estimates of BAG maximum life time, i.e., 5 yr for perennial herbs, 13 yr for shrubs and 100 yr for trees. These life times take into account mortality due to events, climatic (storms) or not (diseases), which are not si-mulated by CARAIB. Every year, corres-ponding fractions are removed from the BAG covers. Temperature and water stresses occur when 5-day running means of tempe-rature and soil water content fall below pre-scribed thresholds (Tmins, SWmins) again de-termined for each BAG from its observed distribution (Tab. 1). Assuming a one month maximal survival time, 1/30 of the BAG fraction cover is removed daily in those con-ditions. To avoid numerical oscillations, the thermal stress begins 3°C above Tmins and is complete 3 °C below, while for water stress the limits are fixed to +5% and -5% of SWmins, also using an erf function as above. Finally, for fire disturbances (cfr. fire mo-dule), BAG mortality is proportional to area burned on the pixel. Mortality creates gaps
in the vegetation cover. These are then filled with seeds of BAGs that can establish under current climatic conditions either BAGs that were already present on the grid cell or newly established BAGs (no dispersal rate limitations). Within the gap, the cover frac-tion of the established BAGs is assumed to be proportional to the BAG net primary pro-ductivity (NPP). This is the NPP of the pre-vious year for the BAGs which were already present and 5 g C m-2 yr-1 (herbs and shrubs) or 10 g C m-2 yr-1 (trees) for newly esta-blished BAGs (consistently with the above initial biomass).
The fire module developed in CARAIB (Leroy 2007) is largely inspired by the ap-proach implemented in the dynamic global vegetation CTEM model (Canadian Ter-restrial Ecosystem Model - Arora & Boer 2005). On a given grid cell, the emergence of a fire is conditioned by the three factors of the fire triangle: the availability of fuel (bio-mass, litter), the combustibility of the fuel
(soil moisture) and the presence of a source of ignition (natural or anthropogenic). If one of these factors is missing, the fire cannot occur. The three constraints, considered in terms of probability, allow to calculate a probability of fire occurrence (Pf = Pb Pm Pi). Pb is the probability of fire conditioned on the available above-ground biomass (leaf, stem and litter pools averaged over all BAGs), Pm is the probability of fire condi-tioned on the soil moisture in the root zone and Pi is the fire occurrence probability linked to ignition source. The natural igni-tion constraint is represented by a “lightning scalar” linked to cloud-to-ground lightning frequency (flashes km-² month-1 - Arora & Boer 2005). Here, the probability of fire ignition due to human causes is not taken into account consistently with the hypothesis of a potential natural vegetation reconstruc-ted by the model. This choice of simulating natural fires with natural vegetation will pre-vent us from making a detailed comparison
iForest (2011) 4: 82-99 85 © SISEF http://www.sisef.it/iforest/
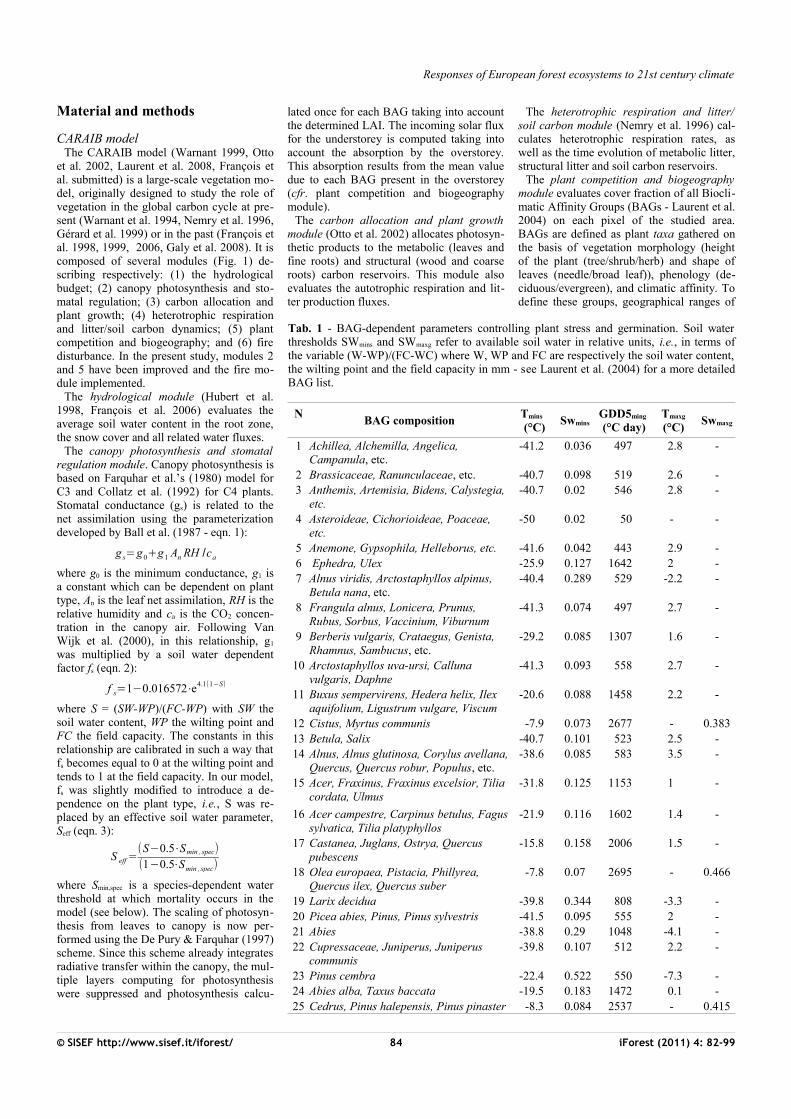
Tab. 2 - Biome assignment scheme used in CARAIB. (GDD5): growing-degree-days above 5 °C cumulated over one year; (NPPtot): total NPP of the grid cell; (LAI tot): total leaf area in-dex of the grid cell (herbs + trees); (LAI tree): leaf area index of the over-storey (trees); (R): NPP(herbs)/NPP(trees) = ratio of herb NPP (BAGs 1-12) to tree NPP (BAGs 13-25); (fbdec): cover fraction of temperate broadleaved deciduous trees in the overstorey; (fbev): cover frac-tion of temperate broadleaved evergreen trees in the overstorey; (fcold): cover fraction of boreal/temperate cold trees in the overstorey; (fndl ): cover fraction of temperate needle-leaved trees in the overstorey; (fmed): cover fraction of Mediterranean trees in the overstorey; (fwarm):cover fraction of temperate warm trees in the overstorey.
N Biomes GDD5 (°C day)
NPPtot (g m-2 y-1) LAItot R LAItree
Other conditions
1 Ice < 50 - - - - -2 Desert ≥ 50 < 10 - - - -3 Semi-desert > 700 > 10 < 0.3 - - -4 Tundra 50-700 > 10 - - < 0.8 -5 Temperate grassland > 700 > 10 ≥ 0.3 > 0.4 < 0.3 -6 Warm-temperate open
woodland- > 10 ≥ 0.3 > 0.4 ≥ 0.3 Fmed > 0.05
7 Cold temperate/boreal open woodland
- > 10 ≥0.3 > 0.4 ≥ 0.3 fmed ≤ 0.05
8 Warm-temperate broadleaved evergreen forest
- > 10 ≥0.3 ≤ 0.4 fbev > 0.65
9 Warm-temperate conifer forest
- > 10 ≥ 0.3 ≤ 0.4 fndl> 0.65
10 Warm-temperate mixed forest
- > 10 ≥ 0.3 ≤ 0.4 fbev ≤ 0.65fndl ≤ 0.65fbdec ≤ 0.65fcold ≤ 0.8fwarm > 0.05
11 Temperate broadleaved deciduous forest
- > 10 ≥ 0.3 ≤ 0.4 fbdec >0.65
12 Cool-temperate mixed forest - > 10 ≥ 0.3 ≤ 0.4 fbev≤ 0.65fndl ≤0.65fbdec ≤ 0.65fcold≤ 0.8fwarm≤ 0.05
13 Boreal/montane forest ≤ 1000 > 10 ≥ 0.3 ≤ 0.4 fcold > 0.8
Responses of European forest ecosystems to 21st century climate
with actual fires. Moreover, this is the most parsimonious choice to simulate fires in the future. Indeed, despite the strong effect of humans on fires through ignition but also through management and land-cover change, human behaviour is extremely difficult to simulate (Flannigan et al. 2009) and remains a challenge for DVMs. Consequently, in our study, the aim is only to simulate the impacts of climate change on fires but not the im-pacts of the changes in the human factors since the latter would require the use of a dy-namic land-use model. Once the probability of fire occurrence is established, the area burned on the grid cell can be calculated. It is taken elliptical in shape with point of igni-tion at one of the foci. The fire spread rate is a function of soil moisture and wind speed. Fire duration controls the maximum size of this ellipse that will be reached. It depends on an extinguishing probability parameter set to a fixed value as a first approximation. Again the extinguishing probability may de-pend on the human behaviour through land-use and fighting efforts. Since the future evolution of these factors is almost im-possible to assess, it is another reason to re-strict the analysis to natural systems.
Biome assignment scheme. CARAIB pro-duces as outputs the cover fraction of all BAGs on each grid cell of the studied region. However, it is useful to transform this in-formation on the abundance of plant types into a biome type characterizing each grid cell. Such a biome assignment scheme is useful essentially for visualizing the model results, but should not be used for comparing these results with the data. Indeed, the biome limits are rather imprecise and the biome classification generally varies from one au-thor to the other. This biome assignment scheme is presented in Tab. 2. It will be used to provide synthetic maps illustrating the overall vegetation distribution in the model. The scheme contains a set of threshold con-
ditions on GDD5, total NPP (NPPtot) and LAI of the grid cell (LAItot), the ratio of herbaceous NPP to tree NPP (R), the LAI of trees (LAItree) and the fraction of different types of trees. Most important thresholds are: permanent ice or polar desert is assumed to occur for GDD5 < 50, (extreme) desert for NPPtot < 0, tundra for 50 ≤ GDD5 ≤ 700 and LAItree < 0.8, semi-desert for NPPtot > 10 and LAItot < 0.3; grasslands occur for R > 0.4 and LAItree < 0.3, open woodlands for R > 0.4 and LAItree <0.3; forests occur for R > 0.4, their types being determined by the relative abundances of the different tree BAGs present in the over-storey.
Input dataThe model was driven by 1961-2100
monthly mean data for mean air temperature, precipitation, diurnal temperature range, re-lative humidity, cloud cover (converted in percentage of sunshine hours) and surface horizontal wind speed from the ARPEGE/ Climate model (Gibelin & Déqué 2003, Salas y Mélia et al. 2005). CARAIB contains a stochastic generator of meteorological va-riables (Hubert et al. 1998), which trans-forms the monthly mean data into diurnal values. In the procedure, normalization is performed after stochastic generation to en-sure that the monthly mean values of the variables are not altered. Here, simulations were performed with ARPEGE/Climate dataset forced only with the IPCC A2 emis-sion scenario (Nakicenovic et al. 2000). Within the full range of the IPCC emission scenarios, the A2 describes the most extreme socio-economic storyline with atmospheric CO2 concentration of about 850 ppmv by 2100. Climatic anomalies of the ARPEGE/ Climate model between any given year in the future and the average climate for present-day period (1961-1990) were interpolated to a 0.5° x 0.5° regular grid. These anomalies were then combined with 1961-1990 clima-
tology of Climatic Research Unit (New et al. 2002 at a 10’ x 10’ resolution averaged to a 0.5° x 0.5° resolution) to construct future projections, using similar procedure to François et al. (2006). Thus, for the 1961-1990 period, the average climate in the re-constructions is forced to coincide with ob-served climate but the year to year variability of ARPEGE/Climate model is conserved.
To be able to compare CARAIB present day annual runoff, net primary productivity and fire outputs with ground data and satel-lite products, a simulation was also run with CRU TS 3.0 historical climate data for the 1961-2006 period at 0.5° spatial resolution (CRU TS 3.0 in preparation). Annual runoff will be compared with runoff estimated from river discharge from the UNESCO atlas (Cogley 1998). To realise the comparison, CARAIB runoff output were averaged to 1° spatial resolution of UNESCO data. Net primary productivity simulated by CARAIB will be compared with NPP field estimated values collected between 1947 and 2005 and with NPP products of the MODerate Resolu-tion Imaging Spectroradiometer (MODIS) over 2000-2006. The MOD17A3 product contains annual NPP at 1-km resolution ob-tained with the improved MODIS primary vegetation productivity algorithm (Zhao et al. 2005). These data are freely available to the public from the Numerical Terradynamic Simulation Group (NTSG) (http://www.nts-g.umt.edu) or the EROS Data Center Distri-buted Active Archive Center (EDC DAAC). The CARAIB runoff and NPP evaluations are restricted to grid cells with ≥ 30 % natu-ral vegetation (forests, scrub and/or herba-ceous vegetation) using the Pan-European Land Cover Mosaic for the year 2000 (PCLM2000 from Hazeu et al. 2007, a deli-verable for the ECOCHANGE project - http://www.ecochange-project.eu/). PLCM-2000 used the CORINE Land Cover 2000 database (CLC 2000) as the starting point.
© SISEF http://www.sisef.it/iforest/ 86 iForest (2011) 4: 82-99
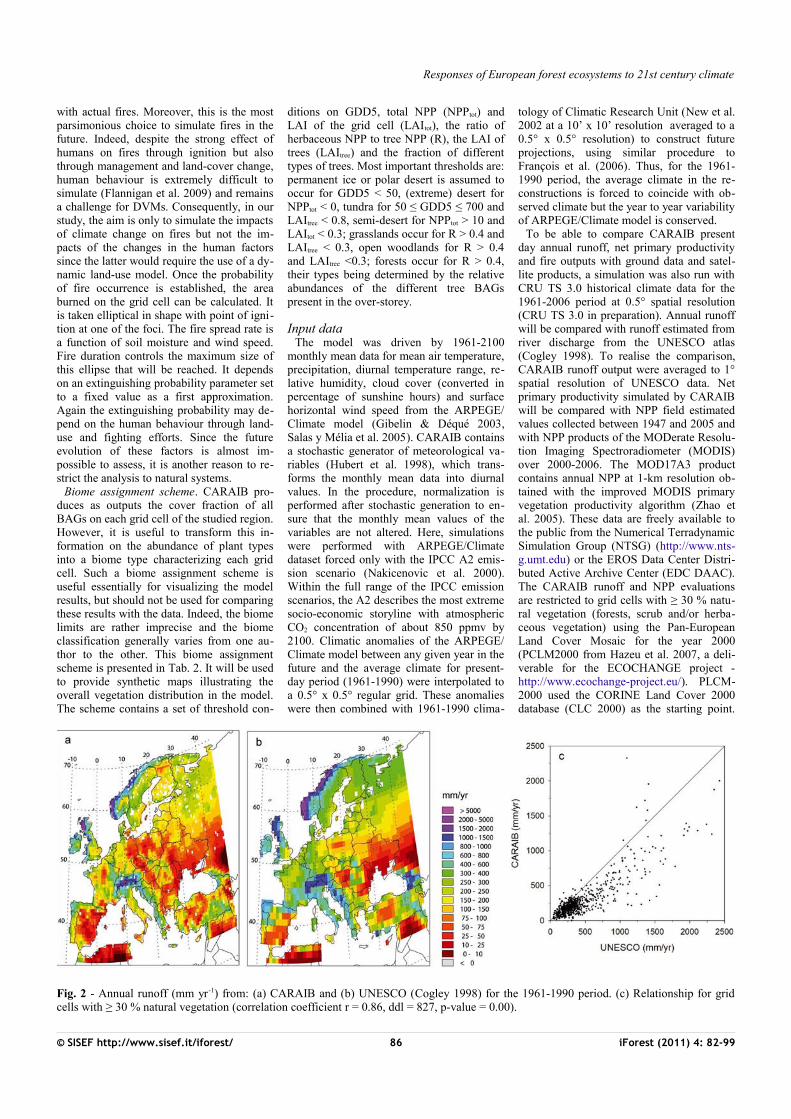
Fig. 2 - Annual runoff (mm yr-1) from: (a) CARAIB and (b) UNESCO (Cogley 1998) for the 1961-1990 period. (c) Relationship for grid cells with ≥ 30 % natural vegetation (correlation coefficient r = 0.86, ddl = 827, p-value = 0.00).

Dury M et al. - iForest 4: 82-99
iForest (2011) 4: 82-99 87 © SISEF http://www.sisef.it/iforest/
Fig. 3 - Mean net primary productivity (g C m-2 yr-1) from: (a) CARAIB and (b) MODIS sensor for the 2000-2006 period for grid cells with ≥ 30 % natural vegetation; (c) NPP relative anomalies (%) between (a) and (b); (d) relationship between CARAIB NPP computed values and NPP MODIS estimated values for pixels occupied with ≥ 30 % natural vegetation for the 2000-2006 period (black points) or NPP field es -timates collected between 1947 and 2005 (red squares - Möller et al. 1954, Lossaint & Rapp 1971, Schulze & Koch 1971, Duvigneaud et al. 1972, Sindani & Lejoly 1990, Valentini et al. 1996, Helmisaari et al. 2002, Gerdol 2005, Lagergren et al. 2005, Yuste et al. 2005, Chirici et al. 2007, Luyssaert et al. 2007, Granier et al. 2008). CARAIB vs. Modis data: correlation coefficient r = 0.7258, ddl = 3080, p-value = 0.00; CARAIB NPP mean = 567.0 g C m-2 yr-1, MODIS NPP mean = 536.7 g C m-2 yr-1. CARAIB vs. field estimates: correlation coefficient r = 0.4133, ddl = 70, p-value = 0.00; CARAIB NPP mean = 678.5 g C m-2 yr-1, field estimated NPP mean = 672.7 g C m-2 yr-1.

Responses of European forest ecosystems to 21st century climate
The reclassified Norwegian and Swiss land cover databases for the year 2000 were ad-ded to the CLC2000 database. Gaps and missing countries were filled with the re-coded 1-km resolution Pan-European Land Cover (PELCOM) and the Global Land Co-ver 2000 (GLC 2000) databases. Simulated area burned will be evaluated using statistics of area burned in some Mediterranean coun-tries over the 1980-2006 period (JRC 2008). This simulation will also allow a comparison between the variability of NPP or other ve-getation parameters (gross primary produc-tivity GPP, soil water content, etc.) as indu-ced on the one hand by the climate model and on the other hand by the CRU dataset.
Simulations protocolSince ARPEGE/Climate outputs were not
available for the beginning of the 20th cen-
tury, initialisation was performed by running seven times the 1961-1990 ARPEGE/Cli-mate reconstruction sequence with a 330 ppmv CO2 average concentration. Two fully transient simulations were run respectively with rising atmospheric CO2 concentration from the A2 scenario (in both the climate and vegetation models) and with constant CO2 concentration remained at 330 ppmv in the vegetation model (with climate change from A2 scenario calculated by ARPEGE/ Climate). This initialisation procedure allo-wed studying the model interannual variabi-lity changes between the 2081-2100 and 1981-2000 periods. The linear trend of the full 20-year data was first removed with a linear least square fit and the interannual variability was studied through temporal standard deviation (SD). Trend detection in CARAIB outputs (soil water, NPP, fire) was
achieved with the JMulti 4 software (Lütke-pohl et al. 2004). Auto-regressive - moving average models (ARMA) with deterministic trends were fitted to the data following the Box and Jenkins’ approach (Box & Jenkins 1970). The ARMA models take into account serial dependence responsible of cyclic or pseudo-cyclic fluctuations which permits correct estimate of deterministic trend signi-fication level. Intervention analysis accor-ding to Box & Tiao (1975) was done by simple regression using Statistica software to fit an AR model taking serial dependence into account and including an intervention variable with values equal to 0 before 2050 then linearly growing up to 1 in 2100. To test change of variability in the time series simulated by CARAIB (fire, soil water, NPP), standard deviations were computed for consecutive 14 years and trend detection
© SISEF http://www.sisef.it/iforest/ 88 iForest (2011) 4: 82-99
Fig. 4 - Biome distribution computed by CARAIB for the 1981-2000 period.

Dury M et al. - iForest 4: 82-99
was achieved on these new time series of 10 observations using the Spearman rank coeffi-cient.
Results
Model evaluationAs already shown by Hubert et al. (1998)
at the global scale, the annual water budget simulated by the model is relatively correct since annual ru noffs compare rather well with the data from the UNESCO atlas (Cogley 1998). Over Europe (Fig. 2a and Fig. 2b), the geographical distribution of runoff is relatively well reproduced. For grid cells with ≥ 30 % natural vegetation (Fig.2c), the correlation coefficient between mo-delled and UNESCO run offs is 0.86 but the model generally underestimates annual run-off (CARAIB mean = 272.8 mm yr-1, UN-ESCO mean = 421.8 mm yr-1, t-test for
paired samples = -21.80, ddl = 827, p-value = 0.00). The correlation coefficient between modelled and UNESCO run offs is 0.86, p-value = 0.00 (Fig. 2c).
Fig. 3a and 3b compare CARAIB NPP computed values with NPP estimations of MODIS sensor for grid cells with ≥ 30 % natural vegetation. A large proportion (70 %) of the CARAIB values lies in the -20 to +20 % range of the MODIS data. The largest differences occur in the Mediterranean re-gion where CARAIB tends to underestimate MODIS NPP values (Spain, south of France, Italy) and in the northern regions where it tends to overestimate them. A second com-parison of CARAIB NPP computed values is given in Fig. 3c where CARAIB NPP is plot-ted versus stand-level estimates and MODIS products. CARAIB values are positively cor-related with both sets of data, but CARAIB tends to underestimate the highest values and
to overestimate the lowest ones. The CA-RAIB values are significantly higher than the MODIS estimates (t-test for paired samples = 12.91, ddl = 3080, p-value = 0.00), but with field data the difference between the mean is not significant (t-test for paired samples = 0.19, ddl = 70, p-value = 0.85).
As shown by Otto et al. (2002) for the global scale, despite the well-known pro-blems of comparing vegetation maps due to classification and differences between actual and potential vegetations, there is generally a rather good agreement between CARAIB simulated biome distributions and other re-constructed potential vegetation distribu-tions. Over Europe (Fig. 4), CARAIB biome distribution was compared notably with Bohn et al. 2003. With CARAIB, Europe is mostly covered by forests, from boreal forests in the north, to mixed forests in southern Scandinavia, Russia and some mountainous areas, to deciduous forests in lowlands of Central and Western Europe, and to warm temperate (Mediterranean) forests in southern Europe and on the At-lantic coast of France. However, some prob-lems occur, particularly on places of limited extension located on the borders of the simu-lated area. In the extreme north of Scan-dinavia, CARAIB simulates boreal open woodlands while on other vegetation maps tundra seems more widespread. In the south-west of the Iberian Peninsula, potential vege-tation types are of open woodlands or of matorral types, but CARAIB produces tem-perate steppes. In southern Ukraine, tempe-rate broadleaf deciduous forests are simu-lated while steppes are observed in most areas and are probably the potential vegeta-tion types.
Fig. 5a shows the simulated and the obser-ved area burned (JRC 2008) in the Mediter-ranean region (Portugal, Spain, France, Italy, Greece, Bulgaria and Turkey) over the 1980-2006 period. The simulation was driven by CRU 1961-2006 climatic dataset with poten-tial vegetation and without the human im-pacts (as fire ignition and fire fighting ef-forts). The model reproduces the observed interannual variability of fire events under specific meteorological conditions (correla-tion coefficient between modelled and ob-served values = 0.7559, Fig. 5b) but, as ex-pected, the simulated burned area is lower due to the absence of human-induced fires.
Projections over 21st century Forced with the A2 scenario, ARPEGE/
Climate predicts substantial warming over Europe in all seasons (in average 4.3 °C in-crease of the annual mean temperature). Northern Europe shows a maximum tempe-rature increase in winter (5 to more than 9 °C) while in southern Europe and in the Mediterranean region, the warming is more
iForest (2011) 4: 82-99 89 © SISEF http://www.sisef.it/iforest/
Fig. 5 - Comparison of simulated and observed area burned (106 ha) in the Mediterranean re-gion (JRC 2008). (a) Evolution over the 1980-2006 period and (b) relationship (correlation coefficient r = 0.7559, ddl = 27, p-value = 0.00).

Responses of European forest ecosystems to 21st century climate
pronounced in summer (5 °C by up to 8 °C in the Balkans and in Ukraine). Concerning precipitations, in winter, ARPEGE/Climate predicts decreases (0-120 mm) over most re-gions below 50° N, except in the Caucasus and in Central Asia and increases above this
latitude (0-120 mm), except in the south of Sweden (decrease of 0-30 mm). In summer, precipitations increase above 60° N (0-80 mm) while in the other parts of Europe they are projected to decrease (0-120 mm), except in Mediterranean area and in the Alps (in-
crease of 0-40 mm). Compared with projec-tions of other climate models from the EN-SEMBLES European project (Van der Linden & Mitchell 2009), ARPEGE/Climate lies among the ones which produce the most significant temperature (warmer) and preci-
© SISEF http://www.sisef.it/iforest/ 90 iForest (2011) 4: 82-99
Fig. 6 - Mean net primary productivity (g C m-2 yr-1) computed by CARAIB with climate from (a) ARPEGE and (b) CRU for the 1981-2000 period. NPP relative anomalies (%) between 2081-2100 and 1981-2000 with (c) constant and (d) increasing atmospheric CO 2 concentration conditions.

Dury M et al. - iForest 4: 82-99
pitation (drier) changes. The winter warming in northern Europe is particularly important while the summer temperature increase over Southern Europe is in the range of EN-SEMBLES projected changes. ARPEGE produces precipitation decreases in winter
over southern Europe that are more pro-nounced and more widespread (by up to 50° N) than those of the other climate models. In summer, the model projects very marked precipitation decrease over western (France, north of Italy) and Eastern Europe (Ukraine,
Romania, etc.) and almost no change in the Mediterranean region unlike other projec-tions.
Fig. 6 presents the NPP relative anomalies under changing climate between the end of the 21st century (2081-2100) and the present
iForest (2011) 4: 82-99 91 © SISEF http://www.sisef.it/iforest/
Fig. 7 - Standard deviation of net primary productivity (g C m-2 yr-1) computed by CARAIB for the 1981-2000 period with climate from (a) ARPEGE and (b) CRU and for the 2081-2100 period with (b) constant and (c) increasing atmospheric CO2 concentration conditions.
Responses of European forest ecosystems to 21st century climate
(1981-2000) without or with CO2 fertilizing effect. The first simulation is driven with at-mospheric CO2 concentration kept constant (330 ppmv) in the vegetation model but with climate change from A2 scenario calculated
by ARPEGE/Climate. In the second simula-tion, the CO2 concentration is rising accor-ding to the A2 scenario in both the climate and vegetation models. The Fig. 6a and 6b display the current NPP computed by
CARAIB respectively with climate from ARPEGE/Climate and CRU data. Under the first hypothesis (Fig. 6c), the NPP anomalies predicted over Europe present a large geo-graphical gradient. Three main evolution
© SISEF http://www.sisef.it/iforest/ 92 iForest (2011) 4: 82-99
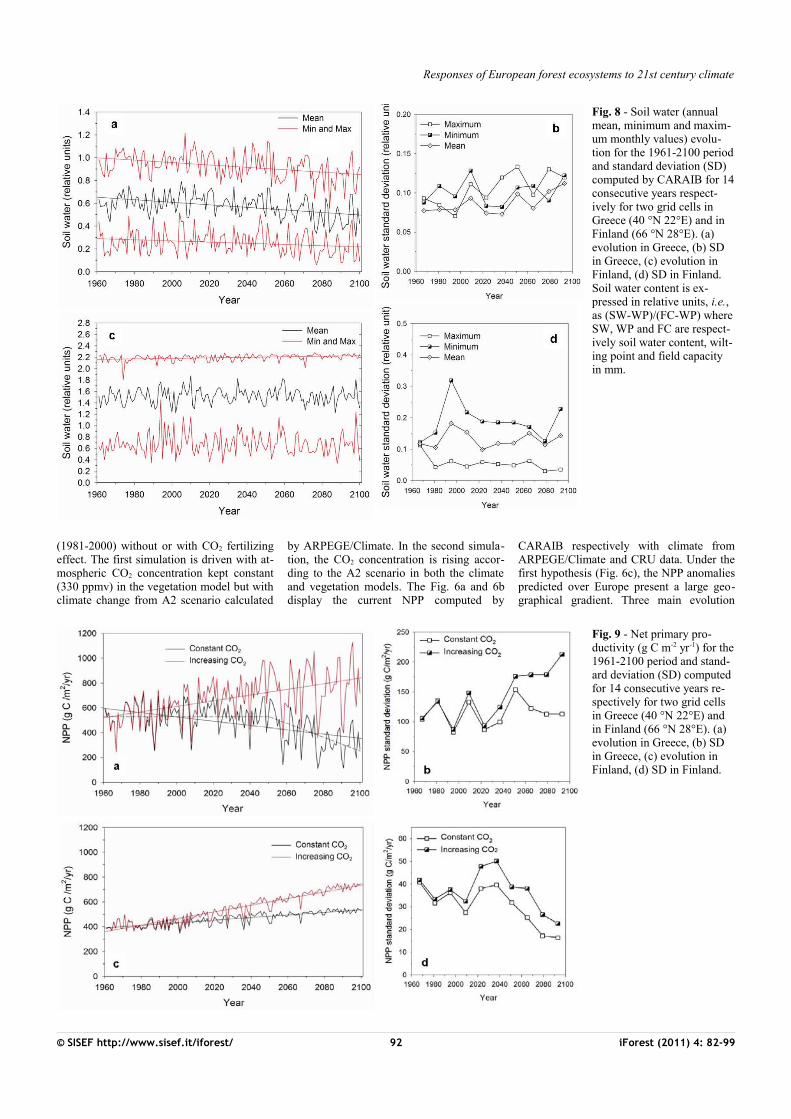
Fig. 8 - Soil water (annual mean, minimum and maxim-um monthly values) evolu-tion for the 1961-2100 period and standard deviation (SD) computed by CARAIB for 14 consecutive years respect-ively for two grid cells in Greece (40 °N 22°E) and in Finland (66 °N 28°E). (a) evolution in Greece, (b) SD in Greece, (c) evolution in Finland, (d) SD in Finland. Soil water content is ex-pressed in relative units, i.e., as (SW-WP)/(FC-WP) where SW, WP and FC are respect-ively soil water content, wilt-ing point and field capacity in mm.
Fig. 9 - Net primary pro-ductivity (g C m-2 yr-1) for the 1961-2100 period and stand-ard deviation (SD) computed for 14 consecutive years re-spectively for two grid cells in Greece (40 °N 22°E) and in Finland (66 °N 28°E). (a) evolution in Greece, (b) SD in Greece, (c) evolution in Finland, (d) SD in Finland.
Dury M et al. - iForest 4: 82-99
types may be distinguished. In cold regions, i.e., at high latitudes and altitudes, the tem-perature increases lead to longer growing seasons. When water is not a limiting factor, plant growth is improved and thus the mo-delled NPP generally increases by up to 40% or even 60-100% in the coldest regions which are currently tundras. In the cold tem-perate area, between approximately 50° N to 60° N, NPP might decrease by as much as 50%. These NPP reductions are due to sum-mer droughts more recurrent than in the present. In warmer regions, i.e., Mediter-ranean area, western France, Eastern Europe, Ukraine, south of Russia and areas around Caspian and Aral Seas, higher predicted tem-peratures raise evapotranspiration. Since there are no precipitation increases, plants are subject to higher water stress and NPP goes down everywhere with local decreases reaching 80%. Assuming increasing CO2
concentration together with climate change (Fig. 6d), predicted NPP increases through-out Europe, though there are substantial dif-ferences in the magnitude among subregions. As in the simulations keeping CO2 constant, at high latitudes and in mountainous areas, the model predicts NPP increases of 50-75%. For the temperate regions, the NPP increases are comprised between 25 and 50%. In the Mediterranean area, western France, Eastern Europe and Ukraine, NPP increases might reach 75%, but generally about 50%. Farther to the east, the model simulates very impor-tant increases of up to 500 %. The fact that NPP anomalies are displayed as percent makes that regions with current low NPP values (< 150 g C m-2) show the more dra-matic changes. It concerns particularly south-eastern part of the studied area occu-pied by steppes and the extreme of northern Europe covered by tundras.
Since most climate projections indicate fu-ture changes in climate variability (Giorgi et al. 2004a, 2004b, Rowell 2005), including the ARPEGE/Climate forced with A2 sce-nario used in this study, the NPP variability is also studied here. A comparison of the NPP variability for the 1981-2000 period calculated with the ARPEGE/Climate model outputs (Fig. 7a) and with the CRU dataset (Fig. 7b) reveals that GCM-derived NPP may be slightly more variable than that ob-tained with observed climate, at least for some areas. This discrepancy between mo-delled and observed climate variability may affect the NPP absolute variability calculated for the future, although the trend between the present and the future may be more robust. Under constant atmospheric CO2 concentra-tion, the NPP interannual variability increa-ses throughout Europe except in the northern part, in the Alps and in Central Asia (Fig.7c). In the Mediterranean region, in western France, in the Balkans, in Ukraine and in the Caucasus, the projected rises are most likely
linked to the increase of the precipitation in-terannual variability in those regions. Between 50° and 60° N, higher temperatures probably induce more frequent water stress. At high latitudes, despite increasing NPP, variability decrease reflects reduced tempe-rature variability and the associated snow cover spatiotemporal pattern. With rising CO2 concentration, an increase in NPP varia-bility is projected in the same regions but it is more pronounced (Fig. 7d). It is partly due to the CO2 effects on plant physiology which increase strongly NPP during years with lo-wer climatic stresses. The evolution and the interannual variability (standard deviation) of soil water (Fig. 8) and NPP (Fig. 9) over the 1961-2100 period are analysed more pre-cisely for two grid cells with contrasted cli-mate, located respectively in Greece (40°N 22°E) and in Finland (66°N 28°E). In Gree-ce, the annual mean as well as the minimum and maximum monthly soil water values de-crease progressively over the 21st century (Fig. 8a). These decreases are statistically significant (Tab. 3). Particularly after 2050, the minimum monthly soil water reaches very low values close to the wilting point (0 in the units of the figure) and the maximum value seldom exceeds the field capacity (1 in
the units of the figure) meaning that the ground water reservoir would not be refilled. The analysis of the interannual variability shows significant increase in mean and ma-ximum time series (Fig. 8b and Tab. 4). Du-ring the same period, NPP significantly in-creases assuming rising CO2 concentration while, under constant CO2, a negative linear trend over whole period is significant (Fig.9a and Tab. 3). The shape of the data rather suggests that there is no trend before c. 2050 and a stronger linear decrease after. It was confirmed by an intervention analysis. An AR (1) model was necessary; the analysis gave a 2050-2100 trend of -5.60 g C m-2 yr-2
with p-value = 0.00. Moreover, by the end of 21st century, the interannual NPP variability significantly increases but only in the simu-lation with increasing CO2 (Fig. 9b and Tab.4). In Finland, only the maximum monthly soil water amounts show a significant posi-tive trend over the 21st century (Fig. 8c and Tab. 3) and none of the series shows any trend in variability (Fig. 8 d and Tab. 4). As today, drought events remain rare and winter precipitations which are projected to increase in the future in this area allow ground water to be refilled. In these conditions, NPP signi-ficantly increases under both CO2 hypothesis
iForest (2011) 4: 82-99 93 © SISEF http://www.sisef.it/iforest/
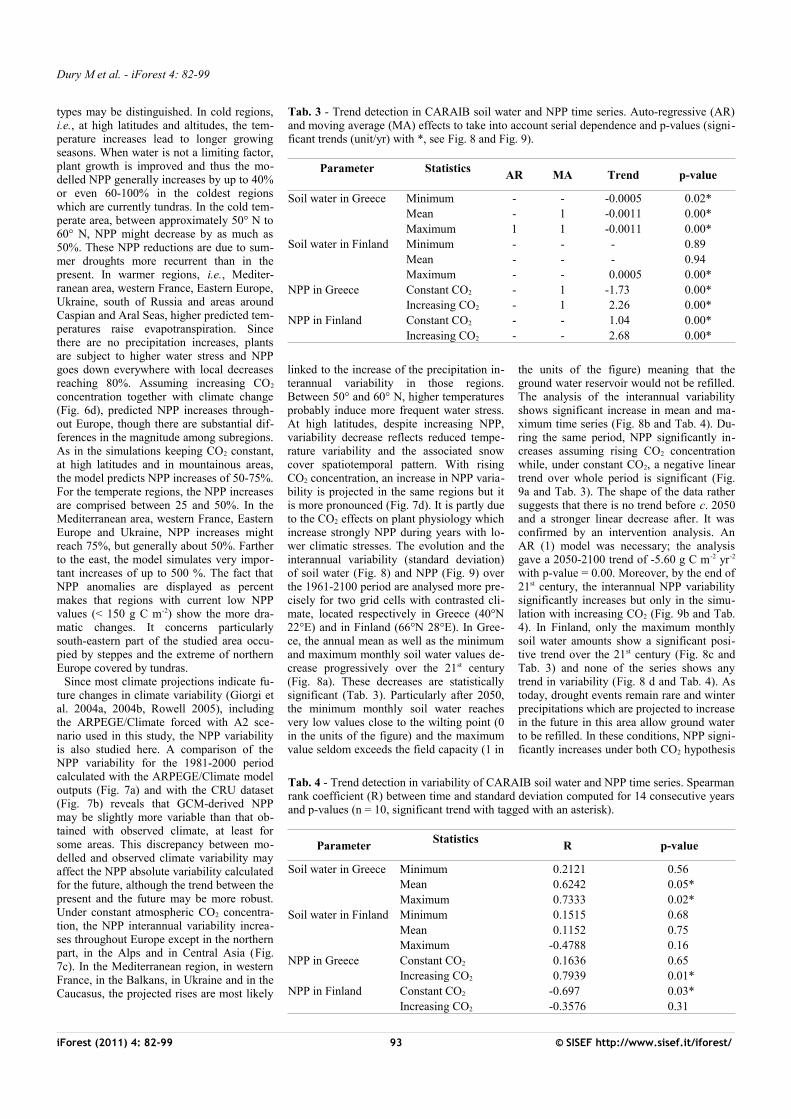
Tab. 3 - Trend detection in CARAIB soil water and NPP time series. Auto-regressive (AR) and moving average (MA) effects to take into account serial dependence and p-values (signi-ficant trends (unit/yr) with *, see Fig. 8 and Fig. 9).
Parameter
Statistics AR MA Trend p-value
Soil water in Greece Minimum - - -0.0005 0.02*Mean - 1 -0.0011 0.00*Maximum 1 1 -0.0011 0.00*
Soil water in Finland Minimum - - - 0.89Mean - - - 0.94Maximum - - 0.0005 0.00*
NPP in Greece Constant CO2 - 1 -1.73 0.00*Increasing CO2 - 1 2.26 0.00*
NPP in Finland Constant CO2 - - 1.04 0.00*Increasing CO2 - - 2.68 0.00*
Tab. 4 - Trend detection in variability of CARAIB soil water and NPP time series. Spearman rank coefficient (R) between time and standard deviation computed for 14 consecutive years and p-values (n = 10, significant trend with tagged with an asterisk).
Parameter Statistics R p-value
Soil water in Greece Minimum 0.2121 0.56Mean 0.6242 0.05*Maximum 0.7333 0.02*
Soil water in Finland Minimum 0.1515 0.68Mean 0.1152 0.75Maximum -0.4788 0.16
NPP in Greece Constant CO2 0.1636 0.65Increasing CO2 0.7939 0.01*
NPP in Finland Constant CO2 -0.697 0.03*Increasing CO2 -0.3576 0.31
Responses of European forest ecosystems to 21st century climate
(Fig. 9c and Tab. 3) and its variability de-crease over time only with rising CO2 (Fig.9d and Tab. 4).
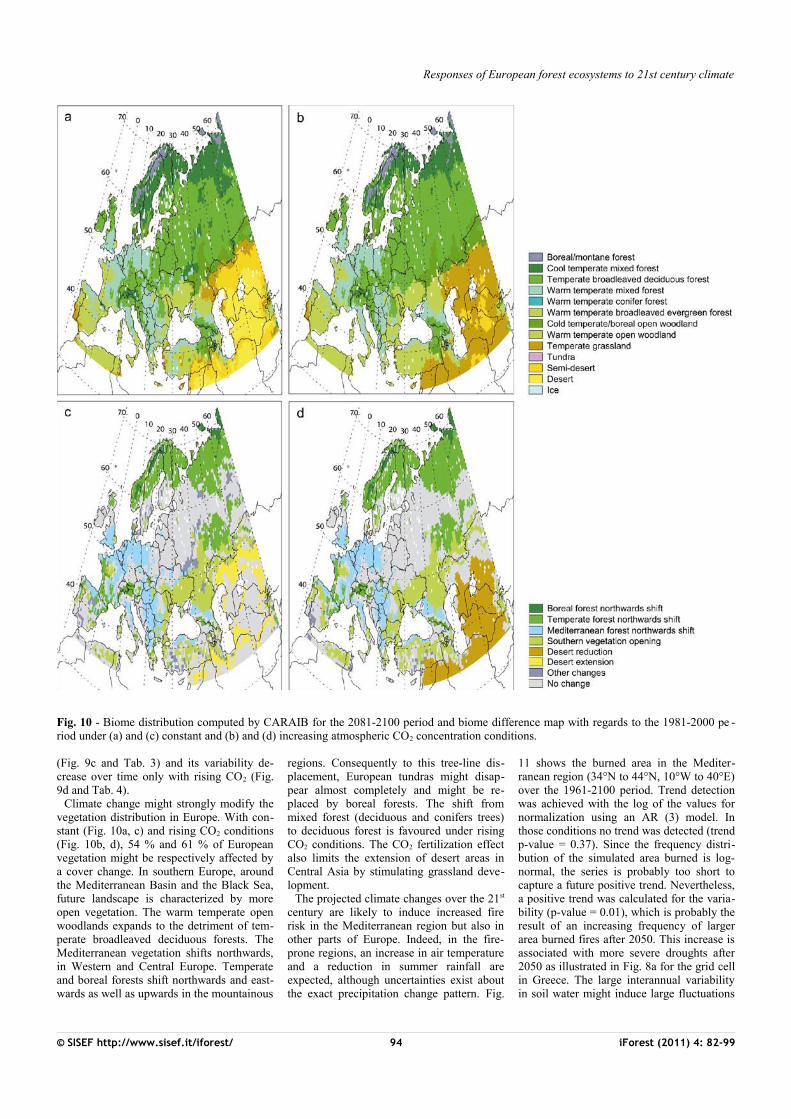
Climate change might strongly modify the vegetation distribution in Europe. With con-stant (Fig. 10a, c) and rising CO2 conditions (Fig. 10b, d), 54 % and 61 % of European vegetation might be respectively affected by a cover change. In southern Europe, around the Mediterranean Basin and the Black Sea, future landscape is characterized by more open vegetation. The warm temperate open woodlands expands to the detriment of tem-perate broadleaved deciduous forests. The Mediterranean vegetation shifts northwards, in Western and Central Europe. Temperate and boreal forests shift northwards and east-wards as well as upwards in the mountainous
regions. Consequently to this tree-line dis-placement, European tundras might disap-pear almost completely and might be re-placed by boreal forests. The shift from mixed forest (deciduous and conifers trees) to deciduous forest is favoured under rising CO2 conditions. The CO2 fertilization effect also limits the extension of desert areas in Central Asia by stimulating grassland deve-lopment.
The projected climate changes over the 21st
century are likely to induce increased fire risk in the Mediterranean region but also in other parts of Europe. Indeed, in the fire-prone regions, an increase in air temperature and a reduction in summer rainfall are expected, although uncertainties exist about the exact precipitation change pattern. Fig.
11 shows the burned area in the Mediter-ranean region (34°N to 44°N, 10°W to 40°E) over the 1961-2100 period. Trend detection was achieved with the log of the values for normalization using an AR (3) model. In those conditions no trend was detected (trend p-value = 0.37). Since the frequency distri-bution of the simulated area burned is log-normal, the series is probably too short to capture a future positive trend. Nevertheless, a positive trend was calculated for the varia-bility (p-value = 0.01), which is probably the result of an increasing frequency of larger area burned fires after 2050. This increase is associated with more severe droughts after 2050 as illustrated in Fig. 8a for the grid cell in Greece. The large interannual variability in soil water might induce large fluctuations
© SISEF http://www.sisef.it/iforest/ 94 iForest (2011) 4: 82-99
Fig. 10 - Biome distribution computed by CARAIB for the 2081-2100 period and biome difference map with regards to the 1981-2000 pe -riod under (a) and (c) constant and (b) and (d) increasing atmospheric CO2 concentration conditions.

Dury M et al. - iForest 4: 82-99
in the burned area. Wet years lead to burned area values which are comparable or lower than those calculated for the present while very dry years, occurring typically every 10-15 years, can increase burned areas by a factor of 3-5 with respect to present most severe fires. In middle Europe, up to 60°N and especially in western France, Poland, Romania, central Russia and Ukraine, fire frequency and intensity also increase signi-ficantly in the simulation. Thus, fire risks might increase almost everywhere in Europe and most countries might have to deal with likely increasing fire damages. Only Scandi-navia and northern Russia might not have to face this increasing fire risk.
Discussion
Model EvaluationAs outlined in the Results section, runoff is
generally underestimated by CARAIB over Europe. First, though the comparison deals only with grid cells covered by more than 30 % of natural vegetation (PCLM2000 map), the simulated potential natural vegetation, predominantly forests, may lead to runoff values different than the ones observed in a landscape patterned by human land use (crops areas, asphalt areas, etc.). Secondly, some features of hydrology in mountainous area, e.g., the slope effect on runoff, are not fully represented in the model. Thirdly, CARAIB contains only one soil layer which does not allow representing the sub-surface runoff in the most appropriate way.
NPP computed by CARAIB are in the range of the estimations obtained by various methods (field estimates and remote sensing products) but the model tends however to underestimate the high productivity values and to underestimate the lower ones. Note that with MODIS, according to Turner et al. (2006), NPP tends also to be overestimated at low productivity sites, often because of ar-
tificially high values of MODIS FPAR (frac-tion of photosynthetically active radiation absorbed by the canopy) and to be under-estimated at high productivity sites, due to relatively low values for vegetation light use efficiency in the MODIS GPP algorithm. The discrepancies between CARAIB and data might be due to land use and manage-ment factors as well as CARAIB limitations. CARAIB produces values for non-managed mature ecosystems whereas most forest stands for NPP estimation are located in managed sites even if at the time of the stu-dies, management have ceased. Some stands are planted with highly productive clonal se-lections or on former fertilized agricultural soils. For instance, a poplar plantation has the highest NPP value of 1710 g C m-2 yr-1
(Gielen et al. 2005 integrated in the Luys-saert et al. 2007 database) in the Fig. 3c. Stand age is also an important factor since it is established that primary productivity de-clines with age (Duvigneaud 1984). Among the limitations due to CARAIB, the underes-timation of runoff may indicate a bias in the water budget which may have some impacts on NPP for soil water limited ecosystems, i.e., receiving annual precipitations lower than 1500 mm yr-1 (Luyssaert et al. 2007). As already mentioned, soil fertility and the influence of nutrient availability on photo-synthesis and plant growth are not taken into account in the model. Moreover, the mean altitude of CARAIB 0.5° grid cells may significantly differ from stand altitude, espe-cially in mountainous area. For instance, the Aubure site, in Vosges Mountains (France) referred with an altitude of 1000 m and a NPP of 432 g C m-2 yr-1 in Luyssaert’s data-base (Luyssaert et al. 2007) corresponds to a CARAIB grid cell with mean altitude of only 384 m and a NPP of 689 g C m-2 yr-1. Fi-nally, interactions with other organisms such as insects inducing partial defoliation can in-duce important photosynthesis decreases
(Allard et al. 2008). This kind of distur-bances is not simulated in the model which can produce overestimated NPP values.
The comparison of biome distribution ob-tained with CARAIB with potential natural vegetation maps underlies some problems. In Ukraine and Iberian Peninsula, the discre-pancies could arise from the water budget owing to possible inaccuracy in precipitation data, in calculation of evapotranspiration or in soil data and their relationship to water conductivity. Annual runoff in these two re-gions is correctly calculated by the model. These regions show contrasted soil water re-gimes. In the Iberian Peninsula, a drought re-appears every summer but winter precipita-tions increase soil water above field capacity and thus allow the reconstitution of ground-water stocks. On the contrary, in Ukraine, the summer drought is not so severe and re-current, but, some years, winter precipita-tions are not sufficient to raise soil water above the field capacity. This can occur dur-ing two to three successive years, preventing the refilling of groundwater reservoirs. In CARAIB, tree mortality owing to water stress only begins below a fixed soil water threshold, which depends on plant type. In addition, the response is assumed quite fast (characteristic time of approximately one month). In these conditions, the model does not allow trees to survive in south-western Iberian Peninsula where the computed soil water falls below the threshold. Actually, water transfers from groundwater to the root zone should occur, especially in valley area. In Ukraine, since groundwater is not refilled trees cannot survive. It seems necessary to refine further the modelling of the vertical and horizontal dynamics of soil and ground water stocks. This kind of problem seems to appear with other dynamic vegetation mo-dels. For instance, the LPJ model also pre-dicts deciduous trees in southern Ukraine and C3 herbs in southern Spain as dominant
iForest (2011) 4: 82-99 95 © SISEF http://www.sisef.it/iforest/
Fig. 11 - Area burned (106 ha) in the Mediterranean Region (34° N to 44° N, 10° W to 40° E) over the 1961-2100 period computed by CARAIB (standard deviation SD computed for 14 consecutive years).

Responses of European forest ecosystems to 21st century climate
plant functional types (Sitch et al. 2003). The other problem of tundra distribution in nor-thern Scandinavia could be linked to the va-lues of the coldest monthly mean night tem-perature (Tcm) or to the growing degree-day (GDD5) thresholds determined for the tree BAGs. In addition, other meteorological factors not introduced in CARAIB such as blowing ice, strong wind or snowpack ex-tend could limit extension of tree distribution to higher latitudes and altitudes as suggested by treeline studies (Stevens & Fox 1991).
The discrepancy between simulated and observed area burned is that only natural fires due to lightning are considered in the model. Lightning causes less than 10 % of the fires, but are responsible for the largest burned areas (FAO 2006). Since the model simulates a fire occurrence probability for the computed potential vegetation, the pro-bability of fire ignition due to human activi-ties is set to zero. In human densely popu-lated areas such as Mediterranean countries, the anthropogenic ignition due to human negligence or crime is the actual main fire-triggering agent contrary to Canada, where the role of humans in igniting fires is usually small (Arora & Boer 2005). Vazquez et al. (2002) suggest that more than 50% of area burned in Spain is caused by negligent and intentional human-ignited fires. The simu-lated values are larger than the expected 10% of fire due to lightning. Indeed, in natural conditions, vegetation is continuous and fire propagation is only limited by available flammable biomass and by meteorological or topographical factors (rivers, stony areas, cliffs). In the model, those factors are taken into account by an extinguishing probability parameter set to a fixed value as a first ap-proximation. Increasing the value of this parameter could allow considering the fire-fighting effort and consequently reducing the burned area. Nevertheless, investigations will be necessary to include topographical resolution.
Projections over 21st century The impacts of climate change and the po-
tential CO2 effect on NPP of European forest ecosystems have been highlighted by two simulations with different CO2 concentration hypothesis (constant and rising concentra-tions). The real response of ecosystem to CO2 enrichment is however a question which is still discussed. It is argued that nutrient availability could be limiting on the primary productivity (McCarthy et al. 2006). Yet, for nitrogen, results from many experimental sites lead to suppose that this is no longer the case. Owing to release of nitrogen into the atmosphere by human activities and sub-sequent deposition on lands, anthropogenic nitrogen sources are now controlling the car-bon balance of most of the temperate and boreal forests (Magnani et al. 2007). As a
rule, the free-air CO2 enrichment FACE pro-ject results demonstrate actual fertilizing ef-fect with C3 plants. Despite increase dark respiration with some plant species and ac-climation of photosynthetic capacity (de-crease of maximum carboxylation rate of Rubisco and maximum electron transport rate leading to ribulose-1.5-bisphosphate re-generation), carbon gain is markedly greater (19-46%) in C3 plants at anticipated CO2
concentration. The reasons are the stimula-tion of the light-saturated rate of photosyn-thetic CO2 uptake and the improvement of the photosynthetic use of N (Leakey et al. 2009). Nevertheless, at some FACE sites, tree growth and NPP remain strongly limited by nitrogen availability (Finzi et al. 2007). Here, most of the extra fixed carbon is allo-cated to fine roots with fast turnover and probably to exudates stimulating microbial activities to enhance N uptake. Trees alter their allocation priorities depending on growing conditions; they favour leaves, roots and mycorrhizae depending on nutrient and water availability (Perry 1994). In addition, others nutrients than nitrogen could also in-duce limitations under enhanced CO2 air concentration, a situation occurring near steady-state nutrient cycle and full canopy development, i.e., when total fine root mass and leaf area index do not increase from year to year (Korner 2006). Since the end of the eighties, the sensitivity of the Western Europe forests to nitrogen deposition is known. In densely populated countries such as the Netherlands, Germany or Belgium, the forests are often restricted to the most infer-tile soils. In those conditions, nitrogen de-position induces soil base cation depletion and tree nutritional imbalances (De Vries 1988, Schulze 1989, Weissen et al. 1990). Otherwise, in regions where water deficit gets worse, rising CO2 concentration offsets the effects of increasing summer drought. In-deed, stomatal closure rendered possible by a higher CO2 concentration induces increased water use efficiency. For C4 plants as well as for C3 plants, significant potential for in-creased photosynthesis and yield at elevated CO2 concentration might result from impro-ved water use and reduce drought stress (Gerten et al. 2004, Ainsworth & Long 2005, Leakey et al. 2009). In CARAIB, CO2 con-centration controls stomatal closure in com-bination with photosynthesis, water stress and air relative humidity, but not the physio-logical acclimation of photosynthetic capa-city. In addition, carbon allocation between structural pools and fast decomposing organs is fixed and there is no coupling with nu-trient cycles. Therefore, CARAIB with in-creased CO2 concentration probably over-estimates NPP at anticipated CO2 concentra-tion. Morales et al. (2007) and Olesen et al. (2007) obtain with LPJ DVM less marked productivity changes with a range of regio-
nal climate models under A2 and B2 emis-sions scenarios. They project the greatest changes in NPP in the northern European ecosystems (35-54 % increases) and smallest changes in southern Europe (only slightly NPP declines or increases). However, the balance between the two scenarios, with and without CO2 fertilization, might be definitely established only by combining the direct ob-servation over long periods of time of tree physiology and the coupling of DVM with nutrient cycles.
In accordance with the conclusions of Mo-hamed et al. (2004) and Medvigy et al. (2010), results show that the variability of soil water and NPP might be modified by changes in climate such as precipitations or temperature. The changes in NPP variability have to be analysed together with changes in NPP values since standard deviation is af-fected by the mean. NPP variability is inevi-tably lower in regions with low productivity.
The factors expected to play the most significant role in the fire regimes during the 21st century are land-use and climate chan-ges. The change in fire occurrence during the last decades closely reflects the recent socio-economic changes underway in many Euro-pean countries, especially in the Mediter-ranean region, such as depopulation of rural areas, decreases in grazing pressure and wood gathering, increase in agricultural me-chanization and tourism pressure, etc. (FAO 2006). These changes in traditional land use and lifestyles have implied the abandonment of large areas of farmland, the recovery of vegetation and an increase in accumulated fuel. Nevertheless, as explained in the Ma-terial and methods section, the aim here was only to simulate the impacts of climate change on fires but not the impacts of the changes in the human factors. When ecosys-tems under anthropic pressure are modelled, the human-caused ignitions can be determi-ned by the population density. Thonicke et al. (2010) model human ignition as a non-li-near function of population density, assu-ming that the number of events initially in-creases as more people settle within a pre-viously unoccupied region but declines with further increases in population density due to landscape fragmentation, urbanisation and associated infrastructural changes.
ConclusionIn this paper, climate change impacts and
potential CO2 fertilization effects on vegeta-tion in Europe under the A2 ARPEGE/cli-mate scenario have been illustrated through two simulations assuming constant and in-creasing CO2 concentration in the vegetation model. The A2 scenario was chosen because it corresponds to a rather important increase in atmospheric CO2 and thus to very substan-tial climate change leading to more extreme conditions for plants. The two simulations
© SISEF http://www.sisef.it/iforest/ 96 iForest (2011) 4: 82-99
Dury M et al. - iForest 4: 82-99
can be expected to bracket the future evolu-tion of the system under an A2 ARPEGE/ Climate scenario, the actual path followed depending on the nutrient budget and the ef-ficiency of the CO2 fertilization effects. Without CO2 fertilization, NPP might strong-ly decrease in many European areas except in the northern part. When CO2 fertilization is included, such decreases are not observed. However, in both cases, the simulated NPP shows increasing interannual fluctuations as-sociated with more frequent and more severe summer droughts. These drier conditions might lead to an increasing fire risk and the annual burned area is projected to rise by a factor of 3 to 5 in the Mediterranean area compared to the present.
The study focused on the future evolution of vegetation represented by Bioclimatic Af-finity Groups (BAGs). It shows that these BAGs will undergo significant change in productivity and eventually mortality asso-ciated with more severe and more frequent drought events in the future. Since they have a narrower bioclimatic spectrum, individual species are probably more vulnerable to cli-mate change than BAGs. Consequently, it would be interesting to apply dynamic vege-tation models at species level in order to ana-lyse the response of a selected set of plant species to climate change. Dynamic vegeta-tion models are indeed probably more appro-priate tools to evaluate impacts of water stress on vegetation than niche-based models (Hickler et al. 2009), especially for fully transient simulations. However, to address more fully this problem, models should incorporate a more precise description of plant response to water stress with validation on experimental or observational site data.
The response of European ecosystems to climate change has been studied assuming no dispersal limitations. The future species distribution depends, however, on the capa-city of plants to migrate. Thus, the introduc-tion of a dispersal module into CARAIB should allow studying more accurately the potential species shift and knowing if they could move fast enough to survive. This kind of question is certainly more relevant for herbs than for trees; the distribution of the latter being most of the time human mana-ged.
Moreover, it would be worth to continue further the analysis by using the outputs of several climate models and several IPCC SRES scenarios to evaluate the uncertainties of climate projections and their impacts on future vegetation evolution. The analysis and the validation of climate model variability at the diurnal, seasonal and interannual time scales should be also carried out since clima-te variability at all these time scales will go-vern the response of plant species to climate change.
AcknowledgementsWe thank Michel Déqué (MétéoFrance,
CNRM, Toulouse) for providing the ARPEGE/Climate dataset and Dimitrios Ef-thymiadis (CRU, East Anglia) for the CRU TS3.0 dataset. Funding for this research from the ECOCHANGE integrated project (European Commission) and from the Uni-versity of Liège (FSR 2010) is gratefully acknowledged.
ReferencesAinsworth EA, Long SP (2005). What have we
learned from 15 years of free-air CO2 enrichment (FACE)? A meta-analytic review of the re-sponses of photosynthesis, canopy. New Phytolo-gist 165: 351-371. - doi: 10.1111/j.1469-8137. 2004.01224.x
Albani M, Medvigy D, Hurtt GC, Moorcroft PR (2006). The contributions of land-use change, CO2 fertilization, and climate variability to the Eastern US carbon sink. Global Change Biology 12: 2370-2390. - doi: 10.1111/j.1365-2486.2006. 01254.x
Allard V, Ourcival JM, Rambal S, Joffre R, Ro-cheteau A (2008). Seasonal and annual variation of carbon exchange in an evergreen Mediter-ranean forest in southern France. Global Change Biology 14: 714-725. - doi: 10.1111/j.1365-2486. 2008.01539.x
Arora VK, Boer GJ (2005). Fire as an interactive component of dynamic vegetation models. Jour-nal of Geophysical Research-Biogeosciences 110. - doi: 10.1029/2005JG000042
Hazeu GW, Mücher CA, Kramer H, Kienast F (2008). Compilation and assessment of Pan European land cover changes. In: Proceedings of Istanbul 28th EARSeL Symposium “Remote Sensing for a Changing Europe”.
Ball JT, Woodrow IE, Berry JA (1987). A model predicting stomatal conductance and its contribu-tion to the control of photosynthesis under differ-ent environmental conditions. In: “Progress in Photosynthesis Research 4” (Biggins J ed). Nijhoff, Dordrecht, The Netherlands, pp. 221.
Bohn U, Gollub G, Hettwer C, Neuhäuslová Z, Raus Th, Schlüter H, Weber H (2003). Karte der natürlichen vegetation Europas/Map of the Na-tural Vegetation of Europe, Maßstab/Scale 1: 2.500.000 (Bearb. eds). Interaktive/Interactive CD-ROM - Erläuterungstext, Legende, Karten / Explanatory Text, Legend, Maps. Land-wirtschaftsverlag, Münster, Germany.
Box GEP, Jenkins JM (1970). Time series analy-sis, forecasting and control. Holden-Day, San Francisco, CA, USA.
Box GEP, Tiao GC (1975). Intervention analysis with applications to economic and environmental problems. Journal of the American Statistical As-sociation 70: 70-79. - doi: 10.2307/2285379
Cao MK, Tao B, Li KR, Shao XM, Prience SD (2003). Inter-annual variation in terrestrial eco-system carbon fluxes in China from 1981 to 1998. Acta Botanica Sinica 45: 552-560. [online] URL: http://sourcedb.igsnrr.cas.cn/zw/stxtsys/ syslw/200906/P020090625724998756116.PDF
Cheddadi R, Vendramin GG, Litt T, Francois LM, Kageyama M, Lorentz S, Laurent JM, de Beau-lieu JL, Sadori L, Jost A, Lunt D (2006). Im-prints of glacial refugia in the modern genetic di-versity of Pinus sylvestris. Global Ecology and Biogeography 15: 271-282. - doi: 10.1111/ j.1466-822x.2006.00226.x
Chirici G, Barbati A, Maselli F (2007). Modelling of Italian forest net primary productivity by the integration of remotely sensed and GIS data. Forest Ecology and Management 246: 285-295. - doi: 10.1016/j.foreco.2007.04.0
Ciais P, Reichstein M, Viovy N, et al. (2005). Europe-wide reduction in primary productivity caused by the heat and drought in 2003. Nature 437: 529-533. - doi: 10.1038/nature03972
Cogley JG (1998). GGHYDRO – global hydro-graphic data, release 2.2 Data set. Department of Geography. Trent University, Peterborough, Ontario, Canada. [online] URL: http://www. trentu.ca/geography/glglgghy.htm
Collatz GJ, Ribas-Carbo M, Berry JA, (1992). Coupled photosynthesis-stomatal conductance model for leaves of C4 plants. Australian Journal of Plant Physiology 19: 519-538. - doi: 10.1071/ PP9920519
Coops NC, Waring RH (2001). Assessing forest growth across southwestern Oregon under a range of current and future global change scena-rios using a process model, 3-PG. Global Change Biology 7: 15-29. - doi: 10.1046/j.1365-2486. 2001.00385.x
De Groot RS, Wilson MA, Boumans RMJ (2002). A typology for the classification, description and valuation of ecosystem functions, goods and ser-vices. Ecological Economics 41: 393-408. - doi: 10.1016/S0921-8009(02)00089-7
De Pury DGG, Farquhar GD (1997). Simple sca-ling of photosynthesis from leaves to canopies without the errors of big-leaf models. Plant, Cell and Environment 20: 537-557. - doi: 10.1111/ j.1365-3040.1997.00094.x
De Vries W (1988). Critical deposition levels for nitrogen and sulphur on Dutch forest ecosystems. Water, Air, and Soil Pollution 42: 221-239. - doi: 10.1007/BF00282403
Dunn AL, Barford CC, Wofsy SC, Goulden ML, Daube BC (2007). A long-term record of carbon exchange in a boreal black spruce forest: means, responses to interannual variability, and decadal trends. Global Change Biology 13: 577-590. - doi: 10.1111/j.1365-2486.2006.01221.x
Duvigneaud P, Paulet E, Kestemont P, Tanghe M, Denayer de Smet S, Schnock G, Timperman J (1972). Productivité comparée d’une hêtraie (Fa-getum) et d’une pessière (Piceetum), établies sur même roche-mère, à Mirwart (Ardenne luxem-bourgeoise). Bulletin de la Société Royale de Botanique de Belgique 152: 183-195.
Duvigneaud P (1984). La synthèse écologique. Populations, communautés, écosystèmes, bio-sphère, noosphère. Doin, Paris, France.
Easterling DR, Meehl GA, Parmesan C, Changnon SA, Karl TR, Mearns LO (2000). Climate ex-tremes: observations, modelling, and impacts. Science 289: 2068-2074. - doi: 10.1126/science.
iForest (2011) 4: 82-99 97 © SISEF http://www.sisef.it/iforest/
Responses of European forest ecosystems to 21st century climate
289.5487.2068FAO (2006). Global Forest Resources Assessment
2005. Report on fires in the Mediterranean Re-gion. Fire Management Working Paper 8. [on-line] URL: http://www.fao.org/forestry/site/fire-alerts/en
Farquhar GD, von Caemmerer S, Berry JA (1980). A biogeochemical model of photosynthetic CO2
assimilation in leaves of C3 species. Planta 149: 78-90. - doi: 10.1007/BF00386231
Finzi AC, Norby RJ, Calfapietra C et al. (2007). Increases in nitrogen uptake rather than nitrogen-use efficiency support higher rates of temperate forest productivity under elevated CO2. Proceed-ings of the National Academy of Sciences USA 104: 14014-14019. - doi: 10.1073/pnas.07065 18104
Flannigan MD, Karwchuk MA, De Groot WJ, Wotton BM, Gowman LM (2009). Implications of changing climate for global wildland fire. In-ternational Journal of Wildland Fire 18: 483-507. - doi: 10.1071/WF08187
François LM, Delire C, Warnant P, Munhoven G (1998). Modelling the glacial - interglacial chan-ges in the continental biosphere. Global Plane-tary Change 16-17 (1-4): 37-52. - doi: 10.1016/ S0921-8181(98)00005-8
François LM, Goddéris Y, Warnant P, Ramstein G, de Noblet N, Lorenz S (1999). Carbon stocks and isotopic budgets of the terrestrial biosphere at mid-Holocene and last glacial maximum times. Chemical Geolology 159 (1-4): 163-189. - doi: 10.1016/S0009-2541(99)00039-X
François LM, Ghislain M, Otto D, Micheels A (2006). Late Miocene vegetation reconstruction with the CARAIB model. Palaeogeography Pa-laeoclimatology Palaeoecology 238: 302-320. - doi: 10.1016/j.palaeo.2006.03.034
Galy V, Francois LM, France-Lanord C, Faure P, Kudrass H, Palhol F, Singh SK (2008). C4 plants decline in the Himalayan basin since the Last Glacial Maximum. Quaternary Science Reviews 27: 1396-1409. - doi: 10.1016/j.quascirev.2008. 04.005
Gérard JC, Nemry B, Francois LM, Warnant P (1999). The interannual change of atmospheric CO2: contribution of subtropical ecosystems? Geophysical Research Letters 26: 243-246. - doi: 10.1029/1998GL900269
Gerdol R (2005). Growth performance of two de-ciduous Vaccinium species in relation to nutrient satus in subalpine heath. Flora 200: 168-174. - doi: 10.1016/j.flora.2004.05.003
Gerten D, Schaphoff S, Haberlandt U, Lucht W, Sitch S (2004). Terrestrial vegetation and water balance - hydrological evaluation of a dynamic global vegetation model. Journal of Hydrology 286: 249-270. - doi: 10.1016/j.jhydrol.2003.09. 029
Gibelin AL, Déqué M (2003). Anthropogenic cli-mate change over the Mediterranean region si-mulated by a global variable resolution model. Climate Dynamics 20: 327-339.
Gielen B, Calfapietra C, Lukac M, et al. (2005). Net carbon storage in a poplar plantation (POP-FACE) after three years of free-air CO2 enrich-
ment. Tree Physiology 25: 1399-1408. - doi: 10.1093/treephys/25.11.1399
Gielen B, Verbeeck H, Neirynck J, Sampson DA, Vermeiren F, Janssens IA (2010). Decadal water balance of a temperate Scots pine forest (Pinus sylvestris L.) based on measurements and model-ling. Biogeosciences 7: 1247-1261. - doi: 10.5194/bg-7-1247-2010
Giorgi F, Bi XQ, Pal J (2004a). Mean, interannual variability and trends in a regional climate change experiment over Europe. I. Climate change scenarios (1961-1990). Climate Dyna-mics 22: 733-756. - doi: 10.1007/s00382-004-0409-x
Giorgi F, Bi XQ, Pal J (2004b). Mean, interannual variability and trends in a regional climate change experiment over Europe. II. Climate change scenarios (2071-2100). Climate Dyna-mics 23: 839-858. - doi: 10.1007/s00382-004-0467-0
Goulden ML, Munger JW, Fan SM, Daube BC, Wofsy SC (1996). Exchange of carbon dioxide by a deciduous forest: Response to interannual climate variability. Science 271: 1576-1578. - doi: 10.1126/science.271.5255.1576
Granier A, Breda N, Longdoz B, Gross P, Ngao J (2008). Ten years of fluxes and stand growth in a young beech forest at Hesse, north-eastern France. Annals of Forest Science 65. - doi: 10.1051/forest:2008052
Hajar L, François LM, Khater C, Jomaa I, Déqué M, Cheddadi R (2010). Cedrus libani (A. Rich) distribution in Lebanon: Past, present and future. Comptes Rendus Biologies 333: 622-630. - doi: 10.1016/j.crvi.2010.05.003
Helmisaari HJ, Makkonen K, Kellomäki S, Valonen E, Mälkönen E (2002). Below- and above-ground biomass, production and nirogen use in Scots pine stands in eastern Finland. Forest Ecology and Management 165: 317-326. - doi: 10.1016/S0378-1127(01)00648-X
Hickler T, Fronzek S, Araujo MB, Schweiger O, Thuiller W, Sykes MT (2009). An ecosystem model-based estimate of changes in water avai-lability differs from water proxies that are com-monly used in species distribution models. Glo-bal Ecology and Biogeography 18: 304-313. - doi: 10.1111/j.1466-8238.2009.00455.x
Hubert B, Francois LM, Warnant P, Strivay D (1998). Stochastic generation of meteorological variables and effects on global models of water and carbon cycles in vegetation and soils. Journal of Hydrology 212: 318-334. - doi: 10.1016/ S0022-1694(98)00214-5
Jentsch A, Beierkuhnlein C (2008). Research fron-tiers in climate change: Effects of extreme me-teorological events on ecosystems. Comptes Rendus Geoscience 340: 621-628. - doi: 10.1016/j.crte.2008.07.002
JRC (2008). Forest fires in Europe 2007. Scienti-fic and technical report 8 [online] URL: http://www.fire.uni-freiburg.de/programmes/eu-comission/EU-Forest-Fires-in-Europe-2007.pdf
Korner C (2006). Plant CO2 responses: an issue of definition, time and resource supply. New Phyto-logist 172: 393-411. - doi: 10.1111/j.1469-8137.
2006.01886.xKramer K, Degen B, Buschbom J, Hickler T,
Thuiller W, Sykes MT, de Winter W (2010). Modelling exploration of the future of European beech (Fagus sylvatica L.) under climate change-Range, abundance, genetic diversity and adaptive response. Forest Ecology and Management 259: 2213-2222. - doi: 10.1016/j.foreco.2009.12.023
Lagergren F, Eklundh L, Grelle A, Lundblad M, Molder M, Lankreijer H, Lindroth A (2005). Net primary production and light use efficiency in a mixed coniferous forest in Sweden. Plant Cell and Environment 28: 412-423. - doi: 10.1111/ j.1365-3040.2004.01280.x
Laurent JM, Bar-Hen A, Francois LM, Ghislain M, Cheddadi R (2004). Refining vegetation sim-ulation models: from plant functional types to bioclimatic affinity groups of plants. Journal of Vegetation Science 15: 739-746.
Laurent JM, Francois LM, Bar-Hen A, Bel L, Cheddadi R (2008). European bioclimatic affi-nity groups: Data-model comparisons. Global and Planetary Change 61: 28-40. - doi: 10.1016/ j.gloplacha.2007.08.017
Leakey ADB, Ainsworth EA, Bernacchi CJ, Ro-gers A, Long SP, Ort DR (2009). Elevated CO2
effects on plant carbon, nitrogen, and water rela-tions: six important lessons from FACE. Journal of Experimental Botany 60: 2859-2876. - doi: 10.1093/jxb/erp096
Leroy T (2007). Implémentation d’un module de feu dans un modèle dynamique global de végéta-tion. Application sur la péninsule Ibérique et sur l’Europe de l’ouest. Master thesis, Université de Liège, Liège, Belgium. (In French).
Lossaint P, Rapp M (1971). Le cycle du carbone dans les forêts de Pinus halepensis. In: Pro-ceedings of Brussels Symposium “Productivity of forest ecosystems” (Duvigneaud P ed), pp. 213-216.
Lütkepohl H, Breitung J, Brüggemann R, Herwatz H, Teräsvirta T, Tschernig R, Krätzig M (2004). Applied time series econometrics. Cambridge University Press, Cambridge, UK.
Luyssaert S, Inglima I, Jung M, et al. (2007). CO2
balance of boreal, temperate, and tropical forests derived from a global database. Global Change Biology 13: 2509-2537. - doi: 10.1111/j.1365-2486.2007.01439.x
Magnani F, Mencuccini M, Borghetti M et al. (2007). The human footprint in the carbon cycle of temperate and boreal forests. Nature 447: 848-850. - doi: 10.1038/nature05847
McCarthy HR, Oren R, Finzi AC, Johnsen KH (2006). Canopy leaf area constrains CO2-induced enhancement of productivity and partitioning among aboveground carbon pools. Proceedings of the National Academy of Sciences of the United States of America 103: 19356-19361. - doi: 10.1073/pnas.0609448103
McGuire AD, Sitch S, Clein JS, et al. (2001). Car-bon balance of the terrestrial biosphere in the twentieth century: Analyses of CO2, climate and land use effects with four process-based ecosys-tem models. Global Biogeochemical Cycles 15: 183-206. - doi: 10.1029/2000GB001298
© SISEF http://www.sisef.it/iforest/ 98 iForest (2011) 4: 82-99

Dury M et al. - iForest 4: 82-99
Medvigy D, Wofsy SC, Munger JW, Moorcroft PR (2010). Responses of terrestrial ecosystems and carbon budgets to current and future environ-mental variability. Proceedings of the National Academy of Sciences USA 107: 8275-8280. - doi: 10.1073/pnas.0912032107
Melillo JM, Mcguire AD, Kicklighter DW, Moore III B, Vorosmarty CJ, Schloss AL (1993). Global climate change and terrestrial net primary pro-duction. Nature 363: 234-240. - doi: 10.1038/ 363234a0
Mohamed MAA, Babiker IS, Chen ZM, Ikeda K, Ohta K, Kato K (2004). The role of climate va-riability in the inter-annual variation of terrestrial net primary production (NPP). Science of the Total Environment 332: 123-137. - doi: 10.1016/ j.scitotenv.2004.03.009
Möller CM, Müller D, Nielsen J (1954). Ein Dia-gramm der Stoffproduktion im Buchenwald. Det Forstlige Forsoegsvaesen i Danmark 21: 327-335.
Morales P, Hickler T, Rowell DP, Smith B, Sykes MT (2007). Changes in European ecosystem pro-ductivity and carbon balance driven by regional climate model output. Global Change Biology 13: 108-122. - doi: 10.1111/j.1365-2486.2006. 01289.x
Nakicenovic N, Alcamo J, Davis G, et al. (2000). Special report on emissions scenarios: a special report of Working Group III of the Intergovern-mental Panel on Climate change. Cambridge University Press, Cambridge, UK.
Nemry B, François LM, Warnant P, Robinet F, Gérard JC (1996). The seasonality of the CO2 ex-change between the atmosphere and the land bio-sphere: a study with a global mechanistic vegeta-tion model. Journal Geophysical Research 101 (D3): 7111-7125. - doi: 10.1029/95JD03656
New M, Hulme M, Jones P (1999). Representing twentieth-century space-time climate variability. Journal of Climate 12: 829-856. - doi: 10.1175/ 1520-0442(1999)012<0829:RTCSTC>2.0.CO;2
New M, Lister D, Hulme M, Makin I (2002). A high-resolution data set of surface climate over global land areas. Climate Research 21: 1-25. - doi: 10.3354/cr021001
Olesen JE, Carter TR, Diaz-Ambrona CH, Fronzek S, Heidmann T, Hickler T, Holt T, Minguez MI, Morales P, Palutikof JP, Quemada M, Ruiz-Ramos M, Rubaek GH, Sau F, Smith B, Sykes MT (2007). Uncertainties in projected im-pacts of climate change on European agriculture and terrestrial ecosystems based on scenarios from regional climate models. Climatic Change 81 (1): 123-143. - doi: 10.1007/s10584-006-9216-1
Otto D, Rasse D, Kaplan J, Warnant P, Francois LM (2002). Biospheric carbon stocks reconstruc-ted at the Last Glacial Maximum: comparison between general circulation models using pre-scribed and computed sea surface temperatures. Global Planetary Change 33: 117-138. - doi: 10.1016/S0921-8181(02)00066-8
Parmesan C, Root TL, Willig MR (2000). Impacts of extreme weather and climate on terrestrial
biota. Bulletin of the American Meteorological Society 81: 443-450. - doi: 10.1175/1520-0477 (2000)081<0443:IOEWAC>2.3.CO;2
Peng C, Zhou X, Zhao S, Wang X, Zhu B, Piao S, Fang J (2009). Quantifying the response of forest carbon balance to future climate change in Northeastern China: Model validation and pre-diction. Global and Planetary Change 66: 179-194. - doi: 10.1016/j.gloplacha.2008.12.001
Perry DA (1994). Forest ecosystems. John Hop-kins University Press, Baltimore, USA and Lon-don, UK.
Rowell DP (2005). A scenario of European cli-mate change for the late twenty-first century: seasonal means and interannual variability. Cli-mate Dynamics 25: 837-849. - doi: 10.1007/ s00382-005-0068-6
Salas y Mélia D, Chauvin F, Déqué M, Douville H, Guérémy JF, Marquet P, Planton S, Royer JF, Tyteca S (2005). Description and validation of CNRM-CM3 global coupled climate model. Note de centre GMGEC, CNRM, 103.
Scholes RJ, Biggs R (2005). A biodiversity intact-ness index. Nature 434: 45-49. - doi: 10.1038/ nature03289
Schröter D, Cramer W, Leemans R et al. (2005). Ecosystem service supply and vulnerability to global change in Europe. Science 310: 1333-1337. - doi: 10.1126/science.1115233
Schulze ED, Koch W (1971). Measurement of primary production with cuvettes. In: Proceed-ings of Brussels Symposium “Productivity of forest ecosystems” (Duvigneaud P ed), pp. 141-157.
Schulze ED (1989). Air-pollution and forest de-cline in a spruce (Picea abies) forest. Science 244: 776-783. - doi: 10.1126/science.244.4906. 776
Sindani KT, Lejoly J (1990). Phytomass and pro-ductivity of 4 forests in the Alpes de Haute-Provence (Southern France). Belgian Journal of Botany 123: 103-116.
Sitch S, Smith B, Prentice IC, Arneth A, Bondeau A, Cramer W, Kaplan JO, Levis S, Lucht W, Sykes MT, Thonicke K, Venevsky S (2003). Evaluation of ecosystem dynamics, plant geo-graphy and terrestrial carbon cycling in the LPJ dynamic global vegetation model. Global Change Biology 9: 161-185. - doi: 10.1046/ j.1365-2486.2003.00569.x
Stevens GC, Fox JF (1991). The causes of treeline. Annual Review of Ecology and System-atics 22: 177-191. - doi: 10.1146/annurev.es.22. 110191.001141
Tagesson T, Smith BR, Löfgren A, Ramming A, Eklundh L, Lindroth A (2009). Estimating net primary production of Swedish forest landscapes by combining mechanistic modelling and remote sensing. Ambio 38: 316-324. - doi: 10.1579/08-A-513.1
Thonicke K, Spessa A, Prentice IC, Harrison SP, Dong L, Carmona-Moreno C (2010). The influ-ence of vegetation, fire spread and fire behaviour on biomass burning and trace gas emissions: re-sults from a process-based model. Biogeo-
sciences 7: 1991-2011. - doi: 10.5194/bg-7-1991-2010
Thuiller W, Albert C, Araújo MB, Berry PM, Cabeza M, Guisan A, Hickler T, Midgley GF, Paterson J, Schurr F, Sykes MT, Zimmermann NE (2008). Predicting global change impacts on plant species’ distributions: Future challenges. Perspectives in plant ecology, evolution and sys-tematics 9: 137-152. - doi: 10.1016/j.ppees.2007. 09.004
Turner DP, Ritts WD, Cohen WB, Gower ST, Running SW, Zhao MS, Costa MH, Kirschbaum AA, Ham JM, Saleska SR, Ahl DE (2006). Eva-luation of MODIS NPP and GPP products across multiple biomes. Remote Sensing of Environ-ment 102: 282-292. - doi: 10.1016/j.rse.2006. 02.017
Valentini R, De Angelis P, Matteucci G, Monaco R, Dore S, Scarascia Mugnozza GE (1996). Sea-sonal net carbon dioxide exchange of a beech forest with the atmosphere. Global Change Bio-logy 2: 199-207. - doi: 10.1111/j.1365-2486. 1996.tb00072.x
Van der Linden P, Mitchell JFB (2009). EN-SEMBLES: climate change and its impacts: sum-mary of research and results from the EN-SEMBLES project. Met Office Hadley Centre, FitzRoy Road, Exeter EX1 3PB, UK. pp. 160.
Van Wijk M, Dekker S, Bouten W, Bosveld F, Kohsiek W, Kramer K, Mohren G (2000). Mo-delling daily gas exchange of a douglasfir forest: comparison of three stomatal conductance mo-dels with and without a soil water stress function. Tree Physiology 20: 115-122. - doi: 10.1093/ treephys/20.2.115
Vazquez A, Perez B, Fernandez-Gonzalez F, Moreno JM (2002). Recent fire regime character-istics and potential natural vegetation relation-ships in Spain. Journal of Vegetation Science 13: 663-676. - doi: 10.1111/j.1654-1103.2002. tb02094.x
Warnant P (1999). Modélisation du cycle du car-bone dans la biosphère continentale à l’échelle globale. PhD thesis, Université de Liège, Liège, Belgium.
Warnant P, François LM, Strivay D, Gérard JC (1994). CARAIB: a global model of terrestrial biological productivity. Global Biogeochemical Cycles 8 (3): 255-270. - doi: 10.1029/94G-B00850
Weissen F, Hambuckers A, Vanpraag HJ, Re-macle J (1990). A decennial control of N-cycle in the Belgian Ardenne forest ecosystems. Plant and Soil 128: 59-66. - doi: 10.1007/BF00009396
Yuste JC, Konopka B, Janssens IA, Coenen K, Xiao CW, Ceulemans R (2005). Contrasting net primary productivity and carbon distribution between neighboring stands of Quercus robur and Pinus sylvestris. Tree Physiology 25: 701-712. - doi: 10.1093/treephys/25.6.701
Zhao MS, Heinsch FA, Nemani RR, Running SW (2005). Improvements of the MODIS terrestrial gross and net primary production global data set. Remote Sensing of Environment 95: 164-176. - doi: 10.1016/j.rse.2004.12.011
iForest (2011) 4: 82-99 99 © SISEF http://www.sisef.it/iforest/