Response to Assessment Feedback: The Effects of Grades ... · PDF fileBlack and Wiliam (1998)...
65
Listening. Learning. Leading. ® Response to Assessment Feedback: The Effects of Grades, Praise, and Source of Information Anastasiya A. Lipnevich Jeffrey K. Smith June 2008 ETS RR-08-30 Research Report
Transcript of Response to Assessment Feedback: The Effects of Grades ... · PDF fileBlack and Wiliam (1998)...
Listening. Learning. Leading.®
Response to Assessment Feedback: The Effects of
Grades, Praise, and Source of Information
Anastasiya A. Lipnevich
Jeffrey K. Smith
June 2008
ETS RR-08-30
Research Report

Response to Assessment Feedback:
The Effects of Grades, Praise, and Source of Information
Anastasiya A. Lipnevich
ETS, Princeton, NJ
Jeffrey K. Smith
University of Otago, New Zealand
June 2008

As part of its educational and social mission and in fulfilling the organization's nonprofit charter
and bylaws, ETS has and continues to learn from and also to lead research that furthers
educational and measurement research to advance quality and equity in education and assessment
for all users of the organization's products and services.
ETS Research Reports provide preliminary and limited dissemination of ETS research prior to
publication. To obtain a PDF or a print copy of a report, please visit:
http://www.ets.org/research/contact.html
Copyright © 2008 by Educational Testing Service. All rights reserved.
E-RATER, ETS, the ETS logo, and LISTENING. LEARNING. LEADING. are registered trademarks of
Educational Testing Service (ETS).
CRITERION is a trademark of ETS.

Abstract
This experiment involved college students (N = 464) working on an authentic learning task
(writing an essay) under 3 conditions: no feedback, detailed feedback (perceived by participants
to be provided by the course instructor), and detailed feedback (perceived by participants to be
computer generated). Additionally, conditions were crossed with 2 factors of grade (receiving
grade or not) and praise (receiving praise or not). Detailed feedback specific to individual work
was found to be strongly related to student improvement in essay scores, with the influence of
grades and praise more complex. Overall, detailed, descriptive feedback was found to be most
effective when given alone, unaccompanied by grades or praise. The results have implications
for theory and practice of assessment.
Key words: Assessment feedback, grades, praise, computer-provided feedback, affect,
motivation.
i
Acknowledgments
We would like to thank the following individuals who made the completion of this project
possible: Steven Barnhart, Sergey Lipnevich, Harold Beder, and Douglas Penfield. We are
indebted to Marisa Farnum for her gracious support of this project. We also wish to thank
Russell Almond, Thomas Quinlan, Nathan Kogan, and Richard Roberts for their useful
suggestions on an earlier draft of this manuscript. Finally, we extend our thanks to the students
who took part in the study. Thank you all!
ii

Table of Contents
Page
Types of Feedback .......................................................................................................................... 2
Meta-Analytic Studies Effects of Feedback ................................................................................... 3
Grading .................................................................................................................................... 4
Praise........................................................................................................................................ 7
Source of Feedback................................................................................................................ 10
Rationale and Aims....................................................................................................................... 12
Method .......................................................................................................................................... 13
Participants ............................................................................................................................ 13
Instrumentation ...................................................................................................................... 14
Procedures.............................................................................................................................. 15
Scoring................................................................................................................................... 17
Results........................................................................................................................................... 22
Analyses of the Effects of Treatments on the Final Exam Score .......................................... 21
Analysis of Differences in the Final Exam Score by Students’ Performance on the First
Exam Draft............................................................................................................................. 24
Analyses of Differences in Motivation, Self-Efficacy, and Affect ....................................... 29
Analyses of Differences in Perceived Helpfulness and Accuracy of Feedback.................... 30
Discussion..................................................................................................................................... 31
Descriptive Feedback and Its Effects on Learning ................................................................ 32
Differences in Responses Depending on the Perceived Source of Feedback........................ 32
The Effects of Grades on Students Learning......................................................................... 33
The Effects of Praise on Students’ Learning ......................................................................... 35
Difference in Responses to Feedback for Students of Different Performance Levels .......... 36
Limitations............................................................................................................................. 37
Directions for Future Research.............................................................................................. 38
Conclusion .................................................................................................................................... 39
References..................................................................................................................................... 40
List of Appendixes........................................................................................................................ 46
iii
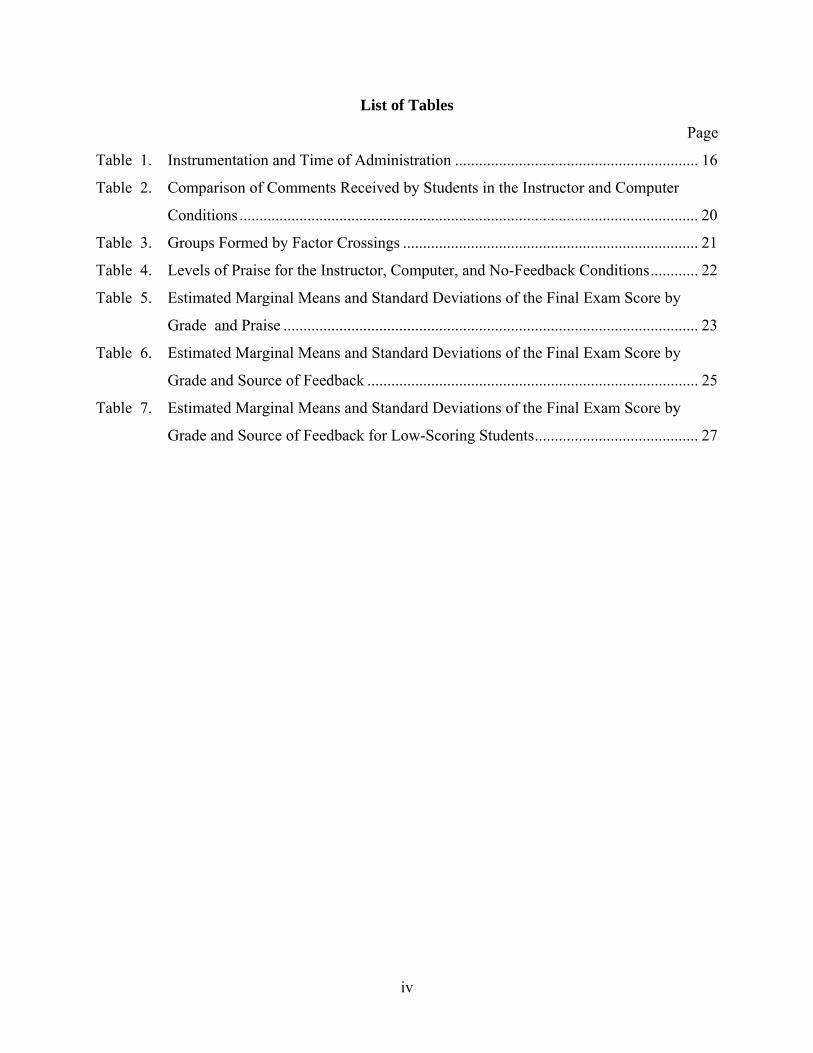
List of Tables
Page
Table 1. Instrumentation and Time of Administration ............................................................. 16
Table 2. Comparison of Comments Received by Students in the Instructor and Computer
Conditions ................................................................................................................... 20
Table 3. Groups Formed by Factor Crossings .......................................................................... 21
Table 4. Levels of Praise for the Instructor, Computer, and No-Feedback Conditions............ 22
Table 5. Estimated Marginal Means and Standard Deviations of the Final Exam Score by
Grade and Praise ........................................................................................................ 23
Table 6. Estimated Marginal Means and Standard Deviations of the Final Exam Score by
Grade and Source of Feedback ................................................................................... 25
Table 7. Estimated Marginal Means and Standard Deviations of the Final Exam Score by
Grade and Source of Feedback for Low-Scoring Students......................................... 27
iv

List of Figures
Page
Figure 1. Layout of the essay-writing screen during the first session. ....................................... 16
Figure 2. Detailed feedback screen with a pop-up message for a specific feedback item.......... 18
Figure 3. Mean final exam score as function of grade and praise. ............................................. 23
Figure 4. Mean final exam score as function of grade and feedback source. ............................. 25
Figure 5. Mean final exam score as function of grade and feedback source for low-scoring
students......................................................................................................................... 27
Figure 6. Mean final exam score as function of grade and feedback source for students with
medium first exam scores. ........................................................................................... 28
Figure 7. Mean final exam score as function of grade and feedback source for high-scoring
students......................................................................................................................... 28
v
In a monograph that changed the conceptualization of assessment, Michael Scriven (1967)
argued for differentiating the summative and formative roles of curriculum evaluation. Presently,
there appears renewed interest in the use of formative assessment as a means of improving student
learning (see e.g., Shute, 2007; Symonds, 2004; Wiliam & Thompson, 2007). In their review of the
literature, Black and Wiliam (1998) proposed that the core activity of formative assessment
comprised two types of information: (a) learners’ current knowledge set and (b) the desired
knowledge set as prescribed by the instructor, curriculum, or students’ personal standards. The
discrepancy between the two knowledge sets represents a gap that is closed by the learner
achieving the final goal (Black & Wiliam, 2003; Ramaprasad, 1983).
Black and Wiliam (1998) also proposed two additional components of formative
assessment: (a) the perception in learners of a gap between a desired goal and their present state of
knowledge, skill, or understanding and (b) the action taken by learners to close that gap in order to
achieve the desired outcome. The action taken by a learner in response to information about the
discrepancy depends heavily on the nature of the message, the way in which it was received, the
way in which perception of a gap motivates a choice of available courses of action, as well as the
working contexts in which that action may be carried out (Black & Wiliam, 1998). Students’
dispositional characteristics, such as their self-efficacy beliefs (Ames, 1992; Craven, Marsh, &
Debus, 1991) and goal orientation (Dweck, 1986; Tubbs, Boehne, & Dahl, 1993) as well as
temporary affective states (Derryberry, 1991; Ilies & Judge, 2005), are influenced by and, in turn,
influence learners’ response to the information about the existing discrepancy between the actual
and the objective knowledge sets.
In order for assessment to facilitate learning, students need to receive information about
their performance and the existing discrepancy between the actual and the desired state, and
effectively process that information. This information is commonly referred to as feedback (Ilgen
& Davis, 2000; Kluger & DeNisi, 1996). Although some approaches to learning do not explicitly
include feedback as an important consideration (e.g., instruction-induced self-questioning; Wong,
1985), the key role of external feedback in providing connections between students’ current and
desired statesis clear. However, not all feedback is the same and not all feedback is equally
effective in promoting learning (Black & Wiliam, 1998; Hattie & Timperley, 2007; Kluger &
DeNisi, 1996). The basic goal of the present study is to explore aspects of different types of
feedback and the effects they have on performance.
1

Types of Feedback
Researchers categorize feedback in numerous ways. To begin, feedback may differ
according to intentionality. Intentional feedback occurs in instructional settings and is designed to
inform students about the quality, correctness, and general appropriateness of their performance.
Unintentional feedback is incidental in nature and results from natural interactions with the social
and physical environment. This might include a cake that fails to rise or a pair of jeans that fit well
last month but seem tight today. In an instructional context, unintentional feedback often occurs in
unstructured peer interactions and unguided simulations (Bangert-Drowns, Kulik, & Morgan,
1991). Although unintentional feedback can be a powerful incentive for learning and other change,
intentional feedback is the focus of this study (Bangert-Drowns et al.). Intentional feedback can be
categorized according to the way in which it is provided to students. Direct feedback is delivered
from a teacher or a peer to a student in the act of interpersonal communication. Alternatively,
indirect, or mediated, feedback is delivered to learners through a range of artifacts (Leontyev,
1981). Computer-provided feedback is among the most commonly used types of mediated
feedback.
Both direct and mediated feedback can be distinguished according to their content on two
vectors of load and type of information. Load is represented by the amount of information
provided in the feedback message, ranging from a letter grade to a detailed narrative account of
students’ performance (Kulhavy & Stock, 1989). Type of information can be dichotomized into
process related, or descriptive feedback, and outcome related, or evaluative feedback. Evaluative
feedback provides students with information concerning the correctness of responses. It represents
a judgment that often carries a connotation of social comparison (e.g., letter grades, percentile
scores, number of solved items, etc.). Descriptive feedback, on the other hand, conveys
information about how one performs the task (not necessarily how well) and details possible ways
to overcome difficulties with a task and improve performance (Linn & Miller, 2005).
Researchers have proposed alternative typologies of feedback. Bangert-Drowns et al.
(1991) suggested that feedback types could be differentiated into error correction, presentation of
prototypic responses, display of the consequences of responses, and explanation of the
appropriateness of responses. Tunstall and Gipps (1996) proposed a more complex categorization
of feedback, breaking it into two broad categories of feedback as socialization and feedback as
assessment. These categories were further organized according to the specific function that a
2

feedback message served. The functions included rewarding/punishing, approving/disapproving,
specifying improvements, constructing achievement, and constructing the way forward.
Hattie and Timperley (2007) took a different approach and developed a model that
differentiated feedback into four levels. The first level was referred to as the task level and included
feedback about how well a task was being performed. Corrective feedback and references to
neatness and other aspects of the task accomplishment were among the most common types of the
task level feedback. The second level, the process level, involved feedback about the processes
underlying the tasks. This more complex type of feedback related to students’ strategies for error
detection and increased cue searching and task processing that led to improved understanding. The
self-regulation level followed the process level and was geared toward promoting students’ self-
monitoring, directing, and regulating of actions. Finally, the self level included personal evaluations
and affective reactions about the learner’s personality. The process and self-regulation levels of
feedback were believed to be best suited for promoting individuals’ improvement, with the self level
being the least effective (Hattie & Timperley, 2007).
Meta-Analytic Studies Effects of Feedback
Several extensive reviews of the literature shed light on the extent of the impact of
feedback on students’ learning. In their analysis of existing studies, Kluger and DeNisi (1996)
presented a historical overview of research and showed that very often the effect of feedback on
students’ learning was judged as unilaterally positive and that evidence contradictory to this
assumption was either ignored or deemed to be invalid due to potential study limitations. They
contended that flawed methodologies, unwarranted generalizations, and empirical inconsistencies
of these investigations resulted in a skewed representation of feedback effects on performance,
underestimating the complexity of the relationship.
The researchers’ meta-analysis (607 effect sizes; 23,663 observations) demonstrated that
feedback typically improved performance (d =.41), but in one third of cases, presentation of
feedback resulted in decreased performance. The results of moderator analysis showed (a) that
feedback effectiveness decreased when individuals received information containing praise or
critical judgments that were hypothesized to move students’ attention away from the task; (b) that
correct solution feedback, as opposed to dichotomous judgments of correct/incorrect outcome, led
to more effective learning; and (c) that effects of feedback on performance on physical tasks were
lower than effects of feedback on cognitive tasks.
3

Similarly, the instructional effect of feedback on tests was also the subject of a meta-
analysis (Bangert-Drowns et al., 1991). The researchers found that feedback that included any type
of elaborated information was consistently more helpful than feedback that informed learners
whether their responses were correct or incorrect. Like Kluger and DeNisi (1996), Bangert-
Drowns et al. revealed the variability of feedback effects on performance. The researchers
attempted to isolate variables that accounted for the variance in research findings. They found that
providing feedback in the form of answers to review questions was effective only when students
could not look ahead to the answers before they had attempted the questions themselves, what
Bangert-Drowns et al. called “controlling for pre-search availability” (p. 218). Controlling for the
type of feedback (correct/incorrect versus detailed) and pre-search availability eliminated almost
all of the found negative effect sizes, yielding a mean effect size across 30 studies of 0.58. Two
other variables contributed to explaining variance in effect sizes. First, the use of pretests lowered
effect sizes, possibly by giving learners practice in the material to be covered or advanced
organizers for learning. Second, the type of instruction moderated the effectiveness of feedback,
with programmed instruction and simple completion assessment items associated with the smallest
effects. Overall, Bangert-Drowns et al. concluded that the key feature in effective use of feedback
was that it must encourage mindfulness in students’ responses to the feedback.
Grading
The most common type of feedback that students receive in a typical classroom is grades,
more often than not a letter grade or a numeric score by itself (Marzano, 2000; Oosterhof, 2001).
Grades provide a convenient summary of students’ performance and inform all interested parties of
students’ achievement. The versatility of the uses of grades is emphasized by many measurement
experts (Airasian, 1994; Marzano, 2000; Nitko & Brookhart, 2007). Airasian listed five main
functions that grades serve:
1. administrative, by dealing with decisions concerning matriculation, retention, and
entrance into college
2. guidance, by helping counselors provide direction to students
3. instructional planning, by informing teachers about students’ level of attainment in
order to group them for instruction
4. feedback, to provide students with information about their progress and achievement
4

5. motivation, to encourage students to try harder
If we turn to the previously discussed summative/formative dichotomy of assessment, it is
clear that Functions 1 through 3 of Airasian’s (1994) list are summative in nature, whereas 4 and 5
are formative. In the former case, grades were used to inform third parties about students’ level of
attainment to provide grounds for making critical educational decisions. In the latter case, grades
were provided to students themselves and were assumed to facilitate students’ learning by
influencing their motivation and performance. Although it is hard to disagree with the convenience
and effectiveness of grades when used for summative purposes, the formative function of grades as
tools that lead to progress in learning has long been disputed.
One of the main conclusions Black and Wiliam (1998) drew from their review of literature
on formative assessment was that descriptive feedback, rather than letter grades or scores, led to
the highest improvements in performance. Moreover, evidence from several studies that
investigated the effect of differential feedback on learning suggested that using grades to improve
learning was simply not effective. For example, Butler and Nisan (1986) compared effects of
constructive feedback and grades. The researchers concluded that grades emphasized quantitative
aspects of learning, depressed creativity, fostered fear of failure, and weakened students’ interest.
Quite opposite to this pattern, no negative consequences followed from the use of task-specific
individualized comments. In a later study, Butler (1988) found that the group that received
comments specifically tailored to students’ performance showed a significant increase in scores
(by almost 30%) on a task. The group that received only grades showed a significant decline in
scores, as did the group that received both grades and comments. Analysis of students’ reports of
interest in performing the task demonstrated a similar pattern, with interest being undermined for
both graded conditions. Interestingly, high achievers in all three feedback regimes sustained a high
level of interest, whereas low achievers in the graded groups evidenced dramatic declines (Butler,
1988).
Similarly, Elawar and Corno (1985) investigated the effect of teachers’ written feedback
provided to students’ homework. The researchers found a large effect associated with the feedback
treatment, which accounted for 24% of the variance in final achievement. Students who received
comments performed significantly better then those who received grades. The latter led to
inhibition of students’ performance.
5

Several studies investigating the impact of grades on students’ learning presented evidence
in agreement with Butler’s (1988; Butler & Nisan, 1986) and Elawar and Corno’s (1985) findings.
For example, in an experiment conducted by Grolnick and Ryan (1987), students who were told
they would be graded on how well they learned a social studies lesson had more trouble
understanding the main point of the text than did students who were told that no grades would be
involved. Even on a measure of rote recall, the graded group remembered fewer facts a week later.
Another study presented the evidence that students who tended to think about the material they
study in terms of what they would need to know for a grade were less knowledgeable than their
counterparts (Anderman & Johnston, 1998).
The explanations of negative effects of grades on students’ performance vary. Butler and
Nisan (1986) and Butler (1988) proposed that normative grades informed students about
proficiency relative to others, whereas individualized comments created clear standards for self-
evaluation specific for the task. The researchers discussed these results in terms of cognitive
evaluation theory and posited that even if feedback comments were helpful for students’ work,
their effect could be undermined by the negative motivational effects of the normative feedback,
that was, by giving grades and scores (Butler, 1988).
In addition to the motivational explanations, the negative impact of grades on students’
performance can be explained by feedback intervention theory (Kluger & DeNisi, 1996). This
theory suggested that the optimal feedback should direct individuals’ attention to the details of a
specific task and to learning methods that would help achieve desired results. Based on this logic,
letter grades and numerical scores would tend to channel students’ attention to the self and away
from the task, thus leading to negative effects on performance (Siero & Van Oudenhoven, 1995;
Szalma, 2006; Szalma, Hancock, Warm, Dember, & Parsons, in press).
Elawar and Corno (1985) looked at their findings through the lens of cognitive theory and
research, which emphasized the importance of deep processing when acquiring complex
information. Comments provided by teachers turned students’ attention to relevant, specific
information, stimulated mental elaboration, and as a result, boosted performance. Grades,
perceived as reinforcers and punishers, which were believed to be controlling and lacking
specificity, led to inhibition of students’ cognitive processes and slower progress of learning.
The argument that grades are detrimental to students’ performance is commonly heard, but
it is not the only one in the field of assessment. In an attempt to refute a commonly voiced urge to
6

abolish grades, Marzano (2000) stated that the most important purpose for grades was to provide
feedback to students, and if referencing for grading was content specific, letter grades and
numerical scores would lead to an increase in students’ performance. He postulated that if students
had a clear understanding of the requirements of the task and if grading was based on students’
achievement and effort only, students could increase their level of knowledge and understanding
based on grades alone.
Guskey and Bailey (2001) took a similar stance on the issue of grades. They suggested that
if grading was done properly, an increase in students’ academic attainment would follow. To back
up their argument, the authors described a study conducted by Page (1958). In his study, Page had
school teachers provide feedback of three kinds: a numerical score and a corresponding grade,
standard comments and a grade, and detailed comments and a grade. The analysis showed that
students who received detailed comments in addition to a numerical score and a grade
outperformed the other two groups. Additionally, students who received a grade followed by
standard comments performed significantly better than students in the grade-only group. Based on
these results, Page concluded that grades could be effective for promoting students’ learning when
accompanied by a comment. This study may be cited to demonstrate that grading can be used quite
effectively to enhance students’ academic achievement; however, the reader should keep in mind
that this sole study was conducted half a century ago and had quite significant methodological
flaws.
Overall, the review of the studies on grading is not supportive of its use in facilitating
learning. Very little recent research has inquired into the effects of grades alone or in combination
with other types of feedback on students’ performance.
Praise
Praise has been defined as “favorable interpersonal feedback” (Baumeister, Hutton, &
Cairns, 1990, p. 131) or “positive evaluations made by a person of another’s products,
performances, or attributes” (Kanouse, Gumpert, & Canavan-Gumpert, 1981, p. 98). This type of
feedback is probably the second most common kind (with the first being grades) that students
receive from their teachers, and it runs the gamut from simple “You did a great job!” statements to
much more elaborate and personalized positive references to students’ performance. Generally,
praise is believed to have beneficial effects on students’ self-esteem, motivation, and performance.
As a result, teachers are encouraged to use praise as a reinforcer of a desired behavior (Dev, 1997).
7
However, similar to the research on grading, the conclusions concerning the impact of praise on
students’ performance are not consistent.
Researchers and educators hold two opposing views on the effect of praise on students’
learning. One camp of researchers and educators claims that normally a feedback message
containing praise enhance motivation and leads to improvement in individuals’ performance
(Cameron & Pierce, 1994; Dev, 1997; Pintrich & Schunk, 2002). Shanab, Peterson, Dargahi, and
Deroian (1981) investigated the influence of praise on motivation, operationalized through interest
and persistence. They found that praise during a puzzle-solving task led undergraduates to spend
more time on the task and to rate their interest as higher than that of participants in a control
condition who received neutral feedback. Similarly, meta-analytic studies examining the effects of
praise on motivation have shown that positive statements have a tendency to increase intrinsic
motivation across a variety of dependent measures (Cameron & Pierce, 1994; Deci, Koestner, &
Ryan, 1999). This effect, however, is not always strong, varies for different age groups, and often
has been derived in the course of methodologically flawed studies (Henderlong & Lepper, 2002;
Lepper, Henderlong, & Gingras, 1999).
The researchers who emphasize the positive role of praise for students’ learning refer to a
number of theoretical mechanisms to explain their results. One commonly discussed variable,
which is believed to mediate the effect of praise, is self-efficacy, defined as the belief that one has
the capabilities to execute the courses of actions required to achieve desired outcomes (Bandura,
1997; Bandura & Locke, 2003). Drawing upon a long line of research, Bandura (1986, 1997)
proposed that individuals’ self-efficacy is strongest when it arises from their own achievement, but
persuasion can be effective in convincing individuals that they have the ability to succeed. So, in
this circular process, praise can be used to make students believe that they can succeed, which
should, in turn, enhances self-perceptions of efficacy and lead to greater academic attainment.
Feedback containing praise may also be effective because it elicits a positive affective
reaction, which often has been linked to increased motivation and higher goals (Delin &
Baumeister, 1994; Ilies & Judge, 2005). This mediating role of affect in influencing individuals’
behavior can be explained with Gray’s behavioral motivation theory (Gray, 1990). Gray suggested
that two distinct systems regulate motivation. The first is the behavioral activation system (BAS),
whichis believed to regulate appetitive motivation and is activated by stimuli signaling rewards (or
relief from punishment). The second is the behavioral inhibition system (BIS), which regulates
8

aversive motivation and is activated by stimuli signaling punishment (Gray, 1990). The experience
of positive emotions and moods was believed to be regulated by BAS, whereas BIS controls
regulation of negative emotions and moods.
Gray (1990) proposed that stimuli from the environment influences people’s affective
states and that resulting affective states reinforces behavioral motivation. For example, because
positive affect, which often follows praise, has an energetic arousal component, it should increase
individuals’ optimism concerning performance and thus causean increase in effort and persistence.
Drawing upon Gray’s theory, Ilies and Judge (2005) proposed that favorable feedback cues would
directly lead to positive affect, which is associated with BAS activation, so individuals will engage
in approach behaviors and set higher goals as a result. Ilies and Judge conducted a series of
experiments that demonstrated that basic affective reactions to feedback are important mechanisms
that explain the relationship between feedback and future goals.
Another explanation of the positive effect of praise on behavior was proposed by
Henderlong and Lepper (2002). They posited that children may continue to exhibit praised
behavior to sustain the attention and approval of the evaluator because of the positive interpersonal
dynamic that typically characterizes occurrences of praise. They noted, however, that motivational
benefits may be purely extrinsic and quite transient, dissipating as soon as the evaluator is no
longer present (Henderlong & Lepper, 2002).
Finally, the mechanism through which praise is believed to influence learning is often
borrowed from the behaviorist literature. Behavior modification programs are developed that
emphasize the systematic and contingent use of praise over time for the purpose of reducing
classroom behavior problems and encouraging students to learn. Studies in the behavioral tradition
have shownthat praise can be a successful technique for influencing a broad range of students’
classroom behaviors (Alber & Heward, 1997, 2000; O’Leary & O’Leary, 1977). However, studies
that employ behavior modification techniques seem to have a common weakness that causes
problems in interpreting the independent effects of praise: Despite the fact that they demonstrate
the success of positively stated feedback, praise is almost never isolated as a single variable. As
Henderlong and Lepper (2002) noted, the effect of praise in such studiesis often confounded with
numerous contextual variables and therefore should be judged with care.
Evidence of a direct or mediated positive influence of praise on motivation and
performance is abundant but not without flaws. It is apparent that many plausible mechanisms may
9

potentially account for such effects, but these mechanisms should be subjected to more careful
examination. There are also examples of the negative impact of praise on students’ learning. A
good starting point might be Baumeister’s et al. (1990) study, which presented evidence that praise
can both impede and facilitate individuals’ performance. The analyses showed that positively
framed feedback improved students’ performance on a pure effort task but consistently led to
impairment in skilled performance. Additionally, the researchers found that both task-relevant and
task-irrelevant praise resulted in performance decrements. When discussing these results, the
authors quite humorously noted that “an effective way to disrupt skilled performance is to
compliment the performer immediately beforehand” (Baumeister et al., 1990, p. 145).
On a more serious note, Baumeister et al. (1990) proposed three possible mechanisms by
which praise could impede successful task completion. The most logical and parsimonious
explanation (as deemed by the authors) is that praise made individuals self-conscious and led to
disruption of skilled performance. Apparently, attention to the self, resulting from praise, robs
cognitive resources that would otherwise be committed to the task. Only if a task is automated and
fewer resources are needed for its completion will praise have a neutral or positive effect on
performance. Therefore, the assumption that praise focuses attention on self, and not the task,
seems to be the most plausible explanation of the negative effect of praise on performance. It is
also in accord with the tenets of feedback intervention theory proposed by Kluger and DeNisi
(1996).
Additional evidence of the negative effect of directing students toward the self rather than
the task comes from a study carried out by Butler (1987). One of the researcher’s findings was that
students in the praise condition had the highest perceptions of success, even though they had been
significantly less successful than the comments-receiving group.
In sum, ample evidence provides support for claims at both ends of the praise spectrum.
However, this evidence is inconclusive, and new studies that carefully examine the effect of
positively framed feedback would make a valuable contribution to the field.
Source of Feedback
The typology of feedback provided elsewhere includes a dichotomy of direct versus
mediated feedback. Computer-assisted instruction, use of hypermedia, and sophisticated learning
environments are a regular part of modern instructional practices. One of the main functions of
many of these complex educational technology systems is to provide students with feedback about
10

their performance. If the effect of teacher-provided feedback seems to be unclear, the impact of
computer-provided feedback is even more obscure.
Researchers investigating the nature of human–computer interaction in instruction can be
divided into two groups. The first group believed that people tend to view computers as neutral
tools that bypass issues of attitude, affect, and stereotypes characteristic of human interactions.
These scholars posited that computer-provided feedback would elicit individual reaction that was
different from the one following human-provided feedback (Lajoie & Derry, 1993; Lepper,
Woolverton, Mumme, & Gurtner, 1993). Furthermore, researchers in this paradigm stated that
users and learners would tend to be skeptical toward computer-provided personal comments and
would find computer responses such as praise, criticism, and helping behavior implausible and
unacceptable (Lepper et al., 1993).
The other group took a different stance on the matter. These researchers described
themselves as functioning within the Computers as Social Actors (CASA) paradigm and argued
that people may be unconsciously perceiving computers and other media as being intentional
social agents (Nass, Moon, & Carney, 1999). Some studies showed that people often attributed
human characteristics to computers: People were polite to machines (Nass et al., 1999), perceived
machines as competent teammates (Nass, Fogg, & Moon, 1996), ascribed gender and personalities
to machines (Nass, Moon, & Green, 1997), and got angry and punished them (Ferdig & Mishra,
2004). Responding socially to a computer was also quite common and typical for people of all ages
and levels of expertise (Mishra, 2006). People were found to talk to computers even though they
explicitly denied believing that computers had feelings or intentionality (Reeves & Nass, 1996).
Therefore, the supporters of the CASA framework would have proposes that human- and
computer-provided feedback would have had the same or very similar effect on individuals.
Studies that examined the impact of computer-provided versus human-provided feedback
are few and far between and were mostly conducted in the stream of organizational psychology
research. Earley (1988) inquired into a contrast between computerized feedback and feedback
provided by the supervisor in a subscription-processing job. The results showed that computerized
feedback was more trusted and led to stronger feelings of self-efficacy, to more strategy
development, and to better performance compared with identical feedback coming from a
supervisor. These findings seem to support the argument of those researchers who believed that
computers are perceived by individuals as neutral tools and, consequently, unbiased sources of
11
information. Because machines do not elicit affective responses from individuals, cognitive
resources get directed toward tasks resulting in an increase in performance. The results can also be
explained with feedback intervention theory (Kluger & DeNisi, 1996). Feedback provided by the
supervisor could have directed participants’ attention to meta-task processes, such as evaluating
the intentions of the supervisor and their implications for goals of the self, whereas the
computerized feedback directed attention to the task and to the task details.
A more recent study was conducted by Mishra (2006), who investigated the effects of
feedback provided by computer. Analysis of the results showed that computer-provided feedback
made a significant difference in the participants’ motivation and affect. Praise provided by the
computer had a uniform positive impact on participants’ motivation and affect, therefore providing
support for the CASA paradigm. Mishra’s study provided initial answers to questions concerning
individuals’ reaction to computer-provided feedback. It showed that students formed affective
reactions toward feedback provided by the machine, but the nature of the differences between their
reactions to computer-provided feedback and their reactions toward human-provided feedback
remained unclear.
Rationale and Aims
The review of the assessment issues presented here leads to a number of conclusions that
can be drawn as well as a number of issues that need substantially more research and theoretical
development. It seems clear that detailed personal feedback is generally effective in facilitating
achievement, and the mechanisms through which such growth occurs are beginning to be
understood. The effects of grades in assessment appear to be negative, although this conclusion is
not universally shared in the field. The effects of praise are less clear than those of grades, with
findings and logic on both sides of the fence. Another question that arises concerns how students
will respond if they get their feedback from an instructor or from a computer program. Very little
research speaks to this issue in assessment. Finally, a number of the explanations that are posited
for how assessment feedback influences achievement invoke affective variables such as
motivation, self-efficacy, and mood as part of the process.
This review leads us to propose the following research questions for the current
investigation:
1. How much improvement in performance is associated with detailed feedback on an
essay examination?
12

2. Does the perceived source of feedback influence students’ responses?
3. What are the effects of praise and grade on students’ responses to feedback?
4. Do these effects operate in similar fashions for students of different performance
levels?
5. How does differential feedback influence motivation, self-efficacy, mood, and
perceptions of the accuracy and helpfulness of the feedback?
Method
The present study used a randomized design within the context of an actual college course.
The dependent measure was an authentic learning task with students working on an essay exam
and then revising it based on feedback. The exam was a part of a course requirement and therefore
expected to be taken seriously by the participants. There were three experimental conditions, with
some students not receiving detailed feedback on their performance, other students receiving
detailed feedback with an understanding that their feedback came from the course instructor, and a
third group of students believing that their feedback was computer generated. Additionally, the
three conditions were crossed with two factors of grade (grade or no grade) and praise (praise or no
praise), resulting in a 3 x 2 x 2 design.
Participants
Participants for the experiment were students at two northeastern universities who were
enrolled in introduction to psychology courses taught by the same instructor. One of the graded
course assignments involved writing an essay on a relevant topic. Informed consent was obtained
to use students’ written answers for research purposes and to administer a series of questionnaires.
Students who allowed the use of their response for research and completed several self-report
questionnaires satisfied their general psychology research requirement. The sample size for the
experiment was 464 students, with 409 students attending University 1 and 55 students attending
University 2. Separate analyses were run for the two samples to compare the distributions of key
variables included in the current study; these variables were distributed in a similar fashion for
both samples, with nearly identical means and standard deviations. Therefore, the decision was
made to merge the samples together.
13
The participants ranged in age from 17 to 51, with a mean age of 18.9, and a standard
deviation of 2.5. Two hundred and forty one participants (51.9%) were women and 223 (48.1%)
were men. The majority of the participants identified themselves as White (54.7%); 24.6% were
Asian, 6.9% Hispanic, 3.9% Black, and 6.0% other; and 3.4% chose not to respond. Of the 464
participants, 382 (82.3%) were born in the United States, and 82 (17.7%) were not. Students also
provided information about their native language. Three hundred and seventy one students (80%)
reported to be English-speakers; 93 (20%) were native speakers of a language other than English.
Instrumentation
Performance task. As a part of course requirements, students were asked to write a 500-
word expository essay demonstrating their understanding of theories of motivation that were part
of their readings and class discussions. The prompt for this assignment was a modification of an
ETS topic (ETS, 2006) that incorporated a reference to theories of motivation and was deemed
appropriate for first-year students. This prompt was as follows:
Sometimes we choose to do things that we do not really enjoy—studying hard, eating the
right foods, and so on. Describe something you do by choice that you really do not enjoy.
Using theories of motivation, explain why you might continue to do it. Discuss the changes
that might occur in your life if you were to stop this activity. Support your claims with
specific examples from your life and the course reading.
Students were presented with an extensive rubric describing the criteria for evaluation. The
rubric was available during the task and could be consulted at any point in the writing process. In
order to make sure that students wrote essays of comparable length, an indicator displayed a real-
time word count. The detailed description of the scoring procedures is presented in the following
sections.
Test motivation measure. The Posttest Index of Test Motivation (Wolf & Smith, 1995) was
used to test how motivated students were to do well on the task in question. The scale consisted of
eight 7-point Likert-type items bounded by “strongly disagree” and “strongly agree.” A sample
item typical of the measure was “Doing well on this exam was important to me.” High scores on
the scale indicated that students had a strong desire to do well on the exam they just took and
exerted all the necessary effort to ensure success. Lower scores suggested a lack of interest in the
process or the outcome of the exam. Reliability coefficients reported in the literature were .89
14

(Spencer, 2005) and .87 (Wolf, Smith, & Birnbaum, 1995), which were similar to the α = .85
found in the present study.
Test self-efficacy measure. The Posttest Self-Efficacy Scale consisted of eight Likert-type
items (Spencer, 2005). The answers were based on a 7-point response scale ranging from (1)
“strongly disagree” to (7) “strongly agree.” A sample item typical of the measure was “I am not
competent enough to have done well on this exam” (reversed). This measure assessed students’
judgment of their own capabilities for the task they had completed. Higher scores on the measure
indicated students’ confidence in their performance on the test; lower scores suggested doubt in
their ability to have done well on the task in question. The reported alpha coefficient of the
instrument was .86 (Spencer, 2005), identical to α = .86 found in the present inquiry.
Measure of affect. The Positive and Negative Affect Scale (PANAS) is a 20-item self-
report measure of positive and negative affect (Watson, Clark, & Tellegen, 1988). In the present
study, the scale was accompanied with instructions for measuring students’ current affective state.
The participants were asked to indicate the extent to which they experienced the affective states
described by the PANAS adjectives on a 5-point scale ranging from “slightly/not at all” to
“extremely.” In this study, two additive indices were computed, resulting in separate positive
affect and negative affect scores for each participant. The reported alpha coefficients of the
positive affect scale ranged from .86 to .95; the negative affect scale from .84 to .92 (Crawford &
Henry, 2004; Ilies & Judge, 2005; Jolly, Dyck, Kramer, & Wherry, 1994; Roesch, 1998). We
obtained alpha coefficients of .89 and .86, respectively.
Demographic data. A short demographic questionnaire was administered to the research
participants for the purposes of sample description. The participants were asked to report their age,
gender, race, native language, and country of origin. The list of instruments administered and time
of their administration are presented in Table 1.
Procedures
The experiment involved computer administration and was conducted in two sessions
separated by one week. A custom data collection program and an interactive Web site had been
created to satisfy specific requirements of this study.
First session. All students enrolled in the two introductory psychology courses were
scheduled to come to a computer lab to take their exam. All students logged into the dedicated
15

Web site and were assigned a unique code derived from their names. Students who chose not to
participate in the research study immediately began to work on the exam.
Table 1
Instrumentation and Time of Administration
Instrument Measures Time of administration I Demographic
questionnaire (7 items)
First session of the experiment; before students begin the exam
II Essay exam First session III Positive affect and
negative affect scale (18 adjectives)
Second session; after feedback was presented but before students began revising
IV Posttest Index of Test Motivation (8 items)
Second session; after the revised essay was submitted
V Posttest Self-Efficacy Scale (8 items)
Second session; after the revised essay was submitted
VI Accuracy of feedback (1 question)
Second session; after the revised essay was submitted
VII Helpfulness of feedback (1 question)
Second session; after the revised essay was submitted
For the main task of the experiment, students were presented with the instructions and the
grading rubric, and were then asked to begin their essay. Students submitted their work, which was
saved in the system, and were then thanked for their performance and reminded to come back to
the computer lab in one week for the second part of the study. The layout of the essay-writing
screen is presented in Figure 1.
Figure 1. Layout of the essay-writing screen during the first session.
16
Second session. The participants were asked to return to the computer lab in one week.
They logged into the system and were shown their graded essay with its corresponding feedback.
Prior to moving to the essay revision screen, students were asked to fill out the PANAS. The
participants were then prompted to make revisions and resubmit their essay based on the feedback
they received. Students could refer to the grading rubric and to their feedback comments at any
point of the session by hovering their mouse over hotspots in the feedback text.
Students who did not receive detailed feedback were encouraged to reread their essays,
consult the rubric, and work on improving their work. After the participants submitted their revised
essays, they were asked to make a judgment concerning the accuracy and helpfulness of the
feedback. They were also asked to complete the Posttest Index of Test Motivation and the Posttest
Self-Efficacy scale.
Scoring
ETS allowed the use of their proprietary software package e-rater® for this study. E-rater
extracts linguistically based features from an essay and uses a statistical model of how these
features are related to overall writing quality in order to assign a holistic score to the essay.
Additionally, it assesses and provides feedback for errors in grammar, usage, and mechanics;
identifies the essay’s structure; recognizes undesirable stylistic features; and provides diagnostic
annotations within each essay (Attali, 2004).
Several requirements for the administration of the experiment necessitated the development
of a custom Web site and software program to interface with e-rater. Those included the
nonstandard nature of the task, repeated log-ins by the same participant at different points in time,
differential feedback, collection of latency measures, and the combination of feedback from the
computer (supplied by the software) and humans (course instructor and experimenter). The Web
site interacted with e-rater directly. Access to the Web site was restricted to study administrators,
course instructors, and participants.
The total exam score presented to the students comprised two separate components: the e-
rater score (ranging from 0 to 6) and the content score provided by the instructor and the
experimenter (ranging from 0 to 6, including half points). The final score was calculated as a
weighted average of the two scores and converted to a scale of 100. The e-rater score contributed
30% to the total score; the content score contributed 70% to the total score.
17

E-rater was customized to rate the essays written on the prompt selected for the present
study. Students’ essays were scored on all of the aforementioned characteristics including
mechanics, grammar, spelling, and stylistic features, and a holistic score was assigned to every
student. For several experimental conditions, the feedback provided by e-rater was modified to
satisfy the requirements of specific feedback conditions described below. A portion of the detailed
feedback screen is presented in Figure 2.
Figure 2. Detailed feedback screen with a pop-up message for a specific feedback item.
Additionally, two raters (the course instructor and the experimenter) ensured that the
content was covered properly. Prior to scoring the main experiment, a series of calibration sessions
were held to ensure inter-rater reliability between the two raters. We developed a detailed rubric
that provided criteria for evaluating the content of students’ essays (see Appendix A). The inter-
rater reliability was .96 for the first session exam score and .98 for the final exam score. In case of
a discrepancy in ratings, the average of the two raters’ scores was taken. No differences in ratings
were larger than one point, which is indicative of the high level of calibration between the two
raters. The instructor and the experimenter were blind to the students’ identities. To provide
feedback on the content of students’ essays, several standard comments were written. These
comments were slightly modified depending on the experimental condition, so that some
comments sounded as if they came from a computer and others from the professor.
After the initial essays were scored, blocking was used to assign participants to three
experimental conditions so that the resulting groups had equivalent numbers of students with high,
medium, and low scores.
Each student was assigned to one of the three feedback conditions:
1. No feedback condition. This group received no detailed feedback.
18

2. Instructor-feedback condition. This group received a combination of the e-rater–
generated feedback regarding mechanics and style, and content-related comments and
suggestions, with the understanding that all the comments were generated by the course
instructor. All comments were written in a reserved and neutral fashion, but in a way
that was clear that they came from a person rather than a computer. Also, students were
addressed by their first name. To make sure that the source of feedback was clear to the
participants, a clip-art picture of a typical college professor was displayed in the corner
of every exam screen and the following instructions were provided:
During this session, you will be able to edit and improve the essay you wrote the first time
based on detailed feedback I have given you on content, grammar, punctuation, spelling,
sentence structure, and the overall quality of your essay. Please read my comments
carefully and do your best to use them — it should really help you get a better score.
3. Computer-feedback condition. Students in this group received feedback equivalent to
that in the previous condition with the understanding that all the comments were
generated by the computer. The following instructions were provided:
During this session, you will be able to edit and improve the essay you wrote the first time
based on detailed feedback generated by an intelligent computer system designed to read
and critique essays. The computer will give you feedback on content, grammar,
punctuation, spelling, sentence structure, and the overall quality of your essay. Please read
the computer's comments carefully and do your best to use them — it should really help
you get a better score.
A picture of the computer was displayed on every screen. The e-rater comments were taken
in their original form, and the additional comments concerning the content and adequacy of the use
of course-related constructs matched the style of the computer comments and were impersonal and
neutral. Students were not referred to by their first names. A comparative table of the comments
received by students in the computer and instructor conditions is presented in Table 2.
Additionally, the three conditions were crossed with two factors of grade (grade/no grade)
and praise (praise/no praise) resulting in a 3 x 2 x 2 experimental design. The groups formed by the
factor crossings are presented in Table 3.
19

Table 2
Comparison of Comments Received by Students in the Instructor and Computer Conditions
Type of comment
Instructor Computer
Name, please break your essay into paragraphs so I can see the structure.
Mechanics Please break your essay into paragraphs so that the structure can be detected.
Name, this sentence is a fragment. Proofread the sentence to be sure that it has correct punctuation and that it has an independent clause with a complete subject and predicate.
This sentence may be a fragment. Proofread the sentence to be sure that it has correct punctuation and that it has an independent clause with a complete subject and predicate.
Name, these sentences begin with coordinating conjunctions. Try to combine the sentence that begins with but with the sentence that comes before it.
These sentences begin with coordinating conjunctions. A sentence that begins with and, but, and or can sometimes be combined with the sentence that comes before it.
Name, a good essay usually contains three main ideas, each developed in a paragraph. Use examples, explanations, and details to support and extend your main ideas. Try to center them around the theories of motivation I discussed in class. Include details and theory-specific terminology.
Content A good essay usually contains three main ideas, each developed in a paragraph. Use examples, explanations, and details to support and extend your main ideas. Center them around the theories of motivation. Include details and theory-specific terminology.
Name, please discuss all of the components of the Drive reduction theory: need, drive, action, and homeostasis. You are missing two of the components.
You may need to discuss all of the components of the Drive reduction theory: need, drive, action, and homeostasis.
Name, discuss all of the components of Atkinson’s theory: expectancy, value, and the need for achievement. You are missing one of the components.
Discuss all of the components of Atkinson’s theory: expectancy, value, and the need for achievement. You may be missing some of the components.
20
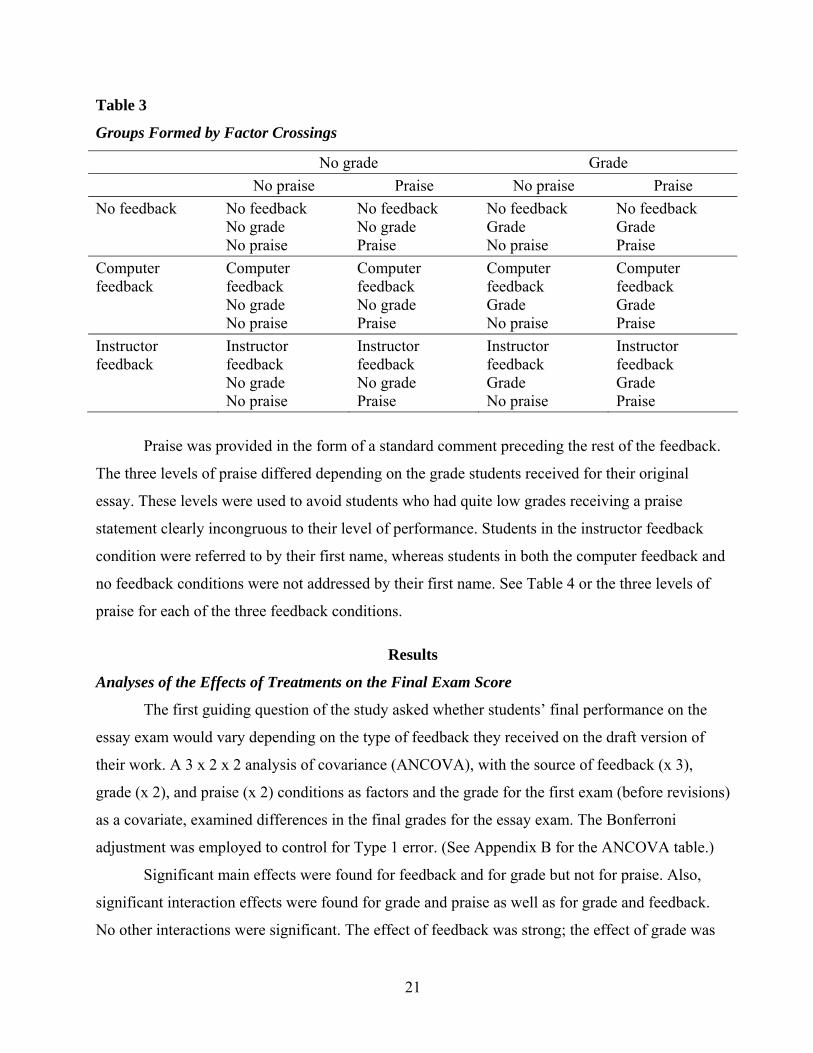
Table 3
Groups Formed by Factor Crossings
No grade Grade No praise Praise No praise Praise
No feedback No feedback No feedback No feedback No feedback No grade No grade Grade Grade No praise Praise No praise Praise
Computer feedback
Computer feedback
Computer feedback
Computer feedback
Computer feedback
No grade No grade Grade Grade No praise Praise No praise Praise
Instructor feedback
Instructor feedback
Instructor feedback
Instructor feedback
Instructor feedback
No grade No grade Grade Grade No praise Praise No praise Praise
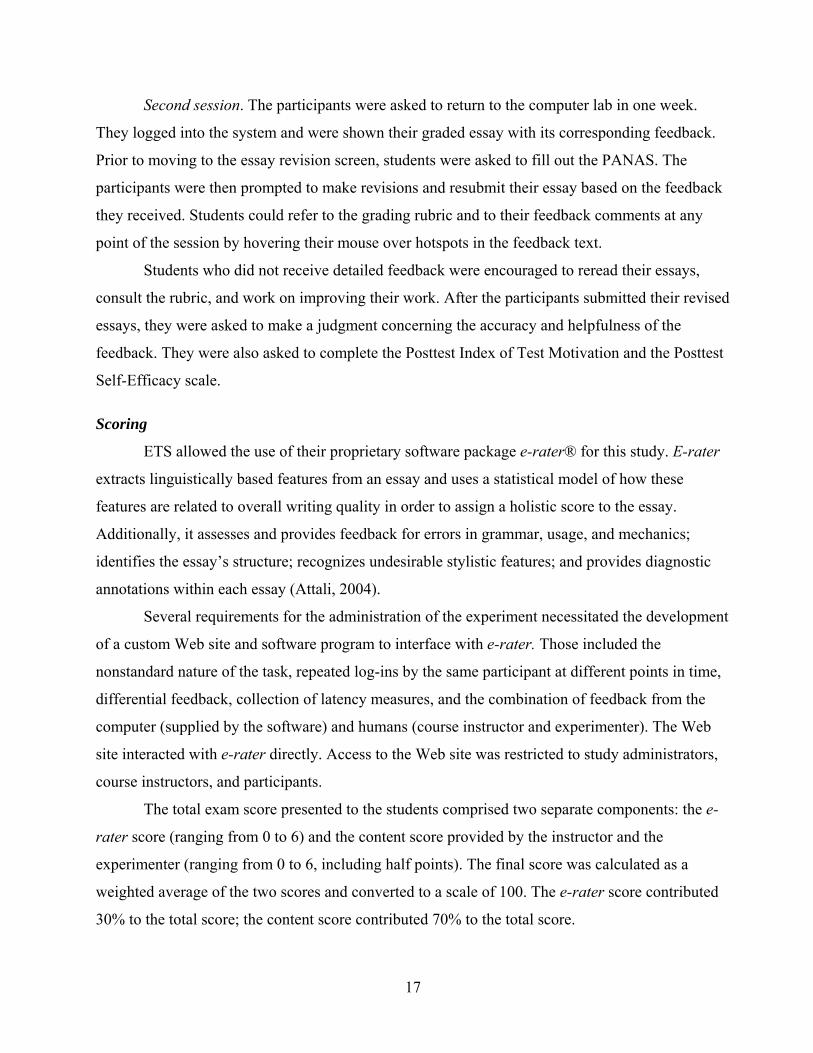
Praise was provided in the form of a standard comment preceding the rest of the feedback.
The three levels of praise differed depending on the grade students received for their original
essay. These levels were used to avoid students who had quite low grades receiving a praise
statement clearly incongruous to their level of performance. Students in the instructor feedback
condition were referred to by their first name, whereas students in both the computer feedback and
no feedback conditions were not addressed by their first name. See Table 4 or the three levels of
praise for each of the three feedback conditions.
Results
Analyses of the Effects of Treatments on the Final Exam Score
The first guiding question of the study asked whether students’ final performance on the
essay exam would vary depending on the type of feedback they received on the draft version of
their work. A 3 x 2 x 2 analysis of covariance (ANCOVA), with the source of feedback (x 3),
grade (x 2), and praise (x 2) conditions as factors and the grade for the first exam (before revisions)
as a covariate, examined differences in the final grades for the essay exam. The Bonferroni
adjustment was employed to control for Type 1 error. (See Appendix B for the ANCOVA table.)
Significant main effects were found for feedback and for grade but not for praise. Also,
significant interaction effects were found for grade and praise as well as for grade and feedback.
No other interactions were significant. The effect of feedback was strong; the effect of grade was
21

moderate and needs to be examined in light of the two small but significant interactions involving
grade. We examine the main effect of feedback first and then the intriguing combination of effects
involving presentation of grades.
Table 4
Levels of Praise for the Instructor, Computer, and No-Feedback Conditions
Exam score
Instructor feedback Computer feedback No feedback
80 to 100 Name, you made an excellent start with this essay! I still see room for improvement, so take some time and make it really great.
You made an excellent start with this essay. The data indicate there is still room for improvement, so take some time to make it better.
You made an excellent start with this essay! There is still room for improvement, so take some time and make it really great.
70 to 79 Name, you made a very good start with this essay! I still see room for improvement, so take some time and make it really great.
You made a very good start with this essay. The data indicate there is still room for improvement, so take some time to make it better.
You made a very good start with this essay! There is still room for improvement, so take some time and make it really great.
69 and below
Name, you made a good start with this essay! I still see room for improvement, so take some time and make it really great.
You made a good start with this essay. The data indicate there is still room for improvement, so take some time to make it better.
You made a good start with this essay! There is still room for improvement, so take some time and make it really great.
There was a strong significant main effect of feedback on students’ final grade,
F (2, 450) = 69.23, p < .001, η2 = .24. Post hoc analyses show that students who did not receive
detailed feedback obtained substantially lower final exam scores than those who received detailed
feedback from either the computer or the instructor and that there were no differences in students’
performance between computer and instructor conditions. Differences between the no-feedback
condition and the two feedback conditions showed effect sizes of between about 0.30 to 1.25
depending on the presence of grade and praise.
There was also a significant difference in the final exam score between students in the
grade condition and those in the no-grade condition, F (1, 450) = 4.07, p < .05, η2 = .04. Students
who were shown the grade they received for their first draft performed less well on the final
22
version than those who were not shown their grade. This effect needs to be viewed, however, in
the context of two significant interaction terms involving grade.
The analysis revealed a significant disordinal interaction between grade and praise, F (1,
450) = 6.00, p < .05, η2 = .04. Figure 3 shows that under the grade condition scores were higher
when praise was presented (M = 79.26, SD = 5.12) than when praise was not presented (M =
77.69, SD = 5.12). For the no-grade condition, scores were higher when praise was not presented
(M = 79.82, SD = 5.12) than when praise was presented (M = 79.06, SD = 5.13). Means and
standard deviations are presented in Table 5.
77
78
79
80
81
No Grade Grade
Fina
l Exa
m S
core
No PraisePraise
Figure 3. Mean final exam score as function of grade and praise.
Table 5
Estimated Marginal Means and Standard Deviations of the Final Exam Score by Grade
and Praise
M SD N
No grade No praise 79.82 5.12 118
Praise 79.06 5.13 115
Grade No praise 77.69 5.12 115
Praise 79.26 5.12 115
Note. Adjusted means after controlling for the first exam score.
23

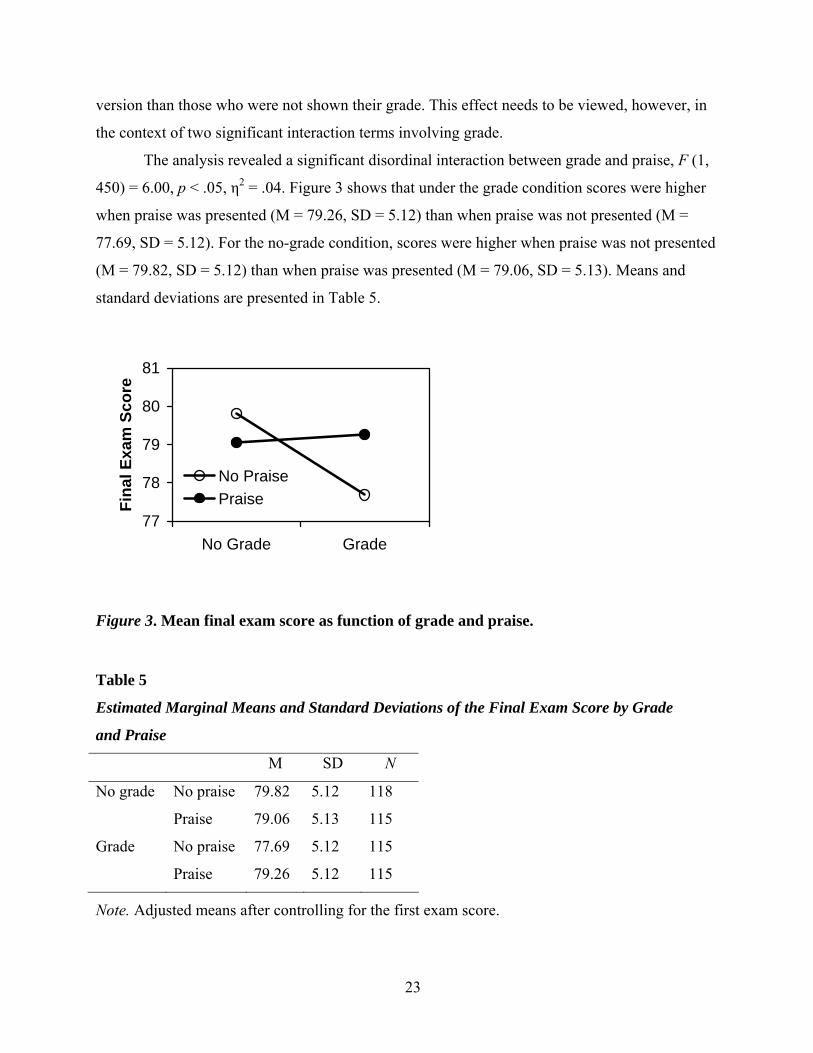
There was also a significant interaction between grade and feedback source, F (2, 450) =
5.54, p < .01, η2 = .08; see Figure 4. In the no-feedback condition, scores were slightly higher for
students who received a grade (M = 75.37, SD = 5.12) as compared to those who did not receive a
grade (M = 74.65, SD = 5.12). Under the instructor condition the opposite trend was observed.
Students’ final exam scores were relatively high when their grade was not presented (M = 82.74,
SD = 5.13), but they were substantially lower for students to whom their grade was presented (M =
79.63, SD = 5.12). Under the computer condition, students’ scores remained almost the same,
slightly lower for those who received the grade (M = 80.44, SD = 5.12 for the-no grade condition
to M = 80.93, SD = 5.12 for the grade condition). Means and standard deviations are presented in
Table 6.
In sum, the analysis of the performance scores indicated that feedback strongly influenced
students’ subsequent performance, but that there were no differences for perceived source of the
feedback. Receipt of a grade led to a substantial decline in performance for students who thought
the grade had come from the instructor, but a praise statement from the instructor appeared to
ameliorate that effect. In the absence of detailed feedback, a grade appeared to modestly enhance
subsequent performance.
Analysis of Differences in the Final Exam Score by Students’ Performance on the First
Exam Draft
To answer the research question concerning the effects of grade, praise, and the source of
feedback on the performance of students who scored differently on their first exam draft, the
following steps were taken. A frequency analysis was run for the first exam score. The analysis
revealed a mean of 74.42, a standard deviation of 8.28, and a range from 50 to 96 for the initial
exam score. The analysis of frequency tables showed that 25% of the sample scored at or below 69
(equivalent to letter grades D and F), about 50% received a score between 70 and 79 (equivalent to
the letter grade C), and the remaining 25% obtained a score at or above 80 (equivalent to letter
grades B and A). Based on these cut points, students were identified as having low (N = 116),
medium (N = 217), and high (N = 130) grades. The 3 x 3 x 2 x 2 ANCOVA was used, with the first
exam score grouping (x 3), the source of feedback (x 3), grade (x 2), and praise (x 2) as factors; the
first exam grade as a covariate; and the final exam score as a dependent measure. Several main
effects and interactions were found to be significant. To avoid unnecessary complexity in
interpretation, we made a decision to split the dataset on the first exam score grouping variable and
24
run a series of 3 x 2 x 2 ANCOVAs with the source of feedback (x 3), grade (x 2), and praise (x 2)
as factors, and the first exam grade as a covariate. These analyses examined differences in the final
exam scores for students in each performance group. Pairwise comparisons were performed
between each pair of the feedback source when ANCOVA was found to be significant.
7475767778798081828384
NoFeedback
Computer Instructor
Fina
l Exa
m S
core No Grade
Grade
Figure 4. Mean final exam score as function of grade and feedback source.
Table 6
Estimated Marginal Means and Standard Deviations of the Final Exam Score by Grade and
Source of Feedback
M SD N
No grade No feedback 74.65 5.12 80
Computer 80.93 5.12 79
Instructor 82.74 5.13 74
Grade No feedback 75.37 5.12 75
Computer 80.43 5.12 80
Instructor 79.63 5.12 75
Note. Adjusted means after controlling for the first exam score.
25
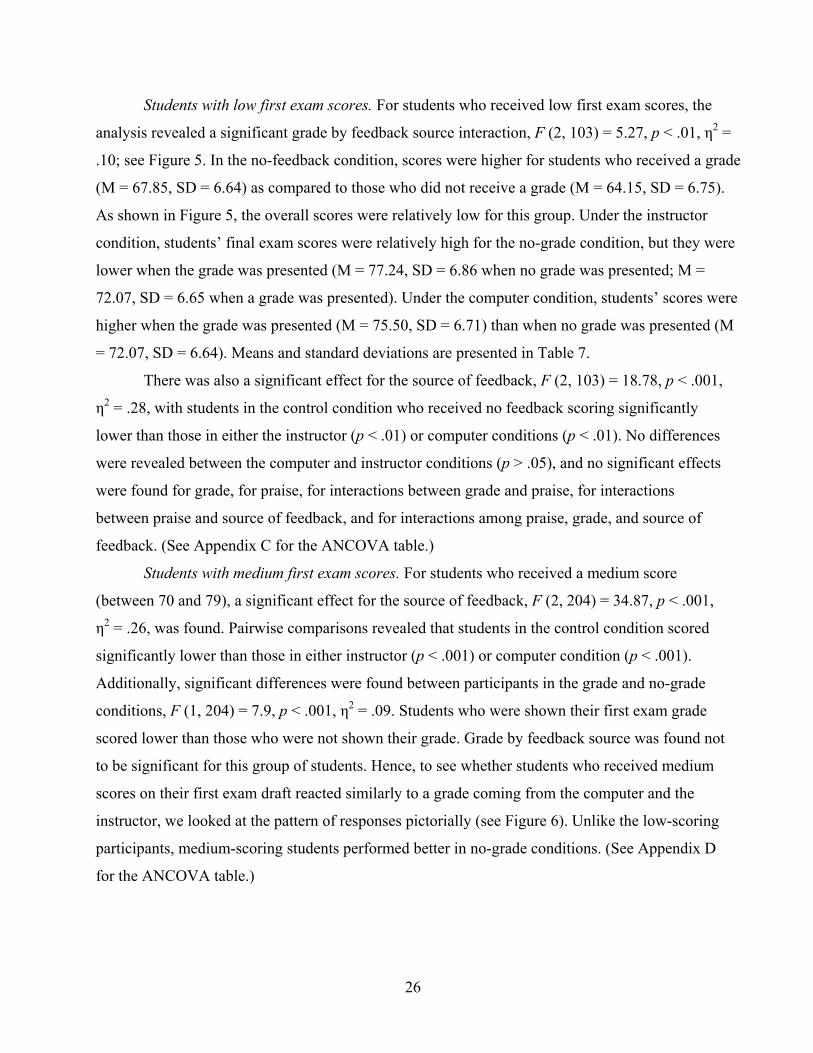
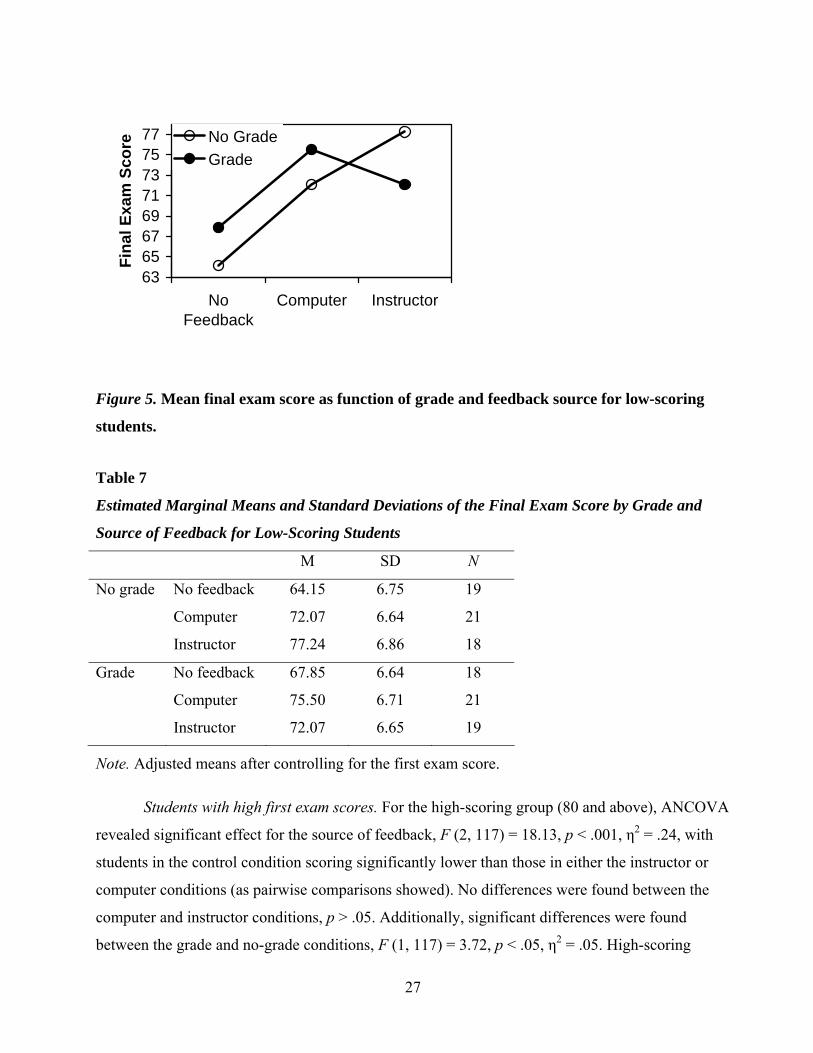
Students with low first exam scores. For students who received low first exam scores, the
analysis revealed a significant grade by feedback source interaction, F (2, 103) = 5.27, p < .01, η2 =
.10; see Figure 5. In the no-feedback condition, scores were higher for students who received a grade
(M = 67.85, SD = 6.64) as compared to those who did not receive a grade (M = 64.15, SD = 6.75).
As shown in Figure 5, the overall scores were relatively low for this group. Under the instructor
condition, students’ final exam scores were relatively high for the no-grade condition, but they were
lower when the grade was presented (M = 77.24, SD = 6.86 when no grade was presented; M =
72.07, SD = 6.65 when a grade was presented). Under the computer condition, students’ scores were
higher when the grade was presented (M = 75.50, SD = 6.71) than when no grade was presented (M
= 72.07, SD = 6.64). Means and standard deviations are presented in Table 7.
There was also a significant effect for the source of feedback, F (2, 103) = 18.78, p < .001,
η2 = .28, with students in the control condition who received no feedback scoring significantly
lower than those in either the instructor (p < .01) or computer conditions (p < .01). No differences
were revealed between the computer and instructor conditions (p > .05), and no significant effects
were found for grade, for praise, for interactions between grade and praise, for interactions
between praise and source of feedback, and for interactions among praise, grade, and source of
feedback. (See Appendix C for the ANCOVA table.)
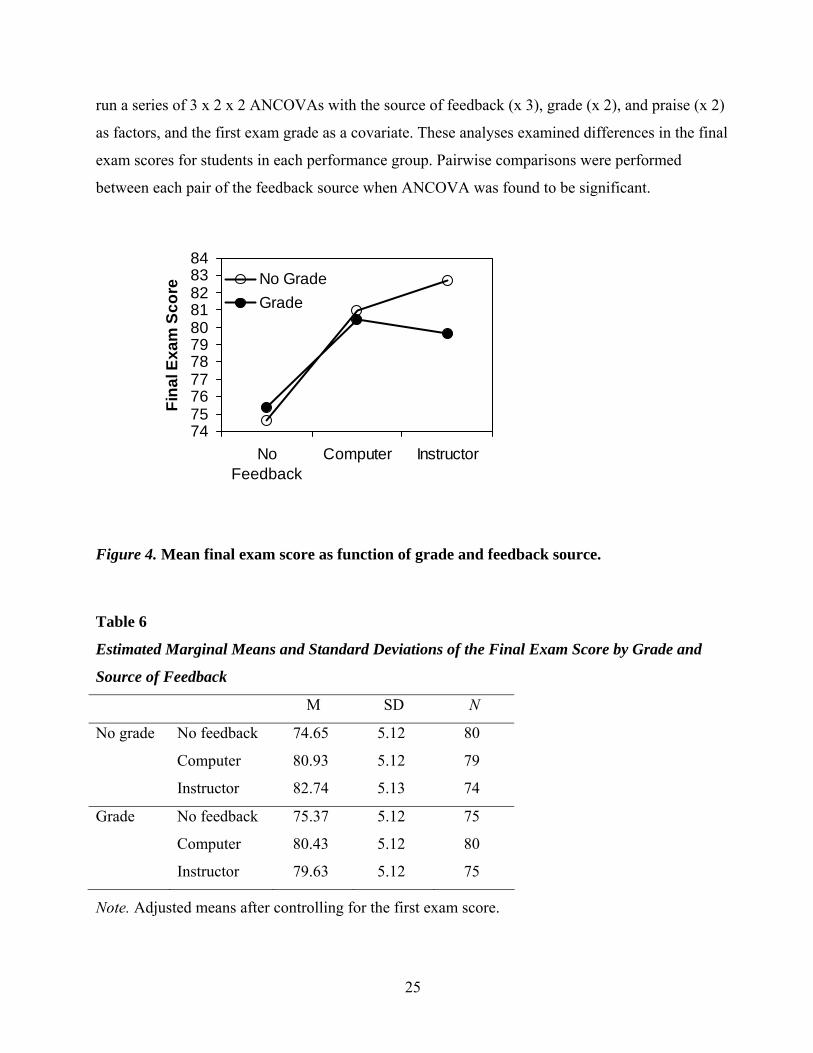
Students with medium first exam scores. For students who received a medium score
(between 70 and 79), a significant effect for the source of feedback, F (2, 204) = 34.87, p < .001,
η2 = .26, was found. Pairwise comparisons revealed that students in the control condition scored
significantly lower than those in either instructor (p < .001) or computer condition (p < .001).
Additionally, significant differences were found between participants in the grade and no-grade
conditions, F (1, 204) = 7.9, p < .001, η2 = .09. Students who were shown their first exam grade
scored lower than those who were not shown their grade. Grade by feedback source was found not
to be significant for this group of students. Hence, to see whether students who received medium
scores on their first exam draft reacted similarly to a grade coming from the computer and the
instructor, we looked at the pattern of responses pictorially (see Figure 6). Unlike the low-scoring
participants, medium-scoring students performed better in no-grade conditions. (See Appendix D
for the ANCOVA table.)
26
6365676971737577
NoFeedback
Computer Instructor
Fina
l Exa
m S
core No Grade
Grade
Figure 5. Mean final exam score as function of grade and feedback source for low-scoring
students.
Table 7
Estimated Marginal Means and Standard Deviations of the Final Exam Score by Grade and
Source of Feedback for Low-Scoring Students
M SD N
No grade No feedback 64.15 6.75 19
Computer 72.07 6.64 21
Instructor 77.24 6.86 18
Grade No feedback 67.85 6.64 18
Computer 75.50 6.71 21
Instructor 72.07 6.65 19
Note. Adjusted means after controlling for the first exam score.
Students with high first exam scores. For the high-scoring group (80 and above), ANCOVA
revealed significant effect for the source of feedback, F (2, 117) = 18.13, p < .001, η2 = .24, with
students in the control condition scoring significantly lower than those in either the instructor or
computer conditions (as pairwise comparisons showed). No differences were found between the
computer and instructor conditions, p > .05. Additionally, significant differences were found
between the grade and no-grade conditions, F (1, 117) = 3.72, p < .05, η2 = .05. High-scoring
27

students in the grade condition scored significantly lower than those in the no-grade condition.
Figure 7 depicts an interaction between grade and feedback source. Similarly to the medium-
scoring group, students who scored high on their first exam draft did less well on the exam when
grade was presented in the no-feedback, computer, or instructor conditions. Unlike low-scoring
students, they did not react differently to a grade coming from the instructor. (See Appendix E for
the ANCOVA table.)
72
74
76
78
80
82
No Feedback Computer Instructor
Fina
l Exa
m S
core
No GradeGrade
Figure 6. Mean final exam score as function of grade and feedback source for students with
medium first exam scores.
83
85
87
89
91
NoFeedback
Computer Instructor
Fina
l Exa
m S
core No Grade
Grade
Figure 7. Mean final exam score as function of grade and feedback source for high-scoring
students.
28

Overall, the analyses showed that students who scored low on the first exam draft
responded favorably to detailed feedback and were able to improve upon it. However, when
presented with a grade from the instructor, these students did not do as well as when they were
oblivious to their first exam grade. At the same time, we found that low-scoring students could
handle a low grade well if they believed it had come from the computer or when a grade was the
only feedback they received. Both medium and high scorers were shown to respond well to
detailed feedback coming from either computer or the instructor. Their performance, however,
depended on whether a grade was presented, with those who received a grade scoring lower than
those who did not. It did not matter whether the grade came from the computer or the instructor, as
students’ response to it was comparably unfavorable.
Analyses of Differences in Motivation, Self-Efficacy, and Affect
The final research question asked whether differential feedback affects students’
motivation, self-efficacy, and negative and positive affect. To answer this question, two 3 x 2 x 2
multivariate analysis of variances (MANOVA) were employed. The first MANOVA included self-
efficacy and motivation as dependent variables, and grade, praise, and the source of feedback as
independent variables (see Appendix F). The second MANOVA was run with PANAS scores as
dependent variables, and grade, praise, and the source of feedback as independent variables (see
Appendix G). We ran the two analyses separately as the data for them were gathered at different
points in the experiment.
For self-efficacy and motivation, multivariate tests were significant for the grade factor (the
F statistic for Wilks’ lambda was F [2, 449] = 5.42, p < .01) and for the praise factor (the F statistic
for Wilks’ lambda was F [2, 449] = 4.02, p < .01) but not for the source of feedback or any of the
interactions. To test the difference for both of the dependent variables, univariate analyses were
performed for motivation and self-efficacy.
For motivation, the univariate results indicate significant differences in motivation levels
between students who were praised on their performance and those who were not, F (1, 450) =
7.58, p < .01, η2 = .04. Interestingly, students in the praise condition reported lower motivation (M
= 47.29, SD = 7.66) than students in the no-praise condition (M = 49.06, SD = 5.71).
For self-efficacy, the results indicated a significant grade effect, F (1, 450) = 10.80, p < .01,
η2 = .08, with students who received a grade for the first exam exhibiting lower self-efficacy levels
29

(M = 43.38, SD = 7.03) than those who were unaware of their first exam score (M = 45.47, SD =
6.36).
For positive and negative affect, multivariate tests were only significant for the grade
factor; the F statistic for Wilks’ lambda was F (2, 450) = 7.03, p = .01. To test the difference for
both of the dependent variables, univariate analyses were performed for both positive and negative
affect variables.
Similarly to self-efficacy, there was a significant difference in negative affect depending on
the presence or absence of grade, F (1, 450) = 14.09, p < .01, η2 = .08. Students who received a
grade for the first exam reported higher levels of negative affect (M = 25.27, SD = 7.68) as
compared to those who did not receive their first exam grade (M = 22.72, SD = 7.12). For positive
affect, there were no significant effects for any of the independent variables or their interactions.
Overall, presence of grade was shown to have a significant effect on students’ reported
self-efficacy and negative affect. Students who received a grade had higher negative affect and
lower reported levels of self-efficacy than their counterparts with unknown grades. Praise affected
motivation, but in an unusual fashion, with students presented with a laudatory statement reporting
lower levels of motivation than those who were not.
Analyses of Differences in Perceived Helpfulness and Accuracy of Feedback
To answer the research question with regard to differences in perceived helpfulness of
feedback and perceived accuracy of feedback, a 3 x 2 x 2 MANOVA was employed. Perceived
helpfulness and accuracy of feedback were used as dependent variables, and grade, praise, and the
source of feedback as independent variables (see Appendix H). Multivariate analyses only revealed
significant effects for the feedback source; the F statistic for Wilks’ lambda was F (4, 900) =
87.10, p < .001.
Subsequent univariate analyses with the perceived accuracy of feedback as dependent
variable revealed a significant effect for the source of feedback, F (2, 451) = 130.98, p < .001, η2 =
.37. A post hoc Scheffé analysis yielded a significant difference in accuracy ratings between
instructor and computer conditions, p < .01, between instructor and no-feedback conditions, p <
.01, and between the computer and no-feedback conditions, p < .01. Students who received their
feedback from the instructor rated feedback as being more accurate (M = 5.95, SD = 1.07) than
those who received feedback from computer (M = 5.33, SD = 1.42) or those who did not receive
30

detailed feedback (M = 3.30, SD = 1.91). Of course, those receiving no detailed analysis had little
basis for making a judgment.
Univariate analysis with perceived helpfulness of feedback revealed a significant effect for
the source of feedback, F (2, 451) = 206.12, p < .001, η2 = .48. A post hoc Scheffé analysis
indicated a significant difference in helpfulness of feedback ratings between the instructor and
computer conditions, p < .01, between the instructor and no-feedback conditions, p < .01, and
between the computer and no-feedback conditions, p < .01. Students who received feedback from
the instructor rated it as being more helpful (M = 6.06, SD = 1.07) than those who believed that
feedback was computer generated (M = 5.44, SD = 1.56) or those who did not receive detailed
feedback (M = 2.79, SD = 1.76).
Overall, students rated feedback from the instructor as more helpful and accurate than in
the other two conditions. Not surprisingly, students who received no detailed feedback reported the
lowest levels of feedback helpfulness and accuracy.
Discussion
This study attempted to shed light on the effects of differential feedback messages on
students’ performance, motivation, self-efficacy, and affect. It also inquired into the potential
differences in students’ responses to feedback messages depending on their ability level.
Additionally, it examined the effects of grades, praise, and computer-provided versus instructor-
provided feedback. The experimental design of the study allowed for establishing direct influences
among the variables. The authentic task employed in the study enhanced ecological validity, and
blocking based on students’ first exam scores reduced sources of variability, thus leading to greater
precision of the findings.
The study helps to clarify a number of controversial areas in the field of assessment
feedback. The most pervasive and strongest finding of the study is that descriptive feedback
specific to individual work is critical to improvement. The effects of grades and praise on
performance are more complex. Students in the instructor-feedback group who also received a
grade had lower scores than those who did not receive a grade. However, if they received a grade
and a statement of praise, the negative effect was ameliorated. Overall, students receiving no grade
and no praise and those receiving both a grade and praise performed better than those receiving
either a grade or praise. It is interesting to note that the highest performing group in the study was
31

the one receiving detailed feedback perceived to come from the instructor with no grade and no
praise accompanying it.
Descriptive Feedback and Its Effects on Learning
These findings are consistent with the body of literature on the subject. The meta-analysis
conducted by Kluger and DeNisi (1996) showed that correct solutions feedback, as opposed to
dichotomous judgments of correct or incorrect, led to greater learning. Additionally, they found
that neutral descriptive feedback, which conveys information on how one performs the task and
details ways to overcome difficulties, was far more effective than evaluative feedback, which
simply informed students about how well they did and, consequently, carried a connotation of
social comparison without giving any guidelines on how to improve. Indeed, across the entire
sample of the present study for students of all ability levels and different goal orientations, detailed
feedback led to greater improvement. The type of feedback, in this case, detailed comments or lack
thereof, accounted for 31% to 38% of variability in the final exam scores.
The importance of detailed feedback is especially clear for tasks that are loosely framed
and do not have a clear right or wrong answer (Bangert-Drowns et al., 1991; Roos & Hamilton,
2005). No doubt, the essay-writing task is not well-defined. Not only did it require a strong
command of the English language and good writing skills, it also required deep understanding of
numerous course-related concepts. The complex nature of this task explains the crucial role that
individualized comments played in students’ learning. The success of detailed comments might
also be explained through the lens of information-processing theory, which emphasizes the
importance of deep processing when acquiring complex information (VanLehn, 1989). It seems
that the detailed comments provided in the study channeled students’ attention toward relevant and
specific information, stimulated mental elaboration, and consequently, boosted performance.
Differences in Responses Depending on the Perceived Source of Feedback
The main finding of the study that emphasized the beneficial effect of personalized
feedback on students’ performance can be further explored. We found that students’ improvement
in performance was nearly equivalent for both computer-feedback and instructor-feedback
conditions. The presentation of meaningful comments, regardless of their source, was shown to
help students learn. This finding appears to provide partial support for the CASA paradigm,
suggesting that people may be unconsciously perceiving computers as intentional social agents,
32

and because of this, computer-provided feedback will tend to elicit the same or very similar
responses from individuals (Nass et al., 1996, 1999).
The support the present study gives to the CASA paradigm is only partial, because
although students’ exam scores were quite similar for both the computer and instructor conditions,
differences in patterns of students’ responses to feedback were consistently observed. Participants
in the instructor condition, for instance, outperformed those in the computer condition when only
comments were provided. However, when grades were presented along with comments, their
scores were lower. The scores of their counterparts in the computer condition were the same
regardless of whether their grade was presented.
The competing paradigm, which proposed that computers are generally perceived as
neutral tools (Earley, 1988; Lepper et al., 1993), is not supported in the experiment. According to
this perspective, computers tend to be viewed as neutral and unbiased sources of information.
Thus, feedback received from computers is more trusted by individuals. Quite contrary to this
viewpoint, the analysis of students’ perceptions of accuracy and helpfulness of feedback reveals
that students rated the instructor’s feedback as being more accurate and helpful than computer-
generated feedback.
It is evident that, notwithstanding the higher perceived accuracy of instructor’s feedback,
students’ need for guidance and assistance may be addressed with equal success by both computer-
and instructor-generated feedback. In both cases, a successful outcome is contingent upon the
relevance and meaningfulness of feedback. It is possible, however, that in some situations,
skepticism of computer feedback may be quite strong, and therefore, computer feedback may not
be as effective as human-provided comments.
Overall, it seems that as long as the feedback message encourages “mindfulness (p. 230)”
in students’ responses (Bangert-Drowns et al., 1991), students will treat computers as equals to
humans and will use computer feedback to improve their work. This conclusion is consistent with
the CASA perspective. However, the different patterns of responses for computer and instructor
conditions indicate that students do not treat human- and machine-generated feedback the same.
The Effects of Grades on Students Learning
The effect of receiving a grade in this study was particularly interesting. Among those
students who believed they received their detailed feedback from the instructor, those who were
33

given a grade showed substantially lower scores than those who were not. Receiving a grade was
also generally associated with lower self-efficacy and more negative affect.
One explanation for these findings comes from the feedback intervention theory proposed
by Kluger and DeNisi (1996). They suggested that optimal feedback should direct individuals’
attention toward the task and toward the specific strategies that would lead to achievement of
desired outcomes. Letter grades or numeric scores, being evaluative in nature and carrying a notion
of social comparison, tend to turn students’ attention away from the task and toward the self, thus
leading to negative effects on performance (Kluger & DeNisi, 1996; Siero & Van Oudenhoven,
1995; Szalma et al, in press). An alternative explanation from the standpoint of the information
processing theory suggests that the attention diverted from the task to an individual’s perceptions
of self inevitably leads to reallocation of cognitive resources. Contemplating one’s success or
failure may subsequently impede effective performance due to competition for cognitive resources
(Kanfer & Ackerman, 1989).
In a similar vein, attention to the self elicited by the presentation of a grade could activate
affective reactions. Kluger, Lewinsohn, and Aiello (1994) argued that feedback received by
individuals gets cognitively evaluated with respect to harm or benefit potential for the self and for
the need to take an action. The appraisal of harm versus benefit is reflected in the primary
dimension of mood (pleasantness), and the appraisal of the need for action is reflected in a
secondary dimension of mood (arousal; Kluger & DeNisi, 1996). The relationship between the two
dimensions is not linear, as a potential threat to the self may instigate high activity on the student’s
behalf. At the same time, it may debilitate students so they cannot act.
The affective measure administered in this study addressed the arousal dimension of mood.
High positive affect was indicative of high arousal, and high negative affect was indicative of
depression and behavior inhibition (Crawford & Henry, 2004). The results indicated that students
who were shown their grade scored significantly higher on the negative affect scale than their
counterparts who did not receive their grade. Thus, the effect of the grade may have led students to
become depressed about their performance, leading them to be less disposed to put forth the
necessary effort to improve their work. This effect may have been particularly strong if the grade
was perceived to be coming from the instructor (as opposed to computer generated), hence the
large negative impact of grade on performance in that condition.
34

The negative effect of grades on students’ performance can also be explained through their
influences on students’ self-efficacy. Generally, self-efficacy, or beliefs about one’s competence, is
known to be influenced by prior outcomes (Bandura & Locke, 2003). Feedback, therefore, has a
potential of affecting self-efficacy. The present study revealed that presentation of grade resulted
in decreased levels of self-efficacy. Students who were not shown their grade reported higher
levels of test-specific self-efficacy than those to whom a grade was provided.
Marzano (2000) stated that the most important purpose of grades was to provide
information to students, and if referencing for grading is content specific, letter grades and
numerical scores would lead to an increase in students’ performance. He postulated that if students
had a clear understanding of the requirements of the task, and if grading was based only on
students’ achievement and effort, students could increase their level of knowledge and
understanding based on grades alone. Although plausible, this view does not find support among
researchers in the field, and neither did it find support in the present study. Many researchers agree
that grades are perceived by students as controlling rather than informative (Elawar & Corno,
1985; Stipek, 2002). As Roos and Hamilton (2005) noted, feedbackis too deeply encoded in a
grade for it to lead to appropriate action.
The classic work of Page (1958), indicating that optimal feedback included both comments
and grades, is not supported by the results here. Our findings instead support the research carried
out by Butler (1988), Butler and Nisan (1986), and Elawar and Corno (1985). These studies
demonstrated that feedback consisting of grades and comments led to significantly lower
improvement than comments alone.
Although it is hard to disagree with the convenience and effectiveness of grades when used
for summative purposes, the formative influence of grades appears to be negative. In some
educational settings, however, presenting a grade is a requirement. As a result, figuring out ways to
do so with the least damage to students’ achievement and, hopefully, with added benefit to their
performance is crucial for educators across all academic environments. The possible solution to
this quandary is presented below.
The Effects of Praise on Students’ Learning
The present study attempted to clarify the effect of praise on students’ performance,
motivation, self-efficacy, and affect. Praise is a controversial topic, with some researchers arguing
that praise promoted learning by raising positive affect and self-efficacy (Alber & Heward, 2000),
35
while others stipulated that it led to depletion of cognitive resources by taking attention away from
the task and focusing it on aspects of the self (Baumeister et al., 1990; Kluger & DeNisi, 1996).
Our study did not reveal any overall differences in performance among students who did or did
not receive praise on their performance. Comments and grades, alone and in combination, have a
stronger influence on students’ performance, with praise adding to and modifying their effects.
The only outcome measure directly affected by praise was motivation. The effect of praise
here was quite interesting, if not surprising. Students presented with praise reported slightly lower
levels of motivation as compared to their counterparts who were not praised on their performance
(effect size of .27). Recall that students’ motivation was measured after they had finished their
work, up to two hours since the time that they received their praise (see Table 1). Therefore, the
group differences found indicate that this type of feedback had a relatively stable effect on the
level of motivation. This finding is intriguing as no studies known to date have shown that praise
negatively affects students’ motivation.
In situations in which grades must be presented to students, educators should consider
accompanying it with meaningful praise. However, it should be reiterated that when neither grades
nor praise was presented, students’ scores on the exam were the highest. Hence, if educators have
an option to choose, personalized comments without praise or grade appear to be an optimal form
of feedback leading to the highest achievement.
Difference in Responses to Feedback for Students of Different Performance Levels
Several researchers proposed that students’ responses to feedback messages may depend on
their ability or typical performance levels (Black & Wiliam, 1998). To date, very few studies have
examined the differential effects of feedback on students’ performance for students of different
performance levels. Butler (1988) showed that presentation of a grade on its own or in
combination with any other information leads to a significant decline of interest in performing the
task for low-achieving students. In the present study, low-, medium-, and high-scoring students
showed a significant increase in scores when presented with detailed comments. Once again, this
finding attests to the fact that information regarding mistakes and misconceptions, along with
suggestions on how to improve them, is a key to student achievement. It did not matter what their
original grade was; students who were offered feedback specific to their own work found ways to
incorporate it into their essay and improve their results. After covariate adjustment for pretest
performance, feedback accounted for 28% of variance in the final exam score for students in the
36

low achievement group and for 26% and 24% for those in the medium and high groups,
respectively. Thus, the positive effect of personalized comments was observed throughout the
entire sample, irrespective of students’ ability levels.
Although detailed comments were conducive to learning in students of all performance
levels, some differences in students’ responses to feedback were found between the low-scoring
group on one hand, and medium- and high-scoring groups on the other. Students who received
high or medium scores performed differently when a grade was and was not presented. Under the
grade condition both groups scored lower on their exam as compared to students who did not
receive their grade. As suggested in preceding sections, a grade appears to undermine the effort
that students are willing to put forward in order to improve their work. Receiving a satisfactory
grade may prevent students from channeling their effort toward further mastery of their work;
rather, their focus on the quantitative aspect of learning leads them to lose motivation before they
can perfect their work.
Interestingly, however, no overall differences between the grade and no-grade conditions
were found for the low-scoring students. Instead, there was a strong grade by feedback source
interaction. Specifically, students receiving grades performed better in the no-detailed-feedback
and computer-feedback conditions but worse in the instructor-feedback condition. It may be the
case that the computer-based grade was viewed as being less judgmental or personally directed
than the instructor-based grade.
Limitations
Some potential limitations of the study should be noted. One of the feedback conditions in
the study involved presentation of praise. The decision was made to use a standard laudatory
comment differentiated according to three levels of the quality of students’ work. No main effects
were found for the praise factor. It is possible that none of the three levels of praise were strong
enough to induce emotional responses that were commonly reported in the literature (Baumeister
et al., 1990; Delin & Baumeister, 1994; Henderlong & Lepper, 2002). Laudatory comments that
are more detailed and personal could have induced a broader range of responses from the
participants. At the same time, interaction effects were found between praise and grade as well as
praise and feedback source, which indicate that the praise manipulation was successful.
The sample of the present study was comprised of college students who were relatively
uniform in their age, with the majority of the participants being first-year students. Generalizing
37

the results of the study to wider populations should be approached with caution. Conversely, the
fact that the main experimental task was a part of a normal learning experience, and was
approached by participants seriously as a regular course exam, contributed to the robustness of the
findings.
Finally, the experimental task involved students working on an essay and then coming back
a week later to revise their work based on the feedback provided at that time. In other words, the
feedback was used to monitor and improve performance on an assignment carried out over a
relatively brief period. The students were not assessed later, and they were not given a similar task
at a later time. Therefore, the present study does not allow for inferences concerning the long-term
effect of feedback on students’ writing.
Directions for Future Research
The present study demonstrated the effectiveness of detailed feedback in helping students
improve their academic work in the area of writing a response to a curriculum-based essay prompt.
It also demonstrated that the presentation of a grade appeared to have a detrimental effect on
performance unless ameliorated by a statement of praise. Finally, some ideas as to how the
presentation of grades and praise work with regard to affective considerations in this process were
uncovered. Although the present study was strengthened by the in situ nature of the research, we
do not know whether students receiving detailed feedback on the task at hand would perform better
in a subsequent task or whether presentation of a grade led to less learning or simply to less effort
on the revision of the work. One clear venue for future research would be to look at how
differential feedback influences subsequent learning in a course. It is, of course, difficult to
conduct research that would vary the nature of the feedback that students receive on a randomized
basis throughout an entire course, both for practical and ethical reasons. And yet, unless we
conduct rigorous research into these issues, and their many elaborations and permutations, we will
not learn the most effective approaches to using feedback.
Another area of investigation that may prove fruitful for future research concerns the role
of individual characteristics in determining students’ responses to feedback. Overall, the exact
mechanisms through which feedback messages impact students performance and personal
dispositions should be examined in future research inquiries. Corroborating evidence from studies
conducted across various domains of knowledge with students of different ages and levels of
academic attainment would assist in understanding more fully the effect of feedback on learning
38
and would allow researchers to make important additional conclusions about optimal feedback
practices. Until we better understand how feedback through formative assessment works, our
practice will be guided by speculation and conjecture rather than by informed judgment.
Conclusion
This study attempted to fill in the gap in the current understanding of differential effects of
feedback on students’ performance, motivation, affect, and self-efficacy. It also endeavored to
uncover whether students of different ability levels and various goal orientations would respond
differently to feedback messages. The authentic learning task contributed to the ecological validity
of the study, and the classroom context ensured that the participants approach the task with all due
seriousness of a regular course exam. The current study is among the few that were conducted in
an authentic learning environment. The findings, therefore, deserve careful attention from both
researchers and practitioners.
In order to test the potential effects of feedback on students’ performance, a valid
assessment of their work was needed. The use of the e-rater along with the two highly calibrated
human raters ensured proper evaluation of students’ work. Custom-made software was used to
present feedback to students and allowed the control necessary to implement the design of the
study. No studies known to date have used this level of complexity in both the design and the
depth of assessment of students’ products. Additionally, a broad range of conditions allowed for
isolating the effects of specific forms of feedback individually and in combination.
The most condensed conclusion of this inquiry is as follows: Detailed, specific, descriptive
feedback, which focuses students’ attention on their work rather than the self, is the most
advantageous kind of information that should be provided to students. The benefit of such
feedback occurs at all levels of performance. Evaluative feedback in the form of grades may be
helpful if no other options are available and can beneficially be accompanied by some form of
encouragement. At the same time, grades were shown to decrease the effect of detailed feedback.
It appears that this occurs because it reduces a sense of self-efficacy and elicits negative affect
around the assessment task.
39

References
Airasian, P. W. (1994). Classroom assessment (2nd ed.). New York: McGraw-Hill.
Alber, S. R., & Heward, W. L. (1997). Recruit it or lose it! Training students to recruit positive
teacher attention. Intervention in School and Clinic, 32, 275–282.
Alber, S. R., & Heward, W. L. (2000). Teaching students to recruit positive attention: A review
and recommendations. Journal of Behavioral Education, 10, 177–204.
Ames, C. (1992). Classrooms: Goals, structures, and student motivation. Journal of Educational
Psychology, 84, 261–271.
Anderman, E. M., & Johnston, J. (1998). Television news in the classroom: What are adolescents
learning? Journal of Adolescent Research, 13, 73–100.
Attali, Y. (2004, April). Exploring the feedback and revision features of the CriterionSM service.
Paper presented at the annual meeting of the National Council on Measurement in
Education, San Diego, CA.
Bandura, A. (1986). Social foundations of thought and action: A social cognitive theory.
Englewood Cliffs, NJ: Prentice Hall.
Bandura, A. (1997). Self-efficacy: The exercise of control. New York: Freeman.
Bandura, A., & Locke, E. A. (2003). Negative self-efficacy and goal effects revisited. Journal of
Applied Psychology, 88, 87–99.
Bangert-Drowns, R. L., Kulik, J. A., & Morgan, M. T. (1991). The instructional effect of feedback
in test-like events. Review of Educational Research, 61, 213–238.
Baumeister, R. F., Hutton, D. G., & Cairns, K. J. (1990). Negative effects of praise on skilled
performance. Basic and Applied Social Psychology, 11, 131–148.
Black, P., & Wiliam, D. (1998). Assessment and classroom learning. Assessment in Education:
Principles, Policy & Practice, 5(1), 7–68.
Black, P., & Wiliam, D. (2003). In praise of educational research. British Educational Research
Journal, 29(5), 623–637.
Butler, R. (1987). Task-involving and ego-involving properties of evaluation: Effects of different
feedback conditions on motivational perceptions, interest, and performance. Journal of
Educational Psychology, 79, 474–482.
40

Butler, R. (1988). Enhancing and undermining intrinsic motivation: The effects of task-involving
and ego-involving evaluation on interest and performance. British Journal of Educational
Psychology, 58, 1–14.
Butler, R., & Nisan, M. (1986). Effects of no feedback, task-related comments, and grades on
intrinsic motivation and performance. Journal of Educational Psychology, 78, 210–216.
Cameron, J., & Pierce, D. P. (1994). Reinforcement, reward, and intrinsic motivation: A meta-
analysis. Review of Educational Research, 64, 363–423.
Craven, R. G., Marsh, H. W., & Debus, R. L. (1991). Effects of internally focused feedback on
enhancement of academic self-concept. Journal of Educational Psychology, 83, 17–27.
Crawford, J. R., & Henry, J. D. (2004). The positive and negative affect schedule (PANAS):
Construct validity, measurement properties and normative data in a large non-clinical
sample. British Journal of Clinical Psychology, 43, 245–265.
Deci, E. L., Koestner, R., & Ryan, R. M. (1999). A meta-analytic review of experiments
examining the effects of extrinsic rewards on intrinsic motivation. Psychological Bulletin,
125, 627–668.
Delin, C. R., & Baumeister, R. F. (1994). Praise: More than just social reinforcement. Journal for
the Theory of Social Behaviour, 24, 219–241.
Derryberry, D. (1991). The immediate effects of positive and negative feedback signals. Journal of
Personality and Social Psychology, 61(2), 267–278.
Dev, P. C. (1997). Intrinsic motivation and academic achievement: What does their relationship
imply for the classroom teacher. Remedial and Special Education, 18, 12–19.
Dweck, C. S. (1986). Motivational processes affecting learning. American Psychologist, 41(10),
1040–1048.
Earley, P. C. (1988). Computer-generated performance feedback in the subscription-processing
industry. Organizational Behavior and Human Decision Processes, 41, 50–64.
Elawar, M. C., & Corno, L. (1985). A factorial experiment in teachers' written feedback on student
homework: Changing teacher behavior a little rather than a lot. Journal of Educational
Psychology, 77, 162–173.
ETS. (2006). ETS CriterionSM: Topics. Retrieved October 5, 2006, from the ETS Web site:
http://www.ets.org/Media/Products/Criterion/topics/topics.htm.
41

Ferdig, R. E., & Mishra, P. (2004). Emotional responses to computers: Experiences in unfairness,
anger and spite. Journal of Educational Multimedia and Hypertext, 13(2), 143–161.
Gray, J. A. (1990). Brain systems that mediate both emotion and cognition. Cognition and
Emotion, 4, 269–288.
Grolnick, W. S., & Ryan, R. M. (1987). Autonomy in children's learning: An experimental and
individual difference investigation. Journal of Personality and Social Psychology, 52, 890–
898.
Guskey, T., & Bailey, J. (2001). Developing grading and reporting systems for student learning.
Thousand Oaks, CA: Crown.
Hattie, J., & Timperley, H. (2007). The power of feedback. Review of Educational Research,
77(1), 81–113.
Henderlong, J., & Lepper, M. R. (2002). The effects of praise on children’s intrinsic motivation: A
review and synthesis. Psychological Bulletin, 128(5), 774–795.
Ilgen, D. R., & Davis, C. A. (2000). Bearing bad news: Reactions to negative performance
feedback. Applied Psychology: An International Review, 49(3), 550–565.
Ilies, R., & Judge, T. A. (2005). Goal regulation across time: The effects of feedback and affect.
Journal of Applied Psychology, 90(3), 453–467.
Jolly, J. B., Dyck, M. J., Kramer, T. A., & Wherry, J. N. (1994). Integration of positive and
negative affectivity and cognitive content specificity: Improved discrimination of anxious
and depressive symptoms. Journal of Abnormal Psychology, 103, 544–552.
Kanfer, R., & Ackerman, P. L. (1989). Motivation and cognitive abilities: An integration/aptitude-
treatment interaction approach to skill acquisition. Journal of Applied Psychology, 74, 657–
690.
Kanouse, D. E., Gumpert, P., & Canavan-Gumpert, D. (1981). The semantics of praise. In J. H.
Harvey, W. Ickes, & R. F. Kidd (Eds.), New directions in attribution research (Vol. 3, pp.
97–115). Hillsdale, NJ: Lawrence Erlbaum Associates.
Kluger, A. N., & DeNisi, A. (1996). The effects of feedback interventions on performance:
Historical review, a meta-analysis and a preliminary feedback intervention theory.
Psychological Bulletin, 119, 254–284.
42

Kluger, A. N., Lewinsohn, S., & Aiello, J. (1994). The influence of feedback on mood: Linear
effects on pleasantness and curvilinear effects on arousal. Organizational Behavior and
Human Decision Processes, 60, 276–299.
Kulhavy, R. W., & Stock, W. A. (1989). Feedback in written instruction: The place of response
certitude. Educational Psychology Review, 1(4), 279–308.
Lajoie, S., & Derry, S. (1993). Computers as cognitive tools. Hillsdale, NJ: Lawrence Erlbaum
Associates.
Leontyev, A. N. (1981). Эволюция психики: проблемы развития разума. [An outline of the
evolution of the psyche: Problems of the development of the mind]. Moscow: Progress
Publishers.
Lepper, M. R., Henderlong, J., & Gingras, I. (1999). Understanding the effects of extrinsic rewards
on intrinsic motivation-Uses and abuses of meta-analysis: Comment on Deci, Koestner, and
Ryan (1999). Psychological Bulletin, 125, 669–676.
Lepper, M. R., Woolverton, M., Mumme, D. L., & Gurtner, J. (1993). Motivational techniques of
expert human tutors: Lessons for the design of computer-based tutors. In S. P. Lajoie & S.
J. Derry (Eds.), Computers as cognitive tools (pp. 75–106). Hillsdale, NJ: Lawrence
Erlbaum Associates.
Linn, R. L., & Miller, M. D. (2005). Measurement and assessment in teaching (9th ed.). Upper
Saddle River, NJ: Pearson Prentice Hall.
Marzano, R. (2000). Transforming classroom grading. Alexandria, VA: Association for
Supervision and Curriculum and Development.
Mishra, P. (2006). Affective feedback from computers and its effect on perceived ability and
affect: A test of the computers as social actors hypothesis. Journal of Educational
Multimedia and Hypermedia, 15(1), 107-131.
Nass, C., Fogg, B. J., & Moon, Y. (1996). Can computers be teammates? International Journal of
Human-Computer Studies, 45(6), 669–678.
Nass, C., Moon, Y., & Carney, P. (1999). Are respondents polite to computers? Social desirability
and direct responses to computers. Journal of Applied Social Psychology, 29(5), 1093–
1110.
Nass, C., Moon, Y., & Green, N. (1997). Are computers gender-neutral? Gender stereotypic
responses to computers. Journal of Applied Social Psychology, 27(10), 864–876.
43

Nitko, A. J., & Brookhart, S. M. (2007). Educational assessment of students (5th ed.). Upper
Saddle River, NJ: Pearson Prentice Hall.
O’Leary, K. D., & O’Leary, S. G. (1977). Classroom management: The successful use of behavior
modification (2nd ed.). New York: Pergamon.
Oosterhof, A. (2001). Classroom applications of educational measurement. Upper Saddle River,
NJ: Merrill Prentice Hall.
Page, E. B. (1958). Teacher comments and student performance: A seventy-four classroom
experiment in school motivation. Journal of Educational Psychology, 49(2), 173–81.
Pintrich, P. R., & Schunk, D. H. (2002). Motivation in education: Theory, research and
applications (2nd ed.). Upper Saddle River, NJ: Pearson Prentice Hall.
Ramaprasad, A. (1983). On the definition of feedback. Behavioral Science, 28, 4–13.
Reeves, B., & Nass, C. I. (1996). The media equation: How people treat computers, television, and
new media as real people and places. Cambridge, England: Cambridge University
Press/CSLI.
Roesch, S. C. (1998). The factorial validity of trait positive affect scores: Confirmatory factor
analyses of unidimensional and multidimensional models. Educational and Psychological
Measurement, 58, 451–466.
Roos, B., & Hamilton, D. (2005). Formative assessment: A cybernetic viewpoint. Assessment in
Education, 12(1), 7–20.
Scriven, M. (1967). The methodology of curriculum evaluation. In R. Taylor, R. Gagne & M.
Scriven (Eds.), AERA monograph series on curriculum evaluation (Vol. 1, pp. 39–83).
Chicago: Rand McNally.
Shanab, M. E., Peterson, D., Dargahi, S., & Deroian, P. (1981). The effects of positive and
negative verbal feedback on the intrinsic motivation of male and female subjects. Journal
of Social Psychology, 115, 195–205.
Shute, V. J. (2007). Tensions, trends, tools, and technologies: Time for an educational sea change.
In C. A. Dwyer (Ed.), The future of assessment: Shaping teaching and learning. Mahwah,
NJ: Lawrence Erlbaum Associates.
Siero, F., & Van Oudenhoven, J. P. (1995). The effects of contingent feedback on perceived
control and performance. European Journal of Psychology of Education, 10, 13–24.
44

Spencer, S. (2005). Stereotype threat in mathematics in undergraduate women. Unpublished
doctoral dissertation, Rutgers University, Newark, NJ.
Stipek, D. (2002). Motivation to learn: Integrating theory and practice (4th ed.). Boston: Allyn &
Bacon.
Symonds, K. W. (2004). After the test: Closing the achievement gap with data. Naperville, IL:
Learning Point Associates.
Szalma, J. L. (2006). Training for vigilance: The effect of knowledge of results format and
dispositional optimism and pessimism on performance and stress. British Journal of
Psychology, 97, 115–135.
Szalma, J. L., Hancock, P. A., Warm, J. S., Dember, W. N., & Parsons, K. S. (in press). Training
for vigilance: Using predictive power to evaluate feedback effectiveness. Human Factors.
Tubbs, M. E., Boehne, D. M., & Dahl, J. G. (1993). Expectancy, valence, and motivational force
functions in goal-setting research: An empirical test. Journal of Applied Psychology, 78,
361–373.
Tunstall, P., & Gipps, C. (1996). Teacher feedback to young children in formative assessment: A
typology. British Educational Research Journal, 22, 389–404.
VanLehn, K. (1989). Problem solving and cognitive skill acquisition. In M. I. Posner (Ed.),
Foundations of cognitive science (pp. 527–579). Cambridge, MA: MIT Press.
Watson, D., Clark, L. A., & Tellegen, A. (1988). Development and validation of brief measures of
positive and negative affect: The PANAS scales. Journal of Personality and Social
Psychology, 47, 1063–1070.
Wiliam, D., & Thompson, M. (2007). Integrating assessment with instruction: What will it take to
make it work? In C. A. Dwyer (Ed.), The future of assessment: Shaping teaching and
learning. Mahwah, NJ: Lawrence Erlbaum Associates.
Wolf, L. F., & Smith, J. K. (1995). The consequence of consequence: Motivation, anxiety, and test
performance. Applied Measurement in Education, 8, 227–242.
Wolf, L. F., Smith, J. K., & Birnbaum, M. E. (1995). Consequence of performance, test
motivation, and mentally taxing items. Applied Measurement in Education, 8, 341–351.
Wong, B. Y. L. (1985). Self-questioning instructional research. Review of Educational Research,
55, 227–268.
45

List of Appendixes
Page
A – Rubric for Grading the Content of an Essay..................................................................... 47
B – Analysis of Covariance (ANCOVA) of Differences in the Final Exam Score................. 48
C – Analysis of Covariance (ANCOVA) of Differences in the Final Exam Score for Low-
Scoring Students ............................................................................................................... 49
D – Analysis of Covariance (ANCOVA) of Differences in the Final Exam Score for Medium-
Scoring Students ............................................................................................................... 50
E – Analysis of Covariance (ANCOVA) of Differences in the Final Exam Score for High-
Scoring Students ............................................................................................................... 51
F – Multivariate Analysis of Variance (MANOVA) of Differences in Motivation and Self-
Efficacy ............................................................................................................................. 52
G – Multivariate Analysis of Variance (MANOVA) of Differences in Positive and Negative
Affect ................................................................................................................................ 54
H – Multivariate Analysis of Variance (MANOVA) of Differences in Perceived Helpfulness
and Accuracy of Feedback................................................................................................ 56
46

Appendix A
Rubric for Grading the Content of an Essay
Table A1
Content Grading Rubric
Score # of
theories
Criteria for evaluation
0 0 No content (word “motivation” doesn’t count)
1 0 Several relevant terms, not explained or used inappropriately
1.5 1 One or two theories mentioned appropriately, but the description is not full or
confused
2 1 One theory explained, other terms are used inappropriately or too lightly
2.5 1 One theory well-explained, others are touched upon correctly (terms
mentioned)
3 2 Two theories explained, but with some confused application, not enough
detail and examples (some other theories may be touched on)
3.5 2 Two theories explained, description of one not full/confused (some other
theories may be touched upon)
4 2 Two theories well-explained, and/or terms from one or more theories
mentioned
4.5 2 Level 4 plus argument leading very well to conclusion
5 3+ Three or more theories explained and properly applied, but with some
confused terms and not enough detail for one of them
5.5 3+ Three or more discussed theories, well-explained and properly applied, with
minor omissions
6 3+ Three or more discussed theories, well-explained, properly applied and
substantiated by examples; other class readings are included
47

Appendix B
Analysis of Covariance (ANCOVA) of Differences in the Final Exam Score
Table B1
Tests of Between-Subjects Effects
Source SS df Mean square F Sig.
Corrected model 23,313.04 12 1,942.75 74.24 0.000
Intercept 2,705.07 1 2,705.07 103.37 0.000
First exam grade 18,377.67 1 18,377.67 702.30 0.000
Grade 106.58 1 106.58 4.07 0.014
Praise 18.56 1 18.56 0.71 0.400
Feedback source 3,623.41 2 1,811.70 69.23 0.000
Grade x praise 156.87 1 156.87 5.99 0.010
Grade x feedback source 289.70 2 144.85 5.54 0.004
Praise x feedback source 14.86 2 7.43 0.28 0.753
Grade x praise x feedback source 86.86 2 43.43 1.66 0.191
Error 11,775.50 450 26.17
Total 2,920,565.00 463
Corrected total 35,088.54 462
Note. R-squared = .664 (adjusted R-squared = .655).
48

Appendix C
Analysis of Covariance (ANCOVA) of Differences in the Final Exam Score for Low-Scoring
Students
Table C1
Tests of Between-Subjects Effects
Source SS df Mean square F Sig.
Corrected model 3,582.71 12 298.56 6.78 0.000
Intercept 514.27 1 514.27 11.68 0.001
First exam grade 637.27 1 637.27 14.47 0.000
Grade 12.10 1 12.10 0.27 0.601
Praise 22.66 1 22.66 0.51 0.475
Feedback source 1,654.71 2 827.35 18.79 0.000
Grade x praise 104.78 1 104.78 2.38 0.126
Grade x feedback source 464.46 2 232.23 5.27 0.007
Praise x feedback source 21.05 2 10.53 0.24 0.788
Grade x praise x feedback source 8.02 2 4.01 0.09 0.913
Error 4,535.43 103 44.03
Total 602,570.00 116
Corrected total 8,118.14 115
Note. R-squared = .441 (adjusted R-squared = .376).
49
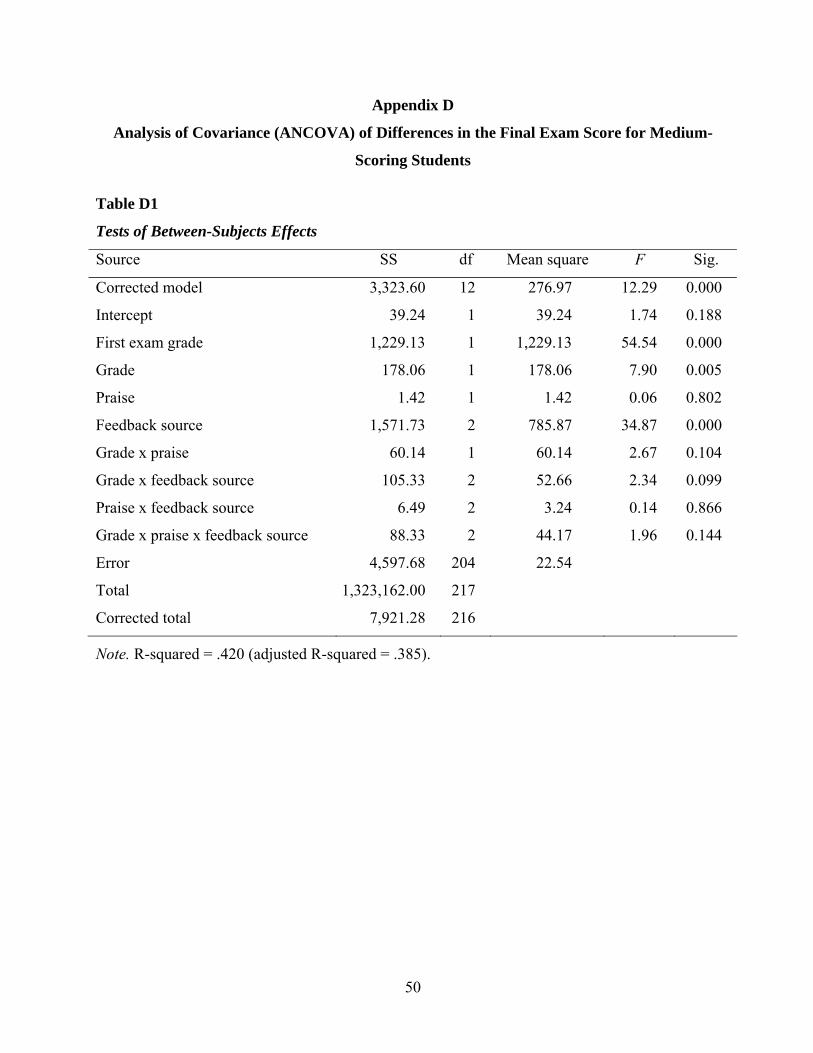
Appendix D
Analysis of Covariance (ANCOVA) of Differences in the Final Exam Score for Medium-
Scoring Students
Table D1
Tests of Between-Subjects Effects
Source SS df Mean square F Sig.
Corrected model 3,323.60 12 276.97 12.29 0.000
Intercept 39.24 1 39.24 1.74 0.188
First exam grade 1,229.13 1 1,229.13 54.54 0.000
Grade 178.06 1 178.06 7.90 0.005
Praise 1.42 1 1.42 0.06 0.802
Feedback source 1,571.73 2 785.87 34.87 0.000
Grade x praise 60.14 1 60.14 2.67 0.104
Grade x feedback source 105.33 2 52.66 2.34 0.099
Praise x feedback source 6.49 2 3.24 0.14 0.866
Grade x praise x feedback source 88.33 2 44.17 1.96 0.144
Error 4,597.68 204 22.54
Total 1,323,162.00 217
Corrected total 7,921.28 216
Note. R-squared = .420 (adjusted R-squared = .385).
50

Appendix E
Analysis of Covariance (ANCOVA) of Differences in the Final Exam Score for High-Scoring
Students
Table E1
Tests of Between-Subjects Effects
Source SS df Mean square F Sig.
Corrected model 1,613.76 12 134.48 8.98 0.000
Intercept 255.90 1 255.90 17.08 0.000
First exam grade 921.55 1 921.55 61.51 0.000
Grade 55.68 1 55.68 3.72 0.008
Praise 1.13 1 1.13 0.08 0.784
Feedback source 543.24 2 271.62 18.13 0.000
Grade x praise 5.15 1 5.15 0.34 0.559
Grade x feedback source 4.95 2 2.48 0.17 0.848
Praise x feedback source 30.67 2 15.34 1.02 0.362
Grade x praise x feedback source 21.12 2 10.56 0.70 0.496
Error 1,753.02 117 14.98
Total 994,833.00 130
Corrected total 3,366.78 129
Note. R-squared = .479 (adjusted r-squared = .426).
51

Appendix F
Multivariate Analysis of Variance (MANOVA) of Differences in Motivation
and Self-Efficacy
Table F1
Multivariate Tests
Effect Value F Hypothesis df
Error df
Sig.
Intercept Wilks' lambda
0.01 15,943.51 2 449 0.000
Grade Wilks' lambda
0.98 5.42 2 449 0.005
Praise Wilks' lambda
0.98 4.02 2 449 0.019
Feedback source Wilks' lambda
0.99 1.13 4 898 0.339
Grade x praise Wilks' lambda
0.99 1.61 2 449 0.201
Grade x feedback source Wilks' lambda
0.99 1.24 4 898 0.294
Praise x feedback source Wilks' lambda
0.99 0.61 4 898 0.658
Grade x praise x feedback source
Wilks' lambda
1.00 0.34 4 898 0.853
52

Table F2
Tests of Between-Subjects Effects
Source Dependent variable SS df MS F Sig. Corrected model
Motivation total 639.20 11 58.11 1.27 0.241
Self-efficacy total 1,004.02 11 91.27 2.04 0.024 Intercept Motivation total 1,070,814.91 1 1,070,814.91 23,351.31 0.000 Self-efficacy total 909,719.95 1 909,719.95 20,312.77 0.000 Grade Motivation total 43.49 1 43.49 0.95 0.331 Self-efficacy total 483.74 1 483.74 10.80 0.001 Praise Motivation total 347.72 1 347.72 7.58 0.006 Self-efficacy total 6.46 1 6.46 0.14 0.704 Feedback source
Motivation total 55.66 2 27.83 0.61 0.545
Self-efficacy total 98.45 2 49.22 1.10 0.334 Grade x praise Motivation total 19.10 1 19.10 0.42 0.519 Self-efficacy total 144.62 1 144.62 3.23 0.073 Grade x feedback source
Motivation total 79.08 2 39.54 0.86 0.423
Self-efficacy total 142.47 2 71.24 1.59 0.205 Praise x feedback source
Motivation total 64.33 2 32.17 0.70 0.496
Self-efficacy total 45.48 2 22.74 0.51 0.602 Grade x praise x feedback source
Motivation total 15.65 2 7.83 0.17 0.843
Self-efficacy total 57.03 2 28.51 0.64 0.530 Error Motivation total 20,635.53 450 45.86 Self-efficacy total 20,153.53 450 44.79 Total Motivation total 1,093,802.00 462 Self-efficacy total 933,365.00 462 Corrected total Motivation total 21,274.73 461 Self-efficacy total 21,157.55 461
Note. R-squared = .030 (adjusted R-squared = .006); R-squared = .047 (adjusted R-squared = .024).
53
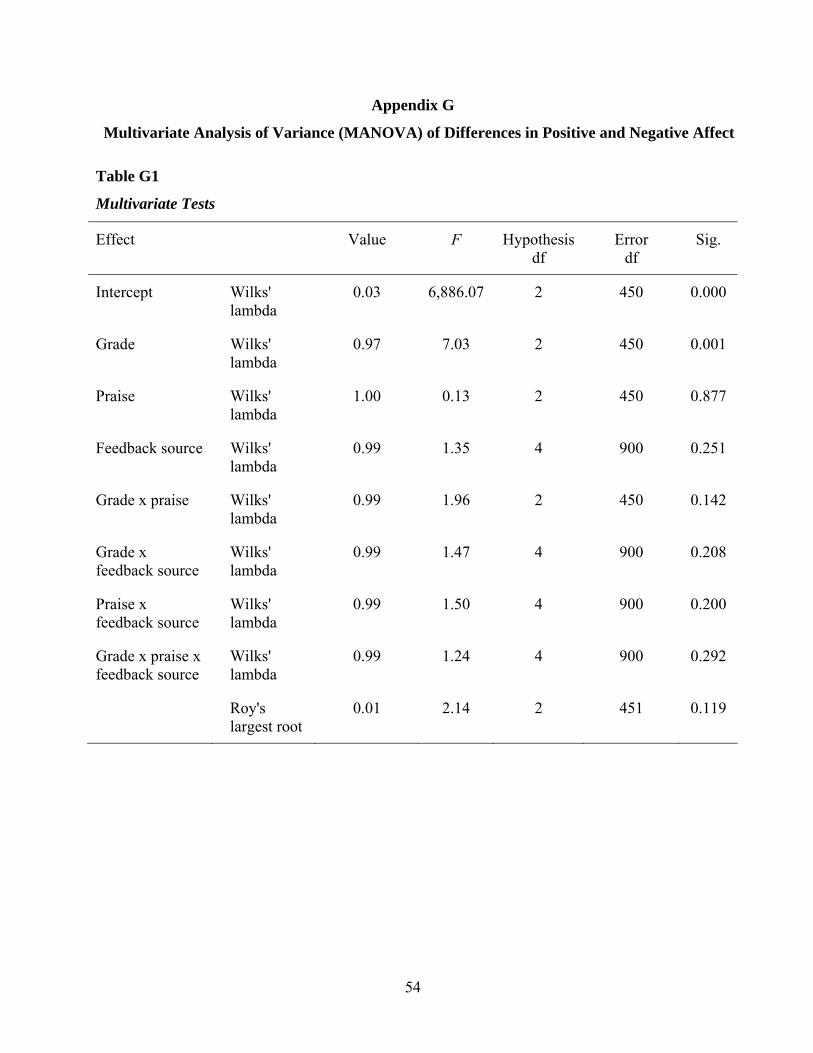
Appendix G
Multivariate Analysis of Variance (MANOVA) of Differences in Positive and Negative Affect
Table G1
Multivariate Tests
Effect Value F Hypothesis df
Error df
Sig.
Intercept Wilks' lambda
0.03 6,886.07 2 450 0.000
Grade Wilks' lambda
0.97 7.03 2 450 0.001
Praise Wilks' lambda
1.00 0.13 2 450 0.877
Feedback source Wilks' lambda
0.99 1.35 4 900 0.251
Grade x praise Wilks' lambda
0.99 1.96 2 450 0.142
Grade x feedback source
Wilks' lambda
0.99 1.47 4 900 0.208
Praise x feedback source
Wilks' lambda
0.99 1.50 4 900 0.200
Grade x praise x feedback source
Wilks' lambda
0.99 1.24 4 900 0.292
Roy's largest root
0.01 2.14 2 451 0.119
54

Table G2
Tests of Between-Subjects Effects
F Source Dependent variable
SS df MS Sig.
Corrected model PA scale score 727.41 11 66.13 1.29 0.225 NA scale score 1,446.54 11 131.50 2.41 0.006 Intercept PA scale score 411,721.64 1 411,721.64 8,055.85 0.000 NA scale score 266,466.13 1 266,466.13 4,886.51 0.000 Grade PA scale score 3.24 1 3.24 0.06 0.801 NA scale score 768.32 1 768.32 14.09 0.000 Praise PA scale score 9.83 1 9.83 0.19 0.661 NA scale score 3.03 1 3.03 0.06 0.814 Feedback source PA scale score 67.04 2 33.52 0.66 0.520 NA scale score 236.48 2 118.24 2.17 0.116 Grade x praise PA scale score 60.55 1 60.55 1.18 0.277 NA scale score 136.44 1 136.44 2.50 0.114 Grade x feedback source
PA scale score 268.19 2 134.09 2.62 0.074
NA scale score 46.10 2 23.05 0.42 0.656 Praise x feedback source
PA scale score 148.95 2 74.48 1.46 0.234
NA scale score 149.39 2 74.70 1.37 0.255 Grade x praise x feedback source
PA scale score 162.86 2 81.43 1.59 0.204
NA scale score 86.44 2 43.22 0.79 0.453 Error PA scale score 23,049.90 451 51.11 NA scale score 24,593.46 451 54.53 Total PA scale score 436,467.00 463 NA scale score 292,728.00 463 Corrected total PA scale score 23,777.30 462 NA scale score 26,040.00 462
Note. R-squared = .031 (adjusted R-squared = .007); R-squared = .056 (adjusted R-squared = .033).
55
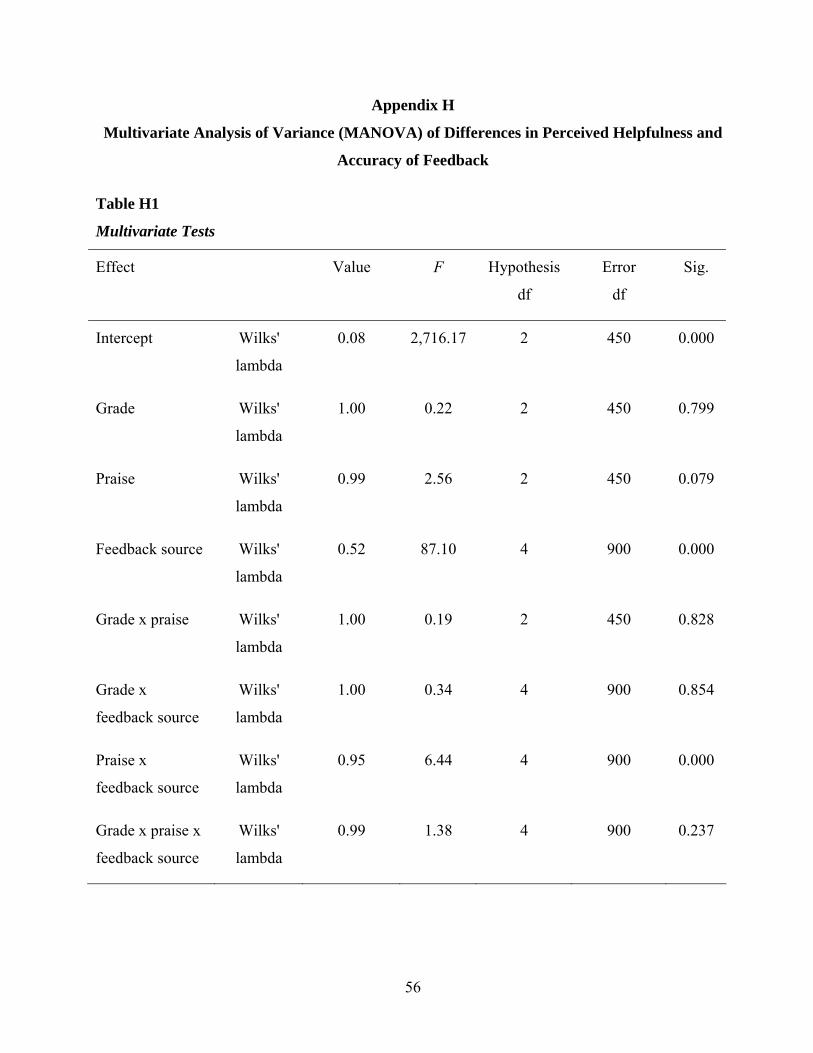
Appendix H
Multivariate Analysis of Variance (MANOVA) of Differences in Perceived Helpfulness and
Accuracy of Feedback
Table H1
Multivariate Tests
Effect Value F Hypothesis
df
Error
df
Sig.
Intercept Wilks'
lambda
0.08 2,716.17 2 450 0.000
Grade Wilks'
lambda
1.00 0.22 2 450 0.799
Praise Wilks'
lambda
0.99 2.56 2 450 0.079
Feedback source Wilks'
lambda
0.52 87.10 4 900 0.000
Grade x praise Wilks'
lambda
1.00 0.19 2 450 0.828
Grade x
feedback source
Wilks'
lambda
1.00 0.34 4 900 0.854
Praise x
feedback source
Wilks'
lambda
0.95 6.44 4 900 0.000
Grade x praise x
feedback source
Wilks'
lambda
0.99 1.38 4 900 0.237
56

Table H2
Tests of Between-Subjects Effects
Source Dependent variable
SS df MS F Sig.
Corrected model Accuracy 625.59 11 56.87 25.42 0.000 Helpfulness 943.18 11 85.74 38.09 0.000
Intercept Accuracy 10,922.79 1 1,0922.79 4,881.63 0.000 Helpfulness 10,478.60 1 1,0478.60 4,654.85 0.000
Grade Accuracy 0.81 1 0.81 0.36 0.548 Helpfulness 0.15 1 0.15 0.07 0.798
Praise Accuracy 5.33 1 5.33 2.38 0.123 Helpfulness 0.01 1 0.01 0.01 0.942
Feedback source Accuracy 586.14 2 293.07 130.98 0.000 Helpfulness 928.00 2 464.00 206.12 0.000
Grade x praise Accuracy 0.34 1 0.34 0.15 0.697 Helpfulness 0.00 1 0.00 0.00 0.983
Grade x feedback source
Accuracy 2.79 2 1.39 0.62 0.537
Helpfulness 1.16 2 0.58 0.26 0.773
Praise x feedback source
Accuracy 19.29 2 9.64 4.31 0.014
Helpfulness 0.81 2 0.40 0.18 0.836
Grade x praise x feedback source
Accuracy 8.11 2 4.06 1.81 0.164
Helpfulness 12.26 2 6.13 2.72 0.067
Error Accuracy 1,009.13 451 2.24 Helpfulness 1,015.25 451 2.25
Total Accuracy 12,530.00 463 Helpfulness 12,412.00 463
Corrected total Accuracy 1,634.72 462 Helpfulness 1,958.44 462
Note. R-squared = .383 (adjusted R-squared = .368); R-squared = .482 (adjusted R-squared = .469).
57