Response of particle number concentrations to Clean Air ...
47
1 Response of particle number concentrations to Clean Air Action: Lessons from the first long-term aerosol measurements in a typical urban valley, West China Suping Zhao a,b,c,d , Ye Yu a,b,c , Jianglin Li a,b,c , Daiying Yin e,f , Shaofeng Qi a,f , Dahe Qin d 5 a Key Laboratory of Land Surface Process and Climate Change in Cold and Arid Regions, Northwest Institute of Eco-Environment and Resources, Chinese Academy of Sciences, Lanzhou 730000, China b Pingliang Land Surface Process & Severe Weather Research Station, Pingliang, 744015, China c Gansu Land Surface Process & Severe Weather Observation and Research Station, Pingliang, 744015, China 10 d State Key Laboratory of Cryospheric Science, Northwest Institute of Eco-Environment and Resources, Chinese Academy of Sciences, Lanzhou 730000, China e Key Laboratory of Desert and Desertification, Northwest Institute of Eco-Environment and Resources, Chinese Academy of Sciences, Lanzhou 730000, China f University of Chinese Academy of Sciences, Beijing 100049, China 15 Correspondence to: Suping Zhao ([email protected]); Ye Yu ([email protected]) Abstract. The strictest ever Clean Air Action (CAA) has been implemented by Chinese government since 2013 to alleviate the severe haze pollution. The PM2.5 mass concentration was found to be largely reduced in response to emission mitigation policies, but response of particle number concentrations (PNCs) to CAA was less evaluated in the previous studies, which may be largely different from PM2.5 20 mass due to newly formed particle impacts. In this work, the first in-situ observation of particle number size distributions (PNSDs) during 2012-2019 in urban Lanzhou was used to analyze long-term PNCs variations and CAA impacts. The average number of particles in nucleation (N13-25, particle number in the size range of 13-25 nm), Aitken (N25-100, particle number in the size range of 25-100 nm) and accumulation (N100-800, particle number in the size range of 100-800 nm) modes were respectively 25 2514.0 cm -3 , 10768.7 cm -3 , and 3258.4 cm -3 , and N25-100 accounted for about 65.1% of total PNCs during the campaign. K-means clustering technique was used to classify the hourly mean PNSDs into six clusters, and each cluster corresponded to a specific source and influencing factor. The polluted clusters governed the winter PNCs before 2016, and their occurrence was less and less frequent after 2016, which was largely dominated by reduction in primary emissions. However, the contribution of 30 new particle formation (NPF) events to summer N13-25 decreased from 50% to about 10% during 2013 to 2015, and then increased to reach around 60% in 2019. The trends of size-resolved PNCs for each
Transcript of Response of particle number concentrations to Clean Air ...

1
Response of particle number concentrations to Clean Air
Action: Lessons from the first long-term aerosol
measurements in a typical urban valley, West China
Suping Zhao a,b,c,d, Ye Yu a,b,c, Jianglin Li a,b,c, Daiying Yin e,f, Shaofeng Qi a,f, Dahe
Qin d 5
a Key Laboratory of Land Surface Process and Climate Change in Cold and Arid Regions, Northwest
Institute of Eco-Environment and Resources, Chinese Academy of Sciences, Lanzhou 730000, China
b Pingliang Land Surface Process & Severe Weather Research Station, Pingliang, 744015, China
c Gansu Land Surface Process & Severe Weather Observation and Research Station, Pingliang, 744015,
China 10 d State Key Laboratory of Cryospheric Science, Northwest Institute of Eco-Environment and Resources,
Chinese Academy of Sciences, Lanzhou 730000, China
e Key Laboratory of Desert and Desertification, Northwest Institute of Eco-Environment and Resources,
Chinese Academy of Sciences, Lanzhou 730000, China
f University of Chinese Academy of Sciences, Beijing 100049, China 15
Correspondence to: Suping Zhao ([email protected]); Ye Yu ([email protected])
Abstract. The strictest ever Clean Air Action (CAA) has been implemented by Chinese government
since 2013 to alleviate the severe haze pollution. The PM2.5 mass concentration was found to be largely
reduced in response to emission mitigation policies, but response of particle number concentrations
(PNCs) to CAA was less evaluated in the previous studies, which may be largely different from PM2.5 20
mass due to newly formed particle impacts. In this work, the first in-situ observation of particle number
size distributions (PNSDs) during 2012-2019 in urban Lanzhou was used to analyze long-term PNCs
variations and CAA impacts. The average number of particles in nucleation (N13-25, particle number in
the size range of 13-25 nm), Aitken (N25-100, particle number in the size range of 25-100 nm) and
accumulation (N100-800, particle number in the size range of 100-800 nm) modes were respectively 25
2514.0 cm-3, 10768.7 cm-3, and 3258.4 cm-3, and N25-100 accounted for about 65.1% of total PNCs
during the campaign. K-means clustering technique was used to classify the hourly mean PNSDs into
six clusters, and each cluster corresponded to a specific source and influencing factor. The polluted
clusters governed the winter PNCs before 2016, and their occurrence was less and less frequent after
2016, which was largely dominated by reduction in primary emissions. However, the contribution of 30
new particle formation (NPF) events to summer N13-25 decreased from 50% to about 10% during 2013
to 2015, and then increased to reach around 60% in 2019. The trends of size-resolved PNCs for each
2
cluster were quantified by Theil-Sen regression. The size-segregated PNCs exhibited downward trends
for all clusters during 2012-2015, especially in spring. The annual relative slopes of spring PNCs varied
from -54.7% to -17.2%, -42.6% to -14.1%, and -40.7% to -17.5% per year for 13-25, 25-100, and
100-800 nm size ranges, and the reduction in the polluted clusters was much larger than NPF clusters.
The ultrafine particle number was increased and the amplitude was much greater during 2016-2019. 5
The annual relative slopes of N13-25 varied between 8.0% in fall and 135.5% in spring for NPF cluster.
In response to CAA, the increased daytime net radiation, higher ambient temperature and lower relative
humidity at noon for NPF events also could partly explain the higher N13-25 induced by the more
frequent nucleation events after 2016, especially in spring. The air mass were mainly from the adjacent
regions of urban Lanzhou and less affected by long-range transport for NPF events, and the thus 10
particles were not easily grown by coagulation during transport processes, which was helpful for
occurrence of NPF events. Therefore, some effective control measures cooperatively controlled particle
number and mass should be took for the Chinese megacities.
15
20

3
1 Introduction
China has been experienced large-scale and long-lasting winter haze pollution due to fast-growing
economy and urbanization in past decades. The high concentration of aerosols perturb radiative balance
of the atmosphere and surface by directly scattering and absorbing solar radiation, or indirectly alter
cloud optical properties and lifetime serving as condensation nuclei and ice nuclei (Andreae and 5
Rosenfeld, 2008; Gao et al., 2015; Li et al., 2017). The adverse effect of deteriorated air quality on
public health is of the greatest concern in China (Hu et al., 2017; Lelieveld et al., 2015). The present air
quality standards consider particle mass instead of number concentration (WHO, 2000). However,
compared with the larger aerosol particles, the ultrafine particles (UFPs, diameter < 100 nm) scarcely
contribute to aerosol mass, while they share the largest number fraction in urban areas (Hussein et al., 10
2004; Wehner et al., 2004). The toxicity of UFPs is enhanced by the large surface area due to high
number concentrations, and they can penetrate deep into lungs, ending up in the blood circulation
(Oberdörster et al., 2005; Schmid and Stoeger, 2016).
Aerosol ability to efficiently scatter or absorb light depends not only on their chemical composition but 15
on their sizes as well (Asmi et al., 2013). Liu et al. (2020) indicated that coating plays an important role
in light absorption. The amplification of black carbon absorption by the coating increased from 1.21 to
1.75 with increasing aerodynamic diameter (Dae) due to the thicker coating of BC-containing particles
with a larger Dae. Their study highlights the strong dependence of the microphysical and optical
properties of BC on size. The more recent study of Zhao et al. (2021) found that interdecadal AOD was 20
negative trend from 2009 to 2018, which may be related to the variation in particle size distribution.
Some aerosol monitoring networks were established around the world for long-term measurements of
climate-relevant aerosol properties, such as Geophysical Monitoring for Climate Change (GMCC,
Bodhaine, 1983) and Global Atmospheric Watch (GAW, Rose et al., 2021). The particle number
concentration (PNCs) and size distributions (PNSDs), considered to be a primary indicator of human 25
impacts on atmospheric composition, was the main aerosol property measured at the networks. Based
on long-term in-situ measurements at the network sites, many studies on particle number and size
distributions have been conducted since the 1990s in Europe and North America (Asmi et al., 2011;
Birmili et al., 2016; Dal Maso et al., 2008; Heintzenberg et al., 2011; Krecl et al., 2017; Kulmala et al.,
2004; Makela et al., 1997; Sun et al., 2020; Wiedensohler et al., 2012). Their studies indicated that the 30

4
annual, weekly and diurnal cycles largely depended on station type and geographic location. The more
recent study of Schmale et al. (2018) also well illustrated the importance of measuring the PNSD over
long enough time periods in contrasting micro-environments for the understanding of aerosol-climate
interactions and the improvement of their representation in numerical models. Sun et al. (2020)
determined long-term trends of PNCs during 2009-2018 for 16 sites ranging from roadside to high 5
Alpine environments, and the annual relative slope varied from -17.2% to -1.7%, -7.8% to -1.1%, and
-11.1% to -1.2% per year for 10-30 nm, 30-200 nm and 200-800 nm size bins, respectively. The
downward trends of PNCs were found to be dominated by the reductions in various anthropogenic
emissions, while meteorology impacts were less important or negligible. However, a few long-term
PNSD measurements in the developing countries mainly concentrated on urban Beijing since 2004 10
(Wang et al., 2013; Wehner et al., 2004), the North China Plain since 2008 (Shen et al., 2011), and
Mount Waliguan since 2005 (Kivekas et al., 2009). Aitken mode particles (25-100 nm) were found to
be accounted for about half of total PNCs in urban areas in China (Wu et al., 2008), and number in
accumulation mode (100-1000 nm) was around 4 times higher than that in the developed countries
(Wehner et al., 2008; Wu et al., 2008), indicating that largely different PNSD characteristics in China 15
from Europe and North America.
PM2.5 (particulate matter with aerodynamic diameter less than 2.5 μm) decreased by 30%-50% across
China over the 2013-2018 period in response to Air Pollution Prevention and Control Action Plan
(APPCAP) in 2013 implemented by Chinese central government (Zhai et al., 2019). Compared with 20
PM2.5 mass concentrations, the particle number concentrations were more directly affected by newly
formed particles (Dal Maso et al., 2008; Dinoi et al., 2021), and new particle formation (NPF) events
contributed about 54% of total PNCs in Leipzig, Germany (Ma and Birmili, 2015). Guo et al. (2014)
tried to reveal the causal connection between NPF and haze pollution, and reported that NPF trends to
precede winter haze episodes in Beijing. The more recent study by Kulmala et al. (2021) found that 25
over 65% of the number concentrations of haze particles resulted from NPF events in Beijing, and their
findings suggested that almost all present-day haze episodes originated from NPF, mainly since
primary emission considerably decreased during recent year. PNSDs were considered to be better
indicators of the strength of emission sources (Vu et al., 2015), but they were more easily modulated by
aerosol dynamic processes, such as nucleation, coagulation, volatilisation and condensations (Birmili et 30

5
al., 2010; Kulmala, 2003). Nucleation and coagulation were largely affected by coagulation sink
(CoagS), and CoagS significantly decreased due to large reduction of PM2.5 mass concentrations in
response to APPCAP. Therefore, response of particle number concentration in different size bins to
emission mitigation policies may be different from PM2.5 mass concentration.
5
The long-term PNSDs measurements were mainly conducted before APPCAP in China, and it has been
less reported that the response of particle number concentrations to the strictest ever air pollution
control policies implemented by Chinese central government. Lanzhou, as one of the most polluted
cities around the world at special basin terrain, obtained Today’s Transformative Step 2015 awarded by
the United Nations due to significant improvement in urban air quality (Zhao et al., 2018). The 10
atmospheric horizontal and vertical dispersion conditions inside the basin are poor due to weak winds
and strong multi-layer temperature inversion induced by basin terrain (Pandolfi et al., 2014). Therefore,
the air pollutants were easily trapped inside the basin and hard to disperse to the upper air. Furthermore,
basin aerosol pollution was largely controlled by vertical than horizontal dispersion as compared to the
plain (Zhao et al., 2019). Based on a unique PNSD dataset for the period of 2012-2019 at urban 15
Lanzhou in West China, this study investigates the long-term trends of PNCs in different modes, to
evaluate the role of emission reduction and meteorology in PNC variations. The results of this study
may be important for the policymakers to cooperatively prevent and control heavy particle mass and
number concentrations in Chinese megacities.
20
2 Data and methods
2.1 Measurement site descriptions
Lanzhou, located at the intersection of Tibetan Plateau, Losses Plateau and Mongolia Plateau, is in a
long valley running from the east to the west. The urban area is encircled by the hills rising from 200 m
to 600 m, and thus formed saddle-shaped basin terrain (Figure 1). The weak winds and multi-layer 25
temperature inversion occurred frequently due to terrain impacts, and thus the air pollutants are trapped
inside the basin (Chu et al., 2008). It was thought to be one of the most polluted cities around the world
(WHO, 2014), and photochemical smog episode (PSE) was observed in the 1980s at Xigu District of
urban Lanzhou, which was the first time PSE was observed in China (Chen et al., 1986). The
observation campaign was conducted from September 2012 to August 2019 on the rooftop of a 32-m 30

6
high research building of the Northwest Institute of Eco-Environment and Resources (NIEER), Chinese
Academy of Sciences. There are two major roads with traffic volume more than 2000 cars per hour
near the observation site (Figure 1). The NIEER is surrounded by residential and commercial buildings,
and there are no local industrial sources around the site (Zhao et al., 2015a), and thus the measurement
site can represent urban background. 5
2.2 PNSD, criteria air pollutants and meteorology data
5-min particle number concentrations and size distributions (13-800 nm) were measured continuously
by scanning mobility particle sizer (Model 3936, TSI, USA) for about 7 years at the urban site from
September 2012 to August 2019. The aerosol and sheath flowrates were set to 0.3 L min-1 and 3 L min-1, 10
respectively. The sampling inlet was mounted 1.5 m above the rooftop. The diffusional and
gravitational losses for the inlet lines of SMPS were calibrated during the campaign. The SMPS’s
mobility was calibrated with monodisperse aerosols prior to their deployment in the field. The impactor
was cleaned every day and aerosol and sheath rates were examined with a bubble flow meter to insure
the good performance of the instrument. The each PNSD was parameterized with a least-square 15
log-normal fitting method providing parameters of 2-3 log-normal modes (Birmili et al., 2001). Three
modes (i = 1, 2, 3) were used corresponding to the nucleation mode (13-25 nm), Aitken mode (25-100
nm) and accumulation mode (100-800 nm), respectively. The log-normal distribution is expressed as
(Seinfeld and Pandis, 2006):
2
,
21
log logexp
log 2 log 2 log
n p ipi
ip i i
D DNdN
d D
(1) 20
where Ni is the total number concentration of the mode i, D___
p ,i is the median diameter of mode i, σi is
the geometric mean standard deviation of the distribution and n is the number of the modes. The
symbol of log means log10 in this study.
The hourly averaged concentrations of the criteria air pollutants (PM2.5, PM10, SO2, NO2, O3, CO) were 25
measured at Lanzhou Biologicals Institute, which is around 2.8 km away from the observation site. SO2,
NO2, CO and O3 are measured by the ultraviolet fluorescence method, the chemiluminescence method,
the non-dispersive infrared absorption method and the UV-spectrophotometry method, respectively.

7
PM2.5 and PM10 are measured by micro oscillating balance method. The 10-min meteorological
parameters including temperature, relative humidity, wind speed and direction, precipitation and
raindrop size distribution, and solar radiation were monitored by an automatic meteorological station
co-located with the observation site. All the on-line data were hourly averaged and presented at local
time (Beijing Time = UTC+8) throughout this paper. 5
2.3 Identification of NPF events and calculation of the relevant parameters
Referred to the methods presented in Dal Maso et al. (2005), NPF events were identified for a day.
Number concentration sharply increased in the nucleation mode size range (13-25 nm) and prevailed
for at least an hour. Additionally, the particle size was required to increase during the next few hours. 10
The parameters describing NPF events such as formation and growth rates (JD, GR and hereafter),
condensation and coagulation sink (CS, CoagS and hereafter) were calculated in this study. GR can be
calculated with the time evolution of geometric mean diameter (GMD) of the nucleation mode obtained
by parameterizing PNSD, and it can be expressed as
dGMDGR
dt (2) 15
The formation rates (JD) can be calculated by the below equation:
nucD coag
dNJ F
dt (3)
where the first term in the right hand side (dNnuc/dt) represents the observed change of in number
concentration of newly formed particles (Zhao et al., 2021). The second term is the loss of newly
formed particles induced by coagulation scavenging, and can be obtained with the below equation: 20
coag nuc nucF CoagS N (4)
Coagulation sink of nucleation mode particles (CoagSnuc) is defined as
' ' ',p p p p pCoagS D K D D n D dD (5)
where K(D’p, Dp) is the coagulation coefficient of particles with sizes of Dp and D’
p, calculated by the
method of Fuchs (1964). The reference size (Dp) is assumed to be the GMD of the nucleation mode. An 25
average CoagSnucNnuc over each formation period was taken during the campaign.
The condensation sink (CS) can be expressed as
域代码已更改
域代码已更改
域代码已更改
域代码已更改

8
, ,2 m p i p i iCS D D D N (6)
where Dp,i and Ni are particle diameter and the corresponding number concentration in size class i. D is
the diffusion coefficient of the condensing vapor, usually assumed to be sulfuric acid. βm represents a
transition-regime correction (Kulmala et al., 2012),
2
1
1 1.677 1.333m
Kn
Kn Kn
(7) 5
defined as a function of the Knudsen number, Kn = 2λ/Dp,i. Furthermore, based on the method presented
in Dada et al. (2020), H2SO4 proxy was calculated to estimate the changes in the NPF precursors over
the study period, and the equation was given as follows.
1 22
2 9
2 4 9 9 9H SO 1.6 10 GlobRad
2 9.9 10 2 9.9 10 9.9 10
SOCS CS
(8)
where CS was calculated by Equation (6). SO2 concentrations are measured by the ultraviolet 10
fluorescence method, and Global radiation (GlobRad) was measured by an SMP3 pyranometer (Kipp
and Zonen, the Netherlands) during the campaign. In addition, the peak sizes of PNSDs are determined
as mode diameters.
2.32.4 Trend analysis methods 15
Referring to the method used in the study of Sun et al. (2020), a customized Sen-Theil trend estimator
was used to analyze the long-term trends of PNCs in nucleation, Aitken, and accumulation modes, the
concentrations of the criteria air pollutants and meteorological parameters in this study. The technique
can calculate the true slope of the parameters by considering the impact of their seasonal, weekly and
diurnal cycles, and avoid the effect of outliers and missing values. The change rates for the hourly or 20
daily time series can be calculated with the below equation:
,i k
x i t x im
t
(29)
Where k is the integer. Δt is equal to the product of k and 364 days (52 weeks), indicating that data
points from two different years are compared only if they were measured in the same hour of the day,
day of the week, and season the year. 25
2.42.5 Cluster analysis methods
域代码已更改
域代码已更改
域代码已更改

9
To extract some more valuable information, K-means clustering method used in various studies has
been considered to be a preferred technique for data analysis in environmental fields (Sabaliauskas et
al., 2013; Tunved et al., 2004). The K-means clustering routine split the multi-dimensional data into
predefined number of subgroups, and clusters are as different as possible from each other, but as
homogeneous as possible within themselves, by iteratively minimizing the sum of squared Euclidean 5
distances from each member to its cluster centroid. Cluster analysis was used to divide hourly mean
PNSDs during the campaign into several groups with comparable particle number in different size bins
within groups. The K-means clustering algorithm available in MATLAB© was used in this study. Based
on the rule with maximum inter-cluster and minimum intra-cluster variances, the determination of
number of clusters, a very complicated problem, was conducted by statistical software SAS© in this 10
study, which was given in detail in the study of Zhao et al. (2016).
3 Results and discussion
A continuous 7.5 years dataset was evaluated in this investigation. Except the instrument maintenance
and re-location, 80% of the data was effective. The continuous PNSD dataset was integrated to 15
calculate PNCs in different size bins. In this study, diameter ranges for the nucleation mode, Aitken
mode, and accumulation mode were determined as 13-25 nm, 25-100 nm, and 100-800 nm,
respectively (Dal Maso et al., 2005). The total PNCs covered from 13 nm to 800 nm in mobility
diameter.
20
3.1 Overview of the particle number concentration
Sources and origins of particles in the three modes may be largely varied at a specific
micro-environments. Nucleation mode particles are from atmospheric nucleation events which is
closely related to the low volatile condensable gases such as water and sulfuric acid and growth of the
smaller aerosol particles (Kulmala, 2003). Aitken mode particles are primarily emitted from 25
combustion processes, such as coal combustion for domestic heating in wintertime, and also from
hygroscopic growth and coagulation of nucleation mode particles. For relatively clean environment, the
growth of nucleation mode particles is predominant due to less coagulation sink (Rose et al., 2021),
while the primary emissions are more important at the highly polluted urban areas (Hussein et al.,
2004). Accumulation mode particles originate from coagulation and hygroscopic growth of Aitken 30

10
mode particles and long-range transport from the highly polluted areas.
Figure 2 shows variation of particle number in nucleation mode (N13-25), Aitken mode (N25-100), and
accumulation mode (N100-800), aerosol optical properties (AOD, Alpha), criteria air pollutants (PM2.5, O3,
SO2, and NO2) and basic meteorological parameters (wind speed, relative humidity, temperature, net 5
radiation) during the entire measurement campaign. The probability density functions and the
corresponding statistical parameters also were given in Figure 2. The mean PM2.5 and O3, SO2, NO2
concentrations were 49.9 μg m-3, 44.8 μg m-3, 22.7 μg m-3 and 57.5 μg m-3 during 2014-2019, and mean
values of wind speed, temperature, relative humidity, and net radiation were 1.6 m s-1, 10.9 oC, and
44.6%, and 44.4 W m-2, respectively. The mean values for N13-25, N25-100, and N100-800 were 2514.0 cm-3, 10
10768.7 cm-3, and 3258.4 cm-3, respectively. Aitken mode particles, accounting for 65.1% of total
PNCs, were significantly higher than the other modes, and the differences were much larger than the
results at European cities (Cusack et al., 2013; Leoni et al., 2018), urban Beijing (Wu et al., 2008) and
North China Plain (Shen et al., 2011), which may be related with the fact that the particles in 3-12 nm
and 800-1000 nm were not covered in nucleation and accumulation mode for our measurement 15
campaign. The average particle number size distribution (PNSD) surface plots in four seasons for each
year during the campaign are presented in Figures S1-S4 to highlight the overall similarities and
differences of each year during the study period. The mode diameter of PNSD shifted to smaller
particle size in four seasons from 2012 to 2019. Particle number in Aitken and accumulation modes
declined largely in autumn and winter during the study periods maybe due to the even strictest emission 20
control policies in recent years. However, in spring and summer, the nucleation mode particle number
increased significantly after 2016, which can be partly modulated by NPF events. The impacts of
emission control and NPF events will be discussed in the below sections in more details. The
nucleation mode particles also can grow to Aitken mode by coagulation and hygroscopicity when they
were transported from the primary emissions at the ground surface to the sampling location due to the 25
much higher sampling height compared to the other studies. The mean PM2.5 and O3, SO2, NO2
concentrations were 49.9 μg m-3, 44.8 μg m-3, 22.7 μg m-3 and 57.5 μg m-3 during 2014-2019, and mean
values of wind speed, temperature, relative humidity, and net radiation were 1.6 m s-1, 10.9 oC, and
44.6%, and 44.4 W m-2, respectively.
30

11
Until now, numerous measurements of sub-micron PNSDs have been carried out at a variety of
locations to examine their variations and key influencing factors. Table 1 summarizes experimentally
determined particle number concentrations in the troposphere for the measurement campaigns
conducted longer than 1 year across the globe. The mean number concentrations in the three modes
were much lower than that in urban Beijing (Wang et al., 2013), and significantly higher than that at a 5
remote background station, Mt. Waliguan, one of global GAW sites in China (Kivekas et al., 2009). The
sub-micron particle number concentration was much lower compared to the most polluted cities in
India, such as Delhi (Gani et al., 2020) and Kanpur (Kanawade et al., 2014), especially Aitken and
accumulation modes. Number of the particles in Aitken and accumulation modes at Asian cities were
even higher than that at the urban site in Europe and North America, which may be largely related to 10
poor visibility at Asian cities according to Mie scattering theory. For nucleation mode, the situation is
opposite, which may be because newly formed particles rapidly scavenged by coagulation with a
mount of the larger particles at highly polluted cities (von Bismarck-Osten et al., 2013; Wang et al.,
2011).
15
3.2 Trends of PNCs, criteria air pollutants, and meteorological parameters
Besides primary emissions from human activities at urban areas, particle number concentration was
easily affected by secondarily new-formed particles, which was closely related to meteorological
conditions such as temperature, relative humidity and new radiation (Zhao et al., 2015a). Figure S5
Figure 3 shows inter-annual variations of monthly averaged particle numbers, criteria air pollutants and 20
wind speed during 2012-2019, and normalizes the time series data (N13-25, N25-100, N100-800, PM2.5, O3,
SO2, NO2, and wind speed) to fix values to equal 100 at the beginning of September 2012. The particle
number in the three size ranges declined largely during 2012-2015 (Period I), and summer N13-25
decreased by around 75% in 2015 compared to that in 2013, while that in winter less varied during
Period I. The N25-100 and N100-800 reduced more in winter than that in summer due to emission control 25
impacts. The number in nucleation mode particles (N13-25) increased significantly during 2016-2019
(Period II), which was consistent with O3 while showed the opposite trend with declining PM2.5 during
Period II. The strongly declining aerosol radiative effect due to the strict air pollution controls resulted
in an unprecedented rapid increasing trend in surface solar radiation over China during 2014-2019 (Shi
et al., 2021), which maybe promote formation of secondary air pollutants. 30
12
The particle number in the Aitken and accumulation modes (N25-100, N100-800) firstly increased during
2016-2017 and then decreased from 2018 to 2019, and their variations were consistent with the primary
emitted pollutants (SO2, NO2), indicating that N25-100 and N100-800 variations during 2016-2018 were
mainly modulated by primary emissions. Sun et al. (2020) analyzed the long-term trends of particle 5
number concentrations at 16 observational sites in Germany from 2009 to 2018, and number
concentrations of particles in the three modes were found to be significant decreasing trends in
response to emission mitigation policies. The contrasting response of nucleation mode particle to
mitigation policies between China and Germany may be related to the fact that more reduction of
coagulation sink due to the ever strictest Clean Air Action in China, and thus NPF event easily occurred 10
due to less coagulation scavenging effects (Gani et al., 2020). The variation in wind speed was not
significant during the entire measurement campaign.
In view of the contrasting PNC trends between Periods I and II, the below analyses compared mean
diurnal and annual variations of particle number in the three size bins (N13-25, N25-100, and N100-800), 15
PM2.5 and O3 as wind directions before and after January 2016 (Figures 3, S6-S9Figures 4, S1-S4). The
most obvious increase in N13-25 was during 12:00-16:00 in summer months after January 2016
compared to before January 2016, and the largest increase corresponded to easterly, southerly and
southwesterly winds, especially for the annual cycles with the more significantly increased N13-25 for
southeasterly winds. The large CPF values of N13-25 mainly corresponded to southerly winds (Figure 20
S10Figure 5), which can support the above results. N25-100 difference between the two periods
(2012-2015 vs. 2016-2019) was much less significant than N13-25, and the most obvious N25-100 increase
occurred in morning and evening rush hours for northeasterly winds (Figure S6Figure S1), which could
be supported by the results of polar plots (Figure S10Figure 5). Figure 4Figure 6 illustrated mean
particle number size distributions by varying wind directions, and number in Aiken mode particles for 25
north northeasterly winds (0° - 45°) was largely higher than that for the other wind directions. The
emissions from jammed traffic and winter domestic heating with traditional stoves at Keji Street, about
500 m away from the sampling site, could be transported to the station as northeasterly winds. In
addition, the larger increase in N25-100 at 13 p.m. for easterly, southerly and southwesterly winds was
consistent with N13-25 possibly due to new-formed particle growth impacts. 30
13
The N100-800 and PM2.5 trends from Period I to II in diurnal and annual cycles were opposite to N13-25
with the significant reduction at noon in summer months for southerly winds (Figures S7, S8
andS10Figures 5, S2 and S3), which was mainly affected by Clean Air Action (Li et al., 2021). Gani et
al. (2020) studied particle number concentrations and size distributions in a polluted megacities of 5
Delhi in India, and pointed out that strategies that only target accumulation mode particles (which
constitute much of the fine PM2.5 mass) may even lead to an increase in the UFP concentrations as the
coagulation sink decreases. Furthermore, O3 increased more significantly in the afternoon in summer
months after than before January 2016, and wind directions for the largest increased O3 concentrations
were consistent with nucleation mode particles (Figure S9Figure S4), which further confirmed that the 10
increased N13-25 from Period I to II was induced by more frequent nucleation events. Compared with
before January 2016, the more favorable meteorological conditions after January 2016 such as the
much drier air (Figure S5Figure S5), higher ambient temperature (Figure S5Figure S5) and stronger
solar radiation (Figure S12Figure S6) for southerly winds also helped to form new particles, which
could be supported by our previous work in the same site (Zhao et al., 2015a). 15
3.3 Typical particle number size distributions influenced by varying factors
Besides chemical composition of airborne particles, the information derived from particle number size
distributions (PNSDs) is beginning to play an important role in source apportionment studies (Vu et al.,
2015) due to the obvious difference of diameters for the particles from varying sources. The hourly 20
average PNSDs during the entire measurement campaign were classified into six clusters by K-means
clustering technique, and mean PNSD for each typical type was showed in Figure 5Figure 7. As
showed in Figure 5Figure 7, the shape and mode diameter of PNSDs were largely different among the
Clusters. Mode diameters varied from ~ 20 nm for Cluster B to 70 nm for Cluster F, and more than a
quarter of PNSDs was sorted into Cluster A with mode diameter of ~ 55 nm, while Cluster B less 25
occurred with mode diameter of ~ 20 nm. The sources and key factors influencing each cluster of
PNSD can be better determined by averagely annual and diurnal variations of occurrence frequencies,
and the corresponding air pollutants and meteorological parameters for the Clusters (Figure 6Figure 8,
Tables 2 and 3).
30

14
About 70% of Clusters A and F is in the cold seasons (October-December, and January-March) with the
almost opposite diurnal pattern between the two Clusters (Figure 6Figure 8). Clusters A and F had the
highest number concentrations of accumulation mode particles (N100-800) and mass concentrations of
particulate matter (PM2.5, PM10) and gaseous pollutants (SO2, NO2, CO), while the lowest particle
number in nucleation mode (N13-25) and O3 mass concentrations among the clusters (Table 2), 5
suggesting that the two polluted clusters may be mainly impacted by primary emissions from human
activities, and was defined and abbreviated as “Pollut_C” in the below analyses. That also can be
confirmed by larger geometric median diameters for the three modes (GMDnuc, GMDAit, and GMDacc)
than that for the other clusters, and the high particle number concentrations in morning and evening
rush hours (Figure S13Figure S7). Compared with other clusters, the weaker winds and net radiation, 10
lower ambient temperature, and higher relative humidity indicated that the severe air pollution for
Clusters A and F was significantly affected by stable air and poor diffusion conditions. Furthermore, as
illustrated in Figure 7Figure 9, Cluster F (A) accounted for more than 40% (60%) of all clusters during
five hours after occurrence of Cluster A (F), and the more frequently synchronous occurrence between
Clusters A and F maybe related to the pollution process from “light-severe-light” episodes. From the 15
perspectives of inter-annual variations in occurrence frequency, the Pollut_C increasingly less occurred
from 2014 to 2019 possibly due to implementation of Clean Air Action (Figure 6AFigure 8A), which
will be analyzed in detail in the following section.
The Clusters B and E mainly appeared in the daytime in the warmer months, and occurrence frequency 20
had a sharp peak in the afternoon (Figures 6B and 6CFigures 8B and 8C), and the peak for Cluster E
lagged around two hours than that for Cluster B. The frequency of Cluster E during two hours after
occurrence of Cluster B was larger than 80%, and mode diameter of Cluster E (~ 30 nm) was only
larger than that of Cluster B (~ 20 nm), and thus it was inferred that Cluster B represented secondarily
new particle formation (NPF) event impacts, while Cluster E was influenced by subsequently new 25
particle growth events. The inference could be confirmed by the highest particle number in nucleation
mode and O3 mass concentration among the clusters (Table 2). The sharply increased nucleation mode
particles at 9:00 was followed by a subsequent growth to accumulation mode indicated by the typical
“banana-shaped” temporal development of the number size distribution (Figure S13Figure S7, Boy and
Kulmala, 2002), which also supported the above inference. In addition, the less coagulation sink such 30
15
as low number concentrations of particles in accumulation mode, and low PM2.5 and PM10 mass
induced by higher wind speed helped to form secondarily new particles (Tables 2 and 3). The more
recent study of Gani et al. (2020) investigated particle number concentrations and size distribution in a
polluted megacity: the Delhi, and found that reduction in mass concentration in the highly polluted
megacity may not produce a proportional reduction in PNCs, and may even lead to an increase in the 5
UFP concentrations as the coagulation sink decreases. The mean AOD of 0.39 for Cluster B was
significantly lower than that for the other clusters (Table 2), which resulted in the higher atmospheric
transparency and thus stronger net radiation (223.55 W m-2) and higher ambient temperature (20.77 °C).
The drier air was conducive to detecting NPF events and newly formed particles grown hard by
hygroscopic growth under low RH environments. The occurrence frequency for the two clusters first 10
reduced from 2013 to 2015 and then increased until 2019, which contrasted with the “Pollut_C” during
the campaign. Clusters B and E were abbreviated as “NPF_C” for the following analyses.
The mean PNSD for Cluster C was much wider and more flat than that for the other clusters and thus it
was hard to determine the mode diameter, especially for the PNSDs from dawn to noon (Figures 5 and 15
S13Figures 7 and S7). The number of particles in nucleation mode (N13-25) was only lower than NPF_C
while that in accumulation mode (N100-800) was only lower than Pollut_C. The cluster was more easily
occurred in the morning in the warm months, which was consistent with most of the clusters except the
polluted Clusters A and F. Additionally, except for Cluster F, the occurrence frequency of the other
clusters was comparable and ranged from about 15% to 28% during 1-12 hours after Cluster C. The 20
frequency of Cluster C also less varied during 1-12 hours after Clusters A, D, E and F (Figure 7Figure
9). Combined the above fact with the modest concentrations of particle number in the three modes,
criteria air pollutants and meteorological parameters, it was inferred Cluster C representing urban
background PNSD, and thus it was defined as “UB_C” in the following analyses. Cluster D more
frequently occurred in the morning and evening rush hours in the warm seasons (Figure 6Figure 8), and 25
the correspondingly mean particle number in Aitken mode (N25-100) was the second highest ever-just
behind Cluster A, which may be impacted by motor vehicle emissions from the nearby roads. The
mode diameter of ~ 40 nm was only larger than NPF_C (Clusters A and E), and it appeared frequently
after Cluster E with the high concentration of particles in Aitken mode in the afternoon (Figure
S13Figure S7) possibly due to new particle growth impacts. Therefore, Cluster D was jointly 30

16
influenced by motor vehicle emissions and NPF events, and was defined as “VE_NPF_C” in the
following section.
From the perspectives of the variation in mode diameter among the clusters (Figure 5Figure 7) and the
variation in frequency during 1-12 hours after each cluster (Figure 7Figure 9), the NPF_C was closely 5
followed by Pollut_C during the measurement campaign, and the clusters can be ranked by temporal
order as “B→E→D→A→F”. Therefore, NPF events significantly contributed to haze episodes in the
subsequent 1–2 days, which may be increasingly obvious mainly due to considerably decreased
emissions of primary particles during recent years in response to Clean Air Action. Guo et al. (2014)
first reported that atmospheric NPF tends to precede winter haze episodes in Beijing, and then the latest 10
study of Kulmala et al. (2021) investigate how NPF and subsequent particle growth affect the initial
steps of haze formation in Beijing. Their findings showed that reducing the subsequent growth rate of
freshly formed particles by a factor of 3–5 would delay the buildup of haze episodes by 1–3 days.
3.4 Impact of Clean Air Action on PNC variations 15
The response of PM2.5 mass to Clean Air Action has been evaluated in many previous studies, and
PM2.5 was found to be decreased by 30%-50% across China during 2013-2018 due to the
implementation of emission control policies (Zhai et al., 2019). The impact of the policies on particle
number may be more complex as compared to PM mass since more fine particles cannot rapidly grow
by coagulation with the reduced coarse particles (Gani et al., 2020). However, the response of PNCs to 20
the restricted emissions was only analyzed by some short-term measurements during some important
and international meetings and activities such as the summer Olympic Games in 2008 and the
Asia-Pacific Economic Cooperation (APEC) in 2014 and China's V-Day parade in 2015 (Chen et al.,
2015; Shen et al., 2016; Wang et al., 2013). The Long-term in-situ measurements of PNSDs and mass
concentrations of the criteria air pollutants was essential to understand the emission control impacts and 25
to reveal the mechanism. Figures 8, S14 and S15Figures 10, S8 and S9 show trends of daily mean
particle number in the three modes as wind directions for each cluster based on 7.5 years measurement.
The number of particles in nucleation mode (N13-25) first decreased from 2012 to 2015, and then
increased rapidly after 2016. The N13-25 changing trend for NPF_C (Clusters B and E) was more
significant as compared with that for the other clusters, especially for southeasterly winds. The specific 30

17
winds corresponded to more PM2.5 reduction on summer afternoon after than before 2016 due to impact
of emission mitigation policies (Figure S8Figure S3), and thus NPF events, represented by NPF_C,
were easily detected by chemical reactions due to reduced coagulation sink. The more solar radiation
reached near-surface air as a result of reduced PM2.5 mass (Shi et al., 2021), and thus ambient
temperature increased and relative humidity declined (Figure S11Figures S5 and S6), which also 5
favored occurrence of NPF events (Zhao et al., 2015a).
At our sampling site, N25-100 was easily influenced by growth of newly formed particles and primary
emissions from human activities. The N25-100 trends was similar with N13-25 for Clusters B, D and E, and
the increasing trends also were more significant after 2016 for southwesterly winds (Figure S14Figure 10
S8), which represented NPF impacts. Dependence of N25-100 on wind directions was not obvious for
Clusters A, C and F, and thus the trends may be related to variations in primary emissions. Unlike
nucleation and Aitken modes, particle number in accumulation mode (N100-800) less depended on wind
directions. Furthermore, N100-800 was the lowest and less varied for NPF_C, while that for Clusters A, C
and D had similar trend with N25-100, and that for Cluster F, the most polluted cluster, was downward 15
trend during the campaign due to implementation of the strictest ever Clean Air Action. Therefore, the
response of particle number to air pollution control may be largely different for each size fraction,
which may be closely related to the variations in coagulation sink and meteorological conditions
induced by reduced primary emissions. That will be discussed in detail in the following section.
20
To better evaluate variations in particle number concentrations and emission control impacts, Figures
S16, S17 and S18Figures 11, S10 and S11 show variations of contributions of each cluster to monthly
averaged PNCs in 13-25 nm, 25-100 nm and 100-800 nm during the campaign, respectively. Pollut_C
(Clusters A and F) dominated the winter PNCs in different size bins before 2016, and their occurrence
was less and less frequent after 2016, especially for the most polluted Cluster F, which was largely 25
dominated by reduction in primary emissions. Contrasting to Pollut_C, as a main cluster representing
NPF events, the contribution of Cluster B to summer N13-25 decreased from 50% to about 10% during
2013 to 2015, and then increased to reach around 60% in 2019. For Cluster C representing urban
background, its frequency less varied during the entire measurement campaign. The particle number
was dominated by primary emissions before 2016, and thereafter that was controlled by NPF events, 30

18
which was partly due to emission control. In response to air pollution control, the reduction in coarse
particles could promote secondary new particle formation by reduced coagulation sink (Gani et al.,
2020). NPF events were largely dependent on PM mass concentrations mainly contributed by coarse
aerosol particles. Accumulation mode particle number concentrations in cities of developing countries
are generally higher than that in many western cities (Gani et al., 2020; Wu et al., 2008), and thus the 5
response of NPF events to emission control may be largely different between the cities of developed
and developing countries. For example, Sun et al. (2020) found that coincidently downward trends of
particle number and black carbon mass concentrations at 16 observational sites in Germany from 2009
to 2018 due to reduced anthropogenic emissions. Gani et al. (2020) pointed out that strategies that only
target accumulation mode particles in a polluted megacity in India may even lead to an increase in the 10
UFP concentrations as the coagulation sink decreases. Shen et al. (2016) also found that PM1 mass
concentration was significantly reduced while NPF event frequency was much higher during short-term
emission control period.
We also quantitatively evaluated the changing trends of particle number in the three modes by 15
Theil-Sen regression. In view of the contrasting trends, the observation period was divided into two
sub-periods, i.e., before and after January 2016. Figures 9 and 10Figures 12 and 13 illustrated seasonal
and diurnal variations of trends of PNCs for each cluster during each sub-period. For Period I
(2012-2015), PNCs in the three size bins exhibited downward trends for all clusters, especially in
spring. The annual relative slopes of spring PNCs varied from -54.7% for Cluster F to -17.2% for 20
Cluster B, -42.6% for Cluster A to -14.1% for Cluster B, and -40.7% for Cluster A to -17.5% for
Cluster B per year for 13-25, 25-100, and 100-800 nm size ranges (Figure 9Figure 12). The PNCs for
Pollut_C (Clusters A and F) decreased by about 40% in the morning and evening rush hours, which was
much higher than that in the other hours of day. Therefore, the more reduction in PNCs for Pollut_C
may be closely related to emission control policies. The much larger PNC reduction in this study than 25
that in Germany may be due to implementation of the stricter ever emission mitigation policies in
Chinese cities (Sun et al., 2020). Contrary to Period I, the UFPs number was increased and the
amplitude was greater during Period II (2016-2019). The annual relative slopes of N13-25 varied between
5.1% (fall) and 314.4% (winter), 8.0 (fall) and 135.5% (spring), 11.3% (fall) and 184.3% (winter), -4.5
(fall) and 59.1% (summer), 6.3% (fall) and 30.3% (spring), and 3.6% (fall) and 15.7% (spring) for 30

19
Clusters A-F. The maximum increase of N13-25 was in the spring afternoon for NPF_C, which may be
governed by NPF events due to reduced coagulation sink corresponding to low N100-800. The winter
N13-25 was increased significantly for Cluster A during Period II, especially in the morning and evening
rush hours, suggesting the impact of primary emissions from motor vehicles. The annual slope of
N100-800 less varied as compared to that of ultrafine particles in seasonal and diurnal cycles. 5
To better analyze long-term trend of NPF event and the relevant parameters during 2012-2019, Figure
11 illustrates the inter-annual statistics of the trends of NPF frequency, mode diameter, and formation
and growth rates. Furthermore, condensation and coagulation sink (CS, CoagS) and H2SO4 proxy were
also calculated over the study period. Similar with the opposite N13-25 trend between the two contrasting 10
periods (Figures 8-9), the occurrence frequency of NPF events decreased from ~ 30% to less than 5%
until 2016 and then increased to more than 30% in 2019. The particle has been becoming much finer
since 2015 due to more frequent NPF events (Figure 11B). The temporal variations of PNCs in
nucleation mode (dNnuc/dt, Figure 11C) and coagulation scavenging effect (Fcoag, Figure 11D) followed
similar inter-annual variations of NPF frequency. The contribution of coagulation loss flux Fcoag to total 15
observed rate was on average 37%, which was close to the average ratio of coagulation loss to
formation rate in urban Beijing, 0.41 (Yue et al., 2010), suggesting that coagulation loss was the same
important as dNnuc/dt. The formation rate (JD) ranged from 0.2 to 16.2 cm-3 s-1 in urban Lanzhou, which
was lower than the observations at some urban sites, such as in Beijing, 3.3-81.4 cm-3 s-1 (Wu et al.,
2007), St. Louis, with the mean value of 17.0 cm-3 s-1 (Qian et al., 2007), but much higher than that in 20
regional nucleation episodes 0.01-10 cm-3 s-1 at the most other sites (Kulmala et al., 2004).
Compared with JD, GR varied less in inter-annual scale, and ranged from 0.5 to 14.9 nm h-1, slightly
higher than that in urban Beijing, 0.3-11.2 nm h-1 (Wu et al., 2007), and also within the range of typical
particle growth rate 1-20 nm h-1 in mid-latitudes (Kulmala et al., 2004). The inter-annual variation of 25
condensation sink (CS) was consistent with that of NPF frequent and formation rate with the range
between 7.3×10⁻⁴ and 5.1×10⁻² s-1 with mean value of 1.4×10⁻² s-1 (Figure 11F), which was comparable
with the calculated value of 0.02 s-1 during NPF events in the North China Plain (Shen et al., 2011).
Based on the method presented in Dada et al. (2020), we also calculated H2SO4 proxy to estimate the
changes in the NPF precursors over the study period (Figure 11G). The H2SO4 proxy varied from 30

20
3.3×10⁷ to 6.0×108 cm-3 with average concentration of 2.5×108 cm-3 over the study period, which was
slightly higher than that in urban Beijing (Dada et al., 2020) due to more coal combustion and basin
terrain in urban Lanzhou.
3.5 Role of meteorology and air masses 5
NPF events predominantly occurred under dry and sunny weather conditions (Birmili and
Wiedensohler, 2000; Kerminen et al., 2018). According to a relatively recent review on regional NPF in
different environments of the global troposphere, the observed factors that favor the occurrence of
regional NPF include a high intensity of solar radiation, low RH, high gas-phase sulfuric acid
concentration, and low pre-existing aerosol loading (Kerminen et al., 2018). The possible reasons for 10
the apparently close connection between the ambient RH and occurrence of NPF have been proposed,
including the typically negative feedback of high RH on the solar radiation intensity, photochemical
reactions and atmospheric lifetime of aerosol precursor vapors. The effect of the ambient temperature
(T) on NPF shows very different responses between different studies, which is probably related to the
simultaneous presence of several temperature-dependent processes that may either enhance or suppress 15
NPF. Therefore, the meteorological parameters affect NPF process by modulating the condensation and
coagulation sink. Figures 12 and S19Figures 14 and 15 show the diurnal and inter-annual variations in
meteorological parameters such as net radiation, temperature, relative humidity, and wind speed and
direction for each cluster during the campaign to better understand response of PNCs to meteorology.
The peak of net radiation and N13-25 coincided at noon for NPF_C, and their peaks were largely higher 20
than that for the other clusters (Figure 12Figure 14). The increased daylight net radiation for Cluster B
also could partly explain the higher N13-25 induced by the more frequent NPF events after 2016,
especially in spring (Figures S19 and S20Figures 15 and S12). The higher ambient temperature and
lower relative humidity at noon and the larger daily ranges for NPF_C also indicated that dry and hot
air in sunny day was conducive to form new particles. In addition, NPF events corresponding to large 25
southeasterly winds may be because accumulation mode particles were dispersed and diluted by strong
winds and thus coagulation sink decreased, which can be supported by the above results. According to
empirically based mathematical function between number concentrations of fine particles (FP, diameter
<2.5 μm) and meteorological variables, Hussein et al. (2006) found that the predicted number
concentrations of accumulation mode particles follow this relationship more closely than those of 30

21
UFP’s due to the origin and type of aerosol particles in the accumulation mode size range, being mainly
regional and long-range transported. The main limitation of the mathematical function in their study
was during NPF events, indicating that particles in nucleation and accumulation modes were differently
dependent on meteorological variables.
5
A general finding was that changes in aerosol were related to air mass changes (Birmili et al., 2001),
and dust aerosols from Gobi Deserts at Hexi Corridor could be transported to Lanzhou and affected
urban PM pollution (Zhao et al., 2015b). Figure S21Figure 16 illustrates gridded back trajectory
frequencies with hexagonal binning for each cluster to explore the impacts of air mass on variations of
particle number. The huge discrepancy of back trajectory frequencies among the six clusters suggested 10
that the air mass history has a significant impact on urban particle number concentrations and size
distributions. For example, back trajectories were mainly from the adjacent regions of urban Lanzhou
and less affected by long-range transport for NPF_C, and the thus particles were not easily grown by
coagulation during transport processes, which was conducive to occurrence of NPF events. In urban
Beijing, Wang et al. (2013) also indicated that mean total PNCs from north directions were higher than 15
the air masses that came from other directions, while more volume concentrations were observed for
the air masses from the southwest and the south. Therefore, particle number size distributions in urban
Lanzhou were partly affected by air mass conditions.
4 Summary and conclusions 20
The first in-situ observations of particle number size distributions (PNSDs) in the size range of 13-800
nm were conducted from 2012 to 2019 in urban Lanzhou, a typical valley city in west China.
Meanwhile, the mass concentrations of the criteria air pollutants (PM2.5, PM10, O3, SO2, NO2, and CO),
AOD and meteorological variables (temperature, relative humidity, wind speed and direction and net
radiation) also were measured during the campaign. The customized Sen-Theil trend estimator and 25
K-means clustering technique were used to explore the trends of PNCs and the criteria air pollutants,
and to reveal the contributions of variations in primary emissions due to Clean Air Action and
secondary formation to PNCs. Some novel findings were obtained as follows.
The mean values for particle number in nucleation (N13-25), Aitken (N25-100) and accumulation modes 30
22
(N100-800) were respectively 2514.0 cm-3, 10768.7 cm-3, and 3258.4 cm-3, and N25-100 accounted for about
65.1% of total PNCs during the campaign. The particle number in the three modes declined largely
during 2012-2015 such as summer N13-25 decreased by around 75% in 2015 compared to that in 2013.
However, N13-25 increased significantly during 2016-2019, which was consistent with O3 while showed
the opposite trend with declining PM2.5 during the period. The most obvious increase in N13-25 was 5
during 12:00-16:00 in summer months, and the largest increase corresponded to easterly, southerly and
southeasterly winds. The N25-100 and N100-800 firstly increased during 2016-2017 and then decreased until
2019, and their variations were consistent with the primary emitted pollutants (SO2, NO2). N25-100
difference between the two periods (2012-2015 vs. 2016-2019) was much less significant than N13-25,
and the most obvious N25-100 increase occurred in morning and evening rush hours for northeasterly 10
winds. In diurnal and annual cycles, the N100-800 and PM2.5 trends for the two periods were opposite to
N13-25 with the significant reduction at noon in summer months for southerly winds, and thus decreased
coagulation sink was conducive to occurrence of NPF events.
K-means clustering technique was used to classify the hourly average PNSDs into six clusters during 15
the measurement campaign. The shape and mode diameter of PNSDs were largely different among the
clusters with varying mode diameters from ~ 20 nm to 70 nm. According to the annual and diurnal
variations of occurrence frequency, PNSD, the corresponding air pollutants and meteorological
parameters, the sources and key influencing factors were determined for each cluster. The two most
polluted clusters (A and F), Pollut_C, were mainly affected by the primary emissions from human 20
activities and poor diffusion conditions. Cluster B was followed by Cluster E, and N13-25 had a sharp
peak in the afternoon in the warm months, and thus the two clusters represented new particle formation
and growth event impacts. Cluster C suggested urban background PNSD, while Cluster D was jointly
affected by motor vehicle emissions and NPF events. The response of particle number to air pollution
control was largely different for each size fraction, which may be closely related to the variations in 25
coagulation sink and meteorological conditions induced by reduced primary emissions. Based on trends
of daily mean particle number in the three modes as wind directions for each cluster, the contributions
of primary emissions and secondary formation to PNCs were evaluated in this study. The southeasterly
winds corresponded to more PM2.5 reduction on summer afternoon in response to emission control
policies and thus more solar radiation reached ground surface, which promoted NPF occurrence due to 30

23
decreased coagulation sink. The polluted clusters governed the winter PNCs before 2016, and their
occurrence was less and less frequent after 2016, which was largely dominated by reduction in primary
emissions. However, the contribution of NPF events to summer N13-25 decreased from 50% to about 10%
during 2013 to 2015, and then increased to reach around 60% in 2019.
5
Theil-Sen regression was used to quantitatively evaluate the changing trends of size-resolved PNCs,
and they exhibited downward trends for all clusters during 2012-2015, especially in spring. The annual
relative slopes of spring PNCs varied from -54.7% for Cluster F to -17.2% for Cluster B, -42.6% for
Cluster A to -14.1% for Cluster B, and -40.7% for Cluster A to -17.5% for Cluster B per year for 13-25,
25-100, and 100-800 nm size ranges. The UFPs number was increased and the amplitude was greater 10
during 2016-2019. The annual relative slopes of N13-25 varied between 5.1% (fall) and 314.4% (winter),
8.0 (fall) and 135.5% (spring), 11.3% (fall) and 184.3% (winter), -4.5 (fall) and 59.1% (summer), 6.3%
(fall) and 30.3% (spring), and 3.6% (fall) and 15.7% (spring) for Clusters A-F. The increased daytime
net radiation, higher ambient temperature and lower relative humidity at noon for NPF events also
could partly explain the higher N13-25 induced by the more frequent nucleation events after 2016, 15
especially in spring. The air mass history had a significant impact on urban PNSDs. The back
trajectories were mainly from the adjacent regions of urban Lanzhou and less affected by long-range
transport for NPF events, and the thus particles were not easily grown by coagulation during transport
processes, which was helpful for occurrence of NPF events. In this study, the measurement campaign
was conducted at a Chinese cities in west China, but the similar PNCs trends and influencing factors 20
should be expected in other Chinese cities. In future work, we will established the PNSD observation
network in some megacities to better evaluate the response of PNCs to emission mitigation policies in
China.
Author contributions. Suping Zhao and Ye Yu designed the study. Suping Zhao analyzed the data with help from 25
Ye Yu and Dahe Qin. Daiying Yin and Longxiang Dong collected and analyzed particle number size distributions
and meteorology data during the campaign. Jianglin Li conducted the field experiment.
Competing interests. The authors declare that they have no conflict of interest.
30
24
Acknowledgement. The study is supported by National Natural Science Foundation of China (42075185;
41605103), Youth Innovation Promotion Association, CAS (2017462), Gansu Science and Technology Program
(20JR10RA037; 18JR2RA005), CAS “Light of West China” Program, and the Excellent Post-Doctoral Program
(2016LH0020).
5
References
Andreae, M. O., and Rosenfeld, D.: Aerosol-cloud-precipitation interactions. Part 1. The nature and
sources of cloud-active aerosols, Earth-Science Reviews, 89(1-2), 13-41, 2008.
Asmi, A., Wiedensohler, A., Laj, P., Fjaeraa, A.-M., Sellegri, K., Birmili, W., Weingartner, E.,
Baltensperger, U., Zdimal, V., Zikova, N., Putaud, J.-P., Marinoni, A., Tunved, P., Hansson, H.-C., 10
Fiebig, M., Kivekas, N., Lihavainen, H., Asmi, E., Ulevicius, V., Aalto, P. P., Swietlicki, E., Kristensson,
A., Mihalopoulos, N., Kalivitis, N., Kalapov, I., Kiss, G., de Leeuw, G., Henzing, B., Harrison, R. M.,
Beddows, D., O’Dowd, C., Jennings, S. G., Flentje, H., Weinhold, K., Meinhardt, F., Ries, L., and
Kulmala, M.: Number size distributions and seasonality of submicron particles in Europe 2008–2009,
Atmospheric Chemistry and Physics, 11, 5505–5538, 2011. 15
Asmi, A., Collaud Coen, M., Ogren, J. A., Andrews, E., Sheridan, P., Jefferson, A., Weingartner, E.,
Baltensperger, U., Bukowiecki, N., Lihavainen, H., Kivekäs, N., Asmi, E., Aalto, P. P., Kulmala, M.,
Wiedensohler, A., Birmili, W., Hamed, A., O'Dowd, C., G Jennings, S., Weller, R., Flentje, H., Fjaeraa,
A. M., Fiebig, M., Myhre, C. L., Hallar, A. G., Swietlicki, E., Kristensson, A., and Laj, P.: Aerosol
decadal trends – Part 2: In-situ aerosol particle number concentrations at GAW and ACTRIS stations, 20
Atmospheric Chemistry and Physics, 13, 895–916, https://doi.org/10.5194/acp-13-895-2013, 2013.
Birmili, W., and Wiedensohler, A.: New particle formation in the continental boundary layer:
Meteorological and gas phase parameter influence, Geophysical Research Letters, 27, 3325-3328,
2000.
Birmili, W., Wiedensohler, A., Heintzenberg, J., and Lehmann, K.: Atmospheric particle number size 25
distribution in central Europe: Statistical relations to air mass and meteorology, Journal of Geophysical
Research, 32, 5–18, 2001.
Birmili, W., Heinke, K., Pitz, M., Matschullat, J., Wiedensohler, A., Cyrys, J., Wichmann, H.-E., and
Peters, A.: Particle number size distributions in urban air before and after volatilization, Atmospheric
Chemistry and Physics, 10, 4643–4660, 2010. 30

25
Birmili, W., Weinhold, K., Rasch, F., Sonntag, A., Sun, J., Merkel, M., Wiedensohler, A., Bastian, S.,
Schladitz, A., Löschau, G., Cyrys, J., Pitz, M., Gu, J. W., Kusch, T., Flentje, H., Quass, U., Kaminski,
H., Kuhlbusch, T. A. J., Meinhardt, F., Schwerin, A., Bath, O., Ries, L., Gerwig, H., Wirtz, K., and
Fiebig M.: Long-term observations of tropospheric particle number size distributions and equivalent
black carbon mass concentrations in the German Ultrafine Aerosol Network (GUAN), Earth System 5
Science Data, 8, 355–382, 2016.
Bodhaine, B. A.: Aerosol measurements at four background sites, Journal of Geophysical Research,
88(C15), 10753–10768, doi:10.1029/JC088iC15p10753, 1983.
Boy, M. and Kulmala, M.: Nucleation events in the continental boundary layer: influence of physical
and meteorological parameters, Atmospheric Chemistry and Physics, 2, 1–16, 2002. 10
Chen, C., Sun, Y. L., Xu, W. Q., Du, W., Zhou, L. B., Han, T. T., Wang, Q. Q., Fu, P. Q., Wang, Z. F.,
Gao, Z. Q., Zhang, Q., and Worsnop, D. R.: Characteristics and sources of submicron aerosols above
the urban canopy (260 m) in Beijing, China during 2014 APEC summit, Atmospheric Chemistry and
Physics, 15, 12879–12895, 2015.
Chen, C. H., Huang, J. G., Ren, Z. H., and Peng, X. A.: Meteorological conditions of photochemical 15
smog pollution during summer in Xigu industrial area, Acta Scientiae Circumstantiae (in Chinese), 6(3),
334–342, 1986.
Chu, P. C., Chen, Y. C., Lu, S. H., Li, Z. C., and Lu Y. Q.: Particulate air pollution in Lanzhou China,
Environment International, 34, 698–713, 2008.
Cusack, M., Perez, N., Pey, J., Alastuey, A., and Querol, X.: Source apportionment of fine PM and 20
sub-micron particle number concentrations at a regional background site in the western Mediterranean:
a 2.5 year study, Atmospheric Chemistry and Physics, 13, 5173–5187, 2013.
Dada, L., Ylivinkka, I., Baalbaki, R., Li, C., Guo, Y., Yan, C., Yao, L., Sarnela, N., Jokinen, T.,
Daellenbach, K. R., Yin, R., Deng, C., Chu, B., Nieminen, T., Wang, Y., Lin, Z., Thakur, R. C.,
Kontkanen, J., Stolzenburg, D., Sipilä, M., Hussein, T., Paasonen, P., Bianchi, F., Salma, I., Weidinger, 25
T., Pikridas, M., Sciare, J., Jiang, J., Liu, Y., Petäjä, T., Kerminen, V.-M., and Kulmala, M.: Sources and
sinks driving sulfuric acid concentrations in contrasting environments: implications on proxy
calculations, Atmospheric Chemistry and Physics, 20, 11747–11766, 2020.
Dal Maso, M., Kulmala, M., Riipinen, I., Wagner, R., Hussein, T., Aalto, P. P., and Lehtinen, K. E. J.:
Formation and growth of fresh atmospheric aerosols: eight years of aerosol size distribution data from 30

26
SMEAR II, Hyytiala, Finland, Boreal Environment Research, 10, 323–336, 2005.
Dal Maso, M., Hyvärinen, A., Komppula, M., Tunved, P., Kerminen, V.-M., Lihavainen, H., Öviisanen,
Y., Hansson, H.-C., and Kulmala, M.: Annual and interannual variation in boreal forest aerosol particle
number and volume concentration and their connection to particle formation, Tellus B: Chemical and
Physical Meteorology, 60(4), 495–508, 2008. 5
Dinoi, A., Weinhold, K., Wiedensohler, A., and Contini, D.: Study of new particle formation events in
southern Italy, Atmospheric Environment, 244, 117920, 2021.
Fuchs, N. A.: The mechanics of aerosols. Pergamon, 1964.
Gani, S., Bhandari, S., Patel, K., Seraj, S., Soni, P., Arub, Z., Habib, G., Hildebrandt Ruiz, L., and Apte,
J. S.: Particle number concentrations and size distribution in a polluted megacity: the Delhi Aerosol 10
Supersite study, Atmospheric Chemistry and Physics, 20, 8533–8549, 2020.
Gao, Y., Zhang, M., Liu, Z., Wang, L., Wang, P., Xia, X., Tao, M., and Zhu, L.: Modeling the feedback
between aerosol and meteorological variables in the atmospheric boundary layer during a severe
fog-haze event over the North China Plain, Atmospheric Chemistry and Physics, 15(8), 4279–4295.
https://doi.org/10.5194/acp-15-4279-2015, 2015. 15
Guo, S., Hu, M., Zamora, M. L., Peng, J., Shang, D., Zheng, J., Du, Z., Wu, Z., Shao, M., Zeng, L.,
Molina, M. J., and Zhang, R. Y.: Elucidating severe urban haze formation in China, Proceedings of the
National Academy of Sciences of the United States of America, 111(49), 17373-17378,
www.pnas.org/cgi/doi/10.1073/pnas.1419604111, 2014.
Heintzenberg, J., Birmili, W., Otto, R., Andreae, M. O., Mayer, J.-C., Chi, X., and Panov, A.: Aerosol 20
particle number size distributions and particulate light absorption at the ZOTTO tall tower (Siberia),
2006–2009, Atmospheric Chemistry and Physics, 11, 8703–8719, 2011.
Hu, J., Huang, L., Chen, M., Liao, H., Zhang, H., Wang, S., Zhang Q., and Ying Q.: Premature
mortality attributable to particulate matter in China: source contributions and responses to reductions,
Environmental Science and Technology, 51(17), 9950-9959, 2017. 25
Hussein, T., Puustinen, A., Aalto, P. P., Mäkelä, J. M., Hämeri, K., and Kulmala, M.: Urban aerosol
number size distributions, Atmospheric Chemistry and Physics, 4, 391–411, 2004.
Hussein, T., Karppinen, A., Kukkonen, J., Harkonen, J., Aalto, P. P., Hämeri, K., Kerminen, V.-M., and
Kulmala, M.: Meteorological dependence of size-fractionated number concentrations of urban aerosol
particles, Atmospheric Environment, 40, 1427–1440, 2006. 30
27
Kanawade, V. P., Tripathi, S. N., Bhattu, D., and Shamjad, P. M.: Sub-micron particle number size
distributions characteristics at an urban location, Kanpur, in the Indo-Gangetic Plain, Atmospheric
Research, 147-148, 121-132, 2014.
Kerminen, V.-M., Chen, X., Vakkari, V., Petäjä, T., Kulmala, M., and Bianchi, F.: Atmospheric new
particle formation and growth: review of field observations, Environmental Research Letters, 13, 5
103003, https://doi.org/10.1088/1748-9326/aadf3c, 2018.
Kivekas, N., Sun, J., Zhan, M., Kerminen, V.-M., Hyvarinen, A., Komppula, M., Viisanen, Y., Hong, N.,
Zhang, Y., Kulmala, M., Zhang, X.-C., Geer. D., and Lihavainen, H.: Long term particle size
distribution measurements at Mount Waliguan, a high-altitude site in inland China, Atmospheric
Chemistry and Physics, 9, 5461–5474, 2009. 10
Krecl, P., Johansson, C., Targino, A. C., Strom, J., and Burman, L.: Trends in black carbon and
size-resolved particle number concentrations and vehicle emission factors under real-world conditions,
Atmospheric Environment, 165, 155–168, 2017.
Kulmala, M.: How particles nucleate and grow, Science, 302, 1000–1001, 2003.
Kulmala, M., Vehkamäki, H., Petäjä, T., Dal Maso, M., Lauri, A., Kerminen, V. M., Birmili, W., and 15
McMurry, P. H.: Formation and growth rates of ultrafine atmospheric particles: a review of
observations. Journal of Aerosol Science, 35, 143–176, 2004.
Kulmala, M., Petaja, T., Nieminen, T., Sipila, M., Manninen, H. E., Lehtipalo, K., Dal Maso, M., Aalto,
P. P., Junninen, H., Paasonen, P., Riipinen, I., Lehtinen, K. E. J., Laaksonen, A., and Kerminen, V. M.:
Measurement of the nucleation of atmospheric aerosol particles, Nature Protocols, 7, 1651–1667, 2012. 20
Kulmala, M., Dada, L., Daellenbach, K. R., Yan, C., Stolzenburg, D., Kontkanen, J., Ezhova, E.,
Hakala, S., Tuovinen, S., Kokkonen, T. V., Kurppa, M., Cai, R. L., Zhou, Y., Yin, R., Baalbaki, R.,
Chan, T., Chu, B., Deng, C., Fu, Y., Ge, M. F., He, H., Heikkinen, L., Junninen, H., Liu, Y., Lu, Y., Nie,
W., Rusanen, A., Vakkari, V., Wang, Y., Yang, G., Yao, L., Zheng, J., Kujansuu, J., Kangasluoma, J.,
Petaja, T., Paasonen, P., Jarvi, L., Worsnop, D., Ding, A. J., Liu, Y., Wang, L., Jiang, J. K., Bianchi, F., 25
and Kerminen, V.-M.: Is reducing new particle formation a plausible solution to mitigate particulate air
pollution in Beijing and other Chinese megacities? Faraday Discussions, 226, 334-347, DOI:
10.1039/d0fd00078g, 2021.
Lelieveld, J., Evans, J. S., Fnais, M., Giannadaki, D. and Pozzer, A.: The contribution of outdoor air
pollution sources to premature mortality on a global scale, Nature, 525, 367, DOI: 30

28
10.1038/nature15371, 2015.
Leoni, C., Pokorna, P., Hovorka, J., Masiol, M., Topinka, J., Zhao, Y. J., Krumal, K., Cliff, S., Mikuska,
P., and Hopke, P. K.: Source apportionment of aerosol particles at a European air pollution hot spot
using particle number size distributions and chemical composition, Environmental Pollution, 234, 145–
154, 2018. 5
Li, J., Gao, W., Cao, L., Xiao, Y., Zhang, Y., Zhao, S., Liu, Z., Liu, Z., Tang, G., Ji, D., Hu, B., Song, T.,
He, L., Hu, M., and Wang, Y. S.: Significant changes in autumn and winter aerosol composition and
sources in Beijing from 2012 to 2018: Effects of clean air actions, Environmental Pollution, 268,
115855, 2021.
Li, Z., Rosenfeld, D., and Fan, J.: Aerosols and their impact on radiation, clouds, precipitation, and 10
severe weather events. Oxford Research Encyclopedias,
https://doi.org/10.1093/acrefore/9780199389414.013.126, 2017.
Liu, H., Pan, X. L., Wu, Y., Ji, D. S., Tian, Y., Chen, X. S., and Wang, Z. F.: Size-resolved mixing state
and optical properties of black carbon at an urban site in Beijing, Science of the Total Environment,
749, 141523, 2020. 15
Ma, N., and Birmili, W.: Estimating the contribution of photochemical particle formation to ultrafine
particle number averages in an urban atmosphere, Science of the Total Environment, 512/513, 154–166,
2015.
Makela, J. M., Aalto, P., Jokinen, V., Pohja, T., Nissinen, A., Palmroth, S., Markkanen, T., Seitsonen, K.,
Lihavainen, H., and Kulmala, M.: Observations of ultrafine aerosol particle formation and growth in 20
boreal forest, Geophysical Research Letters, 24, 1219–1222, 1997.
Oberdörster, G., Oberdörster, E., and Oberdörster, J.: Nanotoxicology: An emerging discipline evolving
from studies of ultrafine particles, Environmental Health Perspectives, 113, 823–839, 2005.
Pandolfi, M., Querol, X., Alastuey, A., Jimenez, J. L., Jorba, O., Day, D., Ortega, A., Cubison, M. J.,
Comerón, A., Sicard, M., Mohr, C., Prévôt, A. S. H., Minguillón, M. C., Pey, J., Baldasano, J. M., 25
Burkhart, J. F., Seco, R., Peñuelas, J., van Drooge, B. L., Artiñano, B., Di Marco, C., Nemitz, E.,
Schallhart, S., Metzger, A., Hansel, A., Lorente, J., Ng, S., Jayne, & J., and Szidat, S.: Effects of
sources and meteorology on particulate matter in the Western Mediterranean Basin: An overview of the
DAURE campaign, Journal of Geophysical Research: Atmospheres, 119, 4978–5010, 2014.
Qian, S., Sakurai, H., and McMurry, P. H.: Characteristics of regional nucleation events in urban East 30

29
St. Louis, Atmospheric Environment, 41, 4119–4127, 2007.
Rose, C., Collaud Coen, M., Andrews, E., Lin, Y., Bossert, I., Lund Myhre, C., et al.: Seasonality of the
particle number concentration and size distribution: a global analysis retrieved from the network of
Global Atmosphere Watch (GAW) near-surface observatories, Atmospheric Chemistry and Physics
Discussions, https://doi.org/10.5194/acp-2020-1311, 2021. 5
Sabaliauskas, K., Jeong, C.-H., Yao, X., Jun, Y.-S., and Evans, G.: Cluster analysis of roadside ultrafine
particle size distributions, Atmospheric Environment, 70, 64–74, 2013.
Schmale, J., Henning, S., Decesari, S., Henzing, B., Keskinen, H., Sellegri, K., Ovadnevaite, J., Pöhlker,
M. L., Brito, J., Bougiatioti, A., Kristensson, A., Kalivitis, N., Stavroulas, I., Carbone, S., Jefferson, A.,
Park, M., Schlag, P., Iwamoto, Y., Aalto, P., Äijälä, M., Bukowiecki, N., Ehn, M., Frank, G., Fröhlich, 10
R., Frumau, A., Herrmann, E., Herrmann, H., Holzinger, R., Kos, G., Kulmala, M., Mihalopoulos, N.,
Nenes, A., O'Dowd, C., Petäjä, T., Picard, D., Pöhlker, C., Pöschl, U., Poulain, L., Prévôt, A. S. H.,
Swietlicki, E., Andreae, M. O., Artaxo, P., Wiedensohler, A., Ogren, J., Matsuki, A., Yum, S. S.,
Stratmann, F., Baltensperger, U., and Gysel, M.: Long-term cloud condensation nuclei number
concentration, particle number size distribution and chemical composition measurements at regionally 15
representative observatories, Atmospheric Chemistry and Physics, 18, 2853–2881,
https://doi.org/10.5194/acp-18-2853-2018, 2018.
Schmid, O. and Stoeger, T.: Surface area is the biologically most effective dose metric for acute
nanoparticle toxicity in the lung, Journal of Aerosol Science, 99, 133–143, 2016.
Seinfeld, J. H. and Pandis, S. N.: Atmospheric chemistry and physics of air pollution, John Wiley and 20
Sons, Inc., New York, USA, 2006.
Shen, X. J., Sun, J. Y., Zhang, Y. M., Wehner, B., Nowak, A., Tuch, T., Zhang, X. C., Wang, T. T., Zhou,
H. G., Zhang, X. L., Dong, F., Birmili, W., and Wiedensohler, A.: First long-term study of particle
number size distributions and new particle formation events of regional aerosol in the North China
Plain, Atmospheric Chemistry and Physics, 11, 1565–1580, 2011. 25
Shen, X. J., Sun, J. Y., Zhang, X. Y., Zhang, Y. M., Zhang, L., Fan, R. X., Zhang, Z. X., Zhang, X. L.,
Zhou, H. G., Zhou, L. Y., Dong, F., and Shi, Q. F.: The influence of emission control on particle number
size distribution and new particle formation during China's V-Day parade in 2015, Atmospheric
Chemistry and Physics, 573, 409–419, 2016.
Shi, H. R., Zhang, J. Q., Zhao, B., Xia, X. A., Hu, B., Chen, H. B., Wei, J., Liu, M. Q., Bian, Y. X., Fu, 30

30
D. S., Gu, Y., and Liou, K.-N.: Surface Brightening in Eastern and Central China Since the
Implementation of the Clean Air Action in 2013: Causes and Implications, Geophysical Research
Letters, 48(3), e2020GL091105, 2021.
Stanier, C. O., Khlystov, A. Y., and Pandis, S. N.: Ambient aerosol size distributions and number
concentrationsmeasured during the Pittsburgh Air Quality Study (PAQS), Atmospheric Environment, 5
38, 275–3284, 2004.
Sun, J., Birmili, W., Hermann, M., Tuch, T., Weinhold, K., Merkel, M., Rasch, F., Müller, T., Schladitz,
A., Bastian, S., Löschau, G., Cyrys, J., Gu, J. W., Flentje, H., Briel, B., Asbach, C., Kaminski, H., Ries,
L., Sohmer, R., Gerwig, H., Wirtz, K., Meinhardt, F., Schwerin, A., Bath, O., Ma, N., and Wiedensohler,
A.: Decreasing trends of particle number and black carbon mass concentrations at 16 observational 10
sites in Germany from 2009 to 2018. Atmospheric Chemistry and Physics, 20, 7049–7068, 2020.
Tunved, P., Strom, J., and Hansson, H.-C.: An investigation of processes controlling the evolution of
the boundary layer aerosol size distribution properties at the Swedish background station aspvreten,
Atmospheric Chemistry and Physics, 4, 2581–2592, 2004.
von Bismarck-Osten, C., Birmili, W., Ketzel, M., Massling, A., Petäjä, T., and Weber, S.: 15
Characterization of parameters influencing the spatio-temporal variability of urban particle number size
distributions in four European cities, Atmospheric Environment, 77, 415-429, 2013.
Vu, T. V., Delgado-Saborit, J. M., and Harrison, R. M.: Review: Particle number size distributions from
seven major sources and implications for source apportionment studies, Atmospheric Environment, 122,
114–132, 2015. 20
Wang, Y., Hopke, P. K., Chalupa, D. C., and Utell, M. J.: Long-term study of urban ultrafine particles
and other pollutants, Atmospheric Environment, 45(40), 7672-7680, 2011.
Wang, Z. B., Hu, M., Wu, Z. J., Yue, D. L., He, L. Y., Huang, X. F., Liu, X. G., and Wiedensohler, A.:
Long-term measurements of particle number size distributions and the relationships with air mass
history and source apportionment in the summer of Beijing, Atmospheric Chemistry and Physics, 13, 25
10159–10170, 2013.
Wehner, B., Wiedensohler, A., Tuch, T. M., Wu, Z. J., Hu, M., Slanina, J., and Kiang, C. S.: Variability
of the aerosol number size distribution in Beijing, China: New particle formation, dust storms, and high
continental background, Geophysical Research Letters, 31, L22108, 2004.
Wehner, B., Birmili, W., Ditas, F., Wu, Z., Hu, M., Liu, X., Mao, J., Sugimoto, N., and Wiedensohler, 30

31
A.: Relationships between submicrometer particulate air pollution and air mass history in Beijing,
China, 2004–2006, Atmospheric Chemistry and Physics, 8, 6155–6168, 2008.
WHO: Air quality guidelines for Europe, 2nd Edn., Copenhagen, World Health Organization Regional
Office for Europe, WHO Regional Publications, European Series No. 91, 2000.
World Health Organization (WHO), Ambient (outdoor) air pollution in cities database. 5
http://www.who.int/phe/health_topics/outdoorair/databases/cities/en/, 2014-07-05.
Wiedensohler, A., Birmili, W., Nowak, A., Sonntag, A., Weinhold, K., Merkel, M., Wehner, B., Tuch, T.,
Pfeifer, S., Fiebig, M., Fjäraa, A. M., Asmi, E., Sellegri, K., Depuy, R., Venzac, H., Villani, P., Laj, P.,
Aalto, P., Ogren, J. A., Swietlicki, E., Williams, P., Roldin, P., Quincey, P., Hüglin, C.,
Fierz-Schmidhauser, R., Gysel, M., Weingartner, E., Riccobono, F., Santos, S., Grüning, C., Faloon, K., 10
Beddows, D., Harrison, R., Monahan, C., Jennings, S. G., O’Dowd, C. D., Marinoni, A., Horn, H.-G.,
Keck, L., Jiang, J., Scheckman, J., McMurry, P. H., Deng, Z., Zhao, C. S., Moerman, M., Henzing, B.,
de Leeuw, G., Löschau, G., and Bastian, S.: Mobility particle size spectrometers: harmonization of
technical standards and data structure to facilitate high quality long-term observations of atmospheric
particle number size distributions, Atmospheric Measurement Techniques, 5, 657–685, 2012. 15
Wu, Z. J., Hu, M., Liu, S., Wehner, B., Bauer, S., ßling, A. M., Wiedensohler, A., Petäjä, T., Dal Maso,
M., and Kulmala, M.: New particle formation in Beijing, China: Statistical analysis of a 1-year data set,
Journal of Geophysical Research, 112, D09209. https://doi.org/10.1029/2006JD007406, 2007.
Wu, Z. J., Hu, M., Lin, P., Liu, S., Wehner, B., and Wiedensohler, A.: Particle number size distribution
in the urban atmosphere of Beijing, China, Atmospheric Environment, 42, 7967–7980, 2008. 20
Yue, D. L., Hu, M., Zhang, R. Y., Wang, Z. B., Zheng, J., Wu, Z. J., Wiedensohler, A., He, L. Y., Huang,
X. F., and Zhu, T.: The roles of sulfuric acid in new particle formation and growth in the mega-city of
Beijing, Atmospheric Chemistry and Physics, 10, 4953–4960, 2010.
Zhai, S. X., Jacob, D. J., Wang, X., Shen, L., Li, K., Zhang, Y. Z., Gui, K., Zhao, T. L., and Liao, H.:
Fine particulate matter (PM2.5) trends in China, 2013–2018: separating contributions from 25
anthropogenic emissions and meteorology, Atmospheric Chemistry and Physics, 19, 11031–11041,
2019.
Zhao, H. J., Gui, K., Ma, Y. J., Wang, Y. F., Wang, Y. Q., Wang, H., Zheng, Y., Li, L., Zhang, L., Che, H.
Z., and Zhang, X. Y.: Climatology and trends of aerosol optical depth with different particle size and
shape in northeast China from 2001 to 2018, Science of the Total Environment, 763, 142979, 2021. 30

32
Zhao, S. P., Yu, Y., and Qin, D. H.: From highly polluted inland city of China to "Lanzhou Blue": The
air-pollution characteristics, Sciences in Cold and Arid Regions, 10(1), 12–26, 2018.
Zhao, S. P., Yu, Y., Yin, D. Y., and He, J. J.: Meteorological dependence of particle number
concentrations in an urban area of complex terrain, Northwestern China, Atmospheric Research, 164–
165, 304–317, 2015a. 5
Zhao, S. P., Yu, Y., Xia, D. S., Yin, D. Y., He, J. J., Liu, N., and Li, F.: Urban particle size distributions
during two contrasting dust events originating from Taklimakan and Gobi Deserts, Environmental
Pollution, 207, 107-122, 2015b.
Zhao, S. P., Yu, Y., Yin, D. Y., He, J. J., Liu, N., Qu, J. J., and Xiao, J. H.: Annual and diurnal variations
of gaseous and particulate pollutants in 31 provincial capital cities based on in situ air quality 10
monitoring data from China National Environmental Monitoring Center, Environment International, 86,
92-106, 2016.
Zhao, S. P., Yu, Y., Yin, D., Yu, Z., Dong, L. X., Mao, Z., He, J. J., Yang, J., Li, P., and Qin, D. H.:
Concentrations, optical and radiative properties of carbonaceous aerosols over urban Lanzhou, a typical
valley city: Results from in-situ observations and numerical model, Atmospheric Environment, 213, 15
470-484, 2019.
Zhao, S. P., Yu, Y., Yin, D. Y., and Qin, D. H.: Contrasting response of ultrafine particle number
and PM2.5 mass concentrations to Clean Air Action in China, Geophysical Research Letters, 48,
e2021GL093886. https://doi.org/10.1029/2021GL093886.
20
25

33
Figure 1: Map of A) Lanzhou City, B) the sampling site (red dot) and C) reference station that
measured PM2.5 and O3 (blue dot). The map is a pure reproduction of Google Maps where our
own contribution is rather small, and we only added a few marks for our study locations.
Copyright © Google Maps. 5
10

34
Figure 2: Time series of daily average particle number in the three modes (N13-25, N25-100 and
N100-800), aerosol optical properties (AOD, Alpha), the criteria air pollutants (PM2.5, O3, SO2, NO2),
and basic meteorological parameters and the corresponding probability density functions in 5
urban Lanzhou during the campaign. The frequencies of missing values and the statistics are
marked in each subplot. T, RH and Rn represent temperature, relative humidity and net
radiation, respectively.

35
Figure 3: Mean diurnal (upper panel) and annual (lower panel) variations of particle number in
13-25 size bin (N13-25) as wind directions in the two contrasting periods (before vs. after January
2016).Figure 4: Mean diurnal (upper panel) and annual (lower panel) variations of particle 5
number in 13-25 size bin (N13-25) as wind directions before and after January 2016.

36
Figure 5: Polar plot of N13-25 (upper panel), N25-100 (middle panel) and N100-800 (lower panel) based
on the CPF function before and after January 2016.

37
Figure 4: Mean particle number size distributions by each sector of wind directions with interval
of 45 degree during 2012-2019.Figure 6: Mean particle number size distributions by each sector
of wind directions with interval of 45 degree.
5

38
Figure 5: Mean particle number size distribution for each typical cluster obtained by K-means
clustering method. The occurrence frequencies of Clusters A-F were calculated during
2012-2019.Figure 7: Mean particle number size distribution for each typical cluster obtained by
K-means clustering method. The occurrence frequencies of Clusters A-F were calculated during
2012-2019. 5
Figure 6: (A) Inter-annual, (B) averagely annual and (C) diurnal variations of occurrence
frequencies for Clusters A-F during the measurement campaign.Figure 8: (A) Inter-annual, (B)
averagely annual and (C) diurnal variations of occurrence frequencies for Clusters A-F during
the measurement campaign. 10

39
Figure 7: Occurrence frequency of the other clusters at the subsequent 1-12 hours after each
cluster appeared during the entire measurement campaign. For example, the frequencies of
Clusters B, C, D, E and F at the subsequent 1-12 hours when Cluster A appeared (the first
column of Figure 7) can be calculated by the equation: NA, i, j = Ni, j / ∑Ni ×100% ( i=1,2…12, j 5
represents the other clusters except Cluster A, i.e., Clusters B, C, D, E and F). The calculation is
similar when the other clusters appeared during the campaign.Figure 9: Occurrence frequency of
Clusters A-F during 1-12 hours after each cluster appeared during the entire measurement
campaign.
10
15
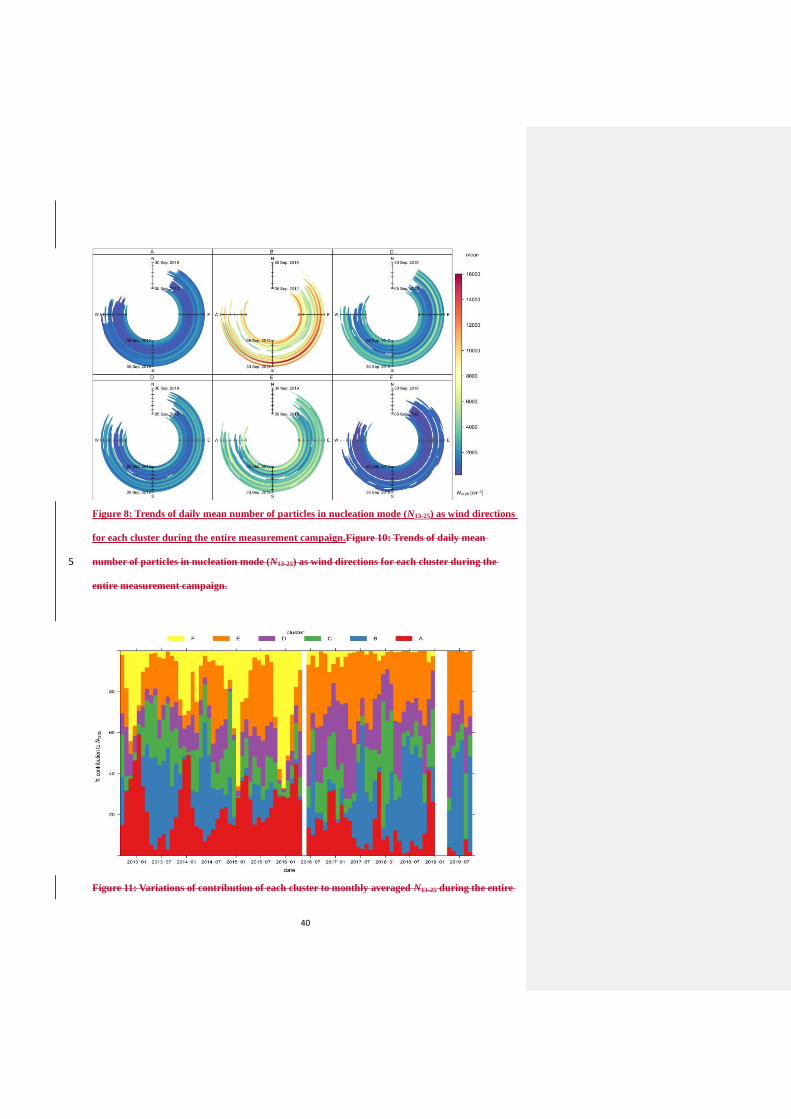
40
Figure 8: Trends of daily mean number of particles in nucleation mode (N13-25) as wind directions
for each cluster during the entire measurement campaign.Figure 10: Trends of daily mean
number of particles in nucleation mode (N13-25) as wind directions for each cluster during the 5
entire measurement campaign.
Figure 11: Variations of contribution of each cluster to monthly averaged N13-25 during the entire

41
measurement campaign.
Figure 9: Seasonal variations in the trends of PNCs in three modes for the two contrasting
periods (before vs. after January 2016) for each cluster. The annual change is calculated by
Theil-Sen regression, and the calculation can refer to the above section of “2.3 Trend analysis 5
methods”. MAM, JJA, SON and DJF are spring, summer, fall and winter, respectively.Figure 12:
Seasonal variations in the trends of PNCs in three modes before and after January 2016 for each
cluster. The annual change is calculated by Theil-Sen regression. MAM, JJA, SON and DJF are
spring, summer, fall and winter, respectively.
10

42
Figure 10: Diurnal variations in the trends of PNCs in three modes for the two contrasting
periods (before vs. after January 2016) for each cluster. The annual change is calculated by
Theil-Sen regression, and the calculation can refer to the above section of “2.3 Trend analysis
methods”.Figure 13: It is the same as Figure 12 but for diurnal variations. 5
10
15

43
Figure 11: Inter-annual statistics of the trends of NPF frequency, mode diameter, formation
(dNnuc/dt, Fcoag) and growth rates, CS and H2SO4 proxy during the campaign. The lines inside the
box denotes the median slope, the two whiskers and the top and bottom of the box denote the 5th, 5
95th, 75th and 25th percentiles.

44
Figure 12: Normalized diurnal variations of net radiation (Rn), N13-25, temperature, relative
humidity, and wind speed and direction for each cluster during the campaign. The shading shows
the estimated 95% confidence intervals.Figure 14: Normalized diurnal variations of net radiation 5
(Rn), N13-25, temperature, relative humidity, and wind speed and direction for each cluster. The
shading shows the estimated 95% confidence intervals.

45
Figure 15: Inter-annual variations of monthly average daylight and nighttime Rn for each cluster
during the campaign. The smooth line is essentially determined using Generalized Additive
Model, and the shading shows the estimated 95% confidence intervals.
5
Figure 16: Gridded back trajectory frequencies with hexagonal binning for each cluster. The
five-day (120 h) trajectories were initialized at 500 m AGL. The black dot shows the geographic
location of urban Lanzhou.

46
Table 1. Overview of experimentally determined particle number concentrations in the
troposphere around the world. The duration of the measurement campaign was at least longer
than 1 year (12 months).
Continent Diameter, city, site and period Number concentrations Reference
Asia Diameter range (nm)
Lanzhou, urban, 7.5 years
13-25
2514
25-100
10769
100-800
3258
This work
Diameter range (nm)
Beijing, urban, 3 years
3-20
5000
20-100
12300
100-800
6400
Wang et al. (2013)
Diameter range (nm)
Waliguan, remote rural,
22 months
12-21
570
21-95
1060
95-570
430
Kivekas et al. (2009)
Diameter range (nm)
Shangdianzhi, rural, 1.5 years
3-25
3610
25-100
4430
100-1000
3470
Shen et al. (2011)
Diameter range (nm)
Kanpur, urban, 4 years
20-100
12400
100-685
18900
Kanawade et al.
(2014)
Diameter range (nm)
Delhi, urban, 1.25 years
12-25
8940
25-100
21690
100-560
11690
Gani et al. (2020)
Europe Diameter range (nm)
Varrio, rural, 3 years
8-25
143
25-90
429
90-460
304
Dal Maso et al. (2008)
Diameter range (nm)
Copenhagen, rural, 3 years
8-30
770
30-100
1813
100-700
751
von Bismarck-Osten
et al. (2013)
Diameter range (nm)
Leipzig, roadside, 3 years
8-30
5692
30-100
4962
100-700
2242
von Bismarck-Osten
et al. (2013)
Diameter range (nm)
Helsinki, urban background, 3
years
8-30
3080
30-100
3099
100-700
1053
von Bismarck-Osten
et al. (2013)
Diameter range (nm)
London, urban background, 3
years
8-30
1632
30-100
3825
100-700
1437
von Bismarck-Osten
et al. (2013)
North
America
Diameter range (nm)
Rochester, urban, 8 years
10-50
4730
50-100
1838
100-500
1073
Wang et al. (2011)
Diameter range (nm)
Pittsburgh, urban, 1 year
3-20
9700
20-100
10100
100-1000
2188
Stanier et al. (2004)
5

47
Table 2. Mean values of particle number in the three modes (N13-25, N25-100, and N100-800), AOD, the
concentrations of six criteria air pollutants (PM2.5, PM10, O3, SO2, NO2, and CO) for each Cluster.
Cluster N13-25 N25-100 N100-800 AOD PM2.5 PM10 O3 SO2 NO2 CO
Units cm-3 cm-3 cm-3 — μg m-3 μg m-3 μg m-3 μg m-3 μg m-3 mg m-3
A 1263.2 12156.5 3973.9 0.54 54.85 135.73 25.98 26.91 64.57 2.91
B 10370.4 9969.8 1504.7 0.39 31.42 86.53 92.77 13.56 40.67 2.73
C 2616.7 9071.8 2890.5 0.49 48.89 116.10 41.37 21.42 55.12 2.65
D 2010.0 11931.4 2301.6 0.55 43.92 124.13 46.28 16.85 57.68 2.33
E 4245.2 10806.9 1592.6 0.45 35.26 106.31 82.86 12.60 44.44 1.71
F 757.2 9492.2 5139.3 0.60 71.24 130.98 24.14 35.95 66.07 2.98
Table 3. Mean values of meteorological parameters (wind speed, temperature, relative humidity
and net radiation) and geometric median diameters (GMDnuc, GMDAit and GMDacc are for 5
nucleation, Aitken and accumulation modes) fitted by Eq. (1) for each Cluster. WS, T, RH, and
Rn are the abbreviations of wind speed, temperature, relative humidity and net radiation,
respectively.
Cluster WS T RH Rn GMDnuc GMDAit GMDacc
Units m s-1 oC % W m-2 nm nm nm
A 1.38 7.35 48.39 21.56 26.37 54.91 133.08
B 2.18 20.77 31.59 223.55 19.72 38.06 131.70
C 1.64 13.18 48.20 48.25 22.56 49.91 137.21
D 1.57 11.73 44.31 -3.03 25.73 44.33 128.89
E 1.94 17.47 36.19 100.16 23.18 38.74 122.96
F 1.34 5.34 47.03 12.82 25.69 62.35 136.55


![Indoor Particle Concentrations, Size Distributions, and ...Personal Aerosol Monitor TSI SidePak AM520 PM2.5 Mass Jiang et al. [34] Optical Particle Counter TSI AeroTrak 9306-V2 Dp](https://static.fdocuments.in/doc/165x107/601db0b401ebe9541e1a4d7b/indoor-particle-concentrations-size-distributions-and-personal-aerosol-monitor.jpg)


![Ultrasonic preparation, stability and thermal conductivity ... · effect on thermal conductivity at different particle concentrations has been recorded [10–14] . Nanofluids containing](https://static.fdocuments.in/doc/165x107/60b98fecd489ad698b5f3b45/ultrasonic-preparation-stability-and-thermal-conductivity-effect-on-thermal.jpg)