Climate Impacts on Airborne Particle Concentrations in ... · Particle Concentrations in...
47
Climate Impacts on Airborne Particle Concentrations in California: Implications for Atmospheric Deposition Abdullah Mahmud 1 , Mark Hixson 1 , Zhan Zhao 2 , Shuhua Chen 2 , and Michael Kleeman 1 1 Civil and Environmental Engineering UC Davis 2 Atmospheric Science, UC Davis March 18, 2008
Transcript of Climate Impacts on Airborne Particle Concentrations in ... · Particle Concentrations in...
Climate Impacts on Airborne
Particle Concentrations in
California: Implications for
Atmospheric DepositionAbdullah Mahmud1, Mark Hixson1, Zhan Zhao2, Shuhua
Chen2, and Michael Kleeman1
1Civil and Environmental Engineering UC Davis2Atmospheric Science, UC Davis
March 18, 2008
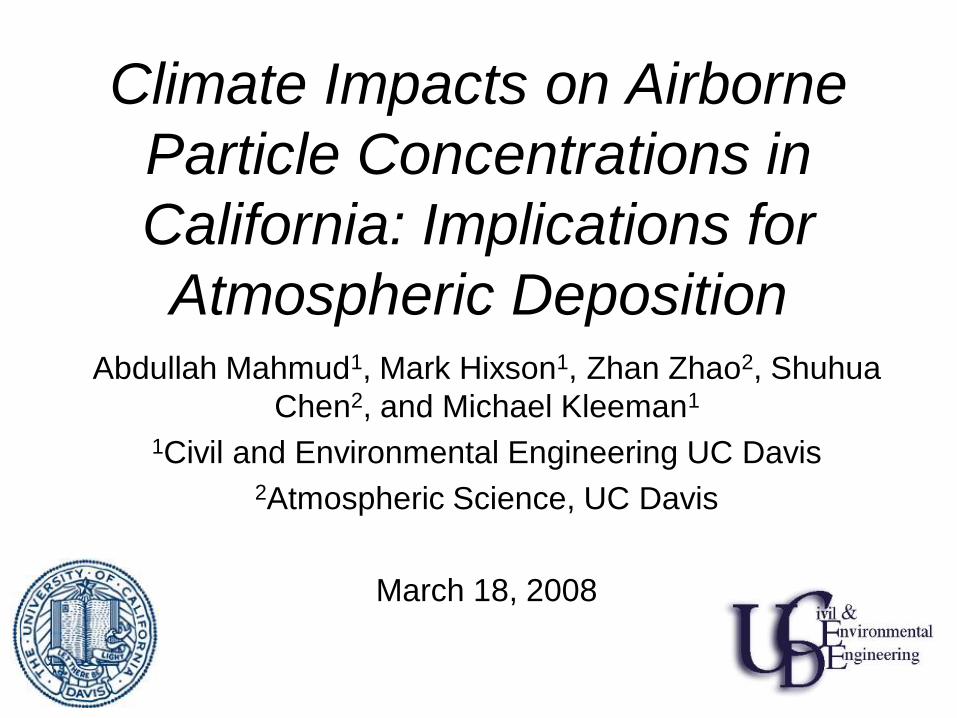
Problem: Climate Change Alters
Atmospheric Conditions That Will
Influence Air Pollution
Source: IPCC Fourth Assessment Report, Climate Change 2007. Intergovernmental Panel on Climate Change,
http://www.ipcc.ch/graphics/gr-ar4-syr.htm.
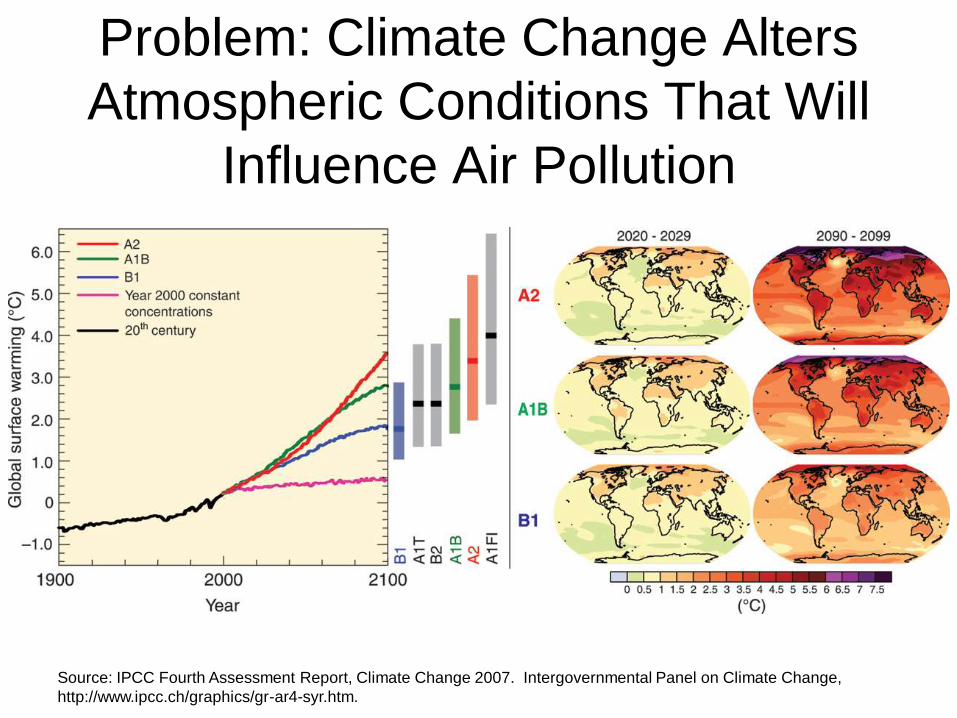
Health Impacts of Air Pollution in
California (per year)
Source: Recent Research Findings: Health Effects of Particulate Matter and Ozone Air Pollution, January 2004.
California Air Resources Board (http://www.arb.ca.gov/research/health/fs/PM-03fs.pdf)
(7,100)
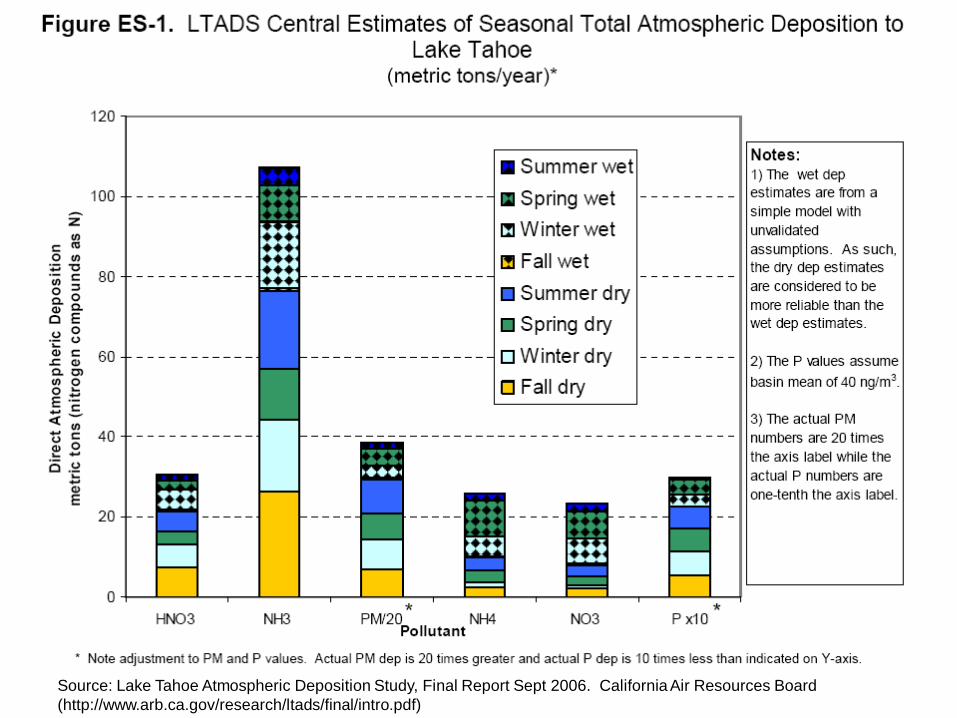
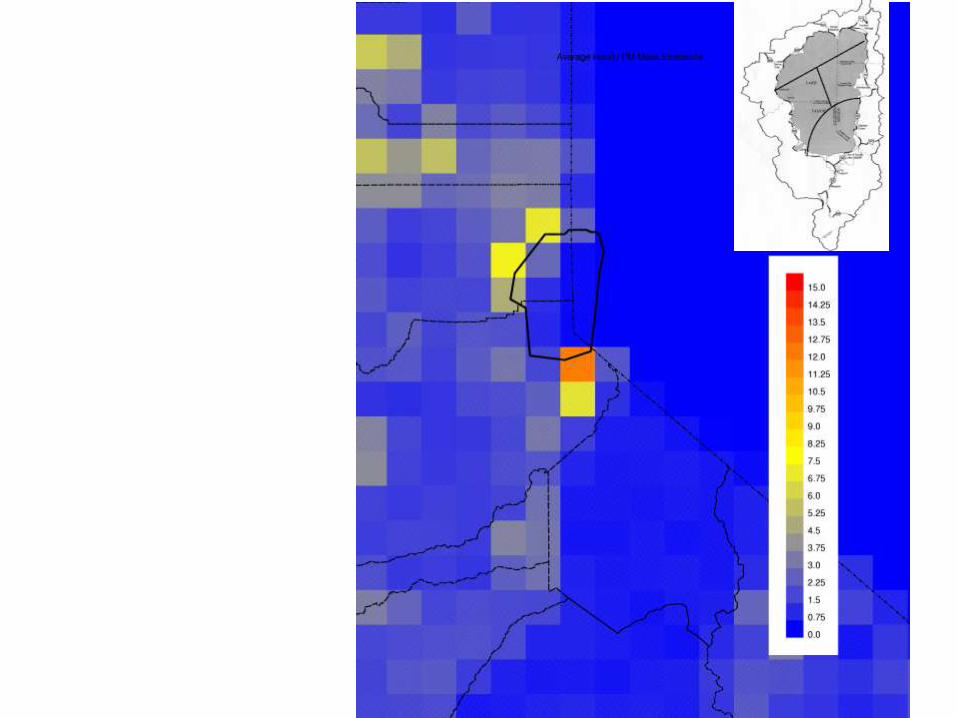
Source: Lake Tahoe Atmospheric Deposition Study, Final Report Sept 2006. California Air Resources Board
(http://www.arb.ca.gov/research/ltads/final/intro.pdf)
Summary of
Pollutant
Response Across
All Episodes:
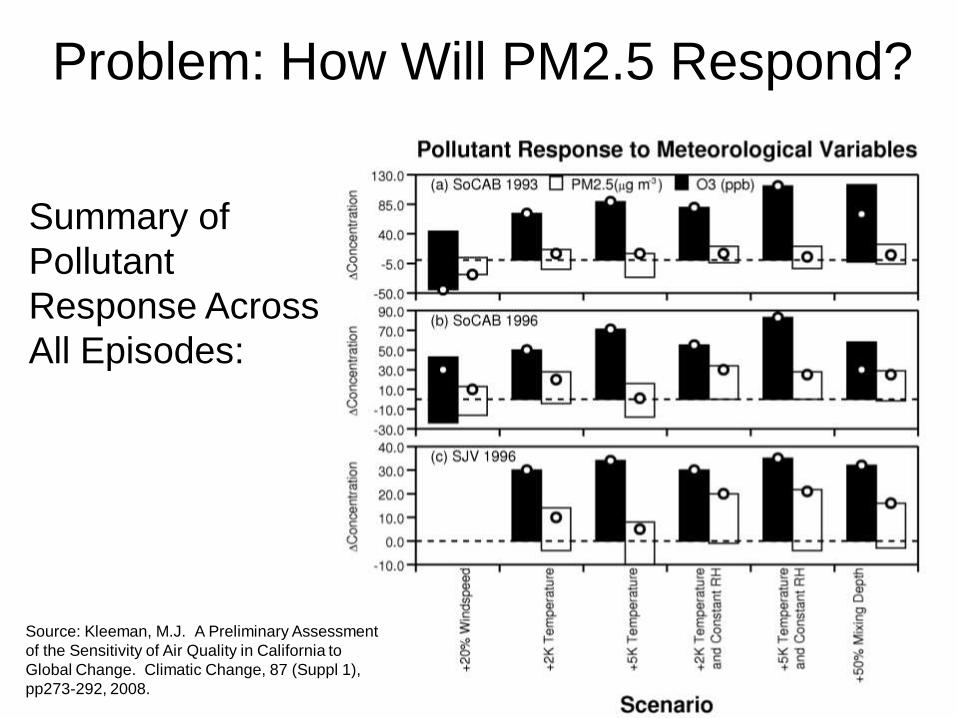
Problem: How Will PM2.5 Respond?
Source: Kleeman, M.J. A Preliminary Assessment
of the Sensitivity of Air Quality in California to
Global Change. Climatic Change, 87 (Suppl 1),
pp273-292, 2008.
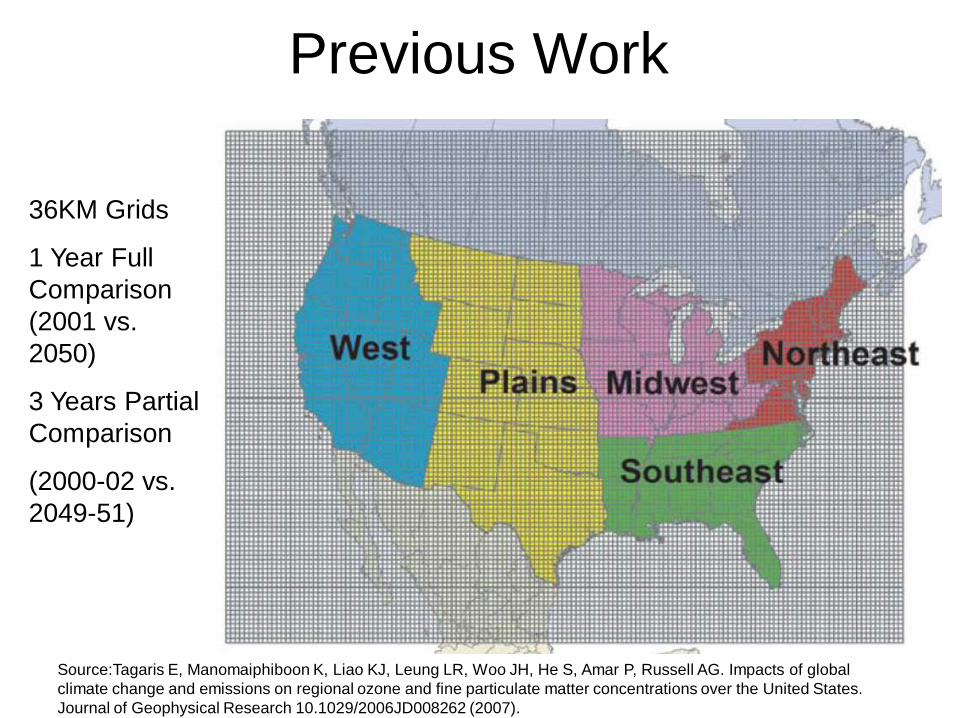
Previous Work
Source:Tagaris E, Manomaiphiboon K, Liao KJ, Leung LR, Woo JH, He S, Amar P, Russell AG. Impacts of global
climate change and emissions on regional ozone and fine particulate matter concentrations over the United States.
Journal of Geophysical Research 10.1029/2006JD008262 (2007).
36KM Grids
1 Year Full
Comparison
(2001 vs.
2050)
3 Years Partial
Comparison
(2000-02 vs.
2049-51)
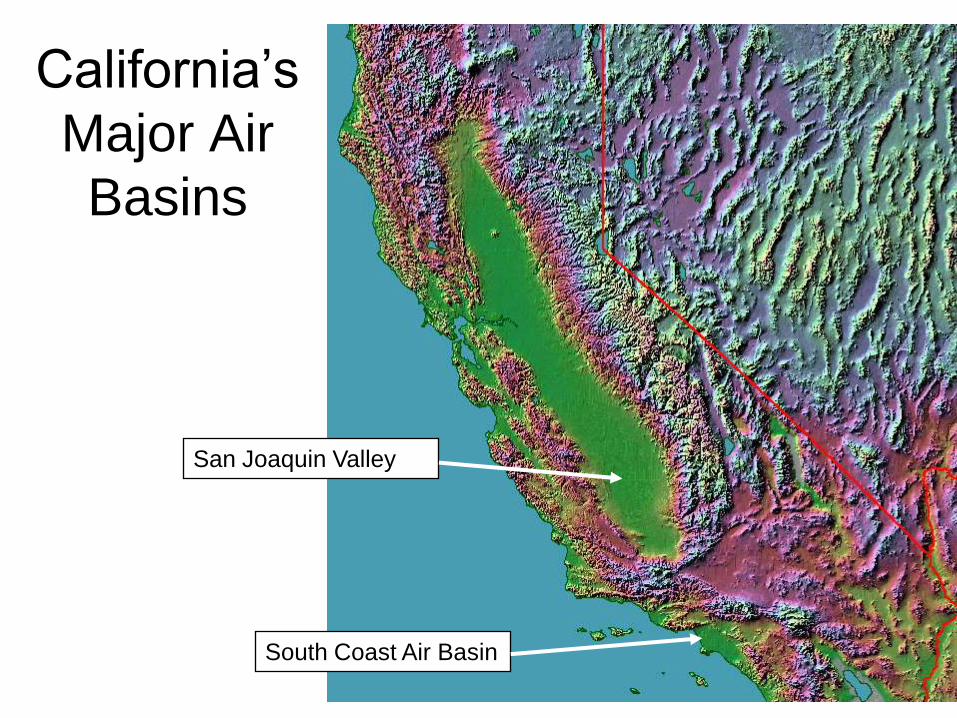
California’s
Major Air
Basins
San Joaquin Valley
South Coast Air Basin
Current Approach: PCM Downscaling
• Parallel Climate Model simulations
– Business as usual emissions scenario
– 2000-06 and 2047-2053
– Approximately 100km resolution
• Down-scaling to 4km resolution using the Weather Research Forecast Model
– No data assimilation
– Up-scaled to 8km for air quality models
• 7 Year Simulation Windows to Capture Enso
– 2000-06 vs. 2047-53
Current Approach: Emissions
• State-wide Inventory
– CARB (NOx, SOx, VOC, NH3, PM)
• SoCAB Inventory
– AQMD (NOx, SOx, VOC, PM)
– CIT/UCD (NH3)
• Biogenic Temperature Correction
– CARB biogenic model (hourly average)
• Mobile Source Temperature Correction
– EMFAC (hourly average)
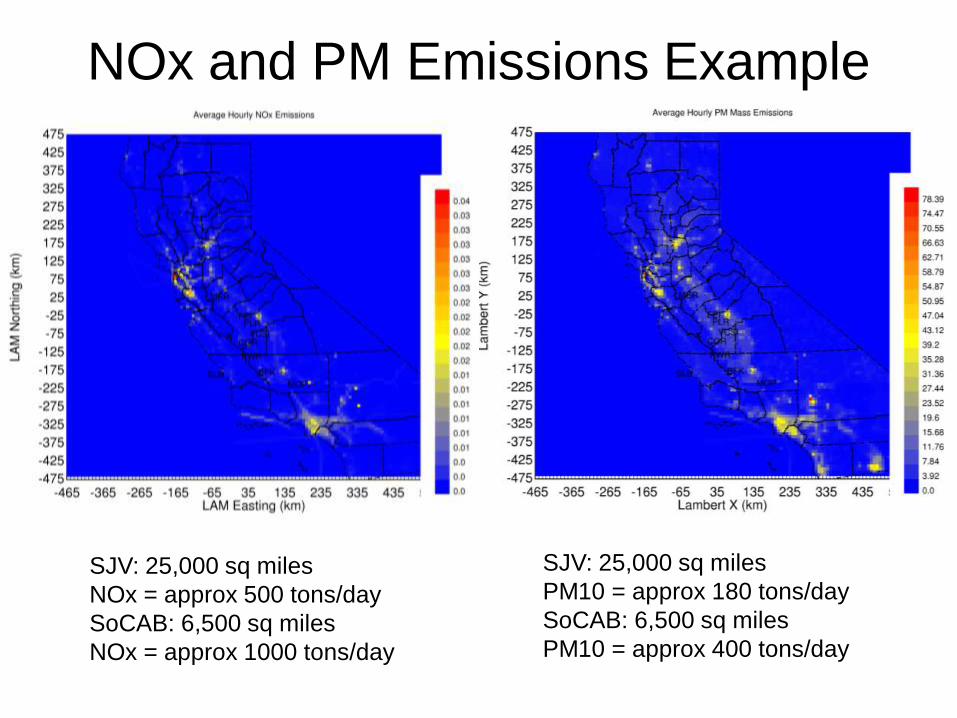
NOx and PM Emissions Example
SJV: 25,000 sq miles
NOx = approx 500 tons/day
SoCAB: 6,500 sq miles
NOx = approx 1000 tons/day
SJV: 25,000 sq miles
PM10 = approx 180 tons/day
SoCAB: 6,500 sq miles
PM10 = approx 400 tons/day
Current Approach: Air Quality Model
• UCD-CIT Source-oriented Air Quality Model
– Carter 1990 photochemical mechanism with updates
to key-rate constants
– Fully dynamic exchange between gas and particle
phase
– Full decomposition of gas-phase rxns to track source
contributions to secondary particulate nitrate, sulfate,
and ammonium ion
– Internal tracers to track source contributions to
primary particulate matter
• 153 days simulated in 5-6 days of real time
• 28 simulated years in 5-6 months
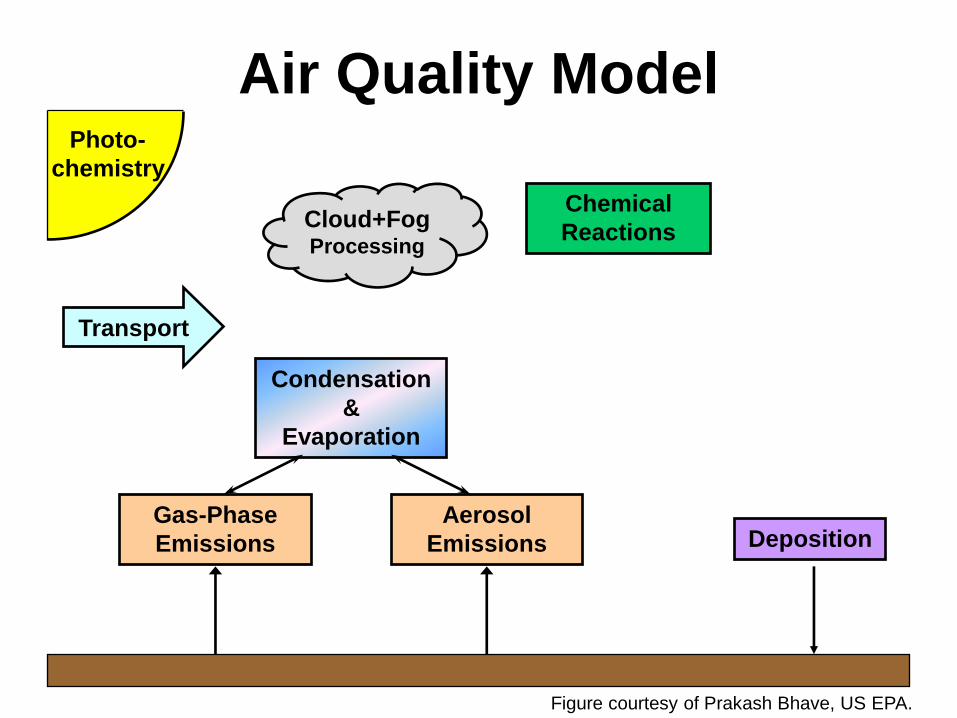
Air Quality Model
Transport
Cloud+Fog Processing
Chemical
Reactions
Photo-
chemistry
DepositionGas-Phase
Emissions
Aerosol
Emissions
Condensation
&
Evaporation
Figure courtesy of Prakash Bhave, US EPA.
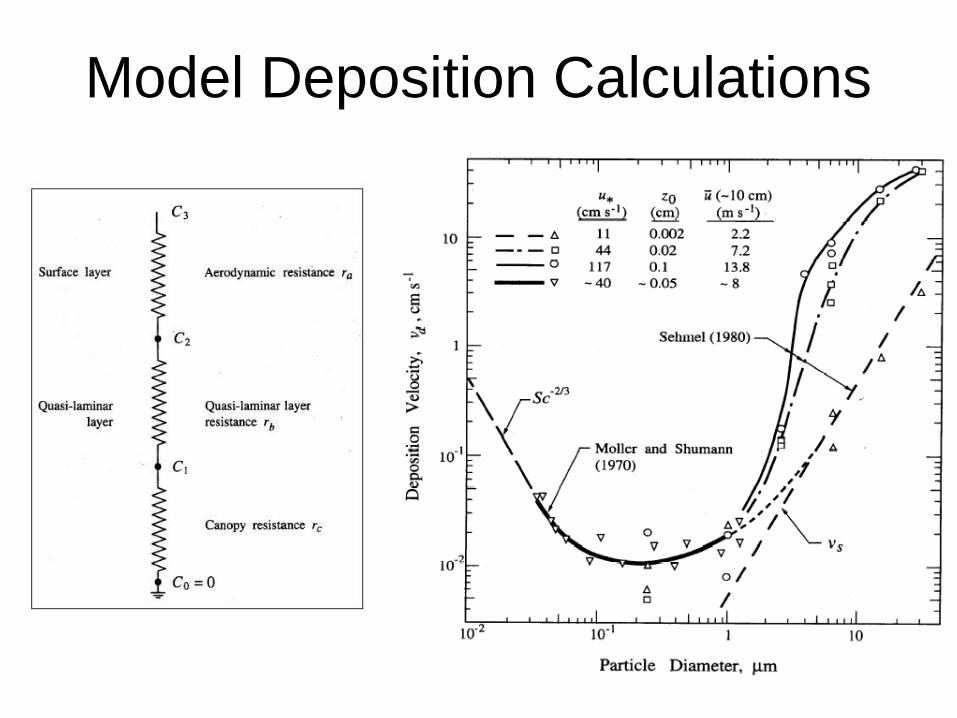
Model Deposition Calculations
-5.00
0.00
5.00
10.00
15.00
20.00
25.00
30.00
35.00
40.00
An
nu
al A
vg
. P
M2.5
/(u
g/m
3)
Site Code
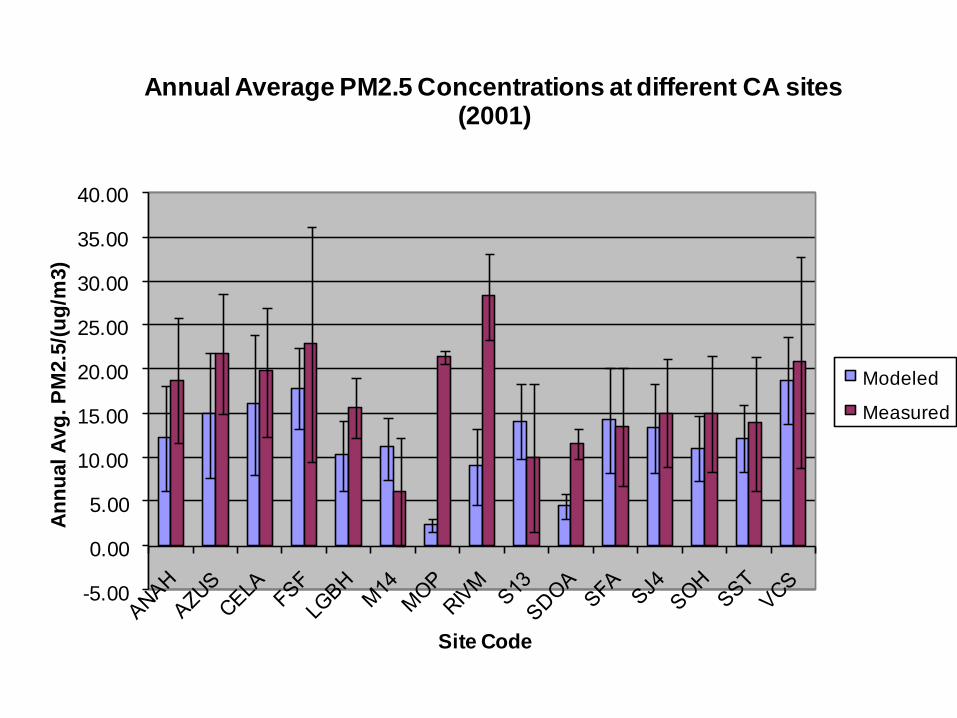
Annual Average PM2.5 Concentrations at different CA sites (2001)
Modeled
Measured
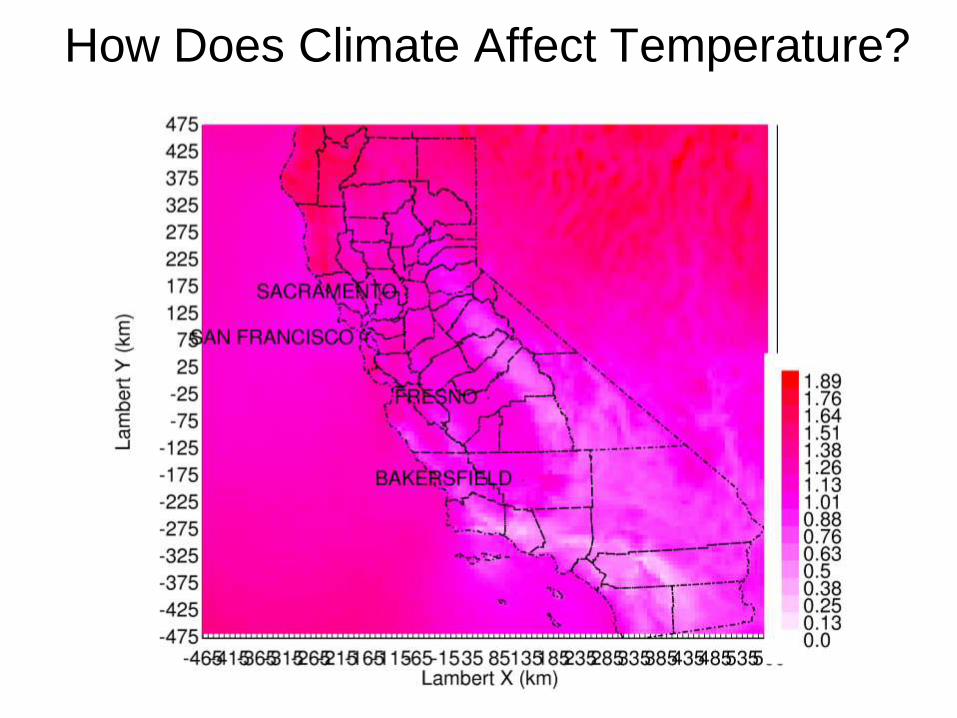
How Does Climate Affect Temperature?
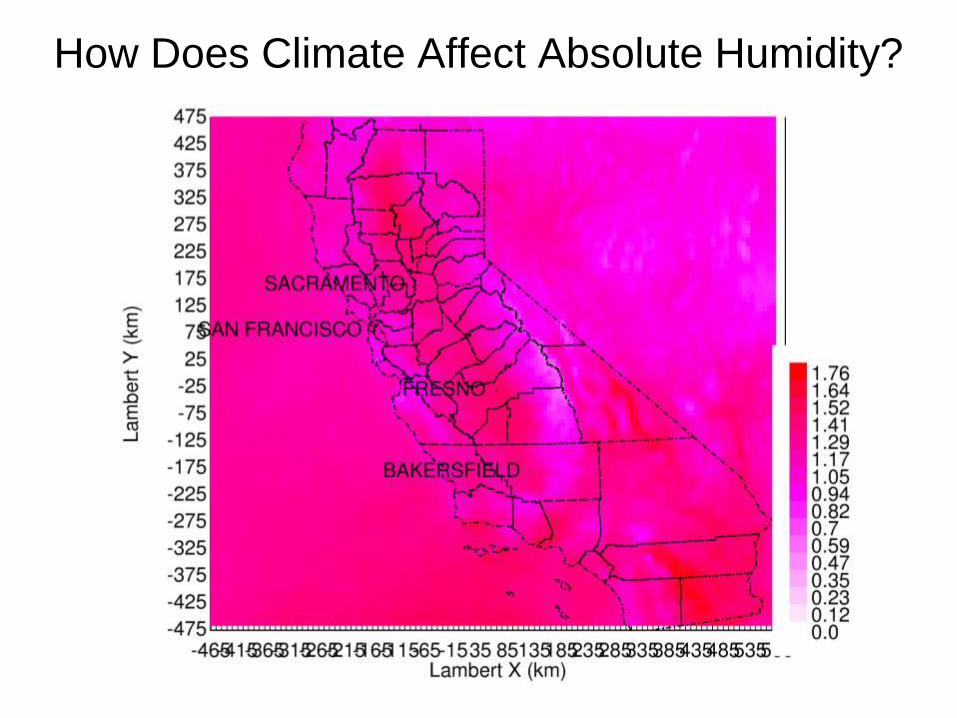
How Does Climate Affect Absolute Humidity?
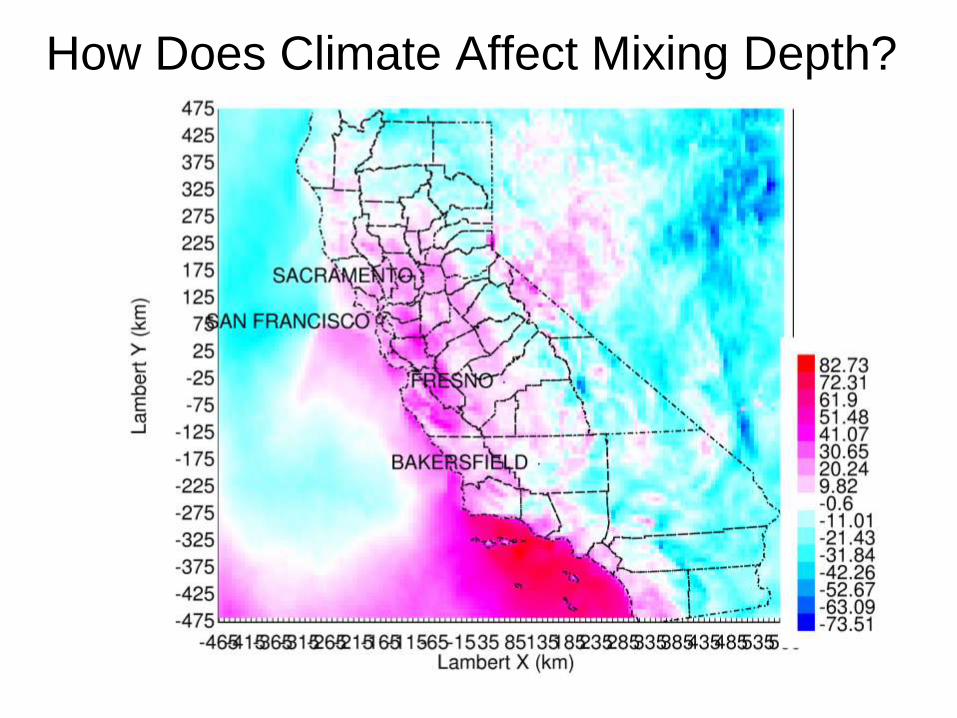
How Does Climate Affect Mixing Depth?
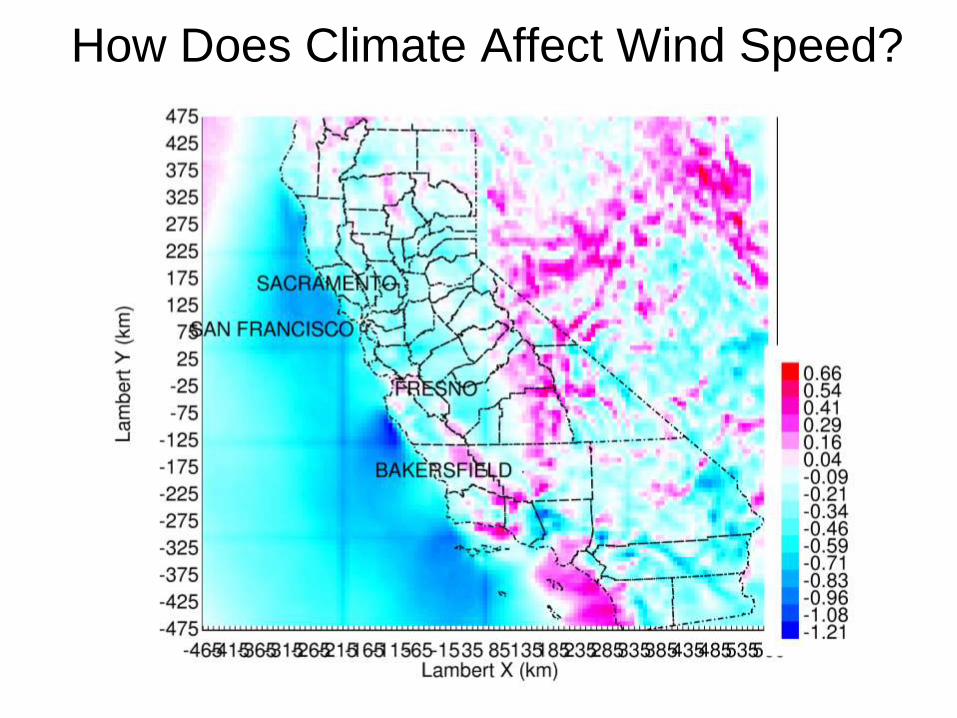
How Does Climate Affect Wind Speed?
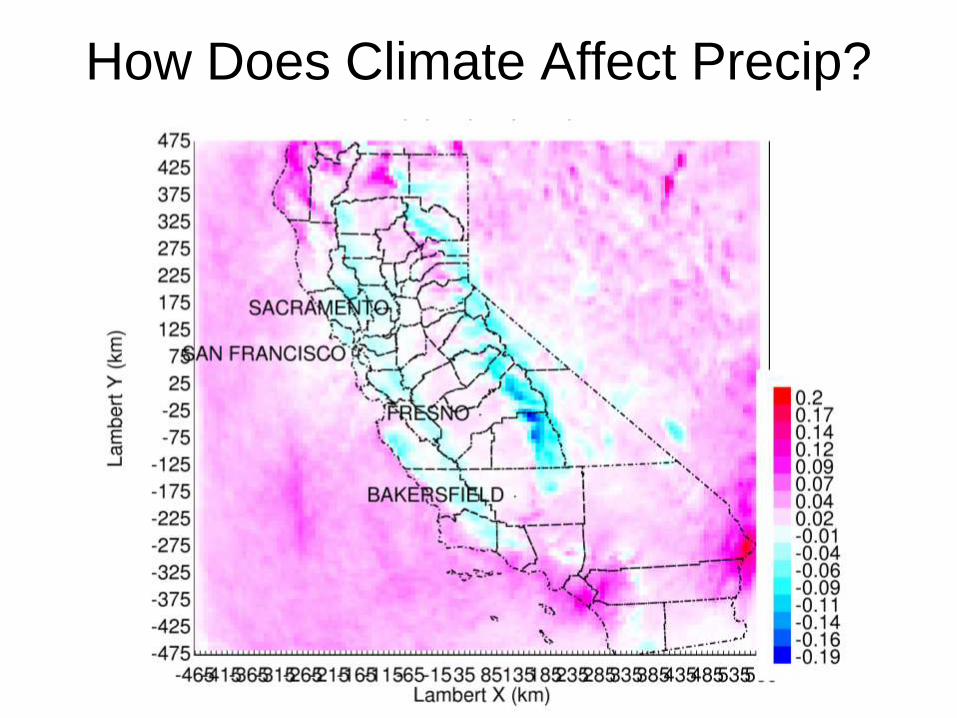
How Does Climate Affect Precip?
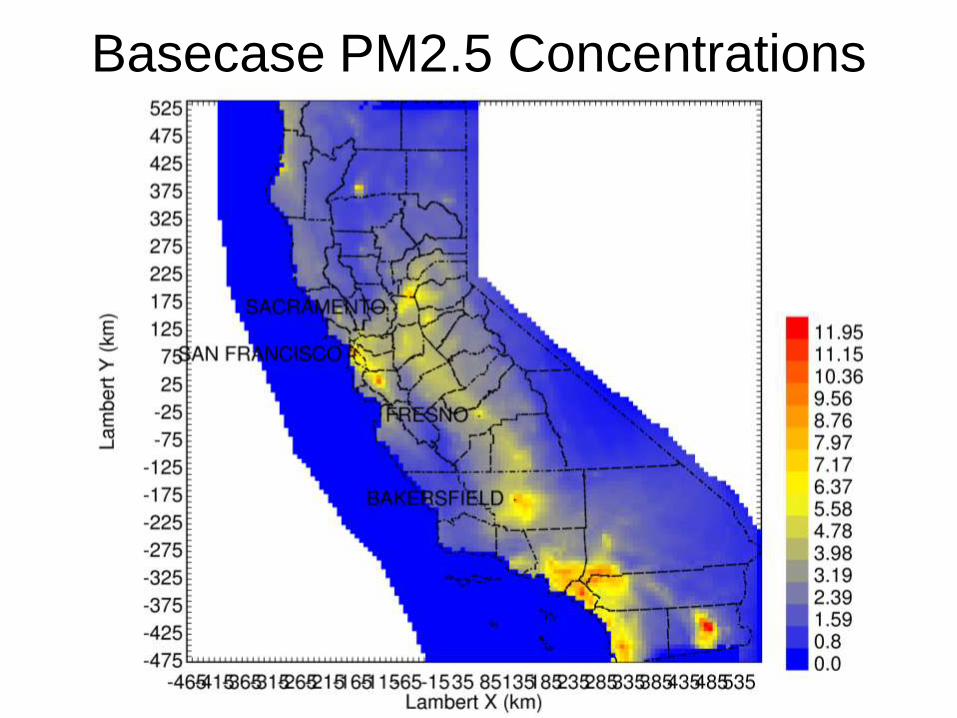
Basecase PM2.5 Concentrations
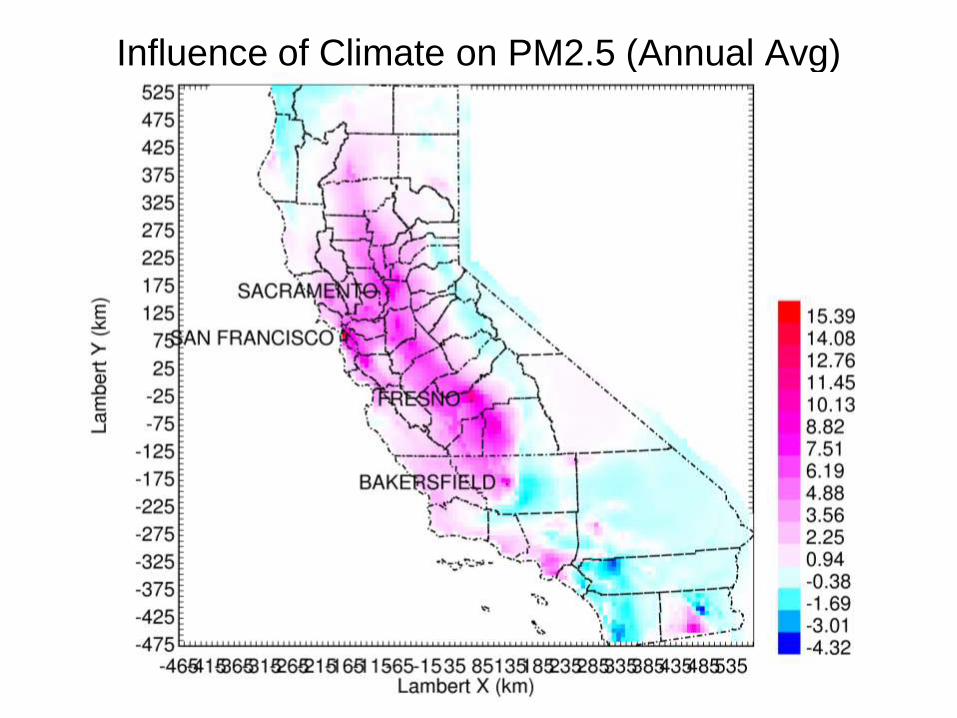
Influence of Climate on PM2.5 (Annual Avg)
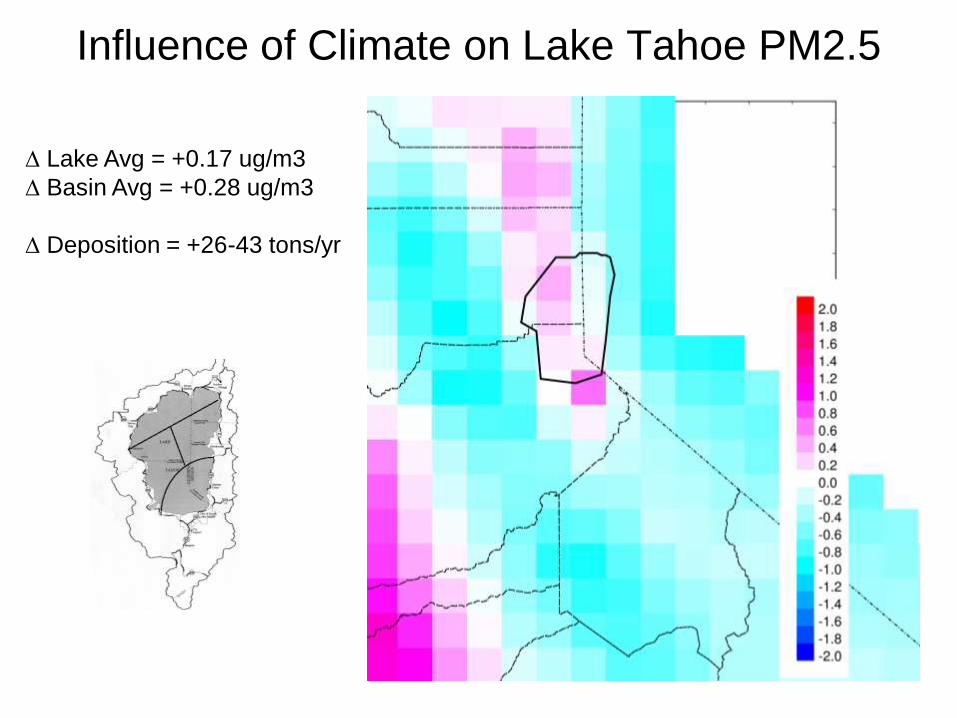
Influence of Climate on Lake Tahoe PM2.5
Lake Avg = +0.17 ug/m3
Basin Avg = +0.28 ug/m3
Deposition = +26-43 tons/yr
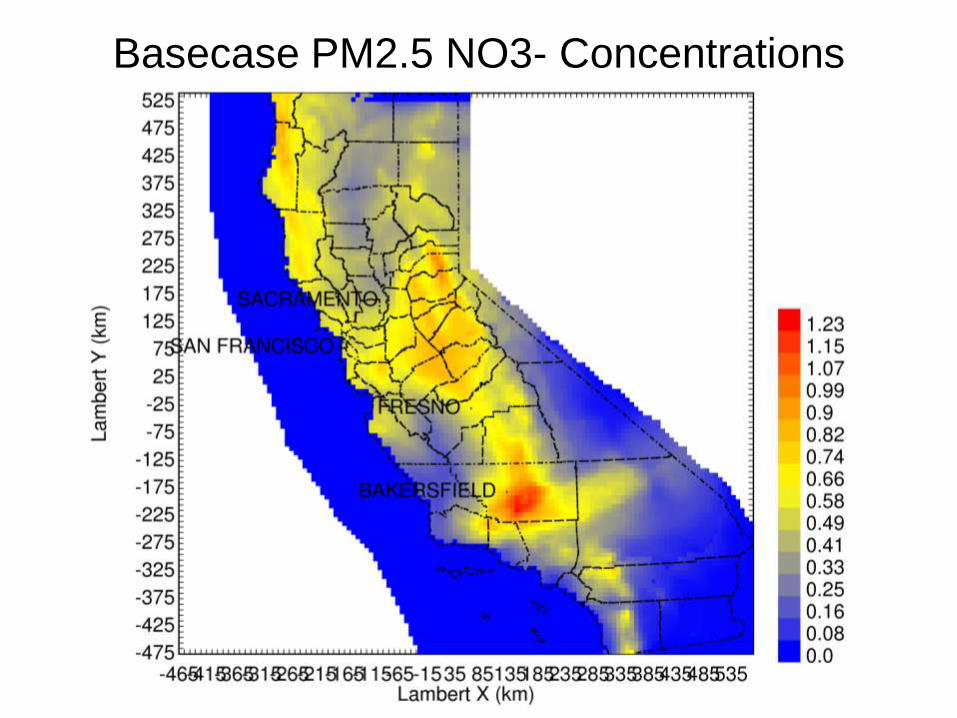
Basecase PM2.5 NO3- Concentrations
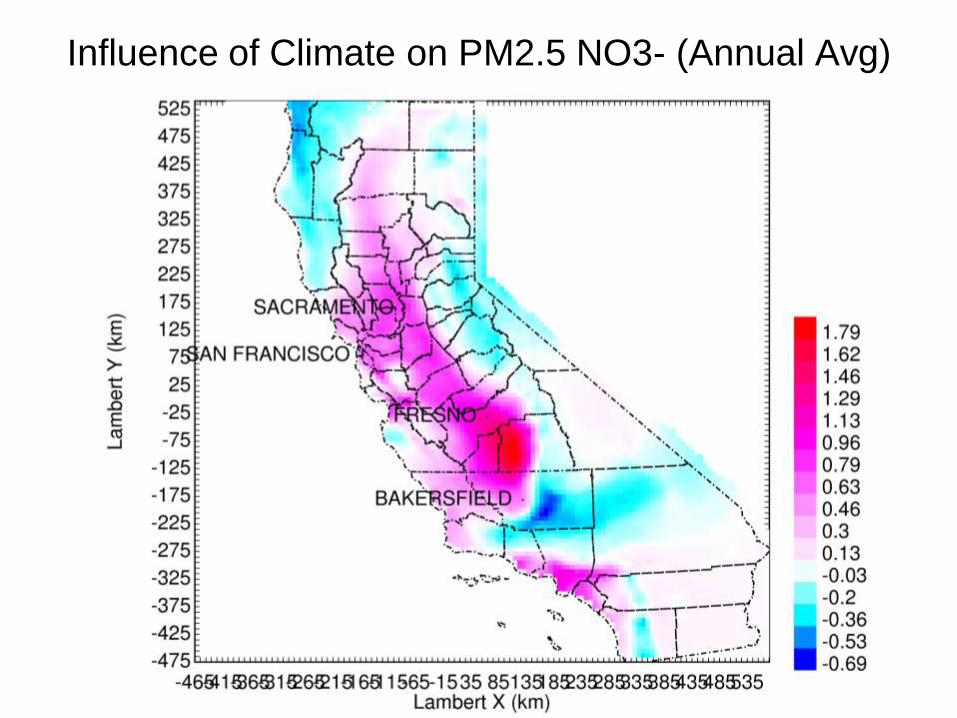
Influence of Climate on PM2.5 NO3- (Annual Avg)
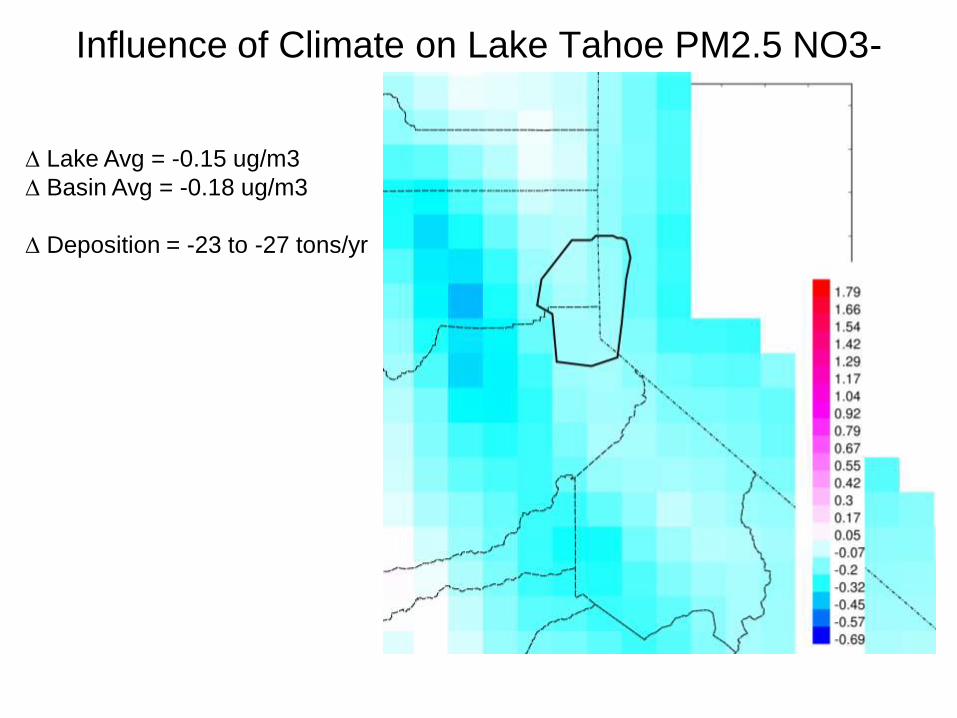
Influence of Climate on Lake Tahoe PM2.5 NO3-
Lake Avg = -0.15 ug/m3
Basin Avg = -0.18 ug/m3
Deposition = -23 to -27 tons/yr
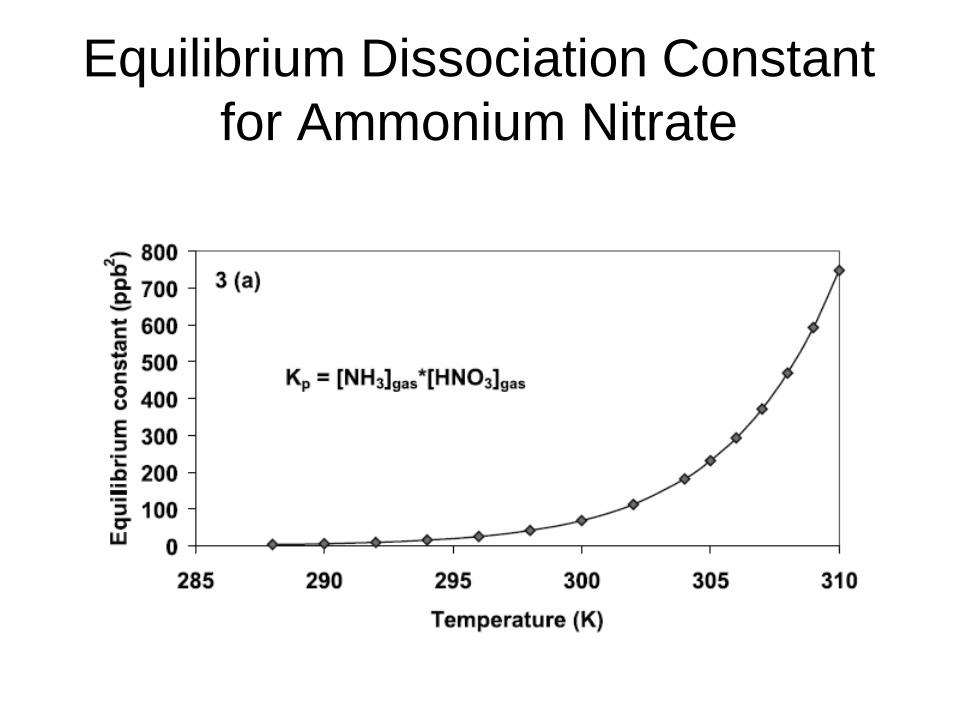
Equilibrium Dissociation Constant
for Ammonium Nitrate
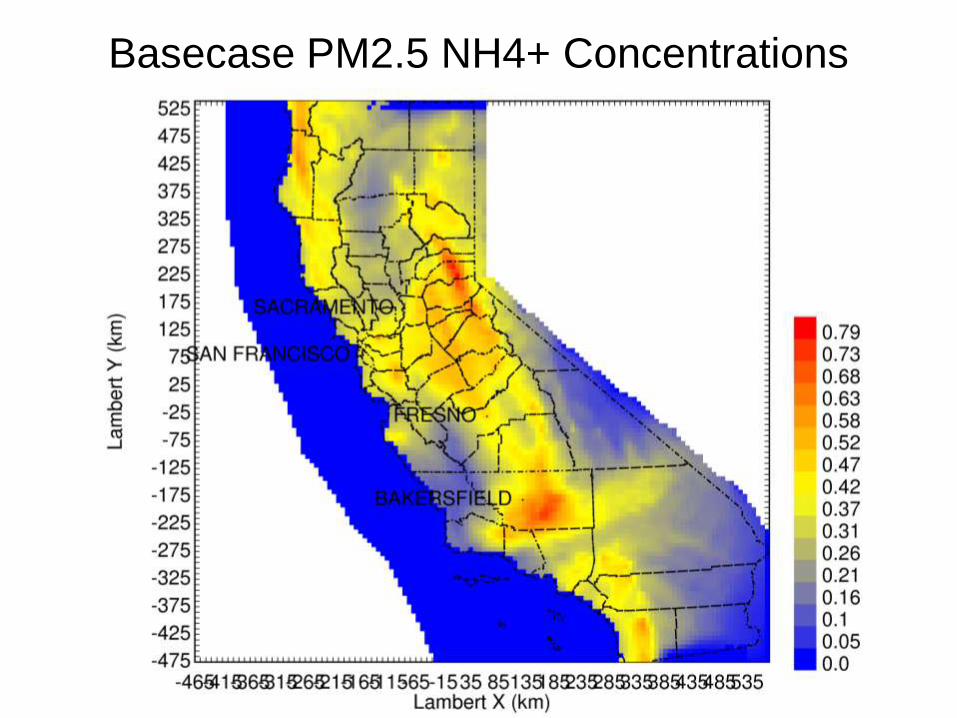
Basecase PM2.5 NH4+ Concentrations
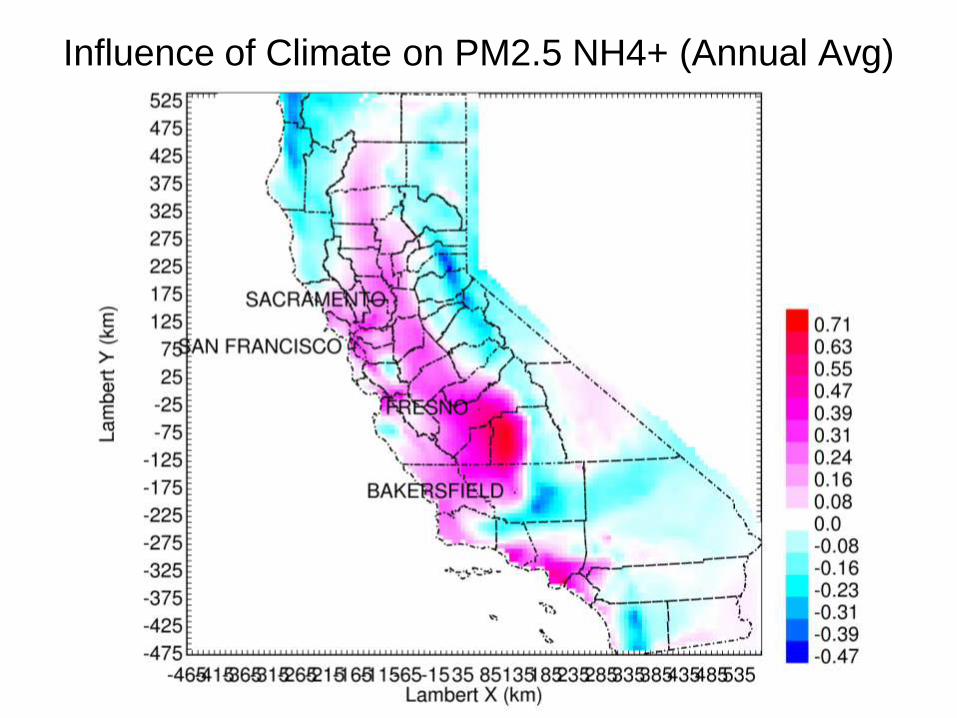
Influence of Climate on PM2.5 NH4+ (Annual Avg)
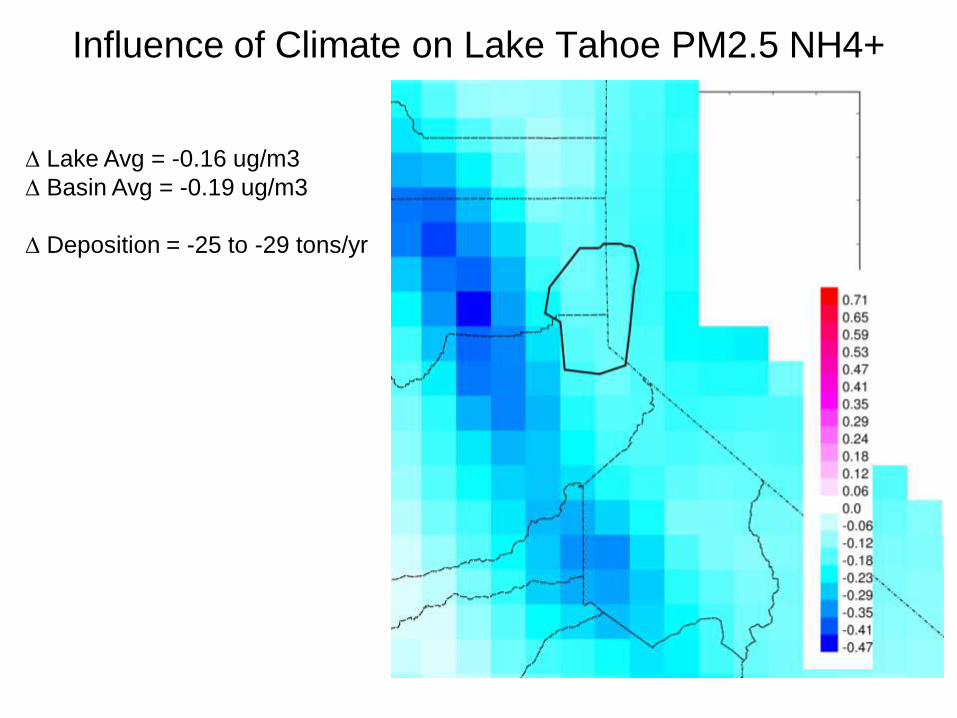
Influence of Climate on Lake Tahoe PM2.5 NH4+
Lake Avg = -0.16 ug/m3
Basin Avg = -0.19 ug/m3
Deposition = -25 to -29 tons/yr
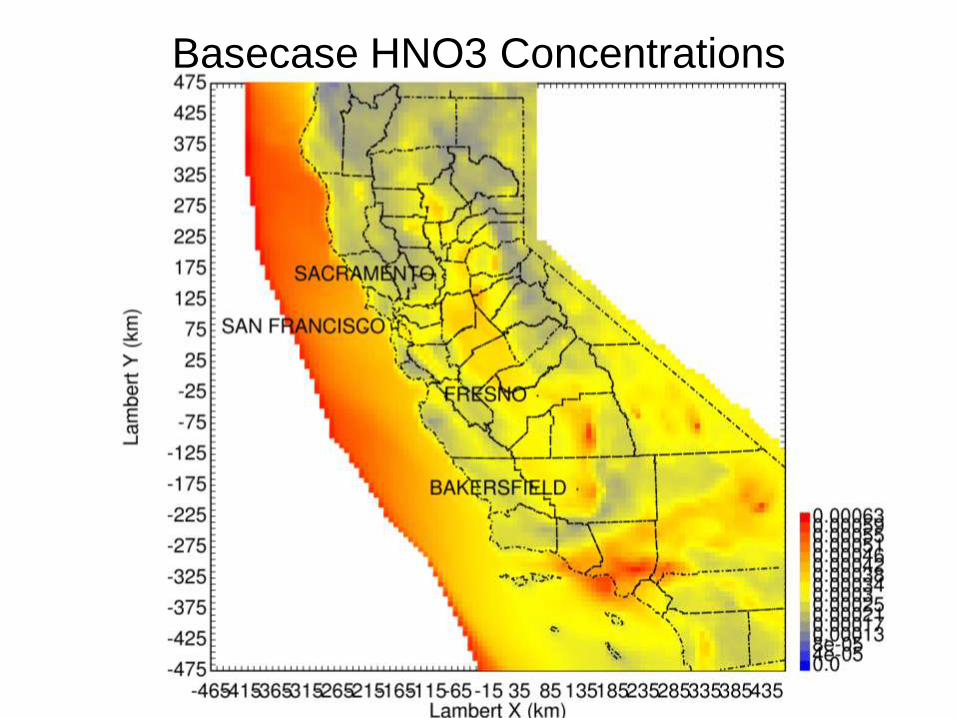
Basecase HNO3 Concentrations
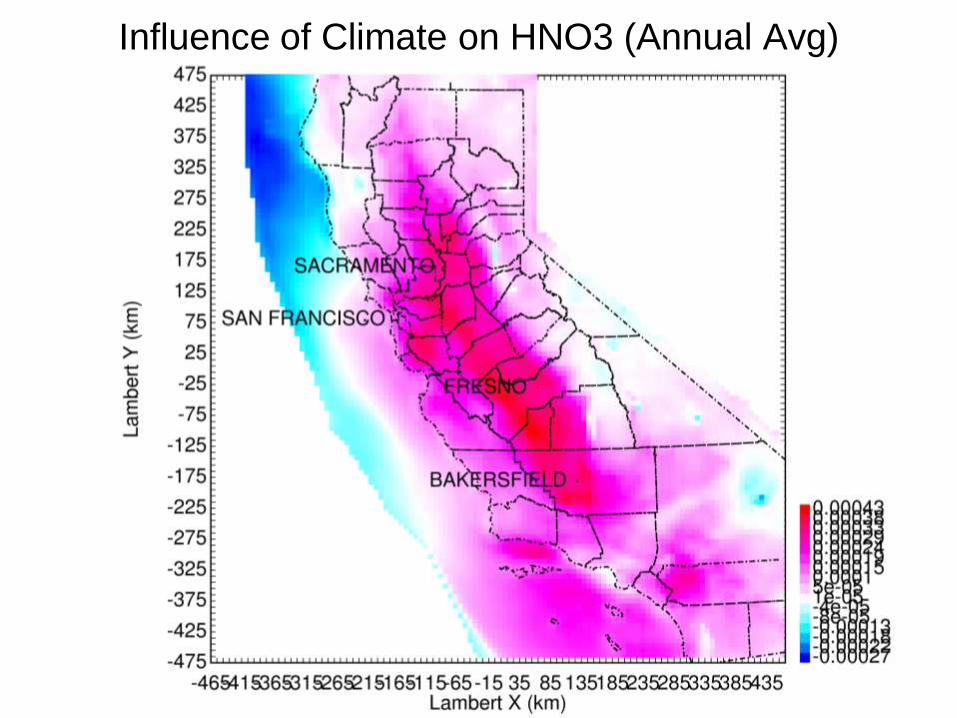
Influence of Climate on HNO3 (Annual Avg)
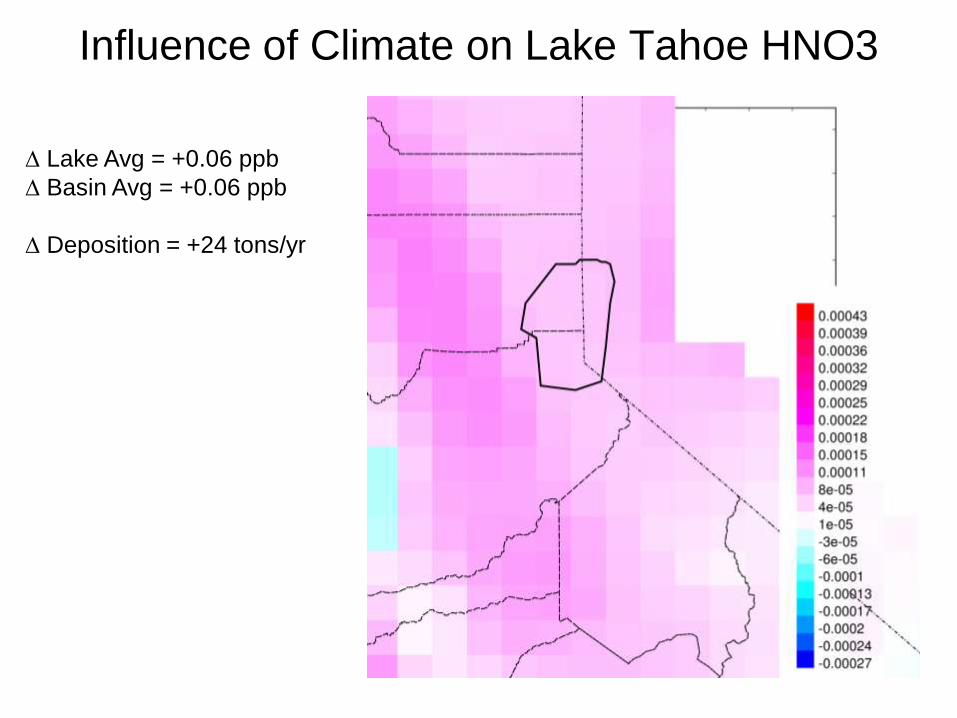
Influence of Climate on Lake Tahoe HNO3
Lake Avg = +0.06 ppb
Basin Avg = +0.06 ppb
Deposition = +24 tons/yr
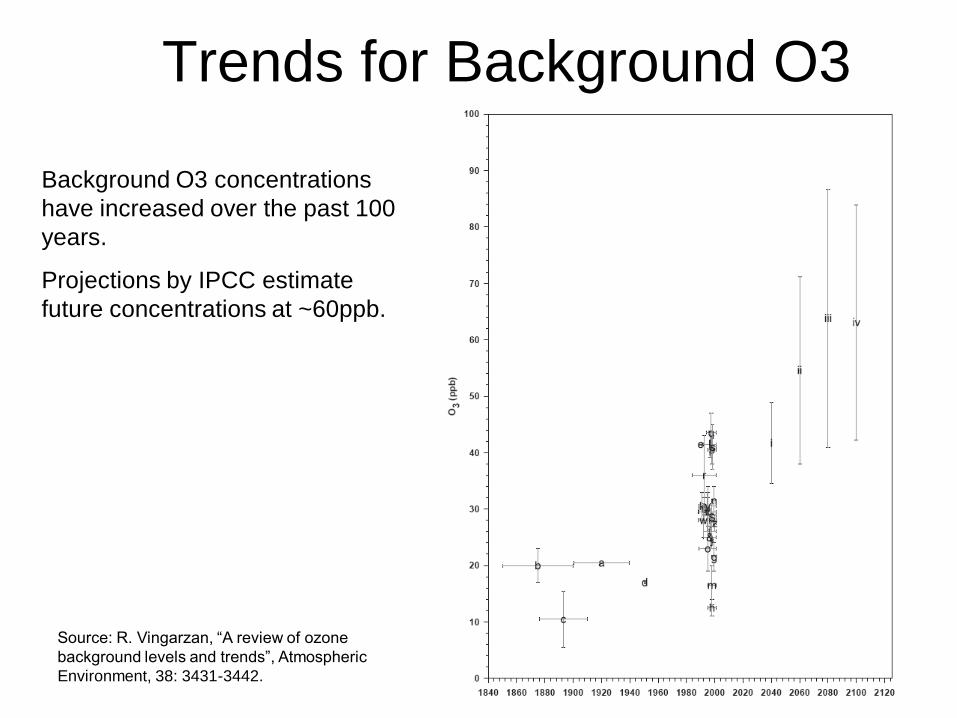
Trends for Background O3
Background O3 concentrations
have increased over the past 100
years.
Projections by IPCC estimate
future concentrations at ~60ppb.
Source: R. Vingarzan, “A review of ozone
background levels and trends”, Atmospheric
Environment, 38: 3431-3442.
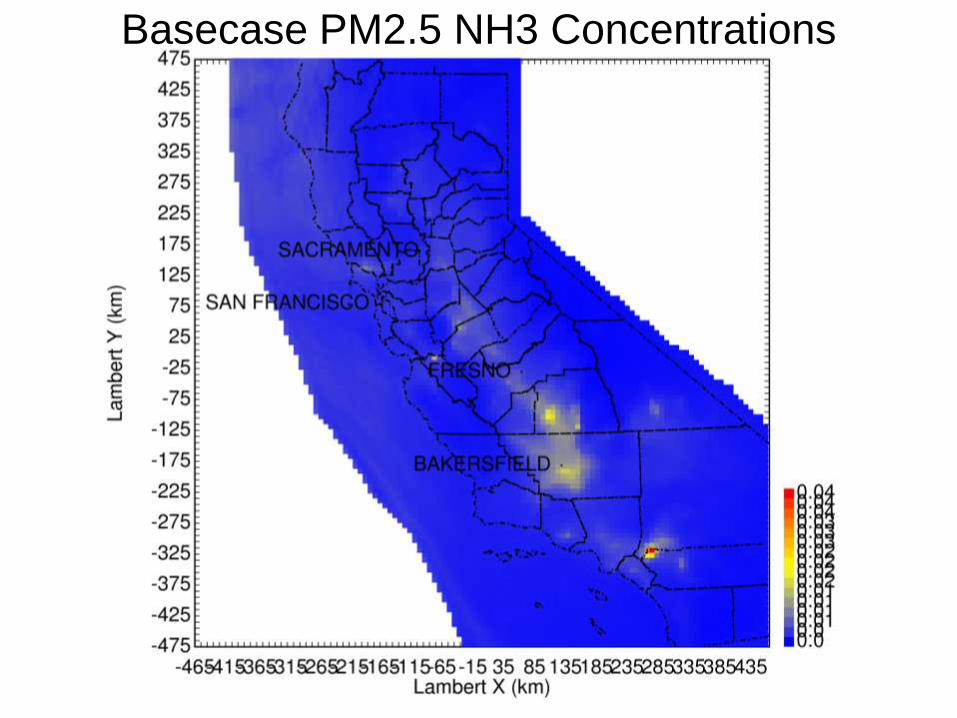
Basecase PM2.5 NH3 Concentrations
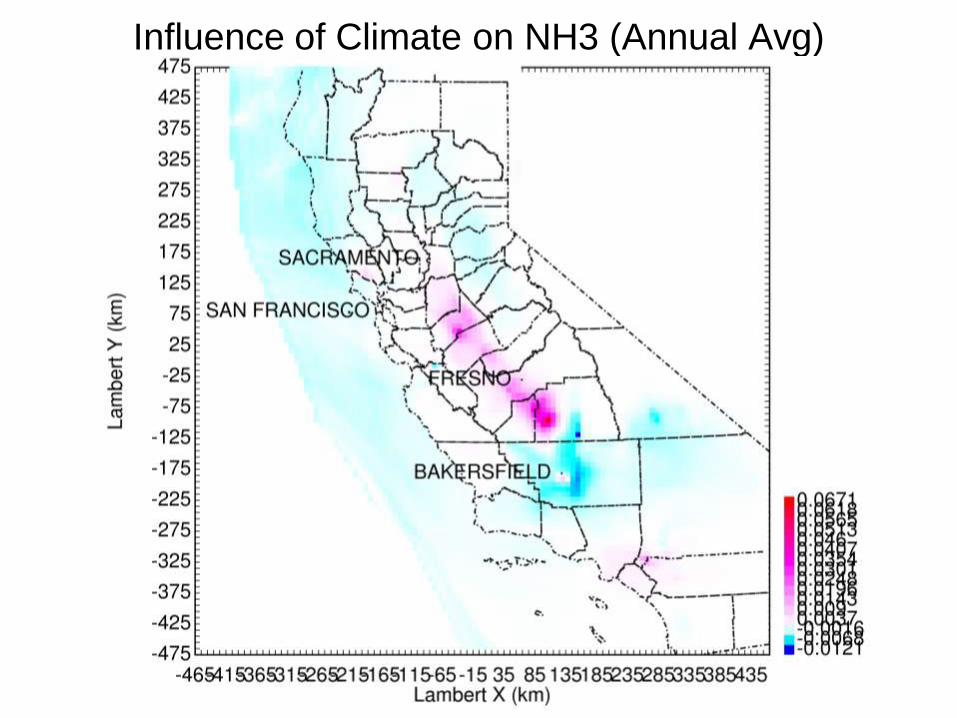
Influence of Climate on NH3 (Annual Avg)
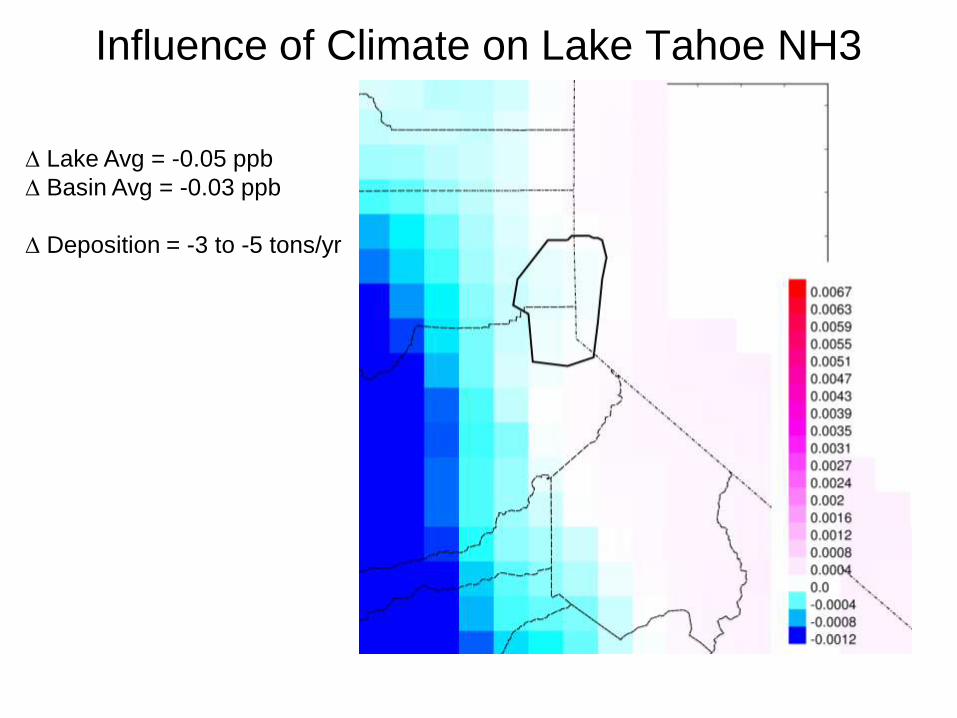
Influence of Climate on Lake Tahoe NH3
Lake Avg = -0.05 ppb
Basin Avg = -0.03 ppb
Deposition = -3 to -5 tons/yr
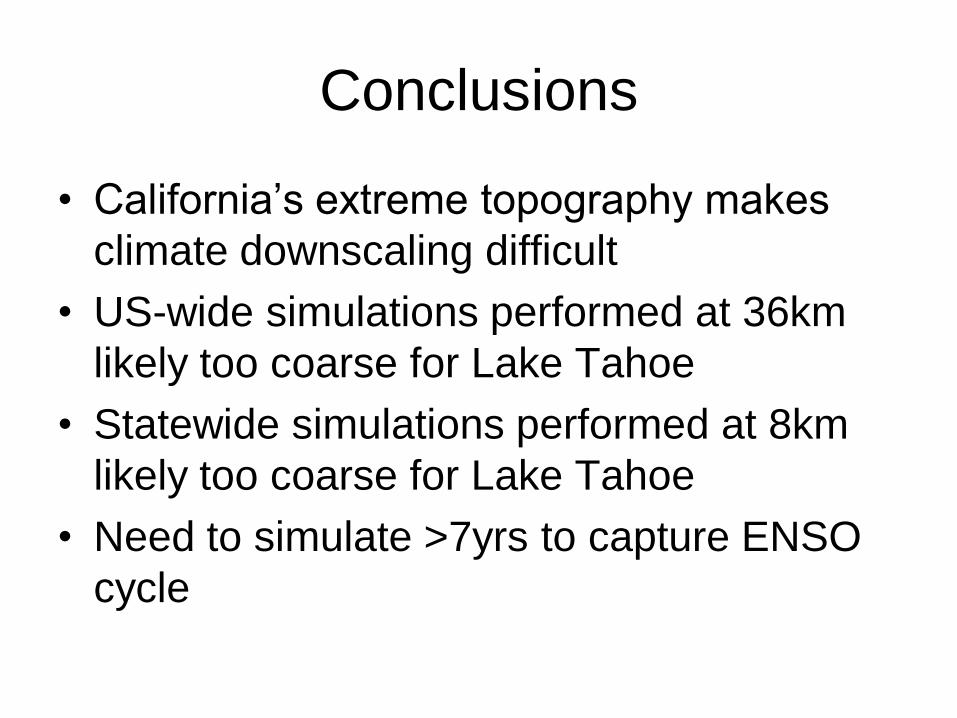
Conclusions
• California’s extreme topography makes
climate downscaling difficult
• US-wide simulations performed at 36km
likely too coarse for Lake Tahoe
• Statewide simulations performed at 8km
likely too coarse for Lake Tahoe
• Need to simulate >7yrs to capture ENSO
cycle
Acknowledgements
• California Air Resources Board (CARB)
Project # 04-349
• Nehzat Motallebi (CARB)
• EPA Science to Achieve Results Project #
RD-83184201

EXTRA SLIDES
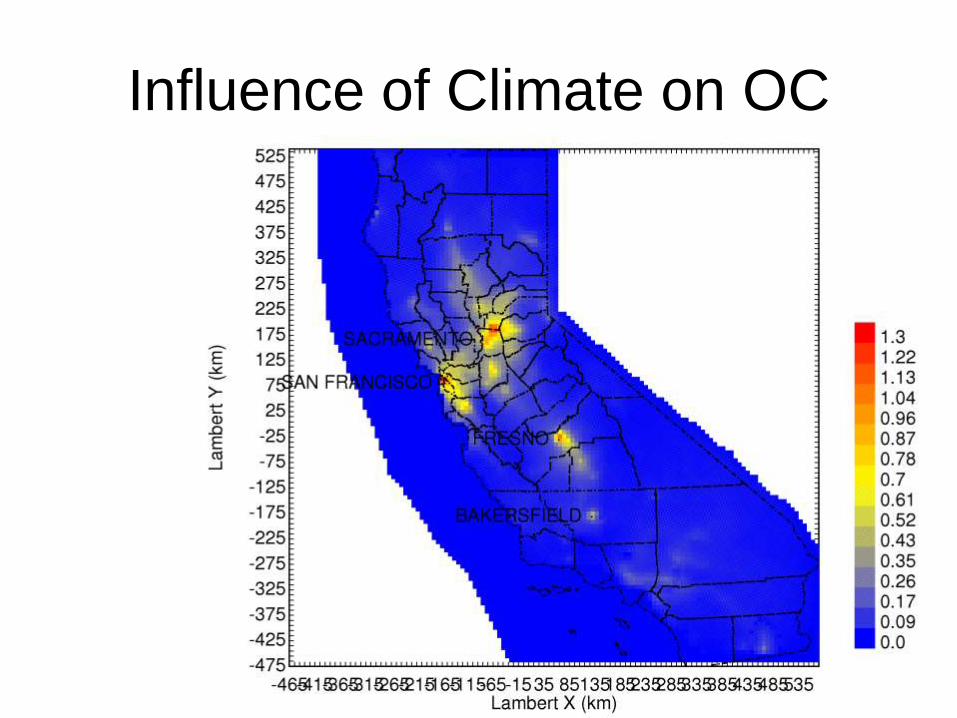
Influence of Climate on OC
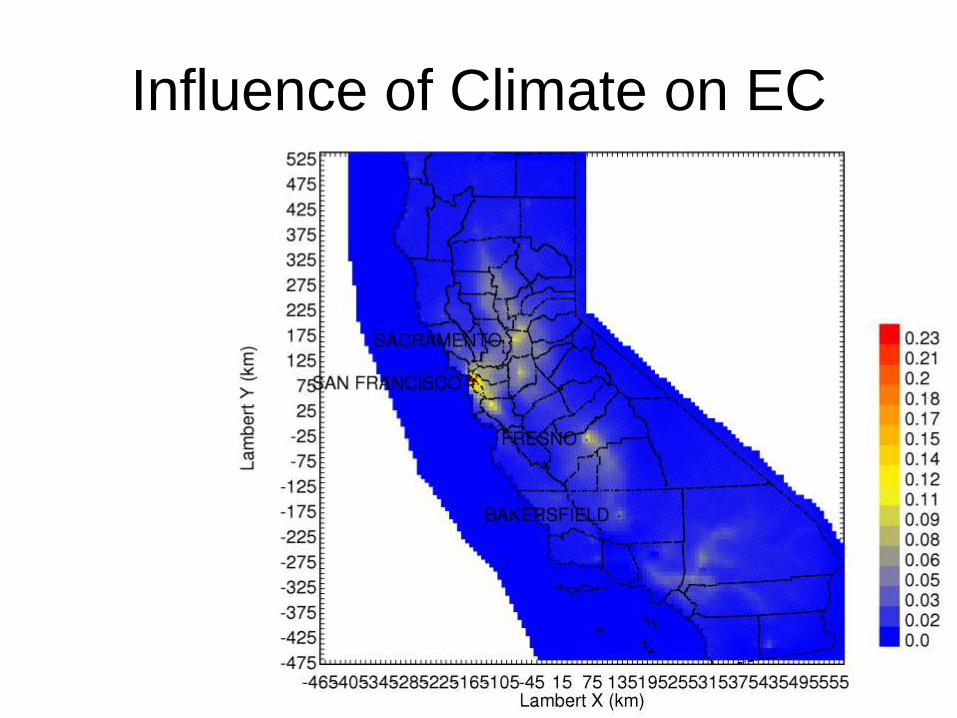
Influence of Climate on EC
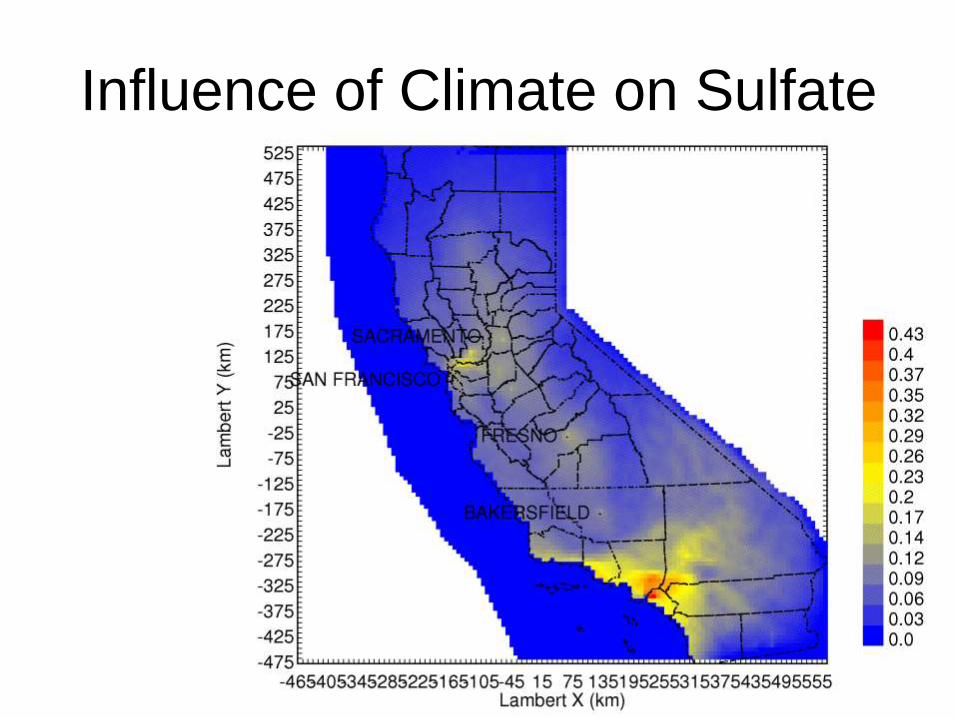
Influence of Climate on Sulfate
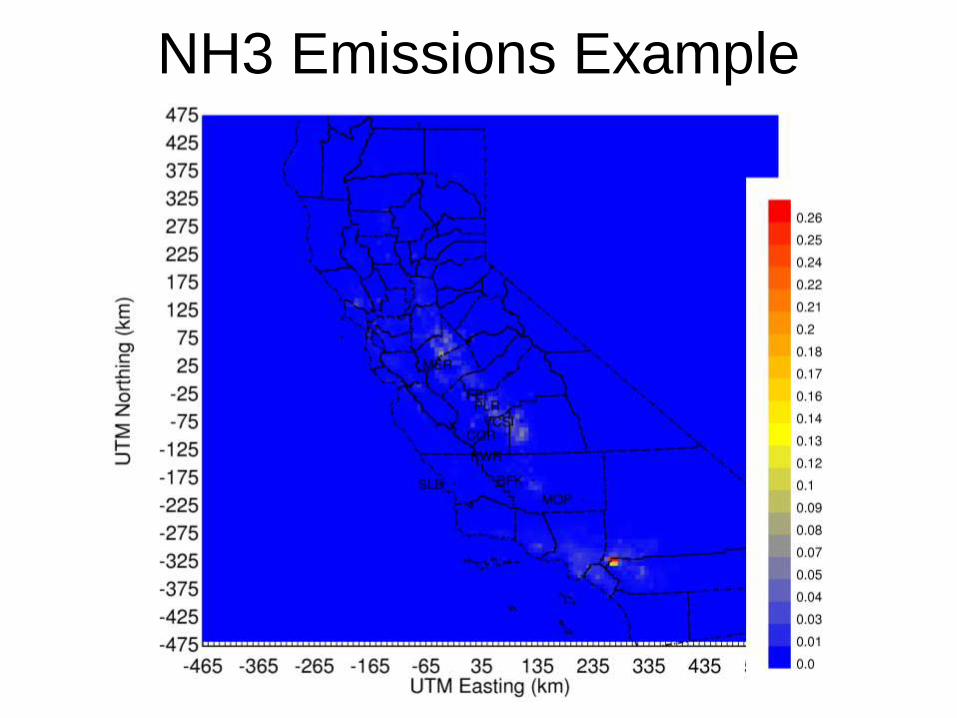
NH3 Emissions Example
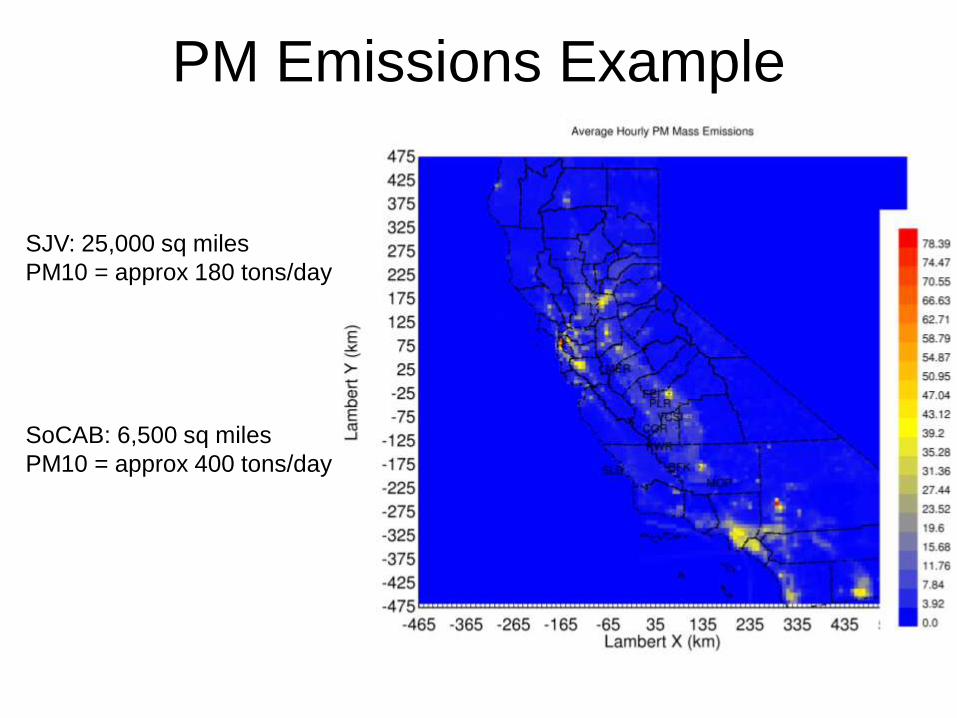
PM Emissions Example
SJV: 25,000 sq miles
PM10 = approx 180 tons/day
SoCAB: 6,500 sq miles
PM10 = approx 400 tons/day
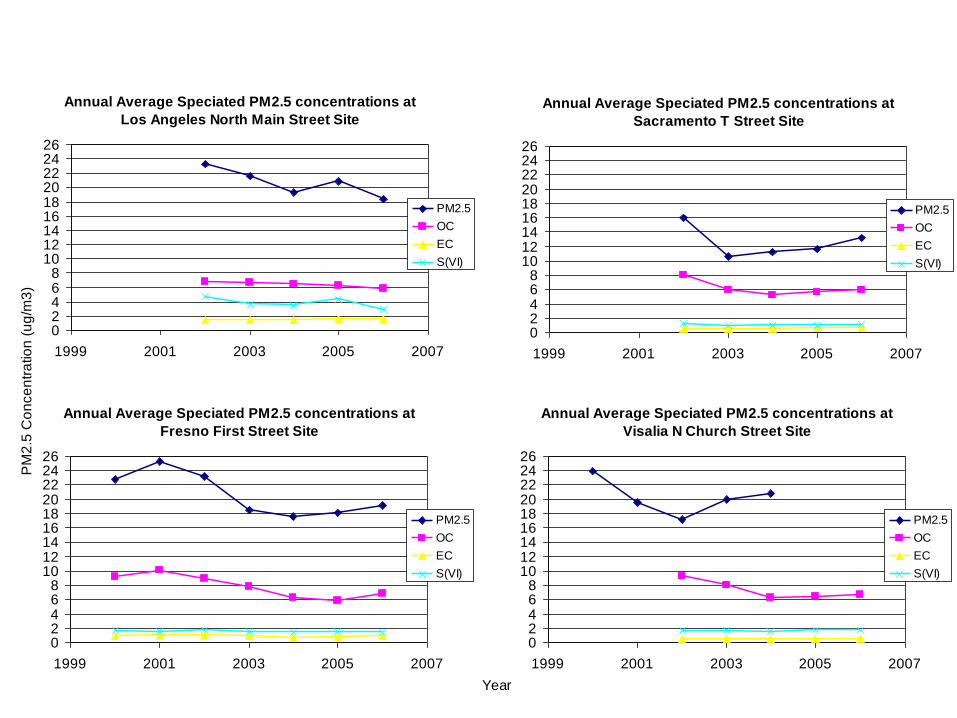
Annual Average Speciated PM2.5 concentrations at
Los Angeles North Main Street Site
02468
101214161820222426
1999 2001 2003 2005 2007
PM2.5
OC
EC
S(VI)
Annual Average Speciated PM2.5 concentrations at
Fresno First Street Site
02468
101214161820222426
1999 2001 2003 2005 2007
PM2.5
OC
EC
S(VI)
Annual Average Speciated PM2.5 concentrations at
Sacramento T Street Site
02468
101214161820222426
1999 2001 2003 2005 2007
PM2.5
OC
EC
S(VI)
Annual Average Speciated PM2.5 concentrations at
Visalia N Church Street Site
02468
101214161820222426
1999 2001 2003 2005 2007
PM2.5
OC
EC
S(VI)
PM
2.5
Co
nce
ntr
atio
n (
ug
/m3
)
Year
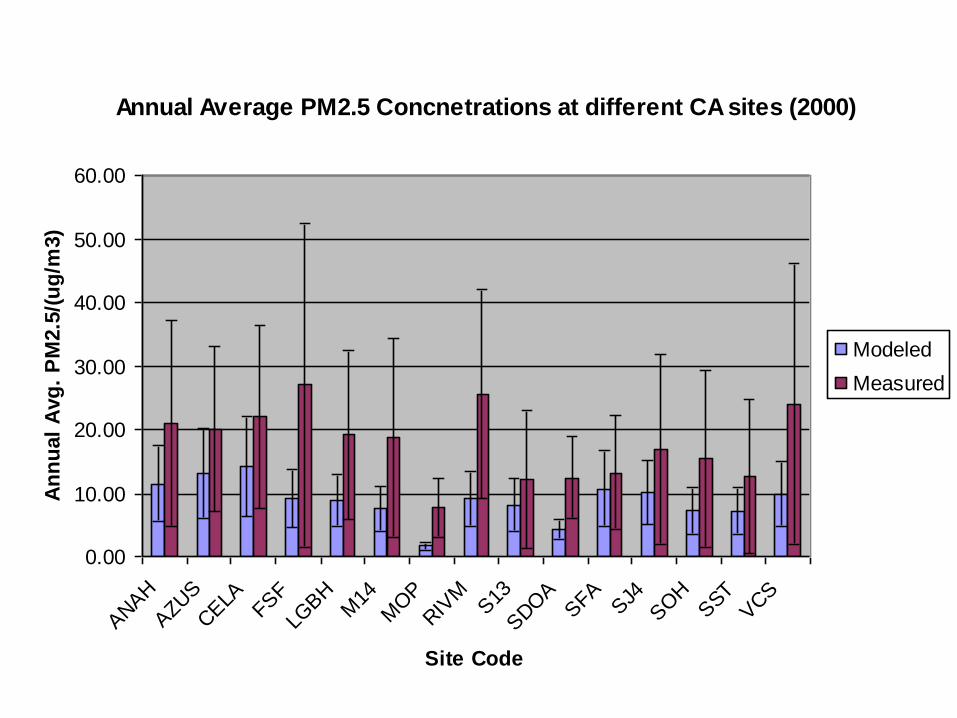
Annual Average PM2.5 Concnetrations at different CA sites (2000)
0.00
10.00
20.00
30.00
40.00
50.00
60.00
ANAH
AZU
S
CELA
FSF
LGBH
M14
MOP
RIV
MS13
SDOA
SFA
SJ4
SOH
SST
VCS
Site Code
An
nu
al
Avg
. P
M2.5
/(u
g/m
3)
Modeled
Measured